User login
Although the VHA primarily relies on teams for anesthesia care, unsupervised certified registered nurse anesthetists also are used to meet veterans’ surgical care needs.
Anesthesia care is provided by physician anesthesiologists, certified registered nurse anesthetists (CRNAs), anesthesiology residents, and anesthesiologist assistants. These providers may practice alone (anesthesiologists or CRNAs) or in various combinations of supervised roles and teams. Previous studies reveal mixed findings regarding whether patient outcomes differ by anesthesia practice models.1-7However, little is known about the prevalence of various anesthesia models in the US.
Background
In recent years, anesthesiology has undergone substantial expansion in its scope of services provided, the settings in which it is provided, and the diversity of its workforce.8As the field continues to evolve, especially within the context of value-based health care reform, it is imperative to evaluate how anesthesia care models are used in health systems and how these models may optimize care delivery.
The Veterans Health Administration (VHA) is the largest integrated health care system in the US, providing surgical care in 110 inpatient medical centers and 27 ambulatory surgery centers. Despite national integration, anesthesia practices vary widely among facilities. The question of which model of anesthesia care is associated with the best outcomes and offers the most value is widely debated.1,5,7,9 As an important first step in understanding anesthesia care delivery, a baseline assessment of the practice patterns of anesthesia providers is necessary and may benefit future studies of the impact of these care models on outcomes. Thus, the aim of this work was to understand and describe the previously unassessed landscape of anesthesia care delivery within the VHA.
Methods
As part of a larger evaluation of anesthesia care delivery in the VHA, an observational assessment of anesthesia provider practice patterns was conducted using retrospective surgical data. This project complies with VHA policy pertaining to nonresearch operational activities and did not require institutional review board approval and adheres to the EQUATOR Network guidelines described in Strengthening the Reporting of Observational Studies in Epidemiology (STROBE).10
Data were obtained from the VHA Managerial Cost Accounting National Data Extract for Surgery package for all surgical procedures (n = 726,706) between October 1, 2013 and March 31, 2015. There were 420 facilities represented in these surgical data. The VHA facility records were used to specifically identify inpatient and ambulatory surgery facilities for inclusion. Additionally, to ensure facilities were valid surgical sites with sufficient surgical volume, those with 100 or fewer cases during the period were excluded. In total, 288 facilities with 9,434 surgical cases (representing 1% of cases) were excluded. These excluded facilities included nursing homes (38%), domiciliaries (26%), outpatient clinics (11%), rehabilitation programs (9%), other nonsurgical facilities (8%), and medical centers (8%). The majority (80%) of excluded medical centers had 30 or fewer surgical cases.
In 6 instances, data from subfacilities were combined with their organizationally affiliated main facilities. The final sample included 125 facilities. The VHA assigns a complexity level designation to facilities, defined as follows: 1a (most complex), 1b, 1c, 2, and 3 (least complex).11 Facilities with 1a designation perform the most complex surgical cases, such as cardiovascular surgery or neurosurgery and have more staff and resource support, whereas levels 2 and 3 facilities perform fewer and less complex cases.
Surgical records were excluded when the primary Current Procedural Terminology (CPT) code was missing (n = 85,748, or 12% of cases). This resulted in 631,524 remaining cases. The surgical CPT codes were mapped to anesthesia CPT codes to obtain the associated base unit (BU) values via a published crosswalk by the American Society of Anesthesiologists (ASA).12 A higher number of associated BUs indicates a more complex procedure. For example, procedures such as biopsies, arthroscopies, and laparoscopies receive 3 to 4 BUs, whereas a venous thrombectomy of the leg and a transurethral resection of the prostate are both 5 BUs, a total knee arthroplasty is 7 BUs, a craniotomy is 10 BUs, and a coronary artery bypass receives 18 BUs. Surgical case complexity was defined as low (3 or 4 BUs), medium (5 BUs), and high (≥ 6 BUs). Although the VHA has an existing case complexity assignment process based on CPT codes, it defines complexity differently for inpatient facilities and ambulatory surgery centers. Thus, the BU-defined complexity permitted a standardized complexity categorization across all facilities. Categorization of BUs similar to this has previously been used in the literature as a proxy for case complexity.13,14
Patient-level information included the ASA physical status classification, a measure of overall health status determined by an anesthesia provider preoperatively.15 These classifications included ASA I (healthy), ASA II (mild systemic disease), ASA III (severe systemic disease), ASA IV (severe systemic disease that is a constant threat to life), and ASA V (moribund patient who is not expected to survive without surgery). The last classification, ASA VI: brain-dead with planned organ donation, was excluded. The “E” subcategory denoting “emergency” was subsumed within the corresponding ASA category (eg, ASA V-E was combined with ASA V).
Provider data identified the principal and supervising (if present) anesthetists involved in the case. The provision of anesthesia care was categorized into 3 models: Model 1—a physician anesthesiologist supervising a CRNA; Model 2—a physician anesthesiologist practicing independently or supervising an anesthesiology resident; and Model 3—a CRNA without supervision. Surgical cases were excluded when there was no anesthesia provider (n = 95,795, or 15% of remaining cases), or a nonanesthesia provider (n = 51,647, or 8% of remaining cases) on record. The final sample was 484,082 surgical cases conducted at 125 facilities.
Related: Improving Care and Reducing Length of Stay in Patients Undergoing Total Knee Replacement
Statistical Analysis
The percentage of surgical cases in each anesthesia care model was calculated overall and by the following characteristics: surgical case complexity, ASA classification, and facility complexity. The anesthesia model was determined for each case and summed at the facility level, yielding a total number of cases attributed to each model for each facility, thus identifying the predominant anesthesia model for each facility. The facilities were geographically displayed by their predominant anesthesia model and total number of surgical cases during the period. Because the aim was to present a descriptive representation of anesthesia care models, rather than infer significance, statistical testing was not included.
Results
A total of 484,082 surgical cases met inclusion criteria (Table). These cases were from 109 inpatient facilities and 16 ambulatory surgery facilities. 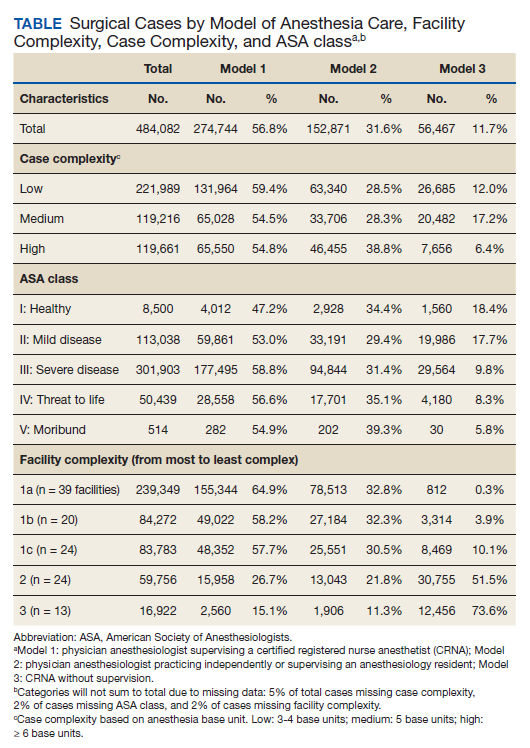
The percentage of cases in Model 1 was similar across the levels of surgical case complexity. However, a higher proportion of highly complex cases had a physician anesthesiologist (Model 2, 38.8%) than a CRNA (Model 3, 6.4%) as the primary anesthesia provider. Patients in each ASA classification were most likely to receive anesthesia care via Model 1. As ASA level increased, fewer patients had their anesthesia managed by a CRNA without supervision (Model 3: 18.4% of ASA 1 patients vs 8.3% of ASA 4 patients).
Facility complexity demonstrated notable differences in the proportions of surgical cases within each model. More than half of surgical cases in the largest, most complex facilities used Model 1 (64.9%, 58.2%, and 57.7% of cases in 1a, 1b, and 1c facilities, respectively). In comparison, Model 3 was found almost exclusively among surgical cases in smaller facilities with lower complexity (52% and 74% of cases in level 2 and 3 facilities, respectively).
The Figure displays the 125 facilities by their predominant model of anesthesia care. The diameter of the dots is relative to the facility’s total number of surgical cases. For each facility, the predominant model accounted for about half or more of cases but was not necessarily the only model of care used at a particular facility. 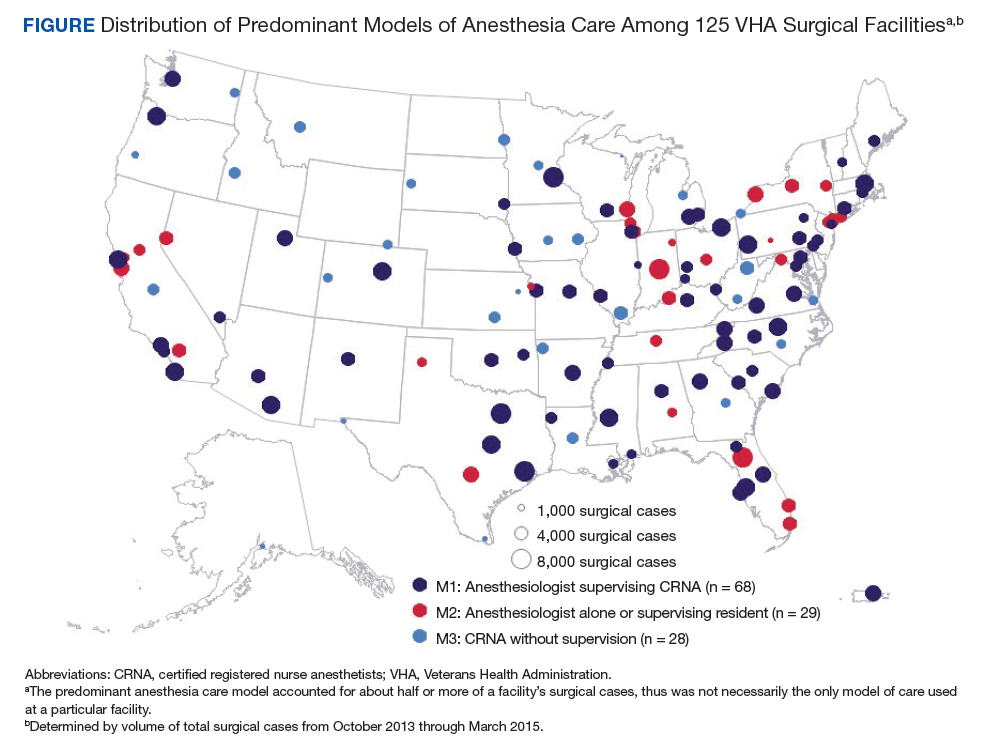
Related: Initiative to Minimize Pharmaceutical Risk in Older Veterans (IMPROVE) Polypharmacy Clinic
Discussion
Anesthesia care in more than half of surgical cases in VHA facilities was delivered by physician anesthesiologists supervising CRNAs. This model of anesthesia care was the dominant model in 54% of the facilities included in the sample. Consistent with a study of non-VHA facilities, this assessment found that the type of facility may influence the model of anesthesia care, with smaller, less complex facilities more often using a CRNA without supervision model.4 In these data, it was noted that among the 28 facilities that predominantly used Model 3, half had 12% or fewer cases that indicated a physician anesthesiologist model of care, and 6 had no cases with physician anesthesiologist involvement. These findings may reflect the limited scope of surgical services offered at lower complexity facilities and/or the reduced availability and/or utilization of physician anesthesiologists in these facilities.
Limitations
We recognize limitations in our assessment of anesthesia care. The documented presence or absence of a supervising anesthesia provider on the surgical record may not adequately characterize the model of anesthesia care in use at a facility, thus limiting an understanding of care delivery relationships among anesthesia providers. In addition, the patterns of anesthesia care delivery are likely influenced by factors not accounted for in this assessment, including the labor market share and economic forces.16,17 The veteran population tends to be older, male, and with substantial chronic disease burden, thus may have differing surgical needs and experiences than that of the general public.18,19 The surgical services offered in VHA facilities as well as the policies and practice environment surrounding anesthesia care also may vary from those found in nongovernmental facilities. However, as the largest health care system in the US, the VHA provides a diverse and robust surgical program. Many VHA facilities are large teaching hospitals with academic affiliations that would parallel some in the public sector. For example, studies have demonstrated similar surgical outcomes for patients in VHA vs non-VHA facilities.20 Therefore, the findings regarding anesthesia care models in VHA are likely relevant to non-VHA surgical sites.
Related: Improving Team-Based Care Coordination Delivery and Documentation in the Health Record
Conclusion
This preliminary assessment of the different models of anesthesia care demonstrates that although primarily relying on teams of anesthesiologists and CRNAs, the VA also uses unsupervised CRNAs to meet veterans’ surgical care needs. Although CRNA practice without supervision represented only 12% of surgical cases in our data, we identified 28 facilities (22%) that predominantly used CRNAs without supervision. Thus, CRNAs with and without supervision deliver a substantial portion of anesthesia care in the VA. The prevalence of CRNAs in documented VA surgical records and among surgical facilities nationwide highlights the importance of further examining their supervised and unsupervised roles in anesthesia care delivery.21 As the practice of anesthesiology continues to evolve, it is imperative that research efforts further investigate ways anesthesia care models may optimize care delivery, benefit anesthesia providers, and improve health outcomes for patients.
1. Dulisse B, Cromwell J. No harm found when nurse anesthetists work without supervision by physicians. Health Aff (Millwood). 2010;29(8):1469-1475
2. Simonson DC, Ahern MM, Hendryx MS. Anesthesia staffing and anesthetic complications during cesarean delivery: a retrospective analysis. Nurs Res. 2007;56(1):9-17.
3. Smith AF, Kane M, Milne R. Comparative effectiveness and safety of physician and nurse anaesthetists: a narrative systematic review. Br J Anaesth. 2004;93(4):540-545.
4. Needleman J, Minnick AF. Anesthesia provider model, hospital resources, and maternal outcomes. Health Serv Res. 2009;44(2, pt 1):464-482.
5. Lewis SR, Nicholson A, Smith AF, Alderson P. Physician anaesthetists versus non-physician providers of anaesthesia for surgical patients. Cochrane Database Syst Rev. 2014(7):CD010357.
6. Silber JH, Kennedy SK, Even-Shoshan O, et al. Anesthesiologist direction and patient outcomes. Anesthesiology. 2000;93(1):152-163.
7. Negrusa B, Hogan PF, Warner JT, Schroeder CH, Pang B. Scope of practice laws and anesthesia complications: no measurable impact of certified registered nurse anesthetist expanded scope of practice on anesthesia-related complications. Med Care. 2016;54(10):913-920.
8. Prielipp RC, Cohen NH. The future of anesthesiology: implications of the changing healthcare environment. Curr Opin Anaesthesiol. 2016;29(2):198-205.
9. Memtsoudis SG, Ma Y, Swamidoss CP, Edwards AM, Mazumdar M, Liguori GA. Factors influencing unexpected disposition after orthopedic ambulatory surgery. J Clin Anesth. 2012;24(2):89-95.
10. von Elm E, Altman DG, Egger M, Pocock SJ, Gøtzsche PC, Vandenbroucke JP. The Strengthening the Reporting of Observational Studies in Epidemiology (STROBE) statement: guidelines for reporting observational studies. J Clin Epid. 2008;61:344-349.
11. US Department of Veterans Affairs, Veterans Health Administration, Office of Productivity Efficiency & Staffing. Facility Complexity Levels. http://opes.vssc.med.va.gov/FacilityComplexityLevels/Pages/default.aspx. [Nonpublic document; source not verified.
13. Mathis MR, Sathishkumar S, Kheterpal S, et al. Complications, risk factors, and staffing patterns for noncardiac surgery in patients with left ventricular assist devices. Anesthesiology. 2017;126(3):450-460.
14. Chen Y, Gabriel RA, Kodali BS, Urman RD. Effect of anesthesia staffing ratio on first-case surgical start time. J Med Syst. 2016;40(5):115.
15. American Society of Anesthesiologists. Standards, guidelines and related resources. https://www.asahq.org/standards-and-guidelines/asa-physical-status-classification-system. Published October 15, 2014. Accessed November 5, 2018.
16. Kalist DE, Molinari NA, Spurr SJ. Cooperation and conflict between very similar occupations: the case of anesthesia. Health Econ Policy Law. 2011;6(2):237-264.
17. Daugherty L, Fonseca R, Kumar KB, Michaud PC. An analysis of the labor markets for anesthesiology. Rand Health Q. 2011;1(3):18.
18. Yu W, Ravelo A, Wagner TH, et al. Prevalence and costs of chronic conditions in the VA health care system. Med Care Res Rev. 2003;60(suppl 3):146S-167S.
19. Yoon J, Scott JY, Phibbs CS, Wagner TH. Recent trends in Veterans Affairs chronic condition spending. Popul Health Manag. 2011;14(6):293-298.
20. Shekelle PG, Asch S, Glassman P, Matula S, Trivedi A, Miake-Lye I. Comparison of Quality of Care in VA and Non-VA Settings: A Systematic Review. VA Evidence-based Synthesis Program. Washington, DC: Department of Veterans Affairs; 2010.
21. Baird M, Daugherty L, Kumar KB, Arifkhanova A. Regional and gender differences and trends in the anesthesiologist workforce. Anesthesiology. 2015;123(5):997-1012.
Although the VHA primarily relies on teams for anesthesia care, unsupervised certified registered nurse anesthetists also are used to meet veterans’ surgical care needs.
Although the VHA primarily relies on teams for anesthesia care, unsupervised certified registered nurse anesthetists also are used to meet veterans’ surgical care needs.
Anesthesia care is provided by physician anesthesiologists, certified registered nurse anesthetists (CRNAs), anesthesiology residents, and anesthesiologist assistants. These providers may practice alone (anesthesiologists or CRNAs) or in various combinations of supervised roles and teams. Previous studies reveal mixed findings regarding whether patient outcomes differ by anesthesia practice models.1-7However, little is known about the prevalence of various anesthesia models in the US.
Background
In recent years, anesthesiology has undergone substantial expansion in its scope of services provided, the settings in which it is provided, and the diversity of its workforce.8As the field continues to evolve, especially within the context of value-based health care reform, it is imperative to evaluate how anesthesia care models are used in health systems and how these models may optimize care delivery.
The Veterans Health Administration (VHA) is the largest integrated health care system in the US, providing surgical care in 110 inpatient medical centers and 27 ambulatory surgery centers. Despite national integration, anesthesia practices vary widely among facilities. The question of which model of anesthesia care is associated with the best outcomes and offers the most value is widely debated.1,5,7,9 As an important first step in understanding anesthesia care delivery, a baseline assessment of the practice patterns of anesthesia providers is necessary and may benefit future studies of the impact of these care models on outcomes. Thus, the aim of this work was to understand and describe the previously unassessed landscape of anesthesia care delivery within the VHA.
Methods
As part of a larger evaluation of anesthesia care delivery in the VHA, an observational assessment of anesthesia provider practice patterns was conducted using retrospective surgical data. This project complies with VHA policy pertaining to nonresearch operational activities and did not require institutional review board approval and adheres to the EQUATOR Network guidelines described in Strengthening the Reporting of Observational Studies in Epidemiology (STROBE).10
Data were obtained from the VHA Managerial Cost Accounting National Data Extract for Surgery package for all surgical procedures (n = 726,706) between October 1, 2013 and March 31, 2015. There were 420 facilities represented in these surgical data. The VHA facility records were used to specifically identify inpatient and ambulatory surgery facilities for inclusion. Additionally, to ensure facilities were valid surgical sites with sufficient surgical volume, those with 100 or fewer cases during the period were excluded. In total, 288 facilities with 9,434 surgical cases (representing 1% of cases) were excluded. These excluded facilities included nursing homes (38%), domiciliaries (26%), outpatient clinics (11%), rehabilitation programs (9%), other nonsurgical facilities (8%), and medical centers (8%). The majority (80%) of excluded medical centers had 30 or fewer surgical cases.
In 6 instances, data from subfacilities were combined with their organizationally affiliated main facilities. The final sample included 125 facilities. The VHA assigns a complexity level designation to facilities, defined as follows: 1a (most complex), 1b, 1c, 2, and 3 (least complex).11 Facilities with 1a designation perform the most complex surgical cases, such as cardiovascular surgery or neurosurgery and have more staff and resource support, whereas levels 2 and 3 facilities perform fewer and less complex cases.
Surgical records were excluded when the primary Current Procedural Terminology (CPT) code was missing (n = 85,748, or 12% of cases). This resulted in 631,524 remaining cases. The surgical CPT codes were mapped to anesthesia CPT codes to obtain the associated base unit (BU) values via a published crosswalk by the American Society of Anesthesiologists (ASA).12 A higher number of associated BUs indicates a more complex procedure. For example, procedures such as biopsies, arthroscopies, and laparoscopies receive 3 to 4 BUs, whereas a venous thrombectomy of the leg and a transurethral resection of the prostate are both 5 BUs, a total knee arthroplasty is 7 BUs, a craniotomy is 10 BUs, and a coronary artery bypass receives 18 BUs. Surgical case complexity was defined as low (3 or 4 BUs), medium (5 BUs), and high (≥ 6 BUs). Although the VHA has an existing case complexity assignment process based on CPT codes, it defines complexity differently for inpatient facilities and ambulatory surgery centers. Thus, the BU-defined complexity permitted a standardized complexity categorization across all facilities. Categorization of BUs similar to this has previously been used in the literature as a proxy for case complexity.13,14
Patient-level information included the ASA physical status classification, a measure of overall health status determined by an anesthesia provider preoperatively.15 These classifications included ASA I (healthy), ASA II (mild systemic disease), ASA III (severe systemic disease), ASA IV (severe systemic disease that is a constant threat to life), and ASA V (moribund patient who is not expected to survive without surgery). The last classification, ASA VI: brain-dead with planned organ donation, was excluded. The “E” subcategory denoting “emergency” was subsumed within the corresponding ASA category (eg, ASA V-E was combined with ASA V).
Provider data identified the principal and supervising (if present) anesthetists involved in the case. The provision of anesthesia care was categorized into 3 models: Model 1—a physician anesthesiologist supervising a CRNA; Model 2—a physician anesthesiologist practicing independently or supervising an anesthesiology resident; and Model 3—a CRNA without supervision. Surgical cases were excluded when there was no anesthesia provider (n = 95,795, or 15% of remaining cases), or a nonanesthesia provider (n = 51,647, or 8% of remaining cases) on record. The final sample was 484,082 surgical cases conducted at 125 facilities.
Related: Improving Care and Reducing Length of Stay in Patients Undergoing Total Knee Replacement
Statistical Analysis
The percentage of surgical cases in each anesthesia care model was calculated overall and by the following characteristics: surgical case complexity, ASA classification, and facility complexity. The anesthesia model was determined for each case and summed at the facility level, yielding a total number of cases attributed to each model for each facility, thus identifying the predominant anesthesia model for each facility. The facilities were geographically displayed by their predominant anesthesia model and total number of surgical cases during the period. Because the aim was to present a descriptive representation of anesthesia care models, rather than infer significance, statistical testing was not included.
Results
A total of 484,082 surgical cases met inclusion criteria (Table). These cases were from 109 inpatient facilities and 16 ambulatory surgery facilities.
The percentage of cases in Model 1 was similar across the levels of surgical case complexity. However, a higher proportion of highly complex cases had a physician anesthesiologist (Model 2, 38.8%) than a CRNA (Model 3, 6.4%) as the primary anesthesia provider. Patients in each ASA classification were most likely to receive anesthesia care via Model 1. As ASA level increased, fewer patients had their anesthesia managed by a CRNA without supervision (Model 3: 18.4% of ASA 1 patients vs 8.3% of ASA 4 patients).
Facility complexity demonstrated notable differences in the proportions of surgical cases within each model. More than half of surgical cases in the largest, most complex facilities used Model 1 (64.9%, 58.2%, and 57.7% of cases in 1a, 1b, and 1c facilities, respectively). In comparison, Model 3 was found almost exclusively among surgical cases in smaller facilities with lower complexity (52% and 74% of cases in level 2 and 3 facilities, respectively).
The Figure displays the 125 facilities by their predominant model of anesthesia care. The diameter of the dots is relative to the facility’s total number of surgical cases. For each facility, the predominant model accounted for about half or more of cases but was not necessarily the only model of care used at a particular facility.
Related: Initiative to Minimize Pharmaceutical Risk in Older Veterans (IMPROVE) Polypharmacy Clinic
Discussion
Anesthesia care in more than half of surgical cases in VHA facilities was delivered by physician anesthesiologists supervising CRNAs. This model of anesthesia care was the dominant model in 54% of the facilities included in the sample. Consistent with a study of non-VHA facilities, this assessment found that the type of facility may influence the model of anesthesia care, with smaller, less complex facilities more often using a CRNA without supervision model.4 In these data, it was noted that among the 28 facilities that predominantly used Model 3, half had 12% or fewer cases that indicated a physician anesthesiologist model of care, and 6 had no cases with physician anesthesiologist involvement. These findings may reflect the limited scope of surgical services offered at lower complexity facilities and/or the reduced availability and/or utilization of physician anesthesiologists in these facilities.
Limitations
We recognize limitations in our assessment of anesthesia care. The documented presence or absence of a supervising anesthesia provider on the surgical record may not adequately characterize the model of anesthesia care in use at a facility, thus limiting an understanding of care delivery relationships among anesthesia providers. In addition, the patterns of anesthesia care delivery are likely influenced by factors not accounted for in this assessment, including the labor market share and economic forces.16,17 The veteran population tends to be older, male, and with substantial chronic disease burden, thus may have differing surgical needs and experiences than that of the general public.18,19 The surgical services offered in VHA facilities as well as the policies and practice environment surrounding anesthesia care also may vary from those found in nongovernmental facilities. However, as the largest health care system in the US, the VHA provides a diverse and robust surgical program. Many VHA facilities are large teaching hospitals with academic affiliations that would parallel some in the public sector. For example, studies have demonstrated similar surgical outcomes for patients in VHA vs non-VHA facilities.20 Therefore, the findings regarding anesthesia care models in VHA are likely relevant to non-VHA surgical sites.
Related: Improving Team-Based Care Coordination Delivery and Documentation in the Health Record
Conclusion
This preliminary assessment of the different models of anesthesia care demonstrates that although primarily relying on teams of anesthesiologists and CRNAs, the VA also uses unsupervised CRNAs to meet veterans’ surgical care needs. Although CRNA practice without supervision represented only 12% of surgical cases in our data, we identified 28 facilities (22%) that predominantly used CRNAs without supervision. Thus, CRNAs with and without supervision deliver a substantial portion of anesthesia care in the VA. The prevalence of CRNAs in documented VA surgical records and among surgical facilities nationwide highlights the importance of further examining their supervised and unsupervised roles in anesthesia care delivery.21 As the practice of anesthesiology continues to evolve, it is imperative that research efforts further investigate ways anesthesia care models may optimize care delivery, benefit anesthesia providers, and improve health outcomes for patients.
1. Dulisse B, Cromwell J. No harm found when nurse anesthetists work without supervision by physicians. Health Aff (Millwood). 2010;29(8):1469-1475
2. Simonson DC, Ahern MM, Hendryx MS. Anesthesia staffing and anesthetic complications during cesarean delivery: a retrospective analysis. Nurs Res. 2007;56(1):9-17.
3. Smith AF, Kane M, Milne R. Comparative effectiveness and safety of physician and nurse anaesthetists: a narrative systematic review. Br J Anaesth. 2004;93(4):540-545.
4. Needleman J, Minnick AF. Anesthesia provider model, hospital resources, and maternal outcomes. Health Serv Res. 2009;44(2, pt 1):464-482.
5. Lewis SR, Nicholson A, Smith AF, Alderson P. Physician anaesthetists versus non-physician providers of anaesthesia for surgical patients. Cochrane Database Syst Rev. 2014(7):CD010357.
6. Silber JH, Kennedy SK, Even-Shoshan O, et al. Anesthesiologist direction and patient outcomes. Anesthesiology. 2000;93(1):152-163.
7. Negrusa B, Hogan PF, Warner JT, Schroeder CH, Pang B. Scope of practice laws and anesthesia complications: no measurable impact of certified registered nurse anesthetist expanded scope of practice on anesthesia-related complications. Med Care. 2016;54(10):913-920.
8. Prielipp RC, Cohen NH. The future of anesthesiology: implications of the changing healthcare environment. Curr Opin Anaesthesiol. 2016;29(2):198-205.
9. Memtsoudis SG, Ma Y, Swamidoss CP, Edwards AM, Mazumdar M, Liguori GA. Factors influencing unexpected disposition after orthopedic ambulatory surgery. J Clin Anesth. 2012;24(2):89-95.
10. von Elm E, Altman DG, Egger M, Pocock SJ, Gøtzsche PC, Vandenbroucke JP. The Strengthening the Reporting of Observational Studies in Epidemiology (STROBE) statement: guidelines for reporting observational studies. J Clin Epid. 2008;61:344-349.
11. US Department of Veterans Affairs, Veterans Health Administration, Office of Productivity Efficiency & Staffing. Facility Complexity Levels. http://opes.vssc.med.va.gov/FacilityComplexityLevels/Pages/default.aspx. [Nonpublic document; source not verified.
13. Mathis MR, Sathishkumar S, Kheterpal S, et al. Complications, risk factors, and staffing patterns for noncardiac surgery in patients with left ventricular assist devices. Anesthesiology. 2017;126(3):450-460.
14. Chen Y, Gabriel RA, Kodali BS, Urman RD. Effect of anesthesia staffing ratio on first-case surgical start time. J Med Syst. 2016;40(5):115.
15. American Society of Anesthesiologists. Standards, guidelines and related resources. https://www.asahq.org/standards-and-guidelines/asa-physical-status-classification-system. Published October 15, 2014. Accessed November 5, 2018.
16. Kalist DE, Molinari NA, Spurr SJ. Cooperation and conflict between very similar occupations: the case of anesthesia. Health Econ Policy Law. 2011;6(2):237-264.
17. Daugherty L, Fonseca R, Kumar KB, Michaud PC. An analysis of the labor markets for anesthesiology. Rand Health Q. 2011;1(3):18.
18. Yu W, Ravelo A, Wagner TH, et al. Prevalence and costs of chronic conditions in the VA health care system. Med Care Res Rev. 2003;60(suppl 3):146S-167S.
19. Yoon J, Scott JY, Phibbs CS, Wagner TH. Recent trends in Veterans Affairs chronic condition spending. Popul Health Manag. 2011;14(6):293-298.
20. Shekelle PG, Asch S, Glassman P, Matula S, Trivedi A, Miake-Lye I. Comparison of Quality of Care in VA and Non-VA Settings: A Systematic Review. VA Evidence-based Synthesis Program. Washington, DC: Department of Veterans Affairs; 2010.
21. Baird M, Daugherty L, Kumar KB, Arifkhanova A. Regional and gender differences and trends in the anesthesiologist workforce. Anesthesiology. 2015;123(5):997-1012.