User login
INTRODUCTION
Basic research skills are not acquired from medical school but from a mentor.1,2 A mentor with experience in study design and technical writing can make a real difference in your career. Most good mentors have more ideas for studies than they have time for research, so they are willing to share and guide your course. Your daily clinical experience provides a wealth of ideas in the form of “why do we do it this way” or “what is the evidence for” or “how can we improve outcomes or cut cost?” Of course, just about every study you read in a medical journal has suggestions for further research in the discussion section. Finally, keep in mind that the creation of study ideas and in particular, hypotheses, is a mysterious process, as this quote indicates: “It is not possible, deliberately, to create ideas or to control their creation. What we can do deliberately is to prepare our minds.” 3 Remember that chance favors the prepared mind.
DEVELOPING THE STUDY IDEA
Often, the most difficult task for someone new to research is developing a practical study idea. This section will explain a detailed process for creating a formal research protocol. We will focus on two common sticking points: (1) finding a good idea, and (2) developing a good idea into a problem statement.
Novice researchers with little experience, no mentors, and short time frames are encouraged not to take on a clinical human study as the principle investigator. Instead, device evaluations are a low-cost, time-efficient alternative. Human studies in the form of a survey are also possible and are often exempt from full Institutional Review Board (IRB) review. Many human-like conditions can be simulated, as was done, for example, in the study of patient-ventilator synchrony.4,5 And if you have the aptitude, whole studies can be based on mathematical models and predictions, particularly with the vast array of computer tools now available.6,7 And don’t forget studies based on surveys.8
A structured approach

A formal research protocol is required for any human research. However, it is also recommended for all but the simplest investigations. Most of the new researchers I have mentored take a rather lax approach to developing the protocol, and most IRBs are more interested in protecting human rights than validating the study design. As a result, much time is wasted and sometimes an entire study has to be abandoned due to poor planning. Figure 1 illustrates a structured approach that helps to ensure success. It shows a 3-step, iterative process.
The first step is a process of expanding the scope of the project, primarily through literature review. Along the way you learn (or invent) appropriate terminology and become familiar with the current state of the research art on a broad topic. For example, let’s suppose you were interested in the factors that affect the duration of mechanical ventilation. The literature review might include topics such as weaning and patient-ventilator synchrony as well as ventilator-associated pneumonia. During this process, you might discover that the topic of synchrony is currently generating a lot of interest in the literature and generating a lot of questions or confusion. You then focus on expanding your knowledge in this area.
In the second step, you might develop a theoretical framework for understanding patient-ventilator synchrony that could include a mathematical model and, perhaps, an idea to include simulation to study the problem.
In the third step, you need to narrow the scope of the study to a manageable level that includes identifying measurable outcome variables, creating testable hypotheses, considering experimental designs, and evaluating the overall feasibility of the study. At this point, you may discover that you cannot measure the specific outcome variables indicated by your theoretical framework. In that case, you need to create a new framework for supporting your research. Alternatively, you may find that it is not possible to conduct the study you envision given your resources. In that case, it is back to step 1.
Eventually, this process will result in a well-planned research protocol that is ready for review. Keep in mind that many times a protocol needs to be refined after some initial experiments are conducted. For human studies, any changes to the protocol must be approved by the IRB.
The problem statement rubric
The most common problem I have seen novices struggle with is creating a meaningful problem statement and hypothesis. This is crucial because the problem statement sets the stage for the methods, the methods yield the results, and the results are analyzed in light of the original problem statement and hypotheses. To get past any writer’s block, I recommend that you start by just describing what you see happening and why you think it is important. For example, you might say, “Patients with acute lung injury often seem to be fighting the ventilator.” This is important because patient-ventilator asynchrony may lead to increased sedation levels and prolonged intensive care unit stays. Now you can more easily envision a specific purpose and testable hypothesis. For example, you could state that the purpose of this study is to determine the baseline rates of different kinds of patient-ventilator synchrony problems. The hypothesis is that the rate of dyssynchrony is correlated with duration of mechanical ventilation.
Here is an actual example of how a problem statement evolved from a vague notion to a testable hypothesis.
Original: The purpose of this study is to determine whether measures of ineffective cough in patients with stroke recently liberated from mechanical ventilation correlate with risk of extubation failure and reintubation.
Final: The purpose of this study is to test the hypothesis that use of CoughAssist device in the immediate post-extubation period by stroke patients reduces the rate of extubation failure and pneumonia.
The original statement is a run-on sentence that is vague and hard to follow. Once the actual treatment and outcome measures are in focus, then a clear hypothesis statement can be made. Notice that the hypothesis should be clear enough that the reader can anticipate the actual experimental measures and procedures to be described in the methods section of the protocol.
Here is another example:
Original: The purpose of this study is to evaluate a device that allows continuous electronic cuff pressure control.
Final: The purpose of this study is to test the hypothesis that the Pressure Eyes electronic cuff monitor will maintain constant endotracheal tube cuff pressures better than manual cuff inflation during mechanical ventilation.
The problem with the original statement is that “to evaluate” is vague. The final statement makes the outcome variable explicit and suggests what the experimental procedure will be.
This is a final example:
Original: Following cardiac/respiratory arrest, many patients are profoundly acidotic. Ventilator settings based on initial arterial blood gases may result in inappropriate hyperventilation when follow-up is delayed. The purpose of this study is to establish the frequency of this occurrence at a large academic institution and the feasibility of a quality improvement project.
Final: The primary purpose of this study is to evaluate the frequency of hyperventilation occurring post-arrest during the first 24 hours. A secondary purpose is to determine if this hyperventilation is associated with an initial diagnosis of acidosis.
Note that the original statement follows the rubric of telling us what is observed and why it is important. However, the actual problem statement derived from the observation is vague: what is “this occurrence” and is the study really to establish any kind of feasibility? The purpose is simply to evaluate the frequency of hyperventilation and determine if the condition is associated with acidosis.
EXAMPLES OF RESEARCH PROJECTS BY FELLOWS
The following are examples of well-written statements of study purpose from actual studies conducted by our fellows.
Device evaluation
Defining “Flow Starvation” in volume control mechanical ventilation.
- The purpose of this study is to evaluate the relationship between the patient and ventilator inspiratory work of breathing to define the term “Flow Starvation.”
Auto-positive end expiratory pressure (auto-PEEP) during airway pressure release ventilation varies with the ventilator model.
- The purpose of this study was to compare auto-PEEP levels, peak expiratory flows, and flow decay profiles among 4 common intensive care ventilators.
Patient study
Diaphragmatic electrical activity and extubation outcomes in newborn infants: an observational study.
- The purpose of this study is to describe the electrical activity of the diaphragm before, during, and after extubation in a mixed-age cohort of preterm infants.
Comparison of predicted and measured carbon dioxide production for monitoring dead space fraction during mechanical ventilation.
- The purpose of this pilot study was to compare dead space with tidal volume ratios calculated from estimated and measured values for carbon dioxide production.
Practice evaluation
Incidence of asynchronies during invasive mechanical ventilation in a medical intensive care unit.
- The purpose of this study is to conduct a pilot investigation to determine the baseline incidence of various forms of patient-ventilator dyssynchrony during invasive mechanical ventilation.
Simulation training results in improved knowledge about intubation policies and procedures.
- The purpose of this study was to develop and test a simulation-based rapid-sequence intubation curriculum for fellows in pulmonary and critical care training.
HOW TO SEARCH THE LITERATURE
After creating a problem statement, the next step in planning research is to search the literature. The 10th issue of Respiratory Care journal in 2009 was devoted to research. Here are the articles in that issue related to the literature search:
- How to find the best evidence (search internet)9
- How to read a scientific research paper10
- How to read a case report (or teaching case of the month)11
- How to read a review paper.12
I recommend that you read these papers.
Literature search resources
My best advice is to befriend your local librarian.13 These people seldom get the recognition they deserve as experts at finding information and even as co-investigators.14 In addition to personal help, some libraries offer training sessions on various useful skills.
PubMed
The Internet resource I use most often is PubMed (www.ncbi.nlm.nih.gov/pubmed). It offers free access to MEDLINE, which is the National Library of Medicine’s database of citations and abstracts in the fields of medicine, nursing, dentistry, veterinary medicine, health care systems, and preclinical sciences. There are links to full-text articles and other resources. The website provides a clinical queries search filters page as well as a special queries page. Using a feature called “My NCBI,” you can have automatic e-mailing of search updates and save records and filters for search results. Access the PubMed Quick Start Guide for frequently asked questions and tutorials.
SearchMedica.com
The SearchMedica website (www.searchmedica.co.uk) is free and intended for medical professionals. It provides answers for clinical questions. Searches return articles, abstracts, and recommended medical websites.
Synthetic databases
There is a class of websites called synthetic databases, which are essentially prefiltered records for particular topics. However, these sites are usually subscription-based, and the cost is relatively high. You should check with your medical library to get access. Their advantage is that often they provide the best evidence without extensive searches of standard, bibliographic databases. Examples include the Cochrane Database of Systematic Reviews (www.cochrane.org/evidence), the National Guideline Clearinghouse (www.guideline.gov), and UpToDate (www.uptodate.com). UpToDate claims to be the largest clinical community in the world dedicated to synthesized knowledge for clinicians and patients. It features the work of more than 6,000 expert clinician authors/reviewers on more than 10,000 topics in 23 medical specialties. The site offers graded recommendations based on the best medical evidence.
Portals
Portals are web pages that act as a starting point for using the web or web-based services. One popular example is ClinicalKey (www.clinicalkey.com/info), formerly called MD Consult, which offers books, journals, patient education materials, and images. Another popular portal is Ovid (ovid.com), offering books, journals, evidence-based medicine databases, and CINAHL (Cumulative Index to Nursing and Allied Health Literature).
Electronic journals
Many medical journals now have online databases of current and archived issues. Such sites may require membership to access the databases, so again, check with your medical library. Popular examples in pulmonary and critical care medicine include the following:
- American Journal of Respiratory and Critical Care Medicine (www.atsjournals.org/journal/ajrccm)
- The New England Journal of Medicine (www.nejm.org)
- Chest (journal.publications.chestnet.org)
- Respiratory Care (rc.rcjournal.com)
Electronic books
Amazon.com is a great database search engine for books on specific topics. It even finds out-of-print books. And you don’t have to buy the books, because now you can rent them. Sometimes, I find what I wanted by using the “Look Inside” feature for some books. Note that you can look for books at PubMed. Just change the search box from PubMed to Books on the PubMed home page. Of course, Google also has a book search feature. A great (subscription) resource for medical and technical books is Safari (https://www.safaribooksonline.com). Once again, your library may have a subscription.
General Internet resources
You probably already know about Google Scholar (scholar.google.com) and Wikipedia.com. Because of its open source nature, you should use Wikipedia with caution. However, I have found it to be a very good first step in finding technical information, particularly about mathematics, physics, and statistics.
Using reference management software
One of the most important things you can do to make your research life easier is to use some sort of reference management software. As described in Wikipedia, “Reference management software, citation management software or personal bibliographic management software is software for scholars and authors to use for recording and using bibliographic citations (references). Once a citation has been recorded, it can be used time and again in generating bibliographies, such as lists of references in scholarly books, articles, and essays.” I was late in adopting this technology, but now I am a firm believer. Most Internet reference sources offer the ability to download citations to your reference management software. Downloading automatically places the citation into a searchable database on your computer with backup to the Internet. In addition, you can get the reference manager software to find a PDF version of the manuscript and store it with the citation on your computer (and/or in the Cloud) automatically.
But the most powerful feature of such software is its ability to add or subtract and rearrange the order of references in your manuscripts as you are writing, using seamless integration with Microsoft Word. The references can be automatically formatted using just about any journal’s style. This is a great time saver for resubmitting manuscripts to different journals. If you are still numbering references by hand (God forbid) or even using the Insert Endnote feature in Word (deficient when using multiple occurrences of the same reference), your life will be much easier if you take the time to start using reference management software.
The most popular commercial software is probably EndNote (endnote.com). A really good free software system with about the same functionality as Zotero (zotero.com). Search for “comparison of reference management software” in Wikipedia. You can find tutorials on software packages in YouTube.
STUDY DESIGN

When designing the experiment, note that there are many different approaches, each with their advantages and disadvantages. A full treatment of this topic is beyond the scope of this article. Suffice it to say that pre-experimental designs (Figure 2) are considered to generate weak evidence. But they are quick and easy and might be appropriate for pilot studies.

Quasi-experimental designs (Figure 3) generate a higher level of evidence. Such a design might be appropriate when you are stuck with collecting a convenience sample, rather than being able to use a full randomized assignment of study subjects.

The fully randomized design (Figure 4) generates the highest level of evidence. This is because if the sample size is large enough, the unknown and uncontrollable sources of bias are evenly distributed between the study groups.
BASIC MEASUREMENT METHODS
If your research involves physical measurements, you need to be familiar with the devices considered to be the gold standards. In cardiopulmonary research, most measurements involve pressure volume, flow, and gas concentration. You need to know which devices are appropriate for static vs dynamic measurements of these variables. In addition, you need to understand issues related to systematic and random measurement errors and how these errors are managed through calibration and calibration verification. I recommend these two textbooks:
Principles and Practice of Intensive Care Monitoring 1st Edition by Martin J. Tobin MD.
- This book is out of print, but if you can find a used copy or one in a library, it describes just about every kind of physiologic measurement used in clinical medicine.
Medical Instrumentation: Application and Design 4th Edition by John G. Webster.
- This book is readily available and reasonably priced. It is a more technical book describing medical instrumentation and measurement principles. It is a standard textbook for biometrical engineers.
STATISTICS FOR THE UNINTERESTED
I know what you are thinking: I hate statistics. Look at the book Essential Biostatistics: A Nonmathematical Approach.15 It is a short, inexpensive paperback book that is easy to read. The author does a great job of explaining why we use statistics rather than getting bogged down explaining how we calculate them. After all, novice researchers usually seek the help of a professional statistician to do the heavy lifting.
My book, Handbook for Health Care Research,16 covers most of the statistical procedures you will encounter in medical research and gives examples of how to use a popular tactical software package called SigmaPlot. By the way, I strongly suggest that you consult a statistician early in your study design phase to avoid the disappointment of finding out later that your results are uninterpretable. For an in-depth treatment of the subject, I recommend How to Report Statistics in Medicine.17
Statistical bare essentials

To do research or even just to understand published research reports, you must have at least a minimal skill set. The necessary skills include understanding some basic terminology, if only to be able to communicate with a statistician consultant. Important terms include levels of measurement (nominal, ordinal, continuous), accuracy, precision, measures of central tendency (mean, median, mode), measures of variability (variance, standard deviation, coefficient of variation), and percentile. The first step in analyzing your results is usually to represent it graphically. That means you should be able to use a spreadsheet to make simple graphs (Figure 5).

You should also know the basics of inferential statistics (ie, hypothesis testing). For example, you need to know the difference between parametric and non-parametric tests. You should be able to explain correlation and regression and know when to use Chi-squared vs a Fisher exact test. You should know that when comparing two mean values, you typically use the Student’s t test (and know when to use paired vs unpaired versions of the test). When comparing more than 2 mean values, you use analysis of variance methods (ANOVA). You can teach yourself these concepts from a book,16 but even an introductory college level course on statistics will be immensely helpful. Most statistics textbooks provide some sort of map to guide your selection of the appropriate statistical test (Figure 6), and there are good articles in medical journals.
You can learn a lot simply by reading the Methods section of research articles. Authors will often describe the statistical tests used and why they were used. But be aware that a certain percentage of papers get published with the wrong statistics.18
One of the underlying assumptions of most parametric statistical methods is that the data may be adequately described by a normal or Gaussian distribution. This assumption needs to be verified before selecting a statistical test. The common test for data normality is the Kolmogorov-Smirnov test. The following text from a methods section describes 2 very common procedures—the Student’s t test for comparing 2 mean values and the one-way ANOVA for comparing more than 2 mean values.19
“Normal distribution of data was verified using the Kolmogorov-Smirnov test. Body weights between groups were compared using one-way ANOVA for repeated measures to investigate temporal differences. At each time point, all data were analyzed using one-way ANOVA to compare PCV and VCV groups. Tukey’s post hoc analyses were performed when significant time effects were detected within groups, and Student’s t test was used to investigate differences between groups. Data were analyzed using commercial software and values were presented as mean ± SD. A P value < .05 was considered statistically significant.”
Estimating sample size and power analysis
One very important consideration in any study is the required number of study subjects for meaningful statistical conclusions. In other words, how big should the sample size be? Sample size is important because it affects the feasibility of the study and the reliability of the conclusions in terms of statistical power. The necessary sample size depends on 2 basic factors. One factor is the variability of the data (often expressed as the standard deviation). The other factor is the effect size, meaning, for example, how big of a difference between mean values you want to detect. In general, the bigger the variability and the smaller the difference, the bigger the sample size required.
As the above equation shows, the effect size is expressed, in general, as a mean difference divided by a standard deviation. In the first case, the numerator represents the difference between the sample mean and the assumed population mean. In the denominator, SD is the standard deviation of the sample (used to estimate the standard deviation of the population). In the second case, the numerator represents the difference between the mean values of 2 samples and the denominator is the pooled standard deviation of the 2 samples.
In order to understand the issues involved with selecting sample size, we need to first understand the types of errors that can be made in any type of decision. Suppose our research goal is to make a decision about whether a new treatment results in a clinical difference (improvement). The results of our statistical test are dichotomous—we decide either yes there is a significant difference or no there isn’t. The truth, which we may never know, is that in reality, the difference exists or it doesn’t.

As Figure 7 shows, the result of our decision making is that there are 2 ways to be right and 2 ways to be wrong. If we decide there is a difference (eg, our statistical tests yields P ≤ .05) but in realty there is not a difference, then we make what is called a type I error. On the other hand, if we conclude that there is not a difference (ie, our statistical test yields P > .05) but in reality there is a difference that we did not detect, then we have made a type II error.

The associated math is shown in Figure 8. The probability of making a type I error is called alpha. By convention in medicine, we set our rejection criterion to alpha = 0.05. In other words, we would reject the null hypothesis (that there is no difference) anytime our statistical test yields a P value less than alpha. The probability of making a type II error is called beta. For historical reasons, the probability of not making a type II error is called the statistical power of the test and is equal to 1 minus beta. Power is affected by sample size: the larger the sample the larger the power. Most researchers, by convention, keep the sample size large enough to keep power above 0.80.

Figure 9 is a nomogram that brings all these ideas together. The red line shows that for your study, given the desired effect size (0.8), if you collected samples from the 30 patients you planned on then the power would be unacceptable at 0.60, indicating a high probability of a false negative decision if the P value comes out greater than .50. The solution is to increase the sample size to about 50 (or more), as indicated by the blue line. From this nomogram we can generalize to say that when you want to detect a small effect with data that have high variability, you need a large sample size to provide acceptable power.
The text below is an example of a power analysis presented in the methods section of a published study.20 Note that the authors give their reasoning for the sample size they selected. This kind of explanation may inform your study design. But what if you don’t know the variability of the data you want to collect? In that case, you need to collect some pilot data and calculate from that an appropriate sample size for a subsequent study.
A prospective power calculation indicated that a sample size of 25 per group was required to achieve 80% power based on an effect size of probability of 0.24 that an observation in the PRVCa group is less than an observation in the ASV group using the Mann-Whitney tests, an alpha of 0.05 (two-tailed) and a 20% dropout.
JUDGING FEASIBILITY
Once you have a draft of your study design, including the estimated sample size, it is time to judge the overall feasibility of the study before committing to it.

Every study has associated costs. Those costs and the sources of funding must be identified. Don’t forget costs for consultants, particularly if you need statistical consultation.
Finally, consider your level of experience. If you are contemplating your first study, a human clinical trial might not be the best choice, given the complexity of such a project. Studies such as a meta-analysis or mathematical simulation require special training beyond basic research procedures, and should be avoided.
- Tobin MJ. Mentoring: seven roles and some specifics. Am J Respir Crit Care Med 2004; 170:114–117.
- Chatburn RL. Advancing beyond the average: the importance of mentoring in professional achievement. Respir Care 2004; 49:304–308.
- Beveridge WIB. The Art of Scientific Investigation. New York, NY: WW Norton & Company; 1950.
- Chatburn RL, Mireles-Cabodevila E, Sasidhar M. Tidal volume measurement error in pressure control modes of mechanical ventilation: a model study. Comput Biol Med 2016; 75:235–242.
- Mireles-Cabodevila E, Chatburn RL. Work of breathing in adaptive pressure control continuous mandatory ventilation. Respir Care 2009; 54:1467–1472.
- Chatburn RL, Ford RM. Procedure to normalize data for benchmarking. Respir Care 2006; 51:145–157.
- Bou-Khalil P, Zeineldine S, Chatburn R, et al. Prediction of inspired oxygen fraction for targeted arterial oxygen tension following open heart surgery in non-smoking and smoking patients. J Clin Monit Comput 2016. https://doi.org/10.1007/s10877-016-9941-6.
- Mireles-Cabodevila E, Diaz-Guzman E, Arroliga AC, Chatburn RL. Human versus computer controlled selection of ventilator settings: an evaluation of adaptive support ventilation and mid-frequency ventilation. Crit Care Res Pract 2012; 2012:204314.
- Chatburn RL. How to find the best evidence. Respir Care 2009; 54:1360–1365.
- Durbin CG Jr. How to read a scientific research paper. Respir Care 2009; 54:1366–1371.
- Pierson DJ. How to read a case report (or teaching case of the month). Respir Care 2009; 54:1372–1378.
- Callcut RA, Branson RD. How to read a review paper. Respir Care 2009; 54:1379–1385.
- Eresuma E, Lake E. How do I find the evidence? Find your librarian—stat! Orthop Nurs 2016; 35:421–423.
- Janke R, Rush KL. The academic librarian as co-investigator on an interprofessional primary research team: a case study. Health Info Libr J 2014; 31:116–122.
- Motulsky H. Essential Biostatistics: A Nonmathematical Approach. New York, NY: Oxford University Press; 2016.
- Chatburn RL. Handbook for Health Care Research. 2nd ed. Sudbury, MA: Jones and Bartlett Publishers; 2011.
- Lang TA, Secic M. How to Report Statistics in Medicine. 2nd ed. Philadelphia, PA: American College of Physicians; 2006.
- Prescott RJ, Civil I. Lies, damn lies and statistics: errors and omission in papers submitted to INJURY 2010–2012. Injury 2013; 44:6–11.
- Fantoni DT, Ida KK, Lopes TF, Otsuki DA, Auler JO Jr, Ambrosio AM. A comparison of the cardiopulmonary effects of pressure controlled ventilation and volume controlled ventilation in healthy anesthetized dogs. J Vet Emerg Crit Care (San Antonio) 2016; 26:524–530.
- Gruber PC, Gomersall CD, Leung P, et al. Randomized controlled trial comparing adaptive-support ventilation with pressure-regulated volume-controlled ventilation with automode in weaning patients after cardiac surgery. Anesthesiology 2008; 109:81–87.
INTRODUCTION
Basic research skills are not acquired from medical school but from a mentor.1,2 A mentor with experience in study design and technical writing can make a real difference in your career. Most good mentors have more ideas for studies than they have time for research, so they are willing to share and guide your course. Your daily clinical experience provides a wealth of ideas in the form of “why do we do it this way” or “what is the evidence for” or “how can we improve outcomes or cut cost?” Of course, just about every study you read in a medical journal has suggestions for further research in the discussion section. Finally, keep in mind that the creation of study ideas and in particular, hypotheses, is a mysterious process, as this quote indicates: “It is not possible, deliberately, to create ideas or to control their creation. What we can do deliberately is to prepare our minds.” 3 Remember that chance favors the prepared mind.
DEVELOPING THE STUDY IDEA
Often, the most difficult task for someone new to research is developing a practical study idea. This section will explain a detailed process for creating a formal research protocol. We will focus on two common sticking points: (1) finding a good idea, and (2) developing a good idea into a problem statement.
Novice researchers with little experience, no mentors, and short time frames are encouraged not to take on a clinical human study as the principle investigator. Instead, device evaluations are a low-cost, time-efficient alternative. Human studies in the form of a survey are also possible and are often exempt from full Institutional Review Board (IRB) review. Many human-like conditions can be simulated, as was done, for example, in the study of patient-ventilator synchrony.4,5 And if you have the aptitude, whole studies can be based on mathematical models and predictions, particularly with the vast array of computer tools now available.6,7 And don’t forget studies based on surveys.8
A structured approach
A formal research protocol is required for any human research. However, it is also recommended for all but the simplest investigations. Most of the new researchers I have mentored take a rather lax approach to developing the protocol, and most IRBs are more interested in protecting human rights than validating the study design. As a result, much time is wasted and sometimes an entire study has to be abandoned due to poor planning. Figure 1 illustrates a structured approach that helps to ensure success. It shows a 3-step, iterative process.
The first step is a process of expanding the scope of the project, primarily through literature review. Along the way you learn (or invent) appropriate terminology and become familiar with the current state of the research art on a broad topic. For example, let’s suppose you were interested in the factors that affect the duration of mechanical ventilation. The literature review might include topics such as weaning and patient-ventilator synchrony as well as ventilator-associated pneumonia. During this process, you might discover that the topic of synchrony is currently generating a lot of interest in the literature and generating a lot of questions or confusion. You then focus on expanding your knowledge in this area.
In the second step, you might develop a theoretical framework for understanding patient-ventilator synchrony that could include a mathematical model and, perhaps, an idea to include simulation to study the problem.
In the third step, you need to narrow the scope of the study to a manageable level that includes identifying measurable outcome variables, creating testable hypotheses, considering experimental designs, and evaluating the overall feasibility of the study. At this point, you may discover that you cannot measure the specific outcome variables indicated by your theoretical framework. In that case, you need to create a new framework for supporting your research. Alternatively, you may find that it is not possible to conduct the study you envision given your resources. In that case, it is back to step 1.
Eventually, this process will result in a well-planned research protocol that is ready for review. Keep in mind that many times a protocol needs to be refined after some initial experiments are conducted. For human studies, any changes to the protocol must be approved by the IRB.
The problem statement rubric
The most common problem I have seen novices struggle with is creating a meaningful problem statement and hypothesis. This is crucial because the problem statement sets the stage for the methods, the methods yield the results, and the results are analyzed in light of the original problem statement and hypotheses. To get past any writer’s block, I recommend that you start by just describing what you see happening and why you think it is important. For example, you might say, “Patients with acute lung injury often seem to be fighting the ventilator.” This is important because patient-ventilator asynchrony may lead to increased sedation levels and prolonged intensive care unit stays. Now you can more easily envision a specific purpose and testable hypothesis. For example, you could state that the purpose of this study is to determine the baseline rates of different kinds of patient-ventilator synchrony problems. The hypothesis is that the rate of dyssynchrony is correlated with duration of mechanical ventilation.
Here is an actual example of how a problem statement evolved from a vague notion to a testable hypothesis.
Original: The purpose of this study is to determine whether measures of ineffective cough in patients with stroke recently liberated from mechanical ventilation correlate with risk of extubation failure and reintubation.
Final: The purpose of this study is to test the hypothesis that use of CoughAssist device in the immediate post-extubation period by stroke patients reduces the rate of extubation failure and pneumonia.
The original statement is a run-on sentence that is vague and hard to follow. Once the actual treatment and outcome measures are in focus, then a clear hypothesis statement can be made. Notice that the hypothesis should be clear enough that the reader can anticipate the actual experimental measures and procedures to be described in the methods section of the protocol.
Here is another example:
Original: The purpose of this study is to evaluate a device that allows continuous electronic cuff pressure control.
Final: The purpose of this study is to test the hypothesis that the Pressure Eyes electronic cuff monitor will maintain constant endotracheal tube cuff pressures better than manual cuff inflation during mechanical ventilation.
The problem with the original statement is that “to evaluate” is vague. The final statement makes the outcome variable explicit and suggests what the experimental procedure will be.
This is a final example:
Original: Following cardiac/respiratory arrest, many patients are profoundly acidotic. Ventilator settings based on initial arterial blood gases may result in inappropriate hyperventilation when follow-up is delayed. The purpose of this study is to establish the frequency of this occurrence at a large academic institution and the feasibility of a quality improvement project.
Final: The primary purpose of this study is to evaluate the frequency of hyperventilation occurring post-arrest during the first 24 hours. A secondary purpose is to determine if this hyperventilation is associated with an initial diagnosis of acidosis.
Note that the original statement follows the rubric of telling us what is observed and why it is important. However, the actual problem statement derived from the observation is vague: what is “this occurrence” and is the study really to establish any kind of feasibility? The purpose is simply to evaluate the frequency of hyperventilation and determine if the condition is associated with acidosis.
EXAMPLES OF RESEARCH PROJECTS BY FELLOWS
The following are examples of well-written statements of study purpose from actual studies conducted by our fellows.
Device evaluation
Defining “Flow Starvation” in volume control mechanical ventilation.
- The purpose of this study is to evaluate the relationship between the patient and ventilator inspiratory work of breathing to define the term “Flow Starvation.”
Auto-positive end expiratory pressure (auto-PEEP) during airway pressure release ventilation varies with the ventilator model.
- The purpose of this study was to compare auto-PEEP levels, peak expiratory flows, and flow decay profiles among 4 common intensive care ventilators.
Patient study
Diaphragmatic electrical activity and extubation outcomes in newborn infants: an observational study.
- The purpose of this study is to describe the electrical activity of the diaphragm before, during, and after extubation in a mixed-age cohort of preterm infants.
Comparison of predicted and measured carbon dioxide production for monitoring dead space fraction during mechanical ventilation.
- The purpose of this pilot study was to compare dead space with tidal volume ratios calculated from estimated and measured values for carbon dioxide production.
Practice evaluation
Incidence of asynchronies during invasive mechanical ventilation in a medical intensive care unit.
- The purpose of this study is to conduct a pilot investigation to determine the baseline incidence of various forms of patient-ventilator dyssynchrony during invasive mechanical ventilation.
Simulation training results in improved knowledge about intubation policies and procedures.
- The purpose of this study was to develop and test a simulation-based rapid-sequence intubation curriculum for fellows in pulmonary and critical care training.
HOW TO SEARCH THE LITERATURE
After creating a problem statement, the next step in planning research is to search the literature. The 10th issue of Respiratory Care journal in 2009 was devoted to research. Here are the articles in that issue related to the literature search:
- How to find the best evidence (search internet)9
- How to read a scientific research paper10
- How to read a case report (or teaching case of the month)11
- How to read a review paper.12
I recommend that you read these papers.
Literature search resources
My best advice is to befriend your local librarian.13 These people seldom get the recognition they deserve as experts at finding information and even as co-investigators.14 In addition to personal help, some libraries offer training sessions on various useful skills.
PubMed
The Internet resource I use most often is PubMed (www.ncbi.nlm.nih.gov/pubmed). It offers free access to MEDLINE, which is the National Library of Medicine’s database of citations and abstracts in the fields of medicine, nursing, dentistry, veterinary medicine, health care systems, and preclinical sciences. There are links to full-text articles and other resources. The website provides a clinical queries search filters page as well as a special queries page. Using a feature called “My NCBI,” you can have automatic e-mailing of search updates and save records and filters for search results. Access the PubMed Quick Start Guide for frequently asked questions and tutorials.
SearchMedica.com
The SearchMedica website (www.searchmedica.co.uk) is free and intended for medical professionals. It provides answers for clinical questions. Searches return articles, abstracts, and recommended medical websites.
Synthetic databases
There is a class of websites called synthetic databases, which are essentially prefiltered records for particular topics. However, these sites are usually subscription-based, and the cost is relatively high. You should check with your medical library to get access. Their advantage is that often they provide the best evidence without extensive searches of standard, bibliographic databases. Examples include the Cochrane Database of Systematic Reviews (www.cochrane.org/evidence), the National Guideline Clearinghouse (www.guideline.gov), and UpToDate (www.uptodate.com). UpToDate claims to be the largest clinical community in the world dedicated to synthesized knowledge for clinicians and patients. It features the work of more than 6,000 expert clinician authors/reviewers on more than 10,000 topics in 23 medical specialties. The site offers graded recommendations based on the best medical evidence.
Portals
Portals are web pages that act as a starting point for using the web or web-based services. One popular example is ClinicalKey (www.clinicalkey.com/info), formerly called MD Consult, which offers books, journals, patient education materials, and images. Another popular portal is Ovid (ovid.com), offering books, journals, evidence-based medicine databases, and CINAHL (Cumulative Index to Nursing and Allied Health Literature).
Electronic journals
Many medical journals now have online databases of current and archived issues. Such sites may require membership to access the databases, so again, check with your medical library. Popular examples in pulmonary and critical care medicine include the following:
- American Journal of Respiratory and Critical Care Medicine (www.atsjournals.org/journal/ajrccm)
- The New England Journal of Medicine (www.nejm.org)
- Chest (journal.publications.chestnet.org)
- Respiratory Care (rc.rcjournal.com)
Electronic books
Amazon.com is a great database search engine for books on specific topics. It even finds out-of-print books. And you don’t have to buy the books, because now you can rent them. Sometimes, I find what I wanted by using the “Look Inside” feature for some books. Note that you can look for books at PubMed. Just change the search box from PubMed to Books on the PubMed home page. Of course, Google also has a book search feature. A great (subscription) resource for medical and technical books is Safari (https://www.safaribooksonline.com). Once again, your library may have a subscription.
General Internet resources
You probably already know about Google Scholar (scholar.google.com) and Wikipedia.com. Because of its open source nature, you should use Wikipedia with caution. However, I have found it to be a very good first step in finding technical information, particularly about mathematics, physics, and statistics.
Using reference management software
One of the most important things you can do to make your research life easier is to use some sort of reference management software. As described in Wikipedia, “Reference management software, citation management software or personal bibliographic management software is software for scholars and authors to use for recording and using bibliographic citations (references). Once a citation has been recorded, it can be used time and again in generating bibliographies, such as lists of references in scholarly books, articles, and essays.” I was late in adopting this technology, but now I am a firm believer. Most Internet reference sources offer the ability to download citations to your reference management software. Downloading automatically places the citation into a searchable database on your computer with backup to the Internet. In addition, you can get the reference manager software to find a PDF version of the manuscript and store it with the citation on your computer (and/or in the Cloud) automatically.
But the most powerful feature of such software is its ability to add or subtract and rearrange the order of references in your manuscripts as you are writing, using seamless integration with Microsoft Word. The references can be automatically formatted using just about any journal’s style. This is a great time saver for resubmitting manuscripts to different journals. If you are still numbering references by hand (God forbid) or even using the Insert Endnote feature in Word (deficient when using multiple occurrences of the same reference), your life will be much easier if you take the time to start using reference management software.
The most popular commercial software is probably EndNote (endnote.com). A really good free software system with about the same functionality as Zotero (zotero.com). Search for “comparison of reference management software” in Wikipedia. You can find tutorials on software packages in YouTube.
STUDY DESIGN
When designing the experiment, note that there are many different approaches, each with their advantages and disadvantages. A full treatment of this topic is beyond the scope of this article. Suffice it to say that pre-experimental designs (Figure 2) are considered to generate weak evidence. But they are quick and easy and might be appropriate for pilot studies.
Quasi-experimental designs (Figure 3) generate a higher level of evidence. Such a design might be appropriate when you are stuck with collecting a convenience sample, rather than being able to use a full randomized assignment of study subjects.
The fully randomized design (Figure 4) generates the highest level of evidence. This is because if the sample size is large enough, the unknown and uncontrollable sources of bias are evenly distributed between the study groups.
BASIC MEASUREMENT METHODS
If your research involves physical measurements, you need to be familiar with the devices considered to be the gold standards. In cardiopulmonary research, most measurements involve pressure volume, flow, and gas concentration. You need to know which devices are appropriate for static vs dynamic measurements of these variables. In addition, you need to understand issues related to systematic and random measurement errors and how these errors are managed through calibration and calibration verification. I recommend these two textbooks:
Principles and Practice of Intensive Care Monitoring 1st Edition by Martin J. Tobin MD.
- This book is out of print, but if you can find a used copy or one in a library, it describes just about every kind of physiologic measurement used in clinical medicine.
Medical Instrumentation: Application and Design 4th Edition by John G. Webster.
- This book is readily available and reasonably priced. It is a more technical book describing medical instrumentation and measurement principles. It is a standard textbook for biometrical engineers.
STATISTICS FOR THE UNINTERESTED
I know what you are thinking: I hate statistics. Look at the book Essential Biostatistics: A Nonmathematical Approach.15 It is a short, inexpensive paperback book that is easy to read. The author does a great job of explaining why we use statistics rather than getting bogged down explaining how we calculate them. After all, novice researchers usually seek the help of a professional statistician to do the heavy lifting.
My book, Handbook for Health Care Research,16 covers most of the statistical procedures you will encounter in medical research and gives examples of how to use a popular tactical software package called SigmaPlot. By the way, I strongly suggest that you consult a statistician early in your study design phase to avoid the disappointment of finding out later that your results are uninterpretable. For an in-depth treatment of the subject, I recommend How to Report Statistics in Medicine.17
Statistical bare essentials
To do research or even just to understand published research reports, you must have at least a minimal skill set. The necessary skills include understanding some basic terminology, if only to be able to communicate with a statistician consultant. Important terms include levels of measurement (nominal, ordinal, continuous), accuracy, precision, measures of central tendency (mean, median, mode), measures of variability (variance, standard deviation, coefficient of variation), and percentile. The first step in analyzing your results is usually to represent it graphically. That means you should be able to use a spreadsheet to make simple graphs (Figure 5).
You should also know the basics of inferential statistics (ie, hypothesis testing). For example, you need to know the difference between parametric and non-parametric tests. You should be able to explain correlation and regression and know when to use Chi-squared vs a Fisher exact test. You should know that when comparing two mean values, you typically use the Student’s t test (and know when to use paired vs unpaired versions of the test). When comparing more than 2 mean values, you use analysis of variance methods (ANOVA). You can teach yourself these concepts from a book,16 but even an introductory college level course on statistics will be immensely helpful. Most statistics textbooks provide some sort of map to guide your selection of the appropriate statistical test (Figure 6), and there are good articles in medical journals.
You can learn a lot simply by reading the Methods section of research articles. Authors will often describe the statistical tests used and why they were used. But be aware that a certain percentage of papers get published with the wrong statistics.18
One of the underlying assumptions of most parametric statistical methods is that the data may be adequately described by a normal or Gaussian distribution. This assumption needs to be verified before selecting a statistical test. The common test for data normality is the Kolmogorov-Smirnov test. The following text from a methods section describes 2 very common procedures—the Student’s t test for comparing 2 mean values and the one-way ANOVA for comparing more than 2 mean values.19
“Normal distribution of data was verified using the Kolmogorov-Smirnov test. Body weights between groups were compared using one-way ANOVA for repeated measures to investigate temporal differences. At each time point, all data were analyzed using one-way ANOVA to compare PCV and VCV groups. Tukey’s post hoc analyses were performed when significant time effects were detected within groups, and Student’s t test was used to investigate differences between groups. Data were analyzed using commercial software and values were presented as mean ± SD. A P value < .05 was considered statistically significant.”
Estimating sample size and power analysis
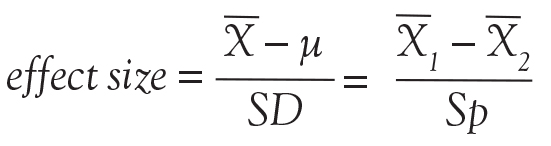
One very important consideration in any study is the required number of study subjects for meaningful statistical conclusions. In other words, how big should the sample size be? Sample size is important because it affects the feasibility of the study and the reliability of the conclusions in terms of statistical power. The necessary sample size depends on 2 basic factors. One factor is the variability of the data (often expressed as the standard deviation). The other factor is the effect size, meaning, for example, how big of a difference between mean values you want to detect. In general, the bigger the variability and the smaller the difference, the bigger the sample size required.
As the above equation shows, the effect size is expressed, in general, as a mean difference divided by a standard deviation. In the first case, the numerator represents the difference between the sample mean and the assumed population mean. In the denominator, SD is the standard deviation of the sample (used to estimate the standard deviation of the population). In the second case, the numerator represents the difference between the mean values of 2 samples and the denominator is the pooled standard deviation of the 2 samples.
In order to understand the issues involved with selecting sample size, we need to first understand the types of errors that can be made in any type of decision. Suppose our research goal is to make a decision about whether a new treatment results in a clinical difference (improvement). The results of our statistical test are dichotomous—we decide either yes there is a significant difference or no there isn’t. The truth, which we may never know, is that in reality, the difference exists or it doesn’t.
As Figure 7 shows, the result of our decision making is that there are 2 ways to be right and 2 ways to be wrong. If we decide there is a difference (eg, our statistical tests yields P ≤ .05) but in realty there is not a difference, then we make what is called a type I error. On the other hand, if we conclude that there is not a difference (ie, our statistical test yields P > .05) but in reality there is a difference that we did not detect, then we have made a type II error.
The associated math is shown in Figure 8. The probability of making a type I error is called alpha. By convention in medicine, we set our rejection criterion to alpha = 0.05. In other words, we would reject the null hypothesis (that there is no difference) anytime our statistical test yields a P value less than alpha. The probability of making a type II error is called beta. For historical reasons, the probability of not making a type II error is called the statistical power of the test and is equal to 1 minus beta. Power is affected by sample size: the larger the sample the larger the power. Most researchers, by convention, keep the sample size large enough to keep power above 0.80.
Figure 9 is a nomogram that brings all these ideas together. The red line shows that for your study, given the desired effect size (0.8), if you collected samples from the 30 patients you planned on then the power would be unacceptable at 0.60, indicating a high probability of a false negative decision if the P value comes out greater than .50. The solution is to increase the sample size to about 50 (or more), as indicated by the blue line. From this nomogram we can generalize to say that when you want to detect a small effect with data that have high variability, you need a large sample size to provide acceptable power.
The text below is an example of a power analysis presented in the methods section of a published study.20 Note that the authors give their reasoning for the sample size they selected. This kind of explanation may inform your study design. But what if you don’t know the variability of the data you want to collect? In that case, you need to collect some pilot data and calculate from that an appropriate sample size for a subsequent study.
A prospective power calculation indicated that a sample size of 25 per group was required to achieve 80% power based on an effect size of probability of 0.24 that an observation in the PRVCa group is less than an observation in the ASV group using the Mann-Whitney tests, an alpha of 0.05 (two-tailed) and a 20% dropout.
JUDGING FEASIBILITY
Once you have a draft of your study design, including the estimated sample size, it is time to judge the overall feasibility of the study before committing to it.
Every study has associated costs. Those costs and the sources of funding must be identified. Don’t forget costs for consultants, particularly if you need statistical consultation.
Finally, consider your level of experience. If you are contemplating your first study, a human clinical trial might not be the best choice, given the complexity of such a project. Studies such as a meta-analysis or mathematical simulation require special training beyond basic research procedures, and should be avoided.
INTRODUCTION
Basic research skills are not acquired from medical school but from a mentor.1,2 A mentor with experience in study design and technical writing can make a real difference in your career. Most good mentors have more ideas for studies than they have time for research, so they are willing to share and guide your course. Your daily clinical experience provides a wealth of ideas in the form of “why do we do it this way” or “what is the evidence for” or “how can we improve outcomes or cut cost?” Of course, just about every study you read in a medical journal has suggestions for further research in the discussion section. Finally, keep in mind that the creation of study ideas and in particular, hypotheses, is a mysterious process, as this quote indicates: “It is not possible, deliberately, to create ideas or to control their creation. What we can do deliberately is to prepare our minds.” 3 Remember that chance favors the prepared mind.
DEVELOPING THE STUDY IDEA
Often, the most difficult task for someone new to research is developing a practical study idea. This section will explain a detailed process for creating a formal research protocol. We will focus on two common sticking points: (1) finding a good idea, and (2) developing a good idea into a problem statement.
Novice researchers with little experience, no mentors, and short time frames are encouraged not to take on a clinical human study as the principle investigator. Instead, device evaluations are a low-cost, time-efficient alternative. Human studies in the form of a survey are also possible and are often exempt from full Institutional Review Board (IRB) review. Many human-like conditions can be simulated, as was done, for example, in the study of patient-ventilator synchrony.4,5 And if you have the aptitude, whole studies can be based on mathematical models and predictions, particularly with the vast array of computer tools now available.6,7 And don’t forget studies based on surveys.8
A structured approach
A formal research protocol is required for any human research. However, it is also recommended for all but the simplest investigations. Most of the new researchers I have mentored take a rather lax approach to developing the protocol, and most IRBs are more interested in protecting human rights than validating the study design. As a result, much time is wasted and sometimes an entire study has to be abandoned due to poor planning. Figure 1 illustrates a structured approach that helps to ensure success. It shows a 3-step, iterative process.
The first step is a process of expanding the scope of the project, primarily through literature review. Along the way you learn (or invent) appropriate terminology and become familiar with the current state of the research art on a broad topic. For example, let’s suppose you were interested in the factors that affect the duration of mechanical ventilation. The literature review might include topics such as weaning and patient-ventilator synchrony as well as ventilator-associated pneumonia. During this process, you might discover that the topic of synchrony is currently generating a lot of interest in the literature and generating a lot of questions or confusion. You then focus on expanding your knowledge in this area.
In the second step, you might develop a theoretical framework for understanding patient-ventilator synchrony that could include a mathematical model and, perhaps, an idea to include simulation to study the problem.
In the third step, you need to narrow the scope of the study to a manageable level that includes identifying measurable outcome variables, creating testable hypotheses, considering experimental designs, and evaluating the overall feasibility of the study. At this point, you may discover that you cannot measure the specific outcome variables indicated by your theoretical framework. In that case, you need to create a new framework for supporting your research. Alternatively, you may find that it is not possible to conduct the study you envision given your resources. In that case, it is back to step 1.
Eventually, this process will result in a well-planned research protocol that is ready for review. Keep in mind that many times a protocol needs to be refined after some initial experiments are conducted. For human studies, any changes to the protocol must be approved by the IRB.
The problem statement rubric
The most common problem I have seen novices struggle with is creating a meaningful problem statement and hypothesis. This is crucial because the problem statement sets the stage for the methods, the methods yield the results, and the results are analyzed in light of the original problem statement and hypotheses. To get past any writer’s block, I recommend that you start by just describing what you see happening and why you think it is important. For example, you might say, “Patients with acute lung injury often seem to be fighting the ventilator.” This is important because patient-ventilator asynchrony may lead to increased sedation levels and prolonged intensive care unit stays. Now you can more easily envision a specific purpose and testable hypothesis. For example, you could state that the purpose of this study is to determine the baseline rates of different kinds of patient-ventilator synchrony problems. The hypothesis is that the rate of dyssynchrony is correlated with duration of mechanical ventilation.
Here is an actual example of how a problem statement evolved from a vague notion to a testable hypothesis.
Original: The purpose of this study is to determine whether measures of ineffective cough in patients with stroke recently liberated from mechanical ventilation correlate with risk of extubation failure and reintubation.
Final: The purpose of this study is to test the hypothesis that use of CoughAssist device in the immediate post-extubation period by stroke patients reduces the rate of extubation failure and pneumonia.
The original statement is a run-on sentence that is vague and hard to follow. Once the actual treatment and outcome measures are in focus, then a clear hypothesis statement can be made. Notice that the hypothesis should be clear enough that the reader can anticipate the actual experimental measures and procedures to be described in the methods section of the protocol.
Here is another example:
Original: The purpose of this study is to evaluate a device that allows continuous electronic cuff pressure control.
Final: The purpose of this study is to test the hypothesis that the Pressure Eyes electronic cuff monitor will maintain constant endotracheal tube cuff pressures better than manual cuff inflation during mechanical ventilation.
The problem with the original statement is that “to evaluate” is vague. The final statement makes the outcome variable explicit and suggests what the experimental procedure will be.
This is a final example:
Original: Following cardiac/respiratory arrest, many patients are profoundly acidotic. Ventilator settings based on initial arterial blood gases may result in inappropriate hyperventilation when follow-up is delayed. The purpose of this study is to establish the frequency of this occurrence at a large academic institution and the feasibility of a quality improvement project.
Final: The primary purpose of this study is to evaluate the frequency of hyperventilation occurring post-arrest during the first 24 hours. A secondary purpose is to determine if this hyperventilation is associated with an initial diagnosis of acidosis.
Note that the original statement follows the rubric of telling us what is observed and why it is important. However, the actual problem statement derived from the observation is vague: what is “this occurrence” and is the study really to establish any kind of feasibility? The purpose is simply to evaluate the frequency of hyperventilation and determine if the condition is associated with acidosis.
EXAMPLES OF RESEARCH PROJECTS BY FELLOWS
The following are examples of well-written statements of study purpose from actual studies conducted by our fellows.
Device evaluation
Defining “Flow Starvation” in volume control mechanical ventilation.
- The purpose of this study is to evaluate the relationship between the patient and ventilator inspiratory work of breathing to define the term “Flow Starvation.”
Auto-positive end expiratory pressure (auto-PEEP) during airway pressure release ventilation varies with the ventilator model.
- The purpose of this study was to compare auto-PEEP levels, peak expiratory flows, and flow decay profiles among 4 common intensive care ventilators.
Patient study
Diaphragmatic electrical activity and extubation outcomes in newborn infants: an observational study.
- The purpose of this study is to describe the electrical activity of the diaphragm before, during, and after extubation in a mixed-age cohort of preterm infants.
Comparison of predicted and measured carbon dioxide production for monitoring dead space fraction during mechanical ventilation.
- The purpose of this pilot study was to compare dead space with tidal volume ratios calculated from estimated and measured values for carbon dioxide production.
Practice evaluation
Incidence of asynchronies during invasive mechanical ventilation in a medical intensive care unit.
- The purpose of this study is to conduct a pilot investigation to determine the baseline incidence of various forms of patient-ventilator dyssynchrony during invasive mechanical ventilation.
Simulation training results in improved knowledge about intubation policies and procedures.
- The purpose of this study was to develop and test a simulation-based rapid-sequence intubation curriculum for fellows in pulmonary and critical care training.
HOW TO SEARCH THE LITERATURE
After creating a problem statement, the next step in planning research is to search the literature. The 10th issue of Respiratory Care journal in 2009 was devoted to research. Here are the articles in that issue related to the literature search:
- How to find the best evidence (search internet)9
- How to read a scientific research paper10
- How to read a case report (or teaching case of the month)11
- How to read a review paper.12
I recommend that you read these papers.
Literature search resources
My best advice is to befriend your local librarian.13 These people seldom get the recognition they deserve as experts at finding information and even as co-investigators.14 In addition to personal help, some libraries offer training sessions on various useful skills.
PubMed
The Internet resource I use most often is PubMed (www.ncbi.nlm.nih.gov/pubmed). It offers free access to MEDLINE, which is the National Library of Medicine’s database of citations and abstracts in the fields of medicine, nursing, dentistry, veterinary medicine, health care systems, and preclinical sciences. There are links to full-text articles and other resources. The website provides a clinical queries search filters page as well as a special queries page. Using a feature called “My NCBI,” you can have automatic e-mailing of search updates and save records and filters for search results. Access the PubMed Quick Start Guide for frequently asked questions and tutorials.
SearchMedica.com
The SearchMedica website (www.searchmedica.co.uk) is free and intended for medical professionals. It provides answers for clinical questions. Searches return articles, abstracts, and recommended medical websites.
Synthetic databases
There is a class of websites called synthetic databases, which are essentially prefiltered records for particular topics. However, these sites are usually subscription-based, and the cost is relatively high. You should check with your medical library to get access. Their advantage is that often they provide the best evidence without extensive searches of standard, bibliographic databases. Examples include the Cochrane Database of Systematic Reviews (www.cochrane.org/evidence), the National Guideline Clearinghouse (www.guideline.gov), and UpToDate (www.uptodate.com). UpToDate claims to be the largest clinical community in the world dedicated to synthesized knowledge for clinicians and patients. It features the work of more than 6,000 expert clinician authors/reviewers on more than 10,000 topics in 23 medical specialties. The site offers graded recommendations based on the best medical evidence.
Portals
Portals are web pages that act as a starting point for using the web or web-based services. One popular example is ClinicalKey (www.clinicalkey.com/info), formerly called MD Consult, which offers books, journals, patient education materials, and images. Another popular portal is Ovid (ovid.com), offering books, journals, evidence-based medicine databases, and CINAHL (Cumulative Index to Nursing and Allied Health Literature).
Electronic journals
Many medical journals now have online databases of current and archived issues. Such sites may require membership to access the databases, so again, check with your medical library. Popular examples in pulmonary and critical care medicine include the following:
- American Journal of Respiratory and Critical Care Medicine (www.atsjournals.org/journal/ajrccm)
- The New England Journal of Medicine (www.nejm.org)
- Chest (journal.publications.chestnet.org)
- Respiratory Care (rc.rcjournal.com)
Electronic books
Amazon.com is a great database search engine for books on specific topics. It even finds out-of-print books. And you don’t have to buy the books, because now you can rent them. Sometimes, I find what I wanted by using the “Look Inside” feature for some books. Note that you can look for books at PubMed. Just change the search box from PubMed to Books on the PubMed home page. Of course, Google also has a book search feature. A great (subscription) resource for medical and technical books is Safari (https://www.safaribooksonline.com). Once again, your library may have a subscription.
General Internet resources
You probably already know about Google Scholar (scholar.google.com) and Wikipedia.com. Because of its open source nature, you should use Wikipedia with caution. However, I have found it to be a very good first step in finding technical information, particularly about mathematics, physics, and statistics.
Using reference management software
One of the most important things you can do to make your research life easier is to use some sort of reference management software. As described in Wikipedia, “Reference management software, citation management software or personal bibliographic management software is software for scholars and authors to use for recording and using bibliographic citations (references). Once a citation has been recorded, it can be used time and again in generating bibliographies, such as lists of references in scholarly books, articles, and essays.” I was late in adopting this technology, but now I am a firm believer. Most Internet reference sources offer the ability to download citations to your reference management software. Downloading automatically places the citation into a searchable database on your computer with backup to the Internet. In addition, you can get the reference manager software to find a PDF version of the manuscript and store it with the citation on your computer (and/or in the Cloud) automatically.
But the most powerful feature of such software is its ability to add or subtract and rearrange the order of references in your manuscripts as you are writing, using seamless integration with Microsoft Word. The references can be automatically formatted using just about any journal’s style. This is a great time saver for resubmitting manuscripts to different journals. If you are still numbering references by hand (God forbid) or even using the Insert Endnote feature in Word (deficient when using multiple occurrences of the same reference), your life will be much easier if you take the time to start using reference management software.
The most popular commercial software is probably EndNote (endnote.com). A really good free software system with about the same functionality as Zotero (zotero.com). Search for “comparison of reference management software” in Wikipedia. You can find tutorials on software packages in YouTube.
STUDY DESIGN
When designing the experiment, note that there are many different approaches, each with their advantages and disadvantages. A full treatment of this topic is beyond the scope of this article. Suffice it to say that pre-experimental designs (Figure 2) are considered to generate weak evidence. But they are quick and easy and might be appropriate for pilot studies.
Quasi-experimental designs (Figure 3) generate a higher level of evidence. Such a design might be appropriate when you are stuck with collecting a convenience sample, rather than being able to use a full randomized assignment of study subjects.
The fully randomized design (Figure 4) generates the highest level of evidence. This is because if the sample size is large enough, the unknown and uncontrollable sources of bias are evenly distributed between the study groups.
BASIC MEASUREMENT METHODS
If your research involves physical measurements, you need to be familiar with the devices considered to be the gold standards. In cardiopulmonary research, most measurements involve pressure volume, flow, and gas concentration. You need to know which devices are appropriate for static vs dynamic measurements of these variables. In addition, you need to understand issues related to systematic and random measurement errors and how these errors are managed through calibration and calibration verification. I recommend these two textbooks:
Principles and Practice of Intensive Care Monitoring 1st Edition by Martin J. Tobin MD.
- This book is out of print, but if you can find a used copy or one in a library, it describes just about every kind of physiologic measurement used in clinical medicine.
Medical Instrumentation: Application and Design 4th Edition by John G. Webster.
- This book is readily available and reasonably priced. It is a more technical book describing medical instrumentation and measurement principles. It is a standard textbook for biometrical engineers.
STATISTICS FOR THE UNINTERESTED
I know what you are thinking: I hate statistics. Look at the book Essential Biostatistics: A Nonmathematical Approach.15 It is a short, inexpensive paperback book that is easy to read. The author does a great job of explaining why we use statistics rather than getting bogged down explaining how we calculate them. After all, novice researchers usually seek the help of a professional statistician to do the heavy lifting.
My book, Handbook for Health Care Research,16 covers most of the statistical procedures you will encounter in medical research and gives examples of how to use a popular tactical software package called SigmaPlot. By the way, I strongly suggest that you consult a statistician early in your study design phase to avoid the disappointment of finding out later that your results are uninterpretable. For an in-depth treatment of the subject, I recommend How to Report Statistics in Medicine.17
Statistical bare essentials
To do research or even just to understand published research reports, you must have at least a minimal skill set. The necessary skills include understanding some basic terminology, if only to be able to communicate with a statistician consultant. Important terms include levels of measurement (nominal, ordinal, continuous), accuracy, precision, measures of central tendency (mean, median, mode), measures of variability (variance, standard deviation, coefficient of variation), and percentile. The first step in analyzing your results is usually to represent it graphically. That means you should be able to use a spreadsheet to make simple graphs (Figure 5).
You should also know the basics of inferential statistics (ie, hypothesis testing). For example, you need to know the difference between parametric and non-parametric tests. You should be able to explain correlation and regression and know when to use Chi-squared vs a Fisher exact test. You should know that when comparing two mean values, you typically use the Student’s t test (and know when to use paired vs unpaired versions of the test). When comparing more than 2 mean values, you use analysis of variance methods (ANOVA). You can teach yourself these concepts from a book,16 but even an introductory college level course on statistics will be immensely helpful. Most statistics textbooks provide some sort of map to guide your selection of the appropriate statistical test (Figure 6), and there are good articles in medical journals.
You can learn a lot simply by reading the Methods section of research articles. Authors will often describe the statistical tests used and why they were used. But be aware that a certain percentage of papers get published with the wrong statistics.18
One of the underlying assumptions of most parametric statistical methods is that the data may be adequately described by a normal or Gaussian distribution. This assumption needs to be verified before selecting a statistical test. The common test for data normality is the Kolmogorov-Smirnov test. The following text from a methods section describes 2 very common procedures—the Student’s t test for comparing 2 mean values and the one-way ANOVA for comparing more than 2 mean values.19
“Normal distribution of data was verified using the Kolmogorov-Smirnov test. Body weights between groups were compared using one-way ANOVA for repeated measures to investigate temporal differences. At each time point, all data were analyzed using one-way ANOVA to compare PCV and VCV groups. Tukey’s post hoc analyses were performed when significant time effects were detected within groups, and Student’s t test was used to investigate differences between groups. Data were analyzed using commercial software and values were presented as mean ± SD. A P value < .05 was considered statistically significant.”
Estimating sample size and power analysis
One very important consideration in any study is the required number of study subjects for meaningful statistical conclusions. In other words, how big should the sample size be? Sample size is important because it affects the feasibility of the study and the reliability of the conclusions in terms of statistical power. The necessary sample size depends on 2 basic factors. One factor is the variability of the data (often expressed as the standard deviation). The other factor is the effect size, meaning, for example, how big of a difference between mean values you want to detect. In general, the bigger the variability and the smaller the difference, the bigger the sample size required.
As the above equation shows, the effect size is expressed, in general, as a mean difference divided by a standard deviation. In the first case, the numerator represents the difference between the sample mean and the assumed population mean. In the denominator, SD is the standard deviation of the sample (used to estimate the standard deviation of the population). In the second case, the numerator represents the difference between the mean values of 2 samples and the denominator is the pooled standard deviation of the 2 samples.
In order to understand the issues involved with selecting sample size, we need to first understand the types of errors that can be made in any type of decision. Suppose our research goal is to make a decision about whether a new treatment results in a clinical difference (improvement). The results of our statistical test are dichotomous—we decide either yes there is a significant difference or no there isn’t. The truth, which we may never know, is that in reality, the difference exists or it doesn’t.
As Figure 7 shows, the result of our decision making is that there are 2 ways to be right and 2 ways to be wrong. If we decide there is a difference (eg, our statistical tests yields P ≤ .05) but in realty there is not a difference, then we make what is called a type I error. On the other hand, if we conclude that there is not a difference (ie, our statistical test yields P > .05) but in reality there is a difference that we did not detect, then we have made a type II error.
The associated math is shown in Figure 8. The probability of making a type I error is called alpha. By convention in medicine, we set our rejection criterion to alpha = 0.05. In other words, we would reject the null hypothesis (that there is no difference) anytime our statistical test yields a P value less than alpha. The probability of making a type II error is called beta. For historical reasons, the probability of not making a type II error is called the statistical power of the test and is equal to 1 minus beta. Power is affected by sample size: the larger the sample the larger the power. Most researchers, by convention, keep the sample size large enough to keep power above 0.80.
Figure 9 is a nomogram that brings all these ideas together. The red line shows that for your study, given the desired effect size (0.8), if you collected samples from the 30 patients you planned on then the power would be unacceptable at 0.60, indicating a high probability of a false negative decision if the P value comes out greater than .50. The solution is to increase the sample size to about 50 (or more), as indicated by the blue line. From this nomogram we can generalize to say that when you want to detect a small effect with data that have high variability, you need a large sample size to provide acceptable power.
The text below is an example of a power analysis presented in the methods section of a published study.20 Note that the authors give their reasoning for the sample size they selected. This kind of explanation may inform your study design. But what if you don’t know the variability of the data you want to collect? In that case, you need to collect some pilot data and calculate from that an appropriate sample size for a subsequent study.
A prospective power calculation indicated that a sample size of 25 per group was required to achieve 80% power based on an effect size of probability of 0.24 that an observation in the PRVCa group is less than an observation in the ASV group using the Mann-Whitney tests, an alpha of 0.05 (two-tailed) and a 20% dropout.
JUDGING FEASIBILITY
Once you have a draft of your study design, including the estimated sample size, it is time to judge the overall feasibility of the study before committing to it.
Every study has associated costs. Those costs and the sources of funding must be identified. Don’t forget costs for consultants, particularly if you need statistical consultation.
Finally, consider your level of experience. If you are contemplating your first study, a human clinical trial might not be the best choice, given the complexity of such a project. Studies such as a meta-analysis or mathematical simulation require special training beyond basic research procedures, and should be avoided.
- Tobin MJ. Mentoring: seven roles and some specifics. Am J Respir Crit Care Med 2004; 170:114–117.
- Chatburn RL. Advancing beyond the average: the importance of mentoring in professional achievement. Respir Care 2004; 49:304–308.
- Beveridge WIB. The Art of Scientific Investigation. New York, NY: WW Norton & Company; 1950.
- Chatburn RL, Mireles-Cabodevila E, Sasidhar M. Tidal volume measurement error in pressure control modes of mechanical ventilation: a model study. Comput Biol Med 2016; 75:235–242.
- Mireles-Cabodevila E, Chatburn RL. Work of breathing in adaptive pressure control continuous mandatory ventilation. Respir Care 2009; 54:1467–1472.
- Chatburn RL, Ford RM. Procedure to normalize data for benchmarking. Respir Care 2006; 51:145–157.
- Bou-Khalil P, Zeineldine S, Chatburn R, et al. Prediction of inspired oxygen fraction for targeted arterial oxygen tension following open heart surgery in non-smoking and smoking patients. J Clin Monit Comput 2016. https://doi.org/10.1007/s10877-016-9941-6.
- Mireles-Cabodevila E, Diaz-Guzman E, Arroliga AC, Chatburn RL. Human versus computer controlled selection of ventilator settings: an evaluation of adaptive support ventilation and mid-frequency ventilation. Crit Care Res Pract 2012; 2012:204314.
- Chatburn RL. How to find the best evidence. Respir Care 2009; 54:1360–1365.
- Durbin CG Jr. How to read a scientific research paper. Respir Care 2009; 54:1366–1371.
- Pierson DJ. How to read a case report (or teaching case of the month). Respir Care 2009; 54:1372–1378.
- Callcut RA, Branson RD. How to read a review paper. Respir Care 2009; 54:1379–1385.
- Eresuma E, Lake E. How do I find the evidence? Find your librarian—stat! Orthop Nurs 2016; 35:421–423.
- Janke R, Rush KL. The academic librarian as co-investigator on an interprofessional primary research team: a case study. Health Info Libr J 2014; 31:116–122.
- Motulsky H. Essential Biostatistics: A Nonmathematical Approach. New York, NY: Oxford University Press; 2016.
- Chatburn RL. Handbook for Health Care Research. 2nd ed. Sudbury, MA: Jones and Bartlett Publishers; 2011.
- Lang TA, Secic M. How to Report Statistics in Medicine. 2nd ed. Philadelphia, PA: American College of Physicians; 2006.
- Prescott RJ, Civil I. Lies, damn lies and statistics: errors and omission in papers submitted to INJURY 2010–2012. Injury 2013; 44:6–11.
- Fantoni DT, Ida KK, Lopes TF, Otsuki DA, Auler JO Jr, Ambrosio AM. A comparison of the cardiopulmonary effects of pressure controlled ventilation and volume controlled ventilation in healthy anesthetized dogs. J Vet Emerg Crit Care (San Antonio) 2016; 26:524–530.
- Gruber PC, Gomersall CD, Leung P, et al. Randomized controlled trial comparing adaptive-support ventilation with pressure-regulated volume-controlled ventilation with automode in weaning patients after cardiac surgery. Anesthesiology 2008; 109:81–87.