User login
From the Department of Medicine Quality Program, Brigham and Women’s Hospital (Drs. Pennant, McElrath, Coblyn, and Desai) and the Institute for Relevant Clinical Data Analytics, Boston Children’s Hospital, (Drs. Szent-Gyorgyi and Greenberg), Boston, MA.
Abstract
- Objectives: To describe the department of medicine quality program (DOMQP) at Brigham and Women’s Hospital (BWH).
- Methods: The program began in 2007 to engage physicians in local, specialty-specific quality efforts. The program has broadened its scope to include government mandates and hospital-wide priorities, such as maintenance of certification (MOC), “meaningful use (MU),” and medication reconciliation. More recently, we have evolved into a project-based program focusing on both chronic disease management and optimizing care pathways for high-risk inpatient conditions. Our key strategies are developing metrics, raising awareness, distilling information to front-line staff, highlighting relevant action items, and bringing feedback from front-line staff to hospital leadership.
- Results: We have developed 21 metrics across 13 clinical divisions, with performance improvement seen in > 50% of metrics. In 2014, we leveraged our quality metrics to earn MOC credit, with 100 physicians across 10 divisions earning MOC points through the Practice Assessment option. Additionally, department physicians achieved 90% compliance with our institutional medication reconciliation policy. The percentage of physicians achieving stage 1 MU was 98% in 2013, 99% in 2014, and 100% achieved stage 2 MU in 2015.
- Conclusion: Over the past 10 years, the DOMQP has played a unique role in promoting quality and serves as a model for QI within the hospital. We are well positioned to provide support to physicians and their practices as the health care environment continues to evolve.
Key words: quality improvement; quality measurement.
Within the past several years, the health care landscape in the United States has shifted considerably. New financial risk and quality-related incentive structures have been put in place, such as financial incentives to adopt electronic health records (EHRs) and to demonstrate “meaningful use (MU)” of these EHRs [1]. There is greater focus on value based payments, and accountable care organizations (ACOs) are proliferating [2–4]. Certification and training requirements have changed and require completion of performance improvement projects [5,6]. Upcoming changes to quality measurement and improvement through the Quality Payment Program will bring further changes to how clinicians are both monitored and incentivized or penalized [7]. The confluence of these efforts provides an impetus to incorporate quality measurement and improvement into the day to day practice of medicine.
In 2007, the department of medicine (DOM) at Brigham and Women’s Hospital (BWH), a teaching affiliate of Harvard Medical School and a founding member of Partners Healthcare, began a quality program (DOMQP) to engage physicians in local, specialty-specific quality efforts [8]. The program began by focusing on internally developed performance metrics to drive physician engagement. Later, the program expanded its focus to include more externally focused mandates from federal government and other accreditation bodies [9,10]. In this article, we discuss our efforts, including our early stage work and more recent focus in the areas of meaningful use, medication reconciliation, and maintenance of certification as well as our ongoing projects focused on chronic disease management and high-risk inpatient conditions.
Setting
The DOM has approximately 1400 physician faculty members and is the largest clinical department at BWH. The DOMQP is comprised of a medical director (0.35 FTE) and 2 project coordinators (2 FTE) who operate in a consultative capacity to liaison between the various levels of clinical leadership and frontline staff. The DOMQP serves 13 divisions: 11 medical specialties, primary care, and the hospitalist service.
Internally Driven, Specialty-Specific Quality Metrics
The early stages of our efforts focused on engaging clinical leadership and physicians, navigating the hospital’s information systems (IS) to develop quality reports within the EHR and implementing strategies for improvement. Until 30 May 2015, BWH utilized an internally developed EHR comprising a myriad of individual systems (eg, billing, electronic medication administration, clinical repository) that did not interface easily with one another. To resolve the IS challenges, we engaged many levels of the organization’s IS structure and requested updates or developed workaround solutions leading to the integration of the various datasets for comprehensive reporting. This resulted in a new agreement between the hospital and Partners that allowed for billing data to be sent to the same repository that housed the clinical data.
We developed at least one data report for each specialty division. The divisions selected a quality measure, and we worked with clinical leadership to define the numerator and denominator and identify any additional information they wanted in the report, eg, demographics, visit dates, labs. To produce the report, an IS consultant compiles the data elements on an excel spreadsheet. This spreadsheet is then manually chart reviewed by the DOMQP for accuracy before it is converted into a report. The report is then reviewed by the DOMQP to ensure the information is presented correctly and is easily interpreted, and then shared with the division champion(s), who determine how to message and introduce a proposed improvement effort before it is shared with the entire division.

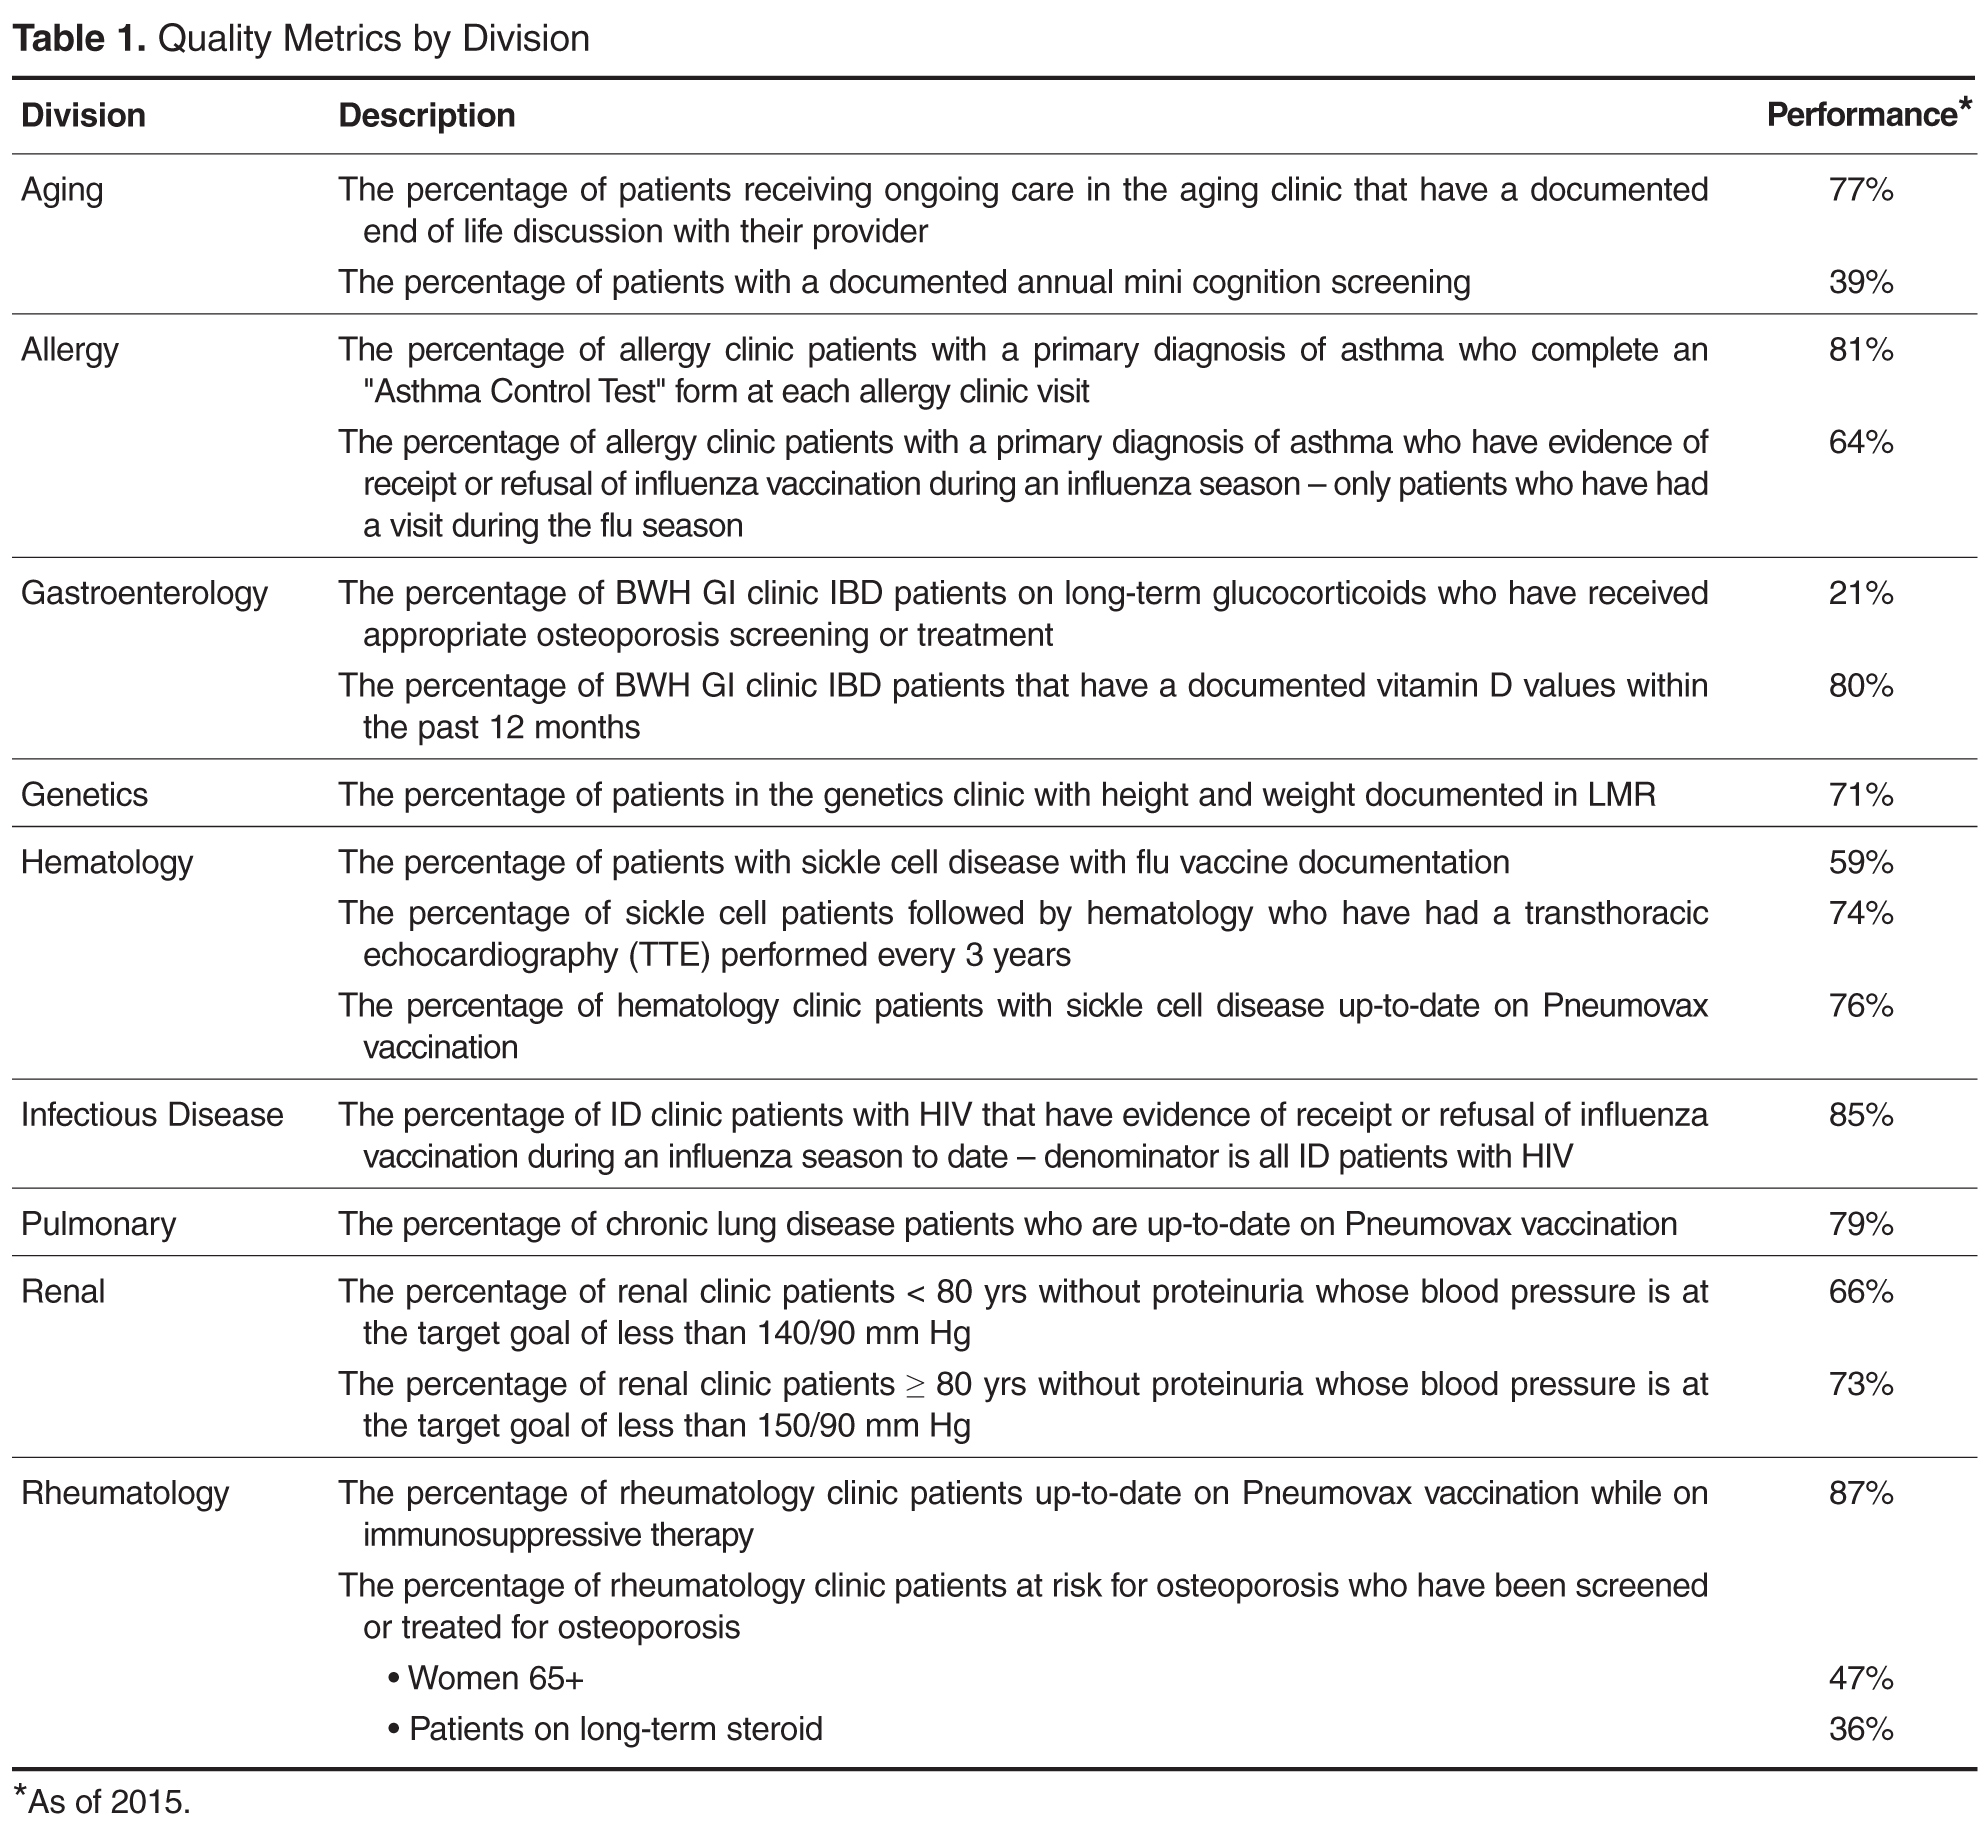
In an effort to improve influenza and pneumococcal vaccination rates, we worked closely with front-line clinicians and staff to create improvement strategies tailored to the patient population and clinic staffing structure in 4 divisions: allergy (order and document flu vaccinations for asthma patients), rheumatology (point-of-care standing pneumococcal paper-orders for immunosuppressed patients), infectious diseases (a nurse-driven influenza protocol was implemented for HIV patients), and pulmonary (letters sent to chronic lung disease patients asking them to bring documentation of prior pneumococcal vaccination to their next visit). We saw increases in vaccination rates across all 4 divisions using varied approaches to reach our goals [17].
Meaningful Use
Our team was responsible for ensuring that the DOM succeeded in the federal government’s MU program. Millions of dollars were at risk to the hospital and to physicians based on performance on various MU metrics. The hospital made this a priority and set a goal for 90% of eligible providers to successfully certify in Stage 1 as meaningful users in the first year of MU.

While working with the clinics to achieve meaningful use, we recognized that a range of staff members played a critical role in helping physicians meet MU metric targets. We worked with the clinic and departmental administrative leadership to set up a one-time bonus payment in 2013 to all DOM clinic staff, including medical assistants, licensed practical nurses, practice assistants, for appreciation of their significant efforts to help the physicians and the hospital achieve their MU goals. As health care delivery continues to rely more heavily on highly functional teams, acknowledgment of the efforts of non-clinical staff in helping front-line clinicians in achieving MU can help promote teamwork around a common goal.
Our partnership with the hospital MU team lead to a final tally of 98% of eligible providers meeting stage 1 in 2013, 99% in 2014 and 100% for the modified stage 2 in 2015 and 99% in 2016 for DOM specialty divisions, representing over 250 physicians.
Medication Reconciliation
The impetus for the hospital’s focus on medication reconciliation was the Joint Commission requirement that medications listed as prescribed in the EHR be reconciled with the patient at each visit [10]. The hospital’s quality and safety team created a hospital-wide metric aligned with hospital policy to measure how providers were reconciling medication lists during office visits. The medication reconciliation metric tallied visits when a medication change occurred (denominator) in which all of the medications originally prescribed by a physician in that specialty clinic were reconciled (numerator). This made it easier for specialists to buy-in to the metric because they were only responsible for the medications they prescribed and not the entire list. To meet the metric, physicians are required to take an action on each of the medications they prescribed by clicking taking, not taking, taking differently, or discontinuing. If the clinic has additional staff within the clinic to assist in the medication review process with the patient, physicians would receive credit for their actions once they had reviewed the medication list.
The metric BWH established to measure medication reconciliation was distinct and more rigorous than the medication reconciliation metric used to meet MU requirements. This presented a challenge in both physician communication regarding requirements and data sharing to drive performance improvement. Since the DOM is the largest and most prescribing department, we had to work with clinical and administrative leaders at the divisional level so that all staff understood the exact requirements and how to achieve them. When presenting to faculty we encountered many questions, and general resistance to more clicks in the EHR, as there was no universal “reconcile” button in the extant EHR. After breaking down the process into discrete components with staff and analyzing the data, we targeted outreach to the specific divisions and clinics that needed additional education and support. In our monthly email communication to division leadership, we displayed comparative data on all divisions within the DOM.

After we transitioned to a new vendor-based EHR in 2015, we developed a new medication reconciliation metric, aimed to align with Stage 2 MU requirements, and ensured all divisions had processes in place to review and reconcile medications. In our new EHR, medications lists are shared and viewable between ambulatory and inpatient environments and discharge summaries contain changes made to medications while inpatient. We have found that our performance on our new metric is 70.5% for February 2017 and we are continuing to educate physicians and staff on our new EHR functionality, our new electronic measurement and on workflows to help assist with improving performance with a short-term goal of 80%. We have found that our new EHR functionality does not match the ease of our old EHR functionality, which has made improvement on this metric a significant challenge for our clinicians and staff.
Maintenance of Certification
As of 2013, physicians who were board certified by the ABIM or ABMS were required to attain 20 practice assessment points showing participation in quality improvement activities for maintenance of certification (MOC). Although ABIM suspended the practice assessment requirement in 2015, it is likely that some component of quality improvement will be assessed in the future [5,19]. Prior to the changes in 2015, we were approached by the hospital leadership to roll out a new, streamlined process to leverage our existing quality metrics and established performance improvement plans in order to allow physicians to gain MOC credit. Each metric/project was vetted with 3 separate groups: the DOMQP, hospital leadership leading the MOC efforts, and Partners Healthcare, our overarching local health care system. We worked with our division physician champions and the physicians preparing for board re-certification to complete the one-time documentation required by the hospital for MOC. This process took approximately 6 months per project. Once the project was approved by all 3 channels, all physicians participating in the quality effort could get the practice assessment points by completing a simple attestation form.

Current Focus
After the stabilization of our new EHR and the re-creation of former reports, the program began to engage divisions in new measures. We still focus on chronic disease management and vaccinations but instead try to create a unified approach across multiple divisions within the DOM. Building upon our previous work in the renal division, over the past year we convened a hyper-tension work group comprising physician leads from endocrine, cardiology, renal, primary care, gerontology, neurology, pharmacy, and obstetrics. The goal of these meetings is to optimize blood pressure management across different patient populations by creating a centralized hospital approach with an algorithm agreed upon by the physician workgroup. We were able to secure additional internal grant funding to develop a pilot project where bluetooth blood pressure cuffs are given to eligible hypertensive patients in our pilot ambulatory practices. The daily blood pressure readings are transmitted into the EHR and a nurse practitioner or pharmacist contacts the patient at defined intervals to address any barriers and titrate medications as necessary. Analysis of the outcomes will be presented this fall. Similarly with vaccinations we are creating an automated order form within the EHR that will appear whenever a specialist places an order to start immunosuppressive medications. This will prompt the provider to order appropriate labs and vaccinations recommended for the course of treatment.
In addition to expanding upon previous metrics, we have expanded our scope to focus on patient safety measures, specifically, missed and delayed cancer diagnoses of the lung and colon. We are working on processes to track every patient with an abnormal finding from point of notification to completion of recommended follow-up at the appropriate intervals. Also we have now have 3 projects in the inpatient setting: chronic obstructive pulmonary disease (COPD) readmissions, and 2 standardized clinical assessment and management pathways (SCAMPs), one on acute kidney injury and the other on congestive heart failure [20]. The COPD project aims to have every patient admitted with COPD receive a pulmonary and respiratory consult during their stay and a follow-up visit with a pulmonologist. The goal of any SCAMP is to standardize care in an area where there is a lot of variability through the use of clinical pathways.
Communication Strategy
In order for the DOMQP to ensure that multiple quality requirements are met by all divisions, we have established a robust communication strategy with the goal of clear, concise, and relevant information-sharing with physicians and staff. We engage physicians through direct meetings, regular emails, and data reporting. The purpose of our outreach to the division faculty is threefold: (1) to educate physicians about hospital-wide programs, (2) to orient them to specific action items required for success, and (3) to funnel questions back to project leaders to ensure that the feedback of clinicians was incorporated into hospital wide quality initiatives. Our first challenge is to provide context for physicians about the project, be it based on accreditation, credentialing or a federal mandate. We work with the hospital project leaders to learn as much as possible about the efforts they are promoting so we can work in concert with them to highlight key messages to physicians.
Next, we establish a schedule to present at each clinical specialty faculty meeting on a regular basis (semi-annually to quarterly). At these meetings we present an overall picture of the key initiatives relevant to the division, identify milestones, offer clear timelines and prioritization of these projects, and narrow the focus of work to a few bulleted action items for all levels of the clinic staff to incorporate into its workflow. We then listen to questions and concerns and bring these back to the initiative leaders so that systematic changes can be made. Answers and updates are communicated back to the divisions, thus closing the communication loop. We interface with practice managers and clinical support staff to identify opportunities for them to support physicians in meeting initiative requirements [21,22].
In addition to presenting at faculty meetings, we present updates to departmental and hospital leadership, including vice chairs and division chiefs. These meetings include high-level data on performance as well as an opportunity to discuss the challenges we identified through our discussions with individual specialties. These forums are a good place to discuss overarching process issues or to disseminate answers to previous questions.
An important part of our communication plan involves our comprehensive monthly emails. For each initiative, we receive department level data on a monthly basis from the project leadership. We deconstruct these reports to enable us to evaluate our 13 divisions individually. We show performance at the physician level and highlight general areas where improvement is needed. We send monthly e-mails to division clinical and administrative leadership to apprise them of their division’s performance and inform them of areas that require concentrated effort. Depending on the initiative, we present data as a snapshot in time or trend over time. From 2012–2017 the DOMQP has helped to bridge the gap between large-scale rollouts of the new initiatives and the vast number of DOM physicians who required more specific education and tools to meet these new requirements.
Conclusion
The DOMQP has been working on quality within the department of medicine for the past 10 years. We have moved from initiating an internal quality program among the specialty providers, which required education among faculty and resolve to overcome many IS challenges, to serving as a resource for hospital-wide quality-related initiatives. We have developed a successful architecture for disseminating information and guiding faculty and administrative support toward success on a multitude of metrics that have implications on both finances and sound patient care. We have navigated the significant challenges associated with the large-scale change due to the EHR transition we underwent in 2015, including clinician burnout and fatigue, new EHR functionality, and the development of a new data reporting infrastructure and governance. The DOMQP continues to demonstrate that quality has a multifaceted role to play within a hospital.
As the health care environment continues to evolve, the need for this level of support for clinics will increase. The DOMQP is well positioned to provide continuing support to physicians and their practices in measuring and improving quality, with attention paid to such areas as coordination and efficacy of care, patient-reported outcomes, patient safety, and population health management. We believe that the DOMQP can serve as a model of a departmental quality program.
Acknowledgements: We would like to thank the department of medicine administration, faculty and support staff for their continuous effort and support in the work of clinical quality improvement.
Corresponding author: Sonali Desai, MD, MPH, Brigham & Women’s Hospital, 45 Francis St., PBB-B3, Boston, MA 02115, sdesai5@bwh.harvard.edu.
Financial disclosures: None.
1. Electronic health records (EHR) incentive programs. Accessed at www.cms.gov/Regulations-and Guidance/Legislation/EHRIncentivePrograms/index.html?redirect=/EHRIncentiveprograms/.
2. Accountable care organizations (ACO). Accessed at www.cms.gov/Medicare/Medicare-Fee-for-Service-Payment/ACO/index.html?redirect=/aco.
3. Quinn K. The 8 basic payment methods in health care. Ann Intern Med 2015;163:300–6.
4. Muhlestein D, McClellan M. Accountable care organizations in 2016: private and public-sector growth and dispersion. Health Aff blog 21 Apr 2016. Accessed at http://healthaffairs.org/blog/2016/04/21/accountable-care-organizations-in-2016-private-and-public-sector-growth-and-dispersion/.
5. ABIM. Maintenance of certification. Accessed 6 Oct 2015 at www.abim.org/maintenance-of-certification/.
6. Accreditation Council for Graduate Medical Education. CLER pathways to excellence. 2014. Accessed 6 Oct 2015 at www.acgme.org/acgmeweb/Portals/0/PDFs/CLER/CLER_Brochure.pdf.
7. Centers for Medicare and Medicaid Services. Quality payment program. Accessed 31 Mar 2017 at https://qpp.cms.gov/measures/quality.
8. Szent-Gyorgyi LE, Coblyn J, Turchin A, et al. Building a departmental quality program: a patient-based and provider-led approach. Acad Med 2011;86:314–20.
9. Brook RH, McGlynn EA, Shekelle PG. Defining and measuring quality of care: a perspective from US researchers. Int J Qual Health Care 2000;12:281–95.
10. The Joint Commision. National patient safety goals. Accessed at www.jointcommission.org/standards_information/npsgs.aspx.
11. Conway PH, Mostashari F, Clancy C. The future of quality measurement for improvement and accountability. JAMA 2013;309:2215–6.
12. Desai SP, Turchin A, Szent-Gyorgyi LE, et al. Routinely measuring and reporting pneumococcal vaccination among immunosuppressed rheumatology outpatients: the first step in improving quality. Rheumatology (Oxford) 2011;50:366–72.
13. Desai SP, Lu B, Szent-Gyorgyi LE, et al. Increasing pneumococcal vaccination for immunosuppressed patients: a cluster quality improvement trial. Arthritis Rheum 2013;65:39–47.
14. Deming Institute. PDSA cycle. Accessed at www.deming.org/theman/theories/pdsacycle.
15. McGlynn EA, Schneider EC, Kerr EA. Reimagining quality measurement. N Engl J Med 2014;371:2150–3.
16. Greenberg JO, Vakharia N, Szent-Gyorgyi LE, et al. Meaningful measurement: developing a measurement system to improve blood pressure control in patients with chronic kidney disease. J Am Med Inform Assoc 2013;20:e97–e101.
17. Pennant KN, Costa JJ, Fuhlbrigge AL, et al. Improving influenza and pneumococcal vaccination rates in ambulatory specialty practices. Open Forum Infect Dis 2015;2:ofv119.
18. Keogh C, Kachalia A, Fiumara K, et al. Ambulatory medication reconciliation: using a collaborative approach to process improvement at an academic medical center. Jt Comm J Qual Patient Saf 2016;42:186–94.
19. ABIM. Maintenance of certification FAQ. Accessed at www.abim.org/maintenance-of-certification/moc-faq/default.aspx.
20. Mendu ML, Ciociolo GR Jr, McLaughlin SR, et al. A decision-making algorithm for initiation and discontinuation of RRT in severe AKI. Clin J Am Soc Nephrol 2017;12:228–36.
21. Galvin RS, McGlynn EA. Using performance measurement to drive improvement: a road map for change. Med Care 2003;41:I48–60.
22. Glaser J, Hess R. Leveraging healthcare IT to improve operational performance. Healthc Financ Manage 2011;65:82–5.
From the Department of Medicine Quality Program, Brigham and Women’s Hospital (Drs. Pennant, McElrath, Coblyn, and Desai) and the Institute for Relevant Clinical Data Analytics, Boston Children’s Hospital, (Drs. Szent-Gyorgyi and Greenberg), Boston, MA.
Abstract
- Objectives: To describe the department of medicine quality program (DOMQP) at Brigham and Women’s Hospital (BWH).
- Methods: The program began in 2007 to engage physicians in local, specialty-specific quality efforts. The program has broadened its scope to include government mandates and hospital-wide priorities, such as maintenance of certification (MOC), “meaningful use (MU),” and medication reconciliation. More recently, we have evolved into a project-based program focusing on both chronic disease management and optimizing care pathways for high-risk inpatient conditions. Our key strategies are developing metrics, raising awareness, distilling information to front-line staff, highlighting relevant action items, and bringing feedback from front-line staff to hospital leadership.
- Results: We have developed 21 metrics across 13 clinical divisions, with performance improvement seen in > 50% of metrics. In 2014, we leveraged our quality metrics to earn MOC credit, with 100 physicians across 10 divisions earning MOC points through the Practice Assessment option. Additionally, department physicians achieved 90% compliance with our institutional medication reconciliation policy. The percentage of physicians achieving stage 1 MU was 98% in 2013, 99% in 2014, and 100% achieved stage 2 MU in 2015.
- Conclusion: Over the past 10 years, the DOMQP has played a unique role in promoting quality and serves as a model for QI within the hospital. We are well positioned to provide support to physicians and their practices as the health care environment continues to evolve.
Key words: quality improvement; quality measurement.
Within the past several years, the health care landscape in the United States has shifted considerably. New financial risk and quality-related incentive structures have been put in place, such as financial incentives to adopt electronic health records (EHRs) and to demonstrate “meaningful use (MU)” of these EHRs [1]. There is greater focus on value based payments, and accountable care organizations (ACOs) are proliferating [2–4]. Certification and training requirements have changed and require completion of performance improvement projects [5,6]. Upcoming changes to quality measurement and improvement through the Quality Payment Program will bring further changes to how clinicians are both monitored and incentivized or penalized [7]. The confluence of these efforts provides an impetus to incorporate quality measurement and improvement into the day to day practice of medicine.
In 2007, the department of medicine (DOM) at Brigham and Women’s Hospital (BWH), a teaching affiliate of Harvard Medical School and a founding member of Partners Healthcare, began a quality program (DOMQP) to engage physicians in local, specialty-specific quality efforts [8]. The program began by focusing on internally developed performance metrics to drive physician engagement. Later, the program expanded its focus to include more externally focused mandates from federal government and other accreditation bodies [9,10]. In this article, we discuss our efforts, including our early stage work and more recent focus in the areas of meaningful use, medication reconciliation, and maintenance of certification as well as our ongoing projects focused on chronic disease management and high-risk inpatient conditions.
Setting
The DOM has approximately 1400 physician faculty members and is the largest clinical department at BWH. The DOMQP is comprised of a medical director (0.35 FTE) and 2 project coordinators (2 FTE) who operate in a consultative capacity to liaison between the various levels of clinical leadership and frontline staff. The DOMQP serves 13 divisions: 11 medical specialties, primary care, and the hospitalist service.
Internally Driven, Specialty-Specific Quality Metrics
The early stages of our efforts focused on engaging clinical leadership and physicians, navigating the hospital’s information systems (IS) to develop quality reports within the EHR and implementing strategies for improvement. Until 30 May 2015, BWH utilized an internally developed EHR comprising a myriad of individual systems (eg, billing, electronic medication administration, clinical repository) that did not interface easily with one another. To resolve the IS challenges, we engaged many levels of the organization’s IS structure and requested updates or developed workaround solutions leading to the integration of the various datasets for comprehensive reporting. This resulted in a new agreement between the hospital and Partners that allowed for billing data to be sent to the same repository that housed the clinical data.
We developed at least one data report for each specialty division. The divisions selected a quality measure, and we worked with clinical leadership to define the numerator and denominator and identify any additional information they wanted in the report, eg, demographics, visit dates, labs. To produce the report, an IS consultant compiles the data elements on an excel spreadsheet. This spreadsheet is then manually chart reviewed by the DOMQP for accuracy before it is converted into a report. The report is then reviewed by the DOMQP to ensure the information is presented correctly and is easily interpreted, and then shared with the division champion(s), who determine how to message and introduce a proposed improvement effort before it is shared with the entire division.
In an effort to improve influenza and pneumococcal vaccination rates, we worked closely with front-line clinicians and staff to create improvement strategies tailored to the patient population and clinic staffing structure in 4 divisions: allergy (order and document flu vaccinations for asthma patients), rheumatology (point-of-care standing pneumococcal paper-orders for immunosuppressed patients), infectious diseases (a nurse-driven influenza protocol was implemented for HIV patients), and pulmonary (letters sent to chronic lung disease patients asking them to bring documentation of prior pneumococcal vaccination to their next visit). We saw increases in vaccination rates across all 4 divisions using varied approaches to reach our goals [17].
Meaningful Use
Our team was responsible for ensuring that the DOM succeeded in the federal government’s MU program. Millions of dollars were at risk to the hospital and to physicians based on performance on various MU metrics. The hospital made this a priority and set a goal for 90% of eligible providers to successfully certify in Stage 1 as meaningful users in the first year of MU.
While working with the clinics to achieve meaningful use, we recognized that a range of staff members played a critical role in helping physicians meet MU metric targets. We worked with the clinic and departmental administrative leadership to set up a one-time bonus payment in 2013 to all DOM clinic staff, including medical assistants, licensed practical nurses, practice assistants, for appreciation of their significant efforts to help the physicians and the hospital achieve their MU goals. As health care delivery continues to rely more heavily on highly functional teams, acknowledgment of the efforts of non-clinical staff in helping front-line clinicians in achieving MU can help promote teamwork around a common goal.
Our partnership with the hospital MU team lead to a final tally of 98% of eligible providers meeting stage 1 in 2013, 99% in 2014 and 100% for the modified stage 2 in 2015 and 99% in 2016 for DOM specialty divisions, representing over 250 physicians.
Medication Reconciliation
The impetus for the hospital’s focus on medication reconciliation was the Joint Commission requirement that medications listed as prescribed in the EHR be reconciled with the patient at each visit [10]. The hospital’s quality and safety team created a hospital-wide metric aligned with hospital policy to measure how providers were reconciling medication lists during office visits. The medication reconciliation metric tallied visits when a medication change occurred (denominator) in which all of the medications originally prescribed by a physician in that specialty clinic were reconciled (numerator). This made it easier for specialists to buy-in to the metric because they were only responsible for the medications they prescribed and not the entire list. To meet the metric, physicians are required to take an action on each of the medications they prescribed by clicking taking, not taking, taking differently, or discontinuing. If the clinic has additional staff within the clinic to assist in the medication review process with the patient, physicians would receive credit for their actions once they had reviewed the medication list.
The metric BWH established to measure medication reconciliation was distinct and more rigorous than the medication reconciliation metric used to meet MU requirements. This presented a challenge in both physician communication regarding requirements and data sharing to drive performance improvement. Since the DOM is the largest and most prescribing department, we had to work with clinical and administrative leaders at the divisional level so that all staff understood the exact requirements and how to achieve them. When presenting to faculty we encountered many questions, and general resistance to more clicks in the EHR, as there was no universal “reconcile” button in the extant EHR. After breaking down the process into discrete components with staff and analyzing the data, we targeted outreach to the specific divisions and clinics that needed additional education and support. In our monthly email communication to division leadership, we displayed comparative data on all divisions within the DOM.
After we transitioned to a new vendor-based EHR in 2015, we developed a new medication reconciliation metric, aimed to align with Stage 2 MU requirements, and ensured all divisions had processes in place to review and reconcile medications. In our new EHR, medications lists are shared and viewable between ambulatory and inpatient environments and discharge summaries contain changes made to medications while inpatient. We have found that our performance on our new metric is 70.5% for February 2017 and we are continuing to educate physicians and staff on our new EHR functionality, our new electronic measurement and on workflows to help assist with improving performance with a short-term goal of 80%. We have found that our new EHR functionality does not match the ease of our old EHR functionality, which has made improvement on this metric a significant challenge for our clinicians and staff.
Maintenance of Certification
As of 2013, physicians who were board certified by the ABIM or ABMS were required to attain 20 practice assessment points showing participation in quality improvement activities for maintenance of certification (MOC). Although ABIM suspended the practice assessment requirement in 2015, it is likely that some component of quality improvement will be assessed in the future [5,19]. Prior to the changes in 2015, we were approached by the hospital leadership to roll out a new, streamlined process to leverage our existing quality metrics and established performance improvement plans in order to allow physicians to gain MOC credit. Each metric/project was vetted with 3 separate groups: the DOMQP, hospital leadership leading the MOC efforts, and Partners Healthcare, our overarching local health care system. We worked with our division physician champions and the physicians preparing for board re-certification to complete the one-time documentation required by the hospital for MOC. This process took approximately 6 months per project. Once the project was approved by all 3 channels, all physicians participating in the quality effort could get the practice assessment points by completing a simple attestation form.
Current Focus
After the stabilization of our new EHR and the re-creation of former reports, the program began to engage divisions in new measures. We still focus on chronic disease management and vaccinations but instead try to create a unified approach across multiple divisions within the DOM. Building upon our previous work in the renal division, over the past year we convened a hyper-tension work group comprising physician leads from endocrine, cardiology, renal, primary care, gerontology, neurology, pharmacy, and obstetrics. The goal of these meetings is to optimize blood pressure management across different patient populations by creating a centralized hospital approach with an algorithm agreed upon by the physician workgroup. We were able to secure additional internal grant funding to develop a pilot project where bluetooth blood pressure cuffs are given to eligible hypertensive patients in our pilot ambulatory practices. The daily blood pressure readings are transmitted into the EHR and a nurse practitioner or pharmacist contacts the patient at defined intervals to address any barriers and titrate medications as necessary. Analysis of the outcomes will be presented this fall. Similarly with vaccinations we are creating an automated order form within the EHR that will appear whenever a specialist places an order to start immunosuppressive medications. This will prompt the provider to order appropriate labs and vaccinations recommended for the course of treatment.
In addition to expanding upon previous metrics, we have expanded our scope to focus on patient safety measures, specifically, missed and delayed cancer diagnoses of the lung and colon. We are working on processes to track every patient with an abnormal finding from point of notification to completion of recommended follow-up at the appropriate intervals. Also we have now have 3 projects in the inpatient setting: chronic obstructive pulmonary disease (COPD) readmissions, and 2 standardized clinical assessment and management pathways (SCAMPs), one on acute kidney injury and the other on congestive heart failure [20]. The COPD project aims to have every patient admitted with COPD receive a pulmonary and respiratory consult during their stay and a follow-up visit with a pulmonologist. The goal of any SCAMP is to standardize care in an area where there is a lot of variability through the use of clinical pathways.
Communication Strategy
In order for the DOMQP to ensure that multiple quality requirements are met by all divisions, we have established a robust communication strategy with the goal of clear, concise, and relevant information-sharing with physicians and staff. We engage physicians through direct meetings, regular emails, and data reporting. The purpose of our outreach to the division faculty is threefold: (1) to educate physicians about hospital-wide programs, (2) to orient them to specific action items required for success, and (3) to funnel questions back to project leaders to ensure that the feedback of clinicians was incorporated into hospital wide quality initiatives. Our first challenge is to provide context for physicians about the project, be it based on accreditation, credentialing or a federal mandate. We work with the hospital project leaders to learn as much as possible about the efforts they are promoting so we can work in concert with them to highlight key messages to physicians.
Next, we establish a schedule to present at each clinical specialty faculty meeting on a regular basis (semi-annually to quarterly). At these meetings we present an overall picture of the key initiatives relevant to the division, identify milestones, offer clear timelines and prioritization of these projects, and narrow the focus of work to a few bulleted action items for all levels of the clinic staff to incorporate into its workflow. We then listen to questions and concerns and bring these back to the initiative leaders so that systematic changes can be made. Answers and updates are communicated back to the divisions, thus closing the communication loop. We interface with practice managers and clinical support staff to identify opportunities for them to support physicians in meeting initiative requirements [21,22].
In addition to presenting at faculty meetings, we present updates to departmental and hospital leadership, including vice chairs and division chiefs. These meetings include high-level data on performance as well as an opportunity to discuss the challenges we identified through our discussions with individual specialties. These forums are a good place to discuss overarching process issues or to disseminate answers to previous questions.
An important part of our communication plan involves our comprehensive monthly emails. For each initiative, we receive department level data on a monthly basis from the project leadership. We deconstruct these reports to enable us to evaluate our 13 divisions individually. We show performance at the physician level and highlight general areas where improvement is needed. We send monthly e-mails to division clinical and administrative leadership to apprise them of their division’s performance and inform them of areas that require concentrated effort. Depending on the initiative, we present data as a snapshot in time or trend over time. From 2012–2017 the DOMQP has helped to bridge the gap between large-scale rollouts of the new initiatives and the vast number of DOM physicians who required more specific education and tools to meet these new requirements.
Conclusion
The DOMQP has been working on quality within the department of medicine for the past 10 years. We have moved from initiating an internal quality program among the specialty providers, which required education among faculty and resolve to overcome many IS challenges, to serving as a resource for hospital-wide quality-related initiatives. We have developed a successful architecture for disseminating information and guiding faculty and administrative support toward success on a multitude of metrics that have implications on both finances and sound patient care. We have navigated the significant challenges associated with the large-scale change due to the EHR transition we underwent in 2015, including clinician burnout and fatigue, new EHR functionality, and the development of a new data reporting infrastructure and governance. The DOMQP continues to demonstrate that quality has a multifaceted role to play within a hospital.
As the health care environment continues to evolve, the need for this level of support for clinics will increase. The DOMQP is well positioned to provide continuing support to physicians and their practices in measuring and improving quality, with attention paid to such areas as coordination and efficacy of care, patient-reported outcomes, patient safety, and population health management. We believe that the DOMQP can serve as a model of a departmental quality program.
Acknowledgements: We would like to thank the department of medicine administration, faculty and support staff for their continuous effort and support in the work of clinical quality improvement.
Corresponding author: Sonali Desai, MD, MPH, Brigham & Women’s Hospital, 45 Francis St., PBB-B3, Boston, MA 02115, sdesai5@bwh.harvard.edu.
Financial disclosures: None.
1. Electronic health records (EHR) incentive programs. Accessed at www.cms.gov/Regulations-and Guidance/Legislation/EHRIncentivePrograms/index.html?redirect=/EHRIncentiveprograms/.
2. Accountable care organizations (ACO). Accessed at www.cms.gov/Medicare/Medicare-Fee-for-Service-Payment/ACO/index.html?redirect=/aco.
3. Quinn K. The 8 basic payment methods in health care. Ann Intern Med 2015;163:300–6.
4. Muhlestein D, McClellan M. Accountable care organizations in 2016: private and public-sector growth and dispersion. Health Aff blog 21 Apr 2016. Accessed at http://healthaffairs.org/blog/2016/04/21/accountable-care-organizations-in-2016-private-and-public-sector-growth-and-dispersion/.
5. ABIM. Maintenance of certification. Accessed 6 Oct 2015 at www.abim.org/maintenance-of-certification/.
6. Accreditation Council for Graduate Medical Education. CLER pathways to excellence. 2014. Accessed 6 Oct 2015 at www.acgme.org/acgmeweb/Portals/0/PDFs/CLER/CLER_Brochure.pdf.
7. Centers for Medicare and Medicaid Services. Quality payment program. Accessed 31 Mar 2017 at https://qpp.cms.gov/measures/quality.
8. Szent-Gyorgyi LE, Coblyn J, Turchin A, et al. Building a departmental quality program: a patient-based and provider-led approach. Acad Med 2011;86:314–20.
9. Brook RH, McGlynn EA, Shekelle PG. Defining and measuring quality of care: a perspective from US researchers. Int J Qual Health Care 2000;12:281–95.
10. The Joint Commision. National patient safety goals. Accessed at www.jointcommission.org/standards_information/npsgs.aspx.
11. Conway PH, Mostashari F, Clancy C. The future of quality measurement for improvement and accountability. JAMA 2013;309:2215–6.
12. Desai SP, Turchin A, Szent-Gyorgyi LE, et al. Routinely measuring and reporting pneumococcal vaccination among immunosuppressed rheumatology outpatients: the first step in improving quality. Rheumatology (Oxford) 2011;50:366–72.
13. Desai SP, Lu B, Szent-Gyorgyi LE, et al. Increasing pneumococcal vaccination for immunosuppressed patients: a cluster quality improvement trial. Arthritis Rheum 2013;65:39–47.
14. Deming Institute. PDSA cycle. Accessed at www.deming.org/theman/theories/pdsacycle.
15. McGlynn EA, Schneider EC, Kerr EA. Reimagining quality measurement. N Engl J Med 2014;371:2150–3.
16. Greenberg JO, Vakharia N, Szent-Gyorgyi LE, et al. Meaningful measurement: developing a measurement system to improve blood pressure control in patients with chronic kidney disease. J Am Med Inform Assoc 2013;20:e97–e101.
17. Pennant KN, Costa JJ, Fuhlbrigge AL, et al. Improving influenza and pneumococcal vaccination rates in ambulatory specialty practices. Open Forum Infect Dis 2015;2:ofv119.
18. Keogh C, Kachalia A, Fiumara K, et al. Ambulatory medication reconciliation: using a collaborative approach to process improvement at an academic medical center. Jt Comm J Qual Patient Saf 2016;42:186–94.
19. ABIM. Maintenance of certification FAQ. Accessed at www.abim.org/maintenance-of-certification/moc-faq/default.aspx.
20. Mendu ML, Ciociolo GR Jr, McLaughlin SR, et al. A decision-making algorithm for initiation and discontinuation of RRT in severe AKI. Clin J Am Soc Nephrol 2017;12:228–36.
21. Galvin RS, McGlynn EA. Using performance measurement to drive improvement: a road map for change. Med Care 2003;41:I48–60.
22. Glaser J, Hess R. Leveraging healthcare IT to improve operational performance. Healthc Financ Manage 2011;65:82–5.