User login
Emergency department visits for mental and substance use disorders (MUSDs) cost $14.6 billion in 2017, representing 19% of the total for all ED visits that year, according to the Agency for Healthcare Quality and Research.
In terms of the total number of visits for MUSDs, 23.1 million, the proportion was slightly lower: 16% of all ED visits for the year, Zeynal Karaca, PhD, a senior economist with AHRQ, and Brian J. Moore, PhD, a senior research leader at IBM Watson Health, said in a recent statistical brief.
Put those figures together and the average visit for an MUSD diagnosis cost $630 and that is 19% higher than the average of $530 for all 145 million ED visits, they reported based on data from the Nationwide Emergency Department Sample.
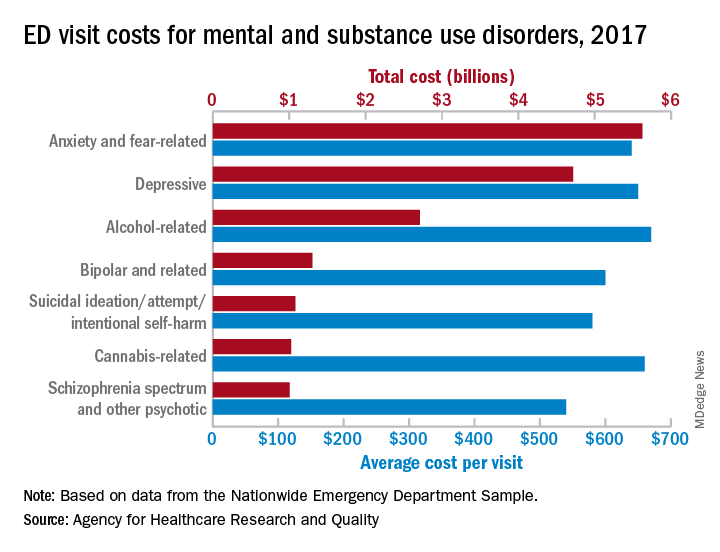
The most costly MUSD diagnosis in 2017 was anxiety and fear-related disorders, with a total of $5.6 billion for ED visits, followed by depressive disorders at $4.7 billion and alcohol-related disorders at $2.7 billion. Some ED visits may involve more than one MUSD diagnosis, so the sum of all the individual diagnoses does not agree with the total for the entire MUSD category, the researchers noted.
On a per-visit basis, in 2017. [It was not included in the graph because it was 13th.] Other disorders with high per-visit costs were alcohol-related ($670), cannabis-related ($660), and depressive and stimulant-related (both with $650), Dr. Karaca and Dr. Moore said.
Patients with MUSDs who were routinely discharged after an ED visit in 2017 represented a much lower share of the total MUSD cost (68.0%), compared with the overall group of ED visitors (81.4%), but MUSD visits resulting in an inpatient admission made up a larger proportion of costs (19.0%), compared with all visits (9.5%), they said.
Costs between MUSD visits and all ED visits also differed by patient age. Visits by patients aged 0-9 years represented only 0.7% of MUSD-related ED costs but 5.6% of the overall cost, but the respective figures for those aged 45-64 were 36.2% for MUSD costs and 28.5% for the total ED cost, they reported.
SOURCE: Karaca Z and Moore BJ. HCUP Statistical Brief #257. May 12, 2020.
Emergency department visits for mental and substance use disorders (MUSDs) cost $14.6 billion in 2017, representing 19% of the total for all ED visits that year, according to the Agency for Healthcare Quality and Research.
In terms of the total number of visits for MUSDs, 23.1 million, the proportion was slightly lower: 16% of all ED visits for the year, Zeynal Karaca, PhD, a senior economist with AHRQ, and Brian J. Moore, PhD, a senior research leader at IBM Watson Health, said in a recent statistical brief.
Put those figures together and the average visit for an MUSD diagnosis cost $630 and that is 19% higher than the average of $530 for all 145 million ED visits, they reported based on data from the Nationwide Emergency Department Sample.
The most costly MUSD diagnosis in 2017 was anxiety and fear-related disorders, with a total of $5.6 billion for ED visits, followed by depressive disorders at $4.7 billion and alcohol-related disorders at $2.7 billion. Some ED visits may involve more than one MUSD diagnosis, so the sum of all the individual diagnoses does not agree with the total for the entire MUSD category, the researchers noted.
On a per-visit basis, in 2017. [It was not included in the graph because it was 13th.] Other disorders with high per-visit costs were alcohol-related ($670), cannabis-related ($660), and depressive and stimulant-related (both with $650), Dr. Karaca and Dr. Moore said.
Patients with MUSDs who were routinely discharged after an ED visit in 2017 represented a much lower share of the total MUSD cost (68.0%), compared with the overall group of ED visitors (81.4%), but MUSD visits resulting in an inpatient admission made up a larger proportion of costs (19.0%), compared with all visits (9.5%), they said.
Costs between MUSD visits and all ED visits also differed by patient age. Visits by patients aged 0-9 years represented only 0.7% of MUSD-related ED costs but 5.6% of the overall cost, but the respective figures for those aged 45-64 were 36.2% for MUSD costs and 28.5% for the total ED cost, they reported.
SOURCE: Karaca Z and Moore BJ. HCUP Statistical Brief #257. May 12, 2020.