User login
From the Ottawa Hospital, Ottawa, ON Canada.
Abstract
- Objective: Fluctuations in emergency department (ED) visits occur frequently, and traditional global measures of ED crowding do not allow for targeted responses to address root causes. We sought to develop, implement, and evaluate a novel ED surge protocol based on the input-throughput-output (ITO) model of ED flow.
- Methods: This initiative took place at a tertiary care academic teaching hospital. An inter-professional group developed and validated metrics for various levels of surge in relation to the ITO model, measured every 2 hours, which directly linked to specific actions targeting root causes within those components. Main outcome measure was defined as the frequency of sustained (≥ 6 hours) high surges, a marker of inability to respond effectively.
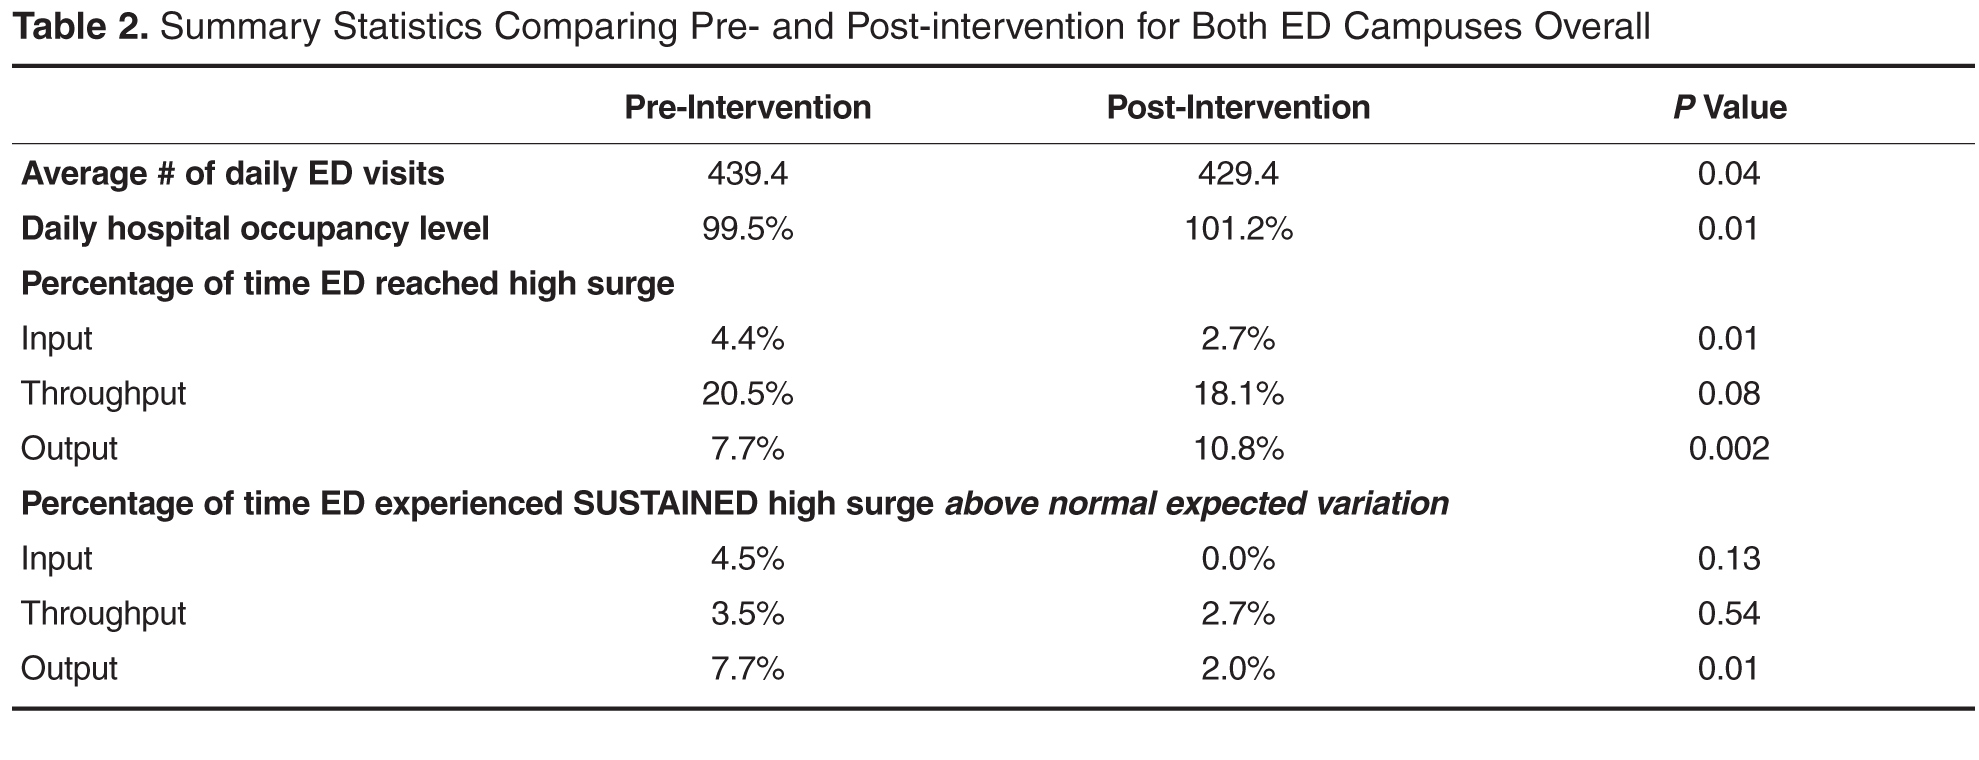
- Results: During the 6-month study period, average daily hospital occupancy levels rose above 100% (pre 99.5%, post 101.2%; P = 0.01) and frequency of high surges in the output component increased (pre 7.7%, post 10.8%; P = 0.002). Despite this, frequency of sustained high surges remained stable for input (pre 4.5%, post 0.0%; P = 0.13) and throughput (pre 3.5%, post 2.7%; P = 0.54), while improvement in output reached statistical significance (pre 7.7%, post 2.0%, P = 0.01).
- Conclusions: The ED surge protocol led to effective containment of daily high surges despite significant increase in hospital occupancy levels. This is the first study to describe an ED surge plan capable of identifying within which ITO component surge is happening and linking actions to address specific causes. We believe this protocol can be adapted for any ED.
Emergency department (ED) crowding has been defined as “a situation where the demand for emergency services exceeds the ability to provide care in a reasonable amount of time” [1]. Crowding is an increasingly common occurrence in hospital-based EDs, and overcrowding of EDs has been shown to adversely affect the delivery of emergency care and results in increased patient morbidity and mortality [2,3]. Furthermore, the nature of medical emergencies dictates that rapid daily changes (or surges) in patient volume and acuity occur frequently and unpredictably, contributing to the difficulty of matching resources to demands. Accurate understanding and continuous measurement of where bottlenecks may be occurring within an ED are critical to an effective response to ED surges.
Many of the widely used measurement tools for overcrowding produce one final overall net value on a one-dimensional scale, failing to capture the complexity of the root causes of surges. For example, the National ED Overcrowding Study (NEDOCS) scoring system, validated at various centers and widely used and studied [5–7] utilizes a number of institutional and situational variables to calculate a final NEDOCS score, which translates to “Not Busy,” “Busy,” “Overcrowded,” “Severely Overcrowded,” or “Dangerously Overcrowded” as a global state. Other published scoring systems such as the Emergency Department Work Index (EDWIN), while performing well in comparison to subjective impressions of physicians and nurses, also suffers from computation of a single final score, which makes it difficult to tie to specific actions or solutions [8]. Other surrogate markers quantifying ED crowding have also been used, such as left-without-being-seen rates, ambulance diversions, and total number of boarded patients in the ED; yet they too only measure consequences of crowding and provide little diagnostic information on when and where specific ED surges are actually happening throughout the day [9].
Responding to ED Surges
An effective surge plan should ensure the delivery of safe, effective care in response to various input/throughput/output surges in a coordinated and standardized manner. The ideal ED surge plan should include (1) a prospective continuous tool/method that accurately gauges the surge level (based on objective measures) in various components of the Input-Throughput-Output model of the department, (2) standardized targeted actions that are tied to specific triggers identified within that model to ensure effective solutions, and (3) built-in contingency plans for escalation in the face of sustained/worsening surges. Few studies have been published describing successful implementation of ED surge protocols, with the majority being linked to global ED crowding measures such as the NEDOCS score [10]. As a result, it is difficult to tease out the specific targeted actions that are most effective in dealing with the root causes of a surge.
Local Problem
Prior to the quality improvement initiative we describe below, the Ottawa Hospital ED had no formal process or method of measuring daily surges nor any standardized action plan to respond effectively to those surges. The state of “busy-ness” was often defined by gut feelings of frontline workers, which was quite variable depending on the individuals in charge of departmental patient flow. Often, actions to try and mitigate rising ED surges were triggered too late, resulting in consistent gridlock in the ED that lasted many hours. Several near-misses as well as actual critical incidences had occurred as a result of ineffective management of ED surges, and the authors of this initiative were tasked by senior hospital leadership with designing and implementing a novel solution.
Objectives
We describe our approach to the development, implementation, and evaluation of a novel ED surge protocol at a tertiary care academic hospital based on the principles cited above. Specifically, we sought to:
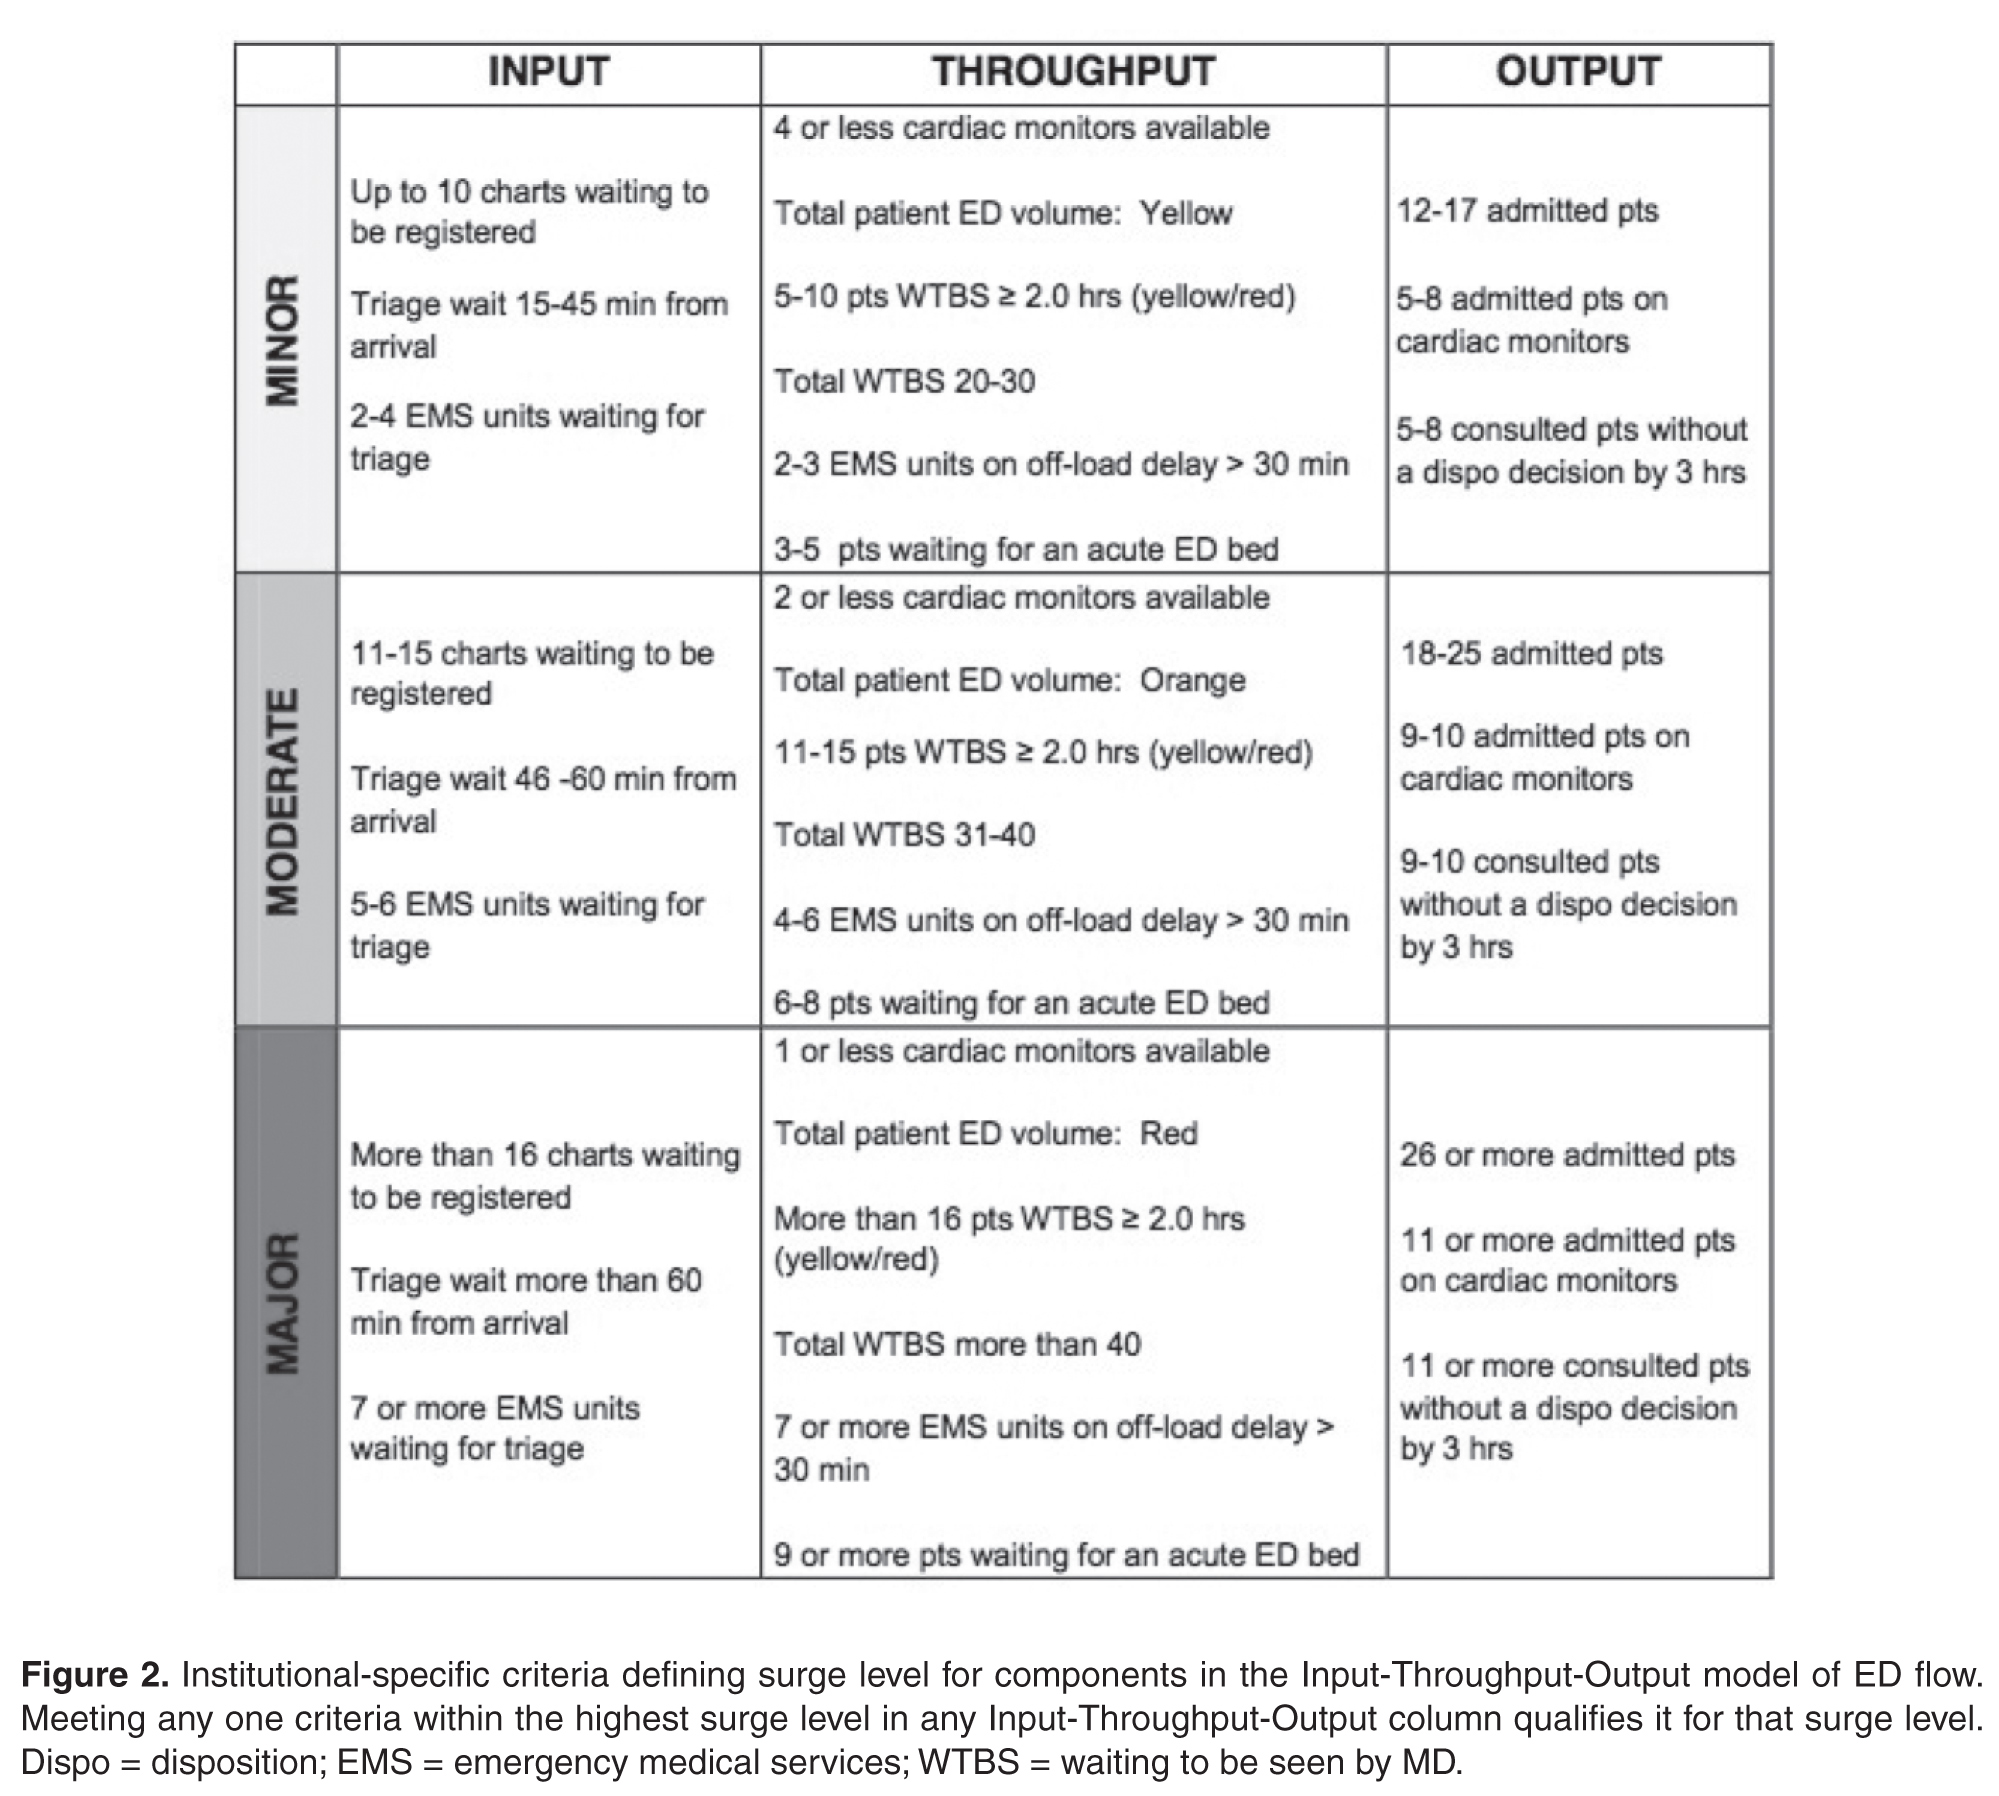
- define various levels of ED surge and to provide a common language for better communication between all stakeholders
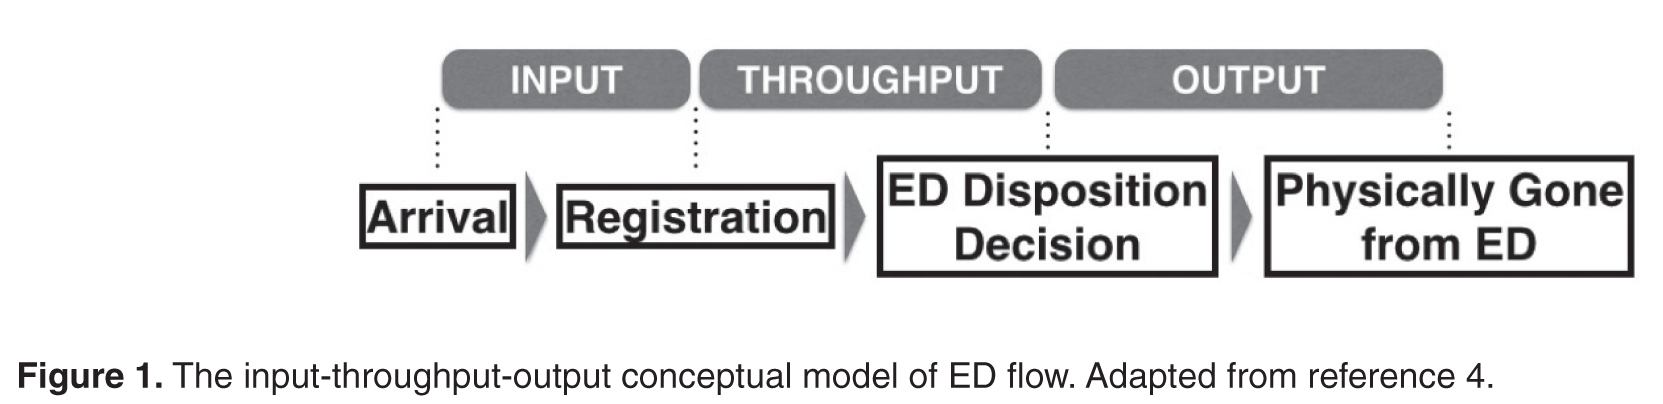
- incorporate the validated Input-Throughput-Output model of ED flow to provide a conceptual framework for measuring surges in real-time and developing targeted action plans
- standardize ED and organizational responses to various ED surges based on identified bottlenecks
- measure and evaluate the effectiveness of the ED surge plan implementation
- continuously modify and improve the ED surge protocol using quality improvement strategies
Methods
Setting
The Ottawa Hospital is an academic tertiary care center with 3 campuses (Civic, General, and Riverside), with the ED providing coverage at 2 physical emergency rooms. The hospital is the regional trauma center as well as referral destination for many subspecialties such as cardiac, vascular and neurosurgical emergencies. This 1163-bed facility handles over 160,000 emergency visits a year, over 1 million ambulatory care visits a year, and roughly 35,000 surgical cases annually. The ED is staffed by 78 staff physicians, approximately 250 registered nurses (RNs), and ~50 emergency medicine residents/trainees.
The EDs are supported by a computerized tracking system that provides real-time metrics. This information is displayed by ED-specific geographical area on electronic whiteboards, which can be accessed on overhead monitors, desktop computers, and personal iPads. Information available to ED physicians and staff at any time includes individual-level data such as location, demographics, Canadian Triage Acuity Score (CTAS), and presenting complaint as well as departmental-level data such as patient volumes, wait times, length of stay (LOS), pending/completed diagnostics, consultation status and final dispositions.
According to the policy and standard operating procedures that govern research at the Ottawa Hospital Research Institute, this work met criteria for quality improvement activities exempt from ethics review.
Intervention
Over a 4-day period care facilitators were polled on an hourly basis to determine what factors were important to the in determining how “busy” they perceived the ED to be. These factors included but were not limited to: total number of patients waiting to be seen; time to physician initial assessment; number of monitored beds available; and number of admitted patients boarded in the ED. Analysis was done to prospectively compare their perception of surge levels to the proposed Surge Plan metrics, and to ensure that the individual criteria for each level was practically meaningful and accurate.
Next, a set of standardized action and response plans were developed and agreed upon that tied specifically to a corresponding component of the different measured ED surge levels (these action plans are detailed in an online Appendix and are also available from the author). The fundamental guiding principles behind the development of each action item was that it should (1) target underlying causes - in a standardized way - specific to the relevant Input-Throughput-Output surge, (2) provide escalating level of effectiveness for each corresponding escalation in the surge level (eg, contacting a staff physician directly for a disposition decision for patents consulted in the ED, if the resident trainees have failed to do so in a timely manner), and (3) coordinate actions by various stakeholders in a planned and organized manner. Practically, the standardized targeted actions span across 5 different roles, which were explicitly listed on action sheets for care facilitators, clinical managers, patient flow managers, evening and night coordinators, and clinical directors.
Stakeholder Engagement

Implementation and Continuous Improvement
Given the complexity of the ED- and hospital-wide nature of the surge protocol, implementation was done over multiple phases and Plan-Do-Study-Act (PDSA) improvement cycles:
Phase I (Apr 2013 - Jun 2013)
The initial proposed ED surge level metrics were measured at a single ED campus. Care facilitators were trained and asked to measure surge levels in the ED every 2 hours. This served as a testing period to gauge the sensitivity and reliability of our proposed surge level metrics, and no actual action items were triggered during this period. Stakeholder meetings were held to determine feasibility of the plan, validate the proposed metrics, and develop “standard work” action plans for each stakeholder group in response to the metrics. This first phase also allowed care facilitators to objectively reflect on ED surge patterns throughout the day, and provided everyone in the ED team a frequent global snapshot of how “busy” the department was at any time. Finally, surge level data during this phase confirmed previous suspicions that the Output component was the biggest driver behind overall ED surge level.
Throughout this phase, the ED clinical manager recorded all the usual actions taken in response to the different level of surges as felt appropriate by the individual care facilitator on duty. The variety of actions and types of escalations were collected and fed back to weekly workgroup meetings to help further refine crafting of standardized action plans for implementation of the surge protocol.
Phase II (June - Aug 2013)
An initial trial of a limited ED surge protocol was rolled out at both ED campuses, with actual action items being triggered in response to specific surge level metrics. The main focus of this PDSA cycle was to collect data on how the care facilitator groups at the 2 campuses utilized the surge protocol, as well as feedback on usability, barriers, and effectiveness. Regular audits were performed to ensure surge measurement and compliance rates. Educational sessions were provided regarding rationale and purpose of the plan so that all team members had a better understanding of ED surges. Frequent meetings with stakeholders to share updates continued throughout Phase II, allowing further engagement as well as fine-tuning of stakeholder action plans based on real-time experiences.
Phase III (Aug 2013 - Dec 2013)
The next phase of implementation expanded beyond the ED and included the hospital’s off-hours and off-service management group. This in effect was the official corporate roll-out of the ED surge protocol including full action plans for all stakeholders, including off-service clinical administrators, inpatient flow managers, and the director of emergency and critical care. Regular audits were performed to ensure compliance of measurement every 2 hours as well as performance of specified action items related to each surge level, with the actual surge level measurement completion rates of 98%.
Data Collection and Analysis
Over the study period April 2013 to December 2013 at the Civic campus and June 2013 to December 2013 at the General campus, ED surge levels were measured every 2 hours by the care facilitators and manually recorded in standardized ED surge protocol booklets. These were subsequently entered into Excel database for tracking and data analysis. Patient volumes and hospital occupancy levels were recorded daily. Perceptions of the primary users of the surge protocol (ie, care facilitators) were obtained via standardized interviews and polls. We present descriptive statistics and statistical process control (SPC) charts. Chi-squared test was performed for comparison of pre- and post-intervention frequencies of outcome measures.
Outcome Measures
The main outcome measure was the frequency of sustained (≥ 6 hours) high surges, a marker of inability to respond effectively. High surges were defined as Moderate and Major surges combined. Our expert group consensus was that combinging the Moderate and Major surge categories to represent “high” surge was reasonable since they both require mobilizing resources on a hospital-wide level, and failure to improve despite 6 continuous hours of actively trying to address such high surges would lead to significantly higher risk for quality of care and patient safety issues.
Secondary outcomes include overall frequency of reaching high surge levels at various components of the Input-Throughput-Output ED flow model, hospital occupancy levels, and care facilitators’ perceptions on workload and overall effectiveness of the surge protocol.
Results
ED Flow
Statistical Process Control Charts
Survey of Care Facilitators
The primary users and drivers of the surge protocol—the care facilitator group—felt strongly that the tool was easy to use and that it made a positive difference. 72% felt that the ED surge protocol has increased their workload but 92% felt that it was good for overall flow of the ED. Specific feedback included having a much more standardized language around communicating (and acting on) surges, and a better overall bird’s-eye view of the department.
Discussion
Despite a call for urgent research on implementing solutions targeting daily ED surges (vs. global ED crowding) over a decade ago at the Academic Emergency Medicine 2006 Consensus Conference [12], little work has been published on distinguishing, measuring, and dealing with ED surges. McCarthy et al proposed the rate of patient arrivals to the ED by time of day as a rudimentary definition of surge, although they provided very little specific guidance on what to do with that information in the setting of responding to spikes in surges [13]. Asplin et al described a number of theoretical models to bridge ED census, daily surges, length of stay and quality of care, however they were never validated in real-life scenarios [14]. A systematic review published in 2009 summarizing articles that described theoretical and practical ED surge responses found a large heterogeneity of different proposed models with little standardization and multiple shortcomings [15].
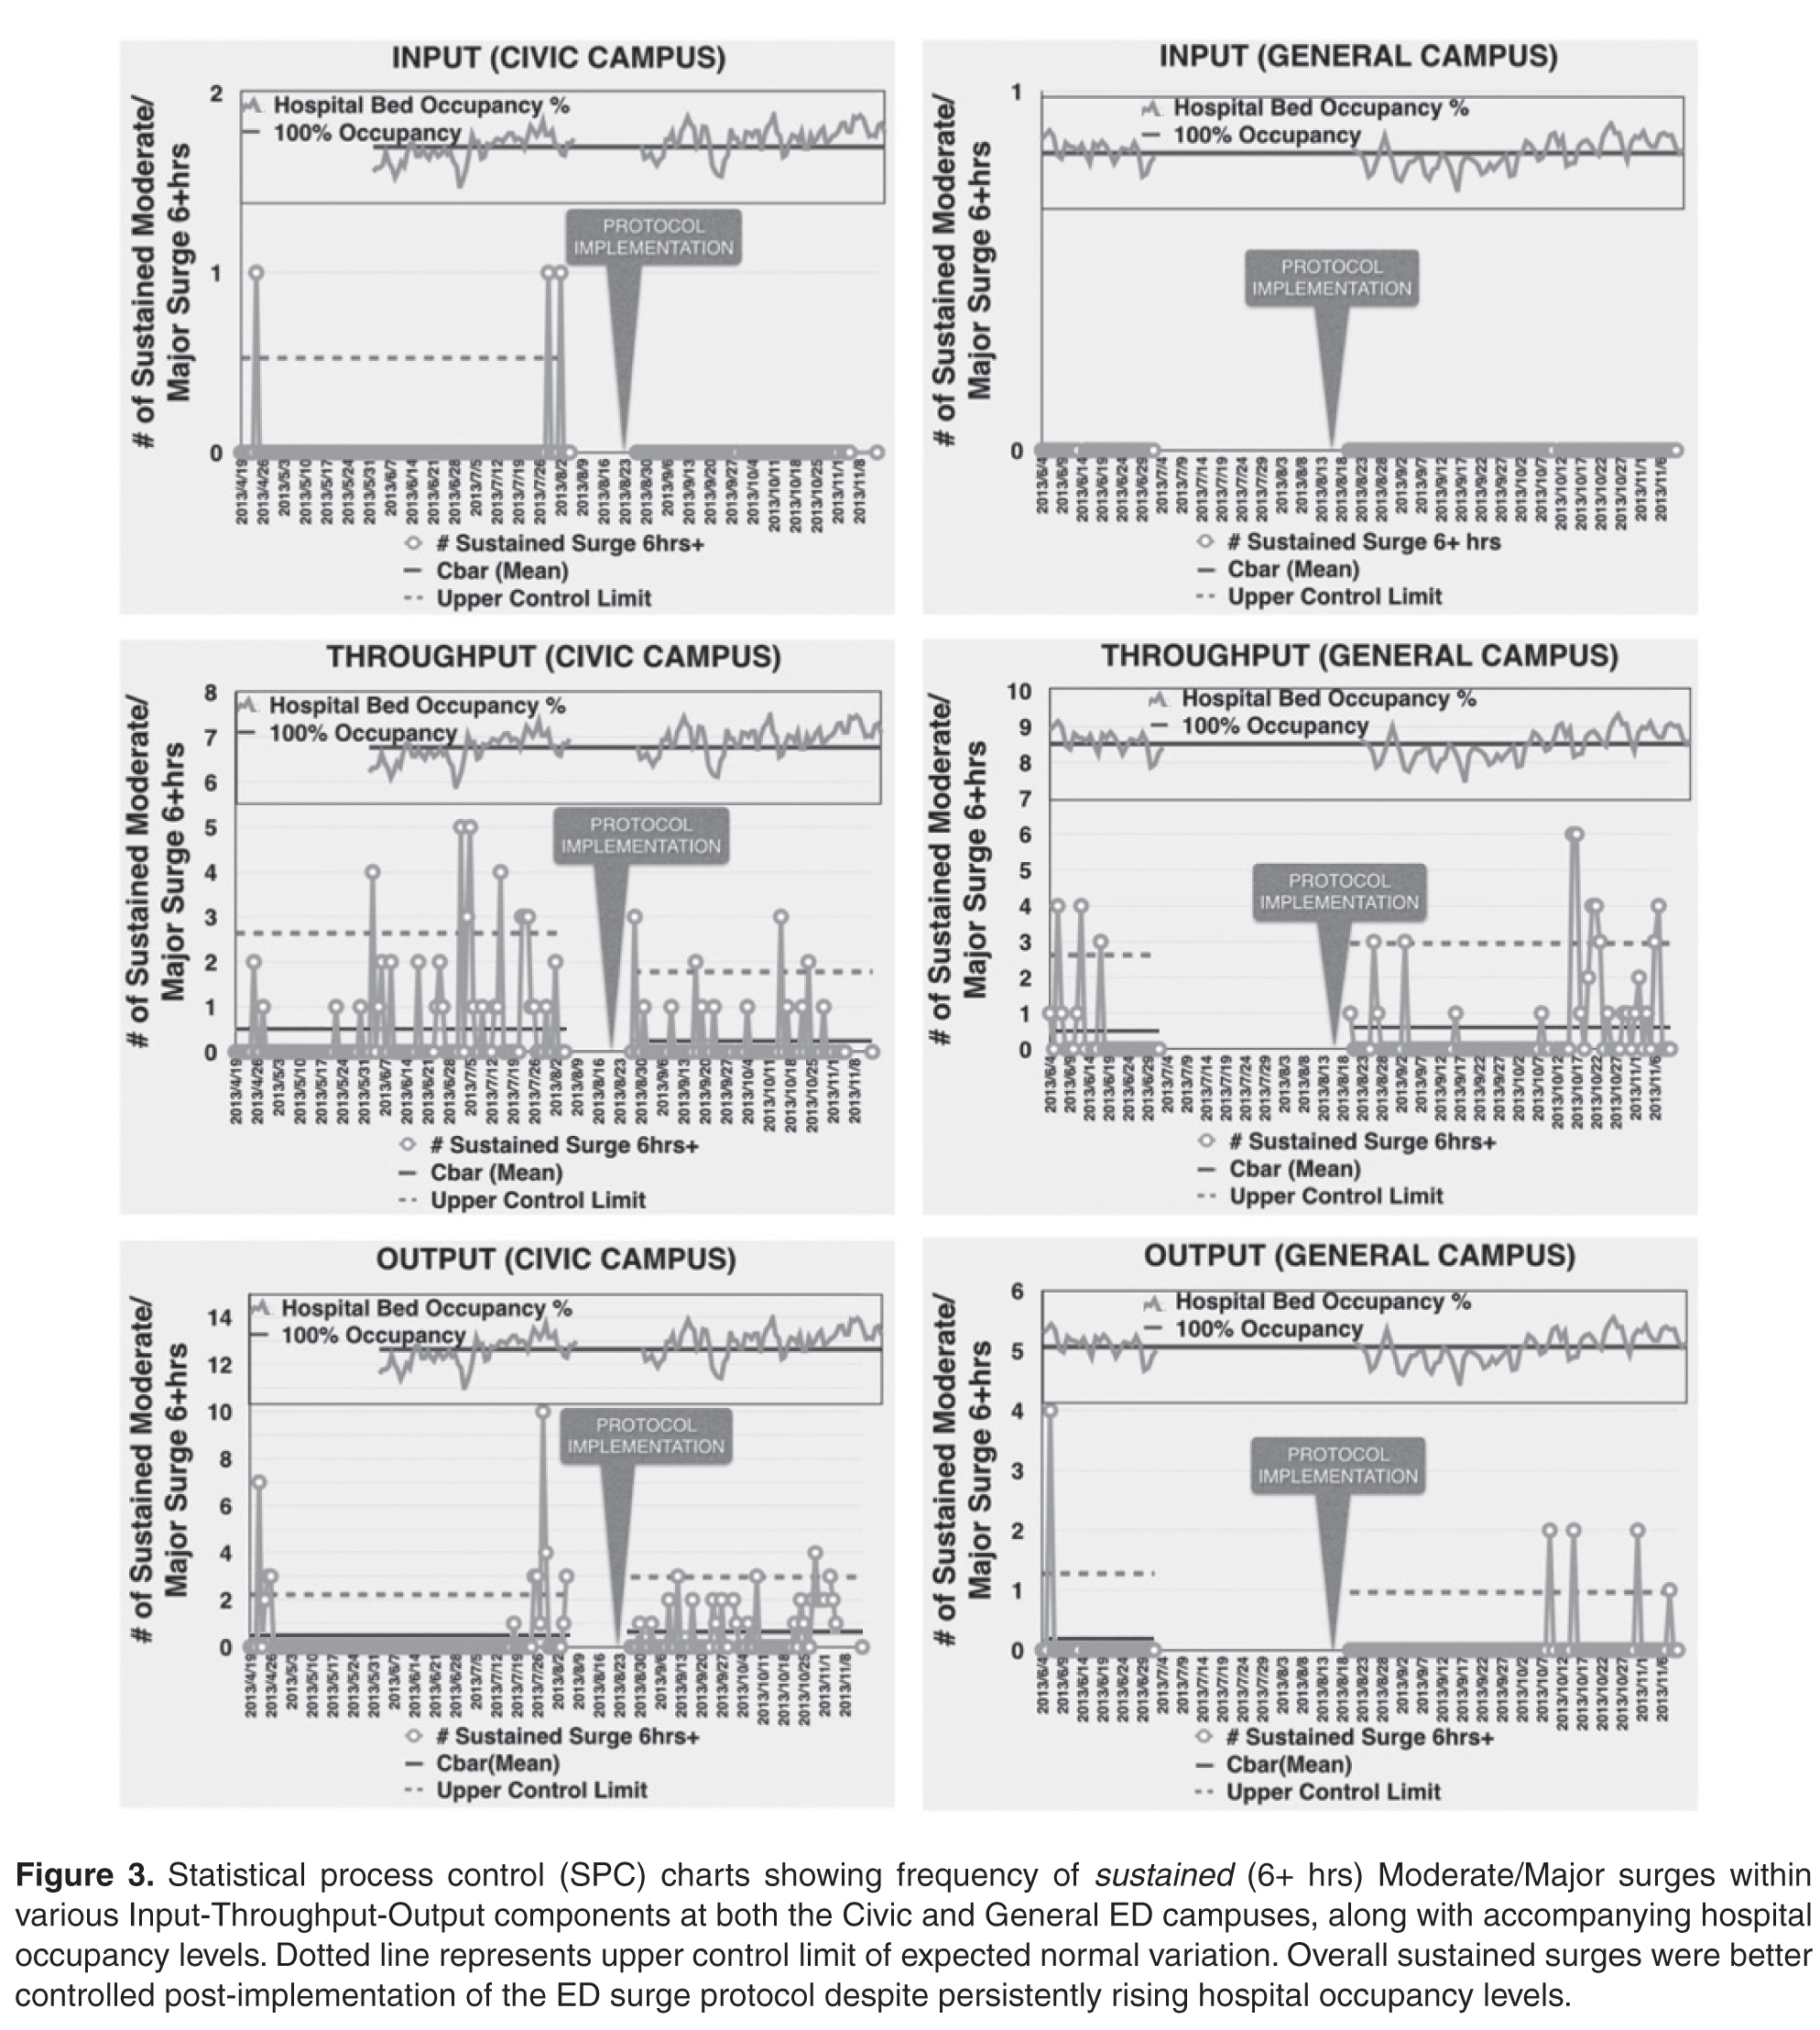
To our knowledge, this study is the first to report on the actual development, implementation, and evaluation of a daily ED surge protocol that utilizes a widely accepted conceptual model of ED flow. Unlike single global measure of ED crowding, our protocol measures frequent surge levels for various Input-Throughput-Output components of the ED, which are tied directly to standardized specific actions to address underlying root causes. Despite continued rise in hospital occupant levels and budgetary restraints, we found a improvement in the number of times the ED actually hit severe surges with the exception of Output, which is expected since this component of the flow model is intimately tied to hospital occupant levels. When severe surges did happen, we were able to deal with them much more effectively and efficiently, resulting in an overall decrease in sustained surges in the ED including the Output component.
Limitations
Similar to other pragmatic quality improvement projects that rely on manual processes, it was difficult to ensure absolute compliance of surge level measurements throughout the study period. As a result, there were occasional missing surge level data at various times of different days. However, we believe these are relatively nonsignificant occurrences that balanced out over the pre- and post-implementation periods. In addition, we did not have the resources to robustly record and confirm completion of specific action items that were activated in response to various surge levels, although we did confirm verbally with frontline workers regularly that those actions were done. Future Plan-Do-Study-Act cycles will focus on explicit measurement of actual completed action items and further refinement of targeted responses to surge. Finally, while we were able to only collect and present data over a relatively short period of evaluation (and thus potentially susceptible to seasonal variations in ED flow), we believe that our data does support the surge protocol’s effectiveness when compared to the robust trend of hospital occupant levels.
Future Directions
This ED surge protocol can be adapted and modified to fit any ED. The specific criteria defining Minor/Moderate/Major surges can be set up as ratios or percentages relative to total number of monitors, beds, etc., available. The principles of linking actions directly to specific triggers within each Input/Throughput/Output category could be translated to fit any-sized organization. Currently in progress is a longer evaluation period and based upon the results as well as individual feedback, necessary adjustments to our definitions, criteria and action items will be considered as part of ongoing quality improvement. The principles of our surge protocol are not limited to the ED, and we will explore its implementation in other hospital departments as well as methods to link them together in alignment with the hospital’s overall corporate strategy in tackling overcrowding.
Conclusion
In summary, implementation of this novel ED surge protocol led to a more effective response and management of high surges, despite significant increase in overall hospital occupancy rates and associated frequency of surges in the Output component of the ED flow model. Our surge measurement tool is capable of identifying within which area of the ED surges are occurring, and our ED surge protocol links specific actions to address those specific root causes. We believe this will lead not only to more accurate assessments of overall ED crowding but also to more timely and effective departmental and institutional responses.
Corresponding author: Dr. Edmund S.H. Kwok, Dept. of Emergency Medicine, Ottawa Hospital, Civic Campus, 1053 Carling Ave., Ottawa, ON, Canada K1Y 4E9, ekwok@toh.on.ca.
Financial disclosures: None.
1. Bond K. Interventions to reduce overcrowding in emergency departments. [Technology report no 67.4]. Ottawa: Canadian Agency for Drugs and Technologies in Health; 2006.
2. Richardson DB, et al. Increase in patient mortality at 10 days associated with emergency department overcrowding. Med J Aust 2006;184:213–6.
3. Sprivulis PC, et al. The association between hospital overcrowding and mortality among patients admitted via Western Australian emergency departments. Med J Aust 2006; 184:208–12.
4. Asplin BR, Magid DJ, Rhodes KV, et al. A conceptual model of emergency department crowding. Ann Emerg Med 2003; 42:173–80.
5. Affleck A, Parks P, Drummond A, et al. Emergency department overcrowding and access block. CAEP Position Statement. CJEM 2013;15:359–70.
6. Weiss SJ, Derlet R, Arndahl J, et al. Estimating the degree of emergency department overcrowding in academic medical centers: results of the National ED Overcrowding Study (NEDOCS). Acad Emerg Med 2004;11:38–50.
7. Weiss SJ, Ernst AA, Nick TG. Comparison of the National Emergency Department Overcrowding Scale and the Emergency Department Work Index for quantifying emergency department crowding. Acad Emerg Med 2006;13:513–8.
8. Jones SS, Allen TL, Welch SJ. An independent evaluation of four quantitative emergency department crowding scales. Acad Emerg Med 2006;13:1204–11
9. Bernstein SL, Verghese V, Leung W, et al. Development and validation of a new index to measure emergency department crowding. Acad Emerg Med 2003;10:938–42
10. General Accounting Office. Hospital emergency departments–crowded conditions vary among hospitals and communities. GAO-03-460. Washington, DC: US General Accounting Office; 2003.
11. Moseley MG, Dickerson CL, Kasey J, et al. Surge: a organizational response to emergency department overcrowding. J Clin Outcomes Manage 2010;17:453–7.
12. Jenkins JL, O’Connor RE, Cone DC. Differentiating large-scale surge versus daily surge. Acad Emerg Med 2006; 13:1169–72.
13. McCarthy ML, Aronsky D, Kelen GD. The measurement of daily surge and its relevance to disaster preparedness. Acad Emerg Med 2006; 13:1138–41.
14. Asplin BR, Flottemesch TJ, Gordon B. Developing models for patient flow and daily surge capacity research. Acad Emerg Med 2006;13:1109–13.
15. Nager AL, Khanna K. Emergency department surge: models and practical implications. J Trauma 2009; 67(2 Suppl):S96–9.
From the Ottawa Hospital, Ottawa, ON Canada.
Abstract
- Objective: Fluctuations in emergency department (ED) visits occur frequently, and traditional global measures of ED crowding do not allow for targeted responses to address root causes. We sought to develop, implement, and evaluate a novel ED surge protocol based on the input-throughput-output (ITO) model of ED flow.
- Methods: This initiative took place at a tertiary care academic teaching hospital. An inter-professional group developed and validated metrics for various levels of surge in relation to the ITO model, measured every 2 hours, which directly linked to specific actions targeting root causes within those components. Main outcome measure was defined as the frequency of sustained (≥ 6 hours) high surges, a marker of inability to respond effectively.
- Results: During the 6-month study period, average daily hospital occupancy levels rose above 100% (pre 99.5%, post 101.2%; P = 0.01) and frequency of high surges in the output component increased (pre 7.7%, post 10.8%; P = 0.002). Despite this, frequency of sustained high surges remained stable for input (pre 4.5%, post 0.0%; P = 0.13) and throughput (pre 3.5%, post 2.7%; P = 0.54), while improvement in output reached statistical significance (pre 7.7%, post 2.0%, P = 0.01).
- Conclusions: The ED surge protocol led to effective containment of daily high surges despite significant increase in hospital occupancy levels. This is the first study to describe an ED surge plan capable of identifying within which ITO component surge is happening and linking actions to address specific causes. We believe this protocol can be adapted for any ED.
Emergency department (ED) crowding has been defined as “a situation where the demand for emergency services exceeds the ability to provide care in a reasonable amount of time” [1]. Crowding is an increasingly common occurrence in hospital-based EDs, and overcrowding of EDs has been shown to adversely affect the delivery of emergency care and results in increased patient morbidity and mortality [2,3]. Furthermore, the nature of medical emergencies dictates that rapid daily changes (or surges) in patient volume and acuity occur frequently and unpredictably, contributing to the difficulty of matching resources to demands. Accurate understanding and continuous measurement of where bottlenecks may be occurring within an ED are critical to an effective response to ED surges.
Many of the widely used measurement tools for overcrowding produce one final overall net value on a one-dimensional scale, failing to capture the complexity of the root causes of surges. For example, the National ED Overcrowding Study (NEDOCS) scoring system, validated at various centers and widely used and studied [5–7] utilizes a number of institutional and situational variables to calculate a final NEDOCS score, which translates to “Not Busy,” “Busy,” “Overcrowded,” “Severely Overcrowded,” or “Dangerously Overcrowded” as a global state. Other published scoring systems such as the Emergency Department Work Index (EDWIN), while performing well in comparison to subjective impressions of physicians and nurses, also suffers from computation of a single final score, which makes it difficult to tie to specific actions or solutions [8]. Other surrogate markers quantifying ED crowding have also been used, such as left-without-being-seen rates, ambulance diversions, and total number of boarded patients in the ED; yet they too only measure consequences of crowding and provide little diagnostic information on when and where specific ED surges are actually happening throughout the day [9].
Responding to ED Surges
An effective surge plan should ensure the delivery of safe, effective care in response to various input/throughput/output surges in a coordinated and standardized manner. The ideal ED surge plan should include (1) a prospective continuous tool/method that accurately gauges the surge level (based on objective measures) in various components of the Input-Throughput-Output model of the department, (2) standardized targeted actions that are tied to specific triggers identified within that model to ensure effective solutions, and (3) built-in contingency plans for escalation in the face of sustained/worsening surges. Few studies have been published describing successful implementation of ED surge protocols, with the majority being linked to global ED crowding measures such as the NEDOCS score [10]. As a result, it is difficult to tease out the specific targeted actions that are most effective in dealing with the root causes of a surge.
Local Problem
Prior to the quality improvement initiative we describe below, the Ottawa Hospital ED had no formal process or method of measuring daily surges nor any standardized action plan to respond effectively to those surges. The state of “busy-ness” was often defined by gut feelings of frontline workers, which was quite variable depending on the individuals in charge of departmental patient flow. Often, actions to try and mitigate rising ED surges were triggered too late, resulting in consistent gridlock in the ED that lasted many hours. Several near-misses as well as actual critical incidences had occurred as a result of ineffective management of ED surges, and the authors of this initiative were tasked by senior hospital leadership with designing and implementing a novel solution.
Objectives
We describe our approach to the development, implementation, and evaluation of a novel ED surge protocol at a tertiary care academic hospital based on the principles cited above. Specifically, we sought to:
- define various levels of ED surge and to provide a common language for better communication between all stakeholders
- incorporate the validated Input-Throughput-Output model of ED flow to provide a conceptual framework for measuring surges in real-time and developing targeted action plans
- standardize ED and organizational responses to various ED surges based on identified bottlenecks
- measure and evaluate the effectiveness of the ED surge plan implementation
- continuously modify and improve the ED surge protocol using quality improvement strategies
Methods
Setting
The Ottawa Hospital is an academic tertiary care center with 3 campuses (Civic, General, and Riverside), with the ED providing coverage at 2 physical emergency rooms. The hospital is the regional trauma center as well as referral destination for many subspecialties such as cardiac, vascular and neurosurgical emergencies. This 1163-bed facility handles over 160,000 emergency visits a year, over 1 million ambulatory care visits a year, and roughly 35,000 surgical cases annually. The ED is staffed by 78 staff physicians, approximately 250 registered nurses (RNs), and ~50 emergency medicine residents/trainees.
The EDs are supported by a computerized tracking system that provides real-time metrics. This information is displayed by ED-specific geographical area on electronic whiteboards, which can be accessed on overhead monitors, desktop computers, and personal iPads. Information available to ED physicians and staff at any time includes individual-level data such as location, demographics, Canadian Triage Acuity Score (CTAS), and presenting complaint as well as departmental-level data such as patient volumes, wait times, length of stay (LOS), pending/completed diagnostics, consultation status and final dispositions.
According to the policy and standard operating procedures that govern research at the Ottawa Hospital Research Institute, this work met criteria for quality improvement activities exempt from ethics review.
Intervention
Over a 4-day period care facilitators were polled on an hourly basis to determine what factors were important to the in determining how “busy” they perceived the ED to be. These factors included but were not limited to: total number of patients waiting to be seen; time to physician initial assessment; number of monitored beds available; and number of admitted patients boarded in the ED. Analysis was done to prospectively compare their perception of surge levels to the proposed Surge Plan metrics, and to ensure that the individual criteria for each level was practically meaningful and accurate.
Next, a set of standardized action and response plans were developed and agreed upon that tied specifically to a corresponding component of the different measured ED surge levels (these action plans are detailed in an online Appendix and are also available from the author). The fundamental guiding principles behind the development of each action item was that it should (1) target underlying causes - in a standardized way - specific to the relevant Input-Throughput-Output surge, (2) provide escalating level of effectiveness for each corresponding escalation in the surge level (eg, contacting a staff physician directly for a disposition decision for patents consulted in the ED, if the resident trainees have failed to do so in a timely manner), and (3) coordinate actions by various stakeholders in a planned and organized manner. Practically, the standardized targeted actions span across 5 different roles, which were explicitly listed on action sheets for care facilitators, clinical managers, patient flow managers, evening and night coordinators, and clinical directors.
Stakeholder Engagement
Implementation and Continuous Improvement
Given the complexity of the ED- and hospital-wide nature of the surge protocol, implementation was done over multiple phases and Plan-Do-Study-Act (PDSA) improvement cycles:
Phase I (Apr 2013 - Jun 2013)
The initial proposed ED surge level metrics were measured at a single ED campus. Care facilitators were trained and asked to measure surge levels in the ED every 2 hours. This served as a testing period to gauge the sensitivity and reliability of our proposed surge level metrics, and no actual action items were triggered during this period. Stakeholder meetings were held to determine feasibility of the plan, validate the proposed metrics, and develop “standard work” action plans for each stakeholder group in response to the metrics. This first phase also allowed care facilitators to objectively reflect on ED surge patterns throughout the day, and provided everyone in the ED team a frequent global snapshot of how “busy” the department was at any time. Finally, surge level data during this phase confirmed previous suspicions that the Output component was the biggest driver behind overall ED surge level.
Throughout this phase, the ED clinical manager recorded all the usual actions taken in response to the different level of surges as felt appropriate by the individual care facilitator on duty. The variety of actions and types of escalations were collected and fed back to weekly workgroup meetings to help further refine crafting of standardized action plans for implementation of the surge protocol.
Phase II (June - Aug 2013)
An initial trial of a limited ED surge protocol was rolled out at both ED campuses, with actual action items being triggered in response to specific surge level metrics. The main focus of this PDSA cycle was to collect data on how the care facilitator groups at the 2 campuses utilized the surge protocol, as well as feedback on usability, barriers, and effectiveness. Regular audits were performed to ensure surge measurement and compliance rates. Educational sessions were provided regarding rationale and purpose of the plan so that all team members had a better understanding of ED surges. Frequent meetings with stakeholders to share updates continued throughout Phase II, allowing further engagement as well as fine-tuning of stakeholder action plans based on real-time experiences.
Phase III (Aug 2013 - Dec 2013)
The next phase of implementation expanded beyond the ED and included the hospital’s off-hours and off-service management group. This in effect was the official corporate roll-out of the ED surge protocol including full action plans for all stakeholders, including off-service clinical administrators, inpatient flow managers, and the director of emergency and critical care. Regular audits were performed to ensure compliance of measurement every 2 hours as well as performance of specified action items related to each surge level, with the actual surge level measurement completion rates of 98%.
Data Collection and Analysis
Over the study period April 2013 to December 2013 at the Civic campus and June 2013 to December 2013 at the General campus, ED surge levels were measured every 2 hours by the care facilitators and manually recorded in standardized ED surge protocol booklets. These were subsequently entered into Excel database for tracking and data analysis. Patient volumes and hospital occupancy levels were recorded daily. Perceptions of the primary users of the surge protocol (ie, care facilitators) were obtained via standardized interviews and polls. We present descriptive statistics and statistical process control (SPC) charts. Chi-squared test was performed for comparison of pre- and post-intervention frequencies of outcome measures.
Outcome Measures
The main outcome measure was the frequency of sustained (≥ 6 hours) high surges, a marker of inability to respond effectively. High surges were defined as Moderate and Major surges combined. Our expert group consensus was that combinging the Moderate and Major surge categories to represent “high” surge was reasonable since they both require mobilizing resources on a hospital-wide level, and failure to improve despite 6 continuous hours of actively trying to address such high surges would lead to significantly higher risk for quality of care and patient safety issues.
Secondary outcomes include overall frequency of reaching high surge levels at various components of the Input-Throughput-Output ED flow model, hospital occupancy levels, and care facilitators’ perceptions on workload and overall effectiveness of the surge protocol.
Results
ED Flow
Statistical Process Control Charts
Survey of Care Facilitators
The primary users and drivers of the surge protocol—the care facilitator group—felt strongly that the tool was easy to use and that it made a positive difference. 72% felt that the ED surge protocol has increased their workload but 92% felt that it was good for overall flow of the ED. Specific feedback included having a much more standardized language around communicating (and acting on) surges, and a better overall bird’s-eye view of the department.
Discussion
Despite a call for urgent research on implementing solutions targeting daily ED surges (vs. global ED crowding) over a decade ago at the Academic Emergency Medicine 2006 Consensus Conference [12], little work has been published on distinguishing, measuring, and dealing with ED surges. McCarthy et al proposed the rate of patient arrivals to the ED by time of day as a rudimentary definition of surge, although they provided very little specific guidance on what to do with that information in the setting of responding to spikes in surges [13]. Asplin et al described a number of theoretical models to bridge ED census, daily surges, length of stay and quality of care, however they were never validated in real-life scenarios [14]. A systematic review published in 2009 summarizing articles that described theoretical and practical ED surge responses found a large heterogeneity of different proposed models with little standardization and multiple shortcomings [15].
To our knowledge, this study is the first to report on the actual development, implementation, and evaluation of a daily ED surge protocol that utilizes a widely accepted conceptual model of ED flow. Unlike single global measure of ED crowding, our protocol measures frequent surge levels for various Input-Throughput-Output components of the ED, which are tied directly to standardized specific actions to address underlying root causes. Despite continued rise in hospital occupant levels and budgetary restraints, we found a improvement in the number of times the ED actually hit severe surges with the exception of Output, which is expected since this component of the flow model is intimately tied to hospital occupant levels. When severe surges did happen, we were able to deal with them much more effectively and efficiently, resulting in an overall decrease in sustained surges in the ED including the Output component.
Limitations
Similar to other pragmatic quality improvement projects that rely on manual processes, it was difficult to ensure absolute compliance of surge level measurements throughout the study period. As a result, there were occasional missing surge level data at various times of different days. However, we believe these are relatively nonsignificant occurrences that balanced out over the pre- and post-implementation periods. In addition, we did not have the resources to robustly record and confirm completion of specific action items that were activated in response to various surge levels, although we did confirm verbally with frontline workers regularly that those actions were done. Future Plan-Do-Study-Act cycles will focus on explicit measurement of actual completed action items and further refinement of targeted responses to surge. Finally, while we were able to only collect and present data over a relatively short period of evaluation (and thus potentially susceptible to seasonal variations in ED flow), we believe that our data does support the surge protocol’s effectiveness when compared to the robust trend of hospital occupant levels.
Future Directions
This ED surge protocol can be adapted and modified to fit any ED. The specific criteria defining Minor/Moderate/Major surges can be set up as ratios or percentages relative to total number of monitors, beds, etc., available. The principles of linking actions directly to specific triggers within each Input/Throughput/Output category could be translated to fit any-sized organization. Currently in progress is a longer evaluation period and based upon the results as well as individual feedback, necessary adjustments to our definitions, criteria and action items will be considered as part of ongoing quality improvement. The principles of our surge protocol are not limited to the ED, and we will explore its implementation in other hospital departments as well as methods to link them together in alignment with the hospital’s overall corporate strategy in tackling overcrowding.
Conclusion
In summary, implementation of this novel ED surge protocol led to a more effective response and management of high surges, despite significant increase in overall hospital occupancy rates and associated frequency of surges in the Output component of the ED flow model. Our surge measurement tool is capable of identifying within which area of the ED surges are occurring, and our ED surge protocol links specific actions to address those specific root causes. We believe this will lead not only to more accurate assessments of overall ED crowding but also to more timely and effective departmental and institutional responses.
Corresponding author: Dr. Edmund S.H. Kwok, Dept. of Emergency Medicine, Ottawa Hospital, Civic Campus, 1053 Carling Ave., Ottawa, ON, Canada K1Y 4E9, ekwok@toh.on.ca.
Financial disclosures: None.
1. Bond K. Interventions to reduce overcrowding in emergency departments. [Technology report no 67.4]. Ottawa: Canadian Agency for Drugs and Technologies in Health; 2006.
2. Richardson DB, et al. Increase in patient mortality at 10 days associated with emergency department overcrowding. Med J Aust 2006;184:213–6.
3. Sprivulis PC, et al. The association between hospital overcrowding and mortality among patients admitted via Western Australian emergency departments. Med J Aust 2006; 184:208–12.
4. Asplin BR, Magid DJ, Rhodes KV, et al. A conceptual model of emergency department crowding. Ann Emerg Med 2003; 42:173–80.
5. Affleck A, Parks P, Drummond A, et al. Emergency department overcrowding and access block. CAEP Position Statement. CJEM 2013;15:359–70.
6. Weiss SJ, Derlet R, Arndahl J, et al. Estimating the degree of emergency department overcrowding in academic medical centers: results of the National ED Overcrowding Study (NEDOCS). Acad Emerg Med 2004;11:38–50.
7. Weiss SJ, Ernst AA, Nick TG. Comparison of the National Emergency Department Overcrowding Scale and the Emergency Department Work Index for quantifying emergency department crowding. Acad Emerg Med 2006;13:513–8.
8. Jones SS, Allen TL, Welch SJ. An independent evaluation of four quantitative emergency department crowding scales. Acad Emerg Med 2006;13:1204–11
9. Bernstein SL, Verghese V, Leung W, et al. Development and validation of a new index to measure emergency department crowding. Acad Emerg Med 2003;10:938–42
10. General Accounting Office. Hospital emergency departments–crowded conditions vary among hospitals and communities. GAO-03-460. Washington, DC: US General Accounting Office; 2003.
11. Moseley MG, Dickerson CL, Kasey J, et al. Surge: a organizational response to emergency department overcrowding. J Clin Outcomes Manage 2010;17:453–7.
12. Jenkins JL, O’Connor RE, Cone DC. Differentiating large-scale surge versus daily surge. Acad Emerg Med 2006; 13:1169–72.
13. McCarthy ML, Aronsky D, Kelen GD. The measurement of daily surge and its relevance to disaster preparedness. Acad Emerg Med 2006; 13:1138–41.
14. Asplin BR, Flottemesch TJ, Gordon B. Developing models for patient flow and daily surge capacity research. Acad Emerg Med 2006;13:1109–13.
15. Nager AL, Khanna K. Emergency department surge: models and practical implications. J Trauma 2009; 67(2 Suppl):S96–9.