User login
“I have the best job in the world.” This statement sums up how your colleagues feel about being a PA. Although there are certainly problems that deserve attention, the vast majority of clinicians, who are highly educated and practice in all specialties, state that they would re-enter the field if choosing again.
On the following pages, we focus on the details of the survey results, with breakouts by specialty, region, and practice setting. Be sure to check out which benefits your colleagues are getting, how much they’re being reimbursed for continuing medical education, information about salary by gender and time spent during the workweek, and much more. Participants, invited to comment, have provided several illuminating quotes, which we’ve included throughout the article, indicating what it’s like to be “in the trenches.”
WOULD YOU REPEAT THIS?
To get to the heart of the matter, we asked our survey takers “If you were to do it again, would you choose…”
- The same career
- The same educational preparation
- The same practice setting
To see what your colleagues said, go to the next page

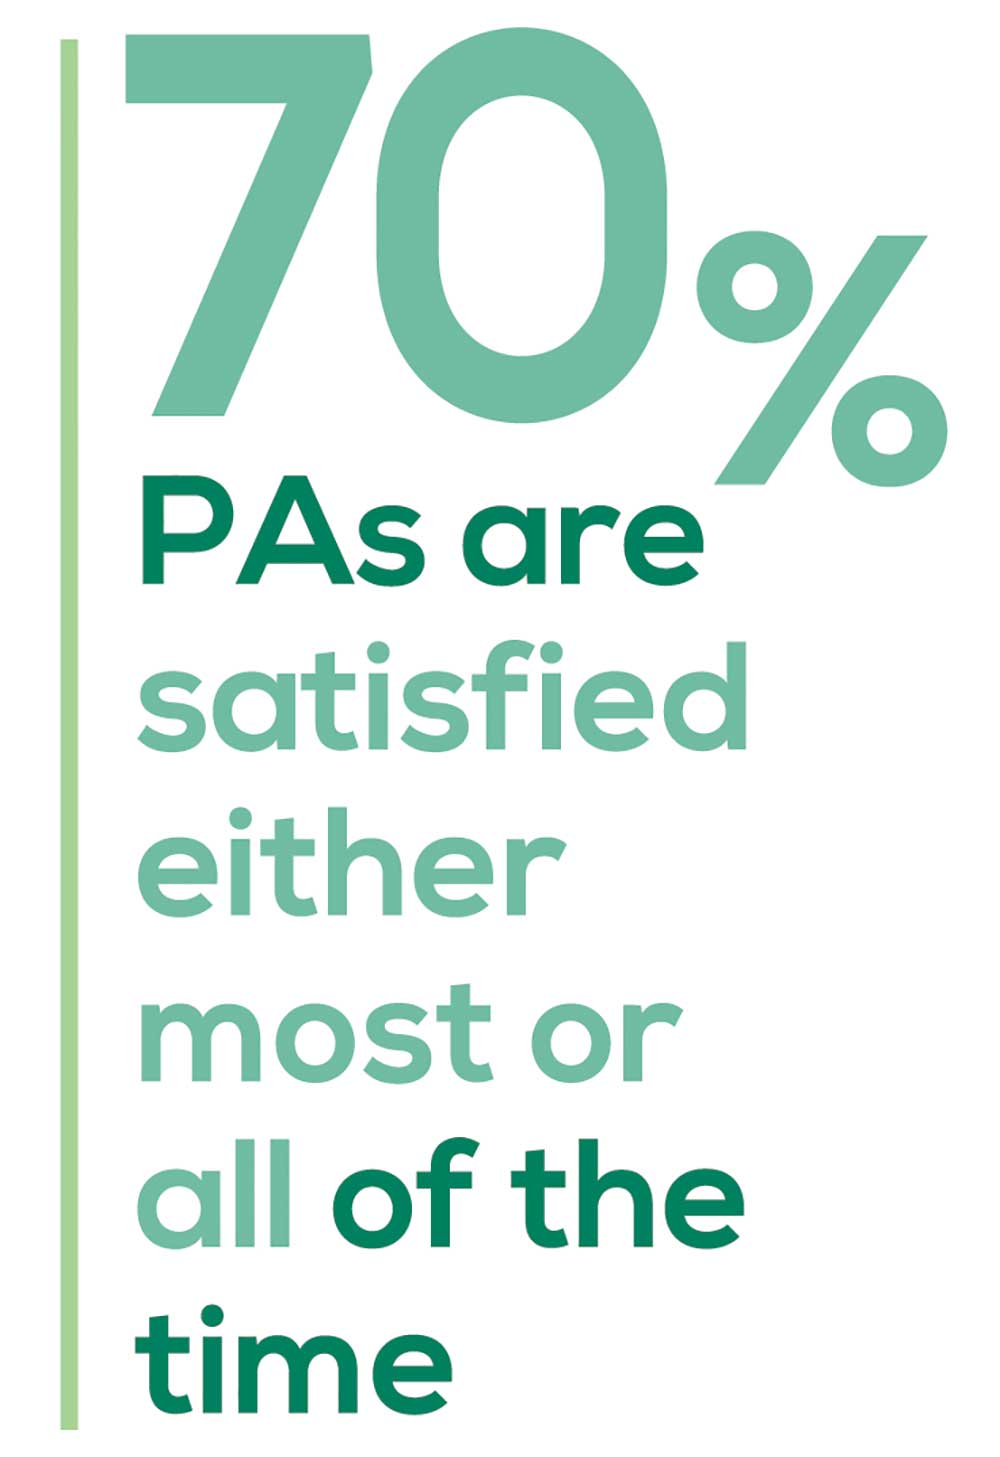
The majority of your peers gave an enthusiastic thumbs up to PA practice as a profession choice. Knowing what you know now, 86% of you agreed that you would follow the same career path today as when you entered practice, which is up 5% from last year.
Educational preparation came in for a ringing endorsement, increasing since last year’s survey results (a 3% increase), and practice setting remained virtually the same.
Of PAs in practice between < 1 and 5 years, 94% felt their educational training was adequate; 53% felt their current responsibilities matched their expectations accurately; and 74% said their career expectations were met.
WOULD YOU TAKE A NEW JOB TODAY?
Continuing to probe about your level of satisfaction, we asked how you feel about changing your job. The answer choices were, “I would…”
- Change my job if I could get a better one (ie, better paid)
- Take any other job in which I could earn as much as I do now (ie, Yes, to leave the profession)
- Change both my job and my occupation (ie, I am burned out)
- Not make any changes (ie, No, not for any reason)
We also asked you how many times you’ve changed jobs since graduating from your PA program. The 4 answer choices ranged from “None” to “More than 3 times.” The final question asked which factors influence your decision about seeking/accepting a new position, allowing more than one choice from the list below.
- Salary/compensation
- Options for supplemental income
- Greater independence/more autonomy
- Opportunities for professional growth/development
- Formal career ladder for advancement
- Defined career path
- Recognition and appreciation
- Schedule flexibility
- Geographic location
- Access to and subsidy for more educational opportunities
- Employer reimbursement of school loans
- Specific state scope of practice and licensure law
- Work-life balance, including addressing burnout
- Working conditions
- Avoid toxic coworkers
- Top-of-the-line tools
- Telecommuting
- Cost of living
- Opportunity for outdoor activities/lifestyle
To see what your colleagues said, go to the next page
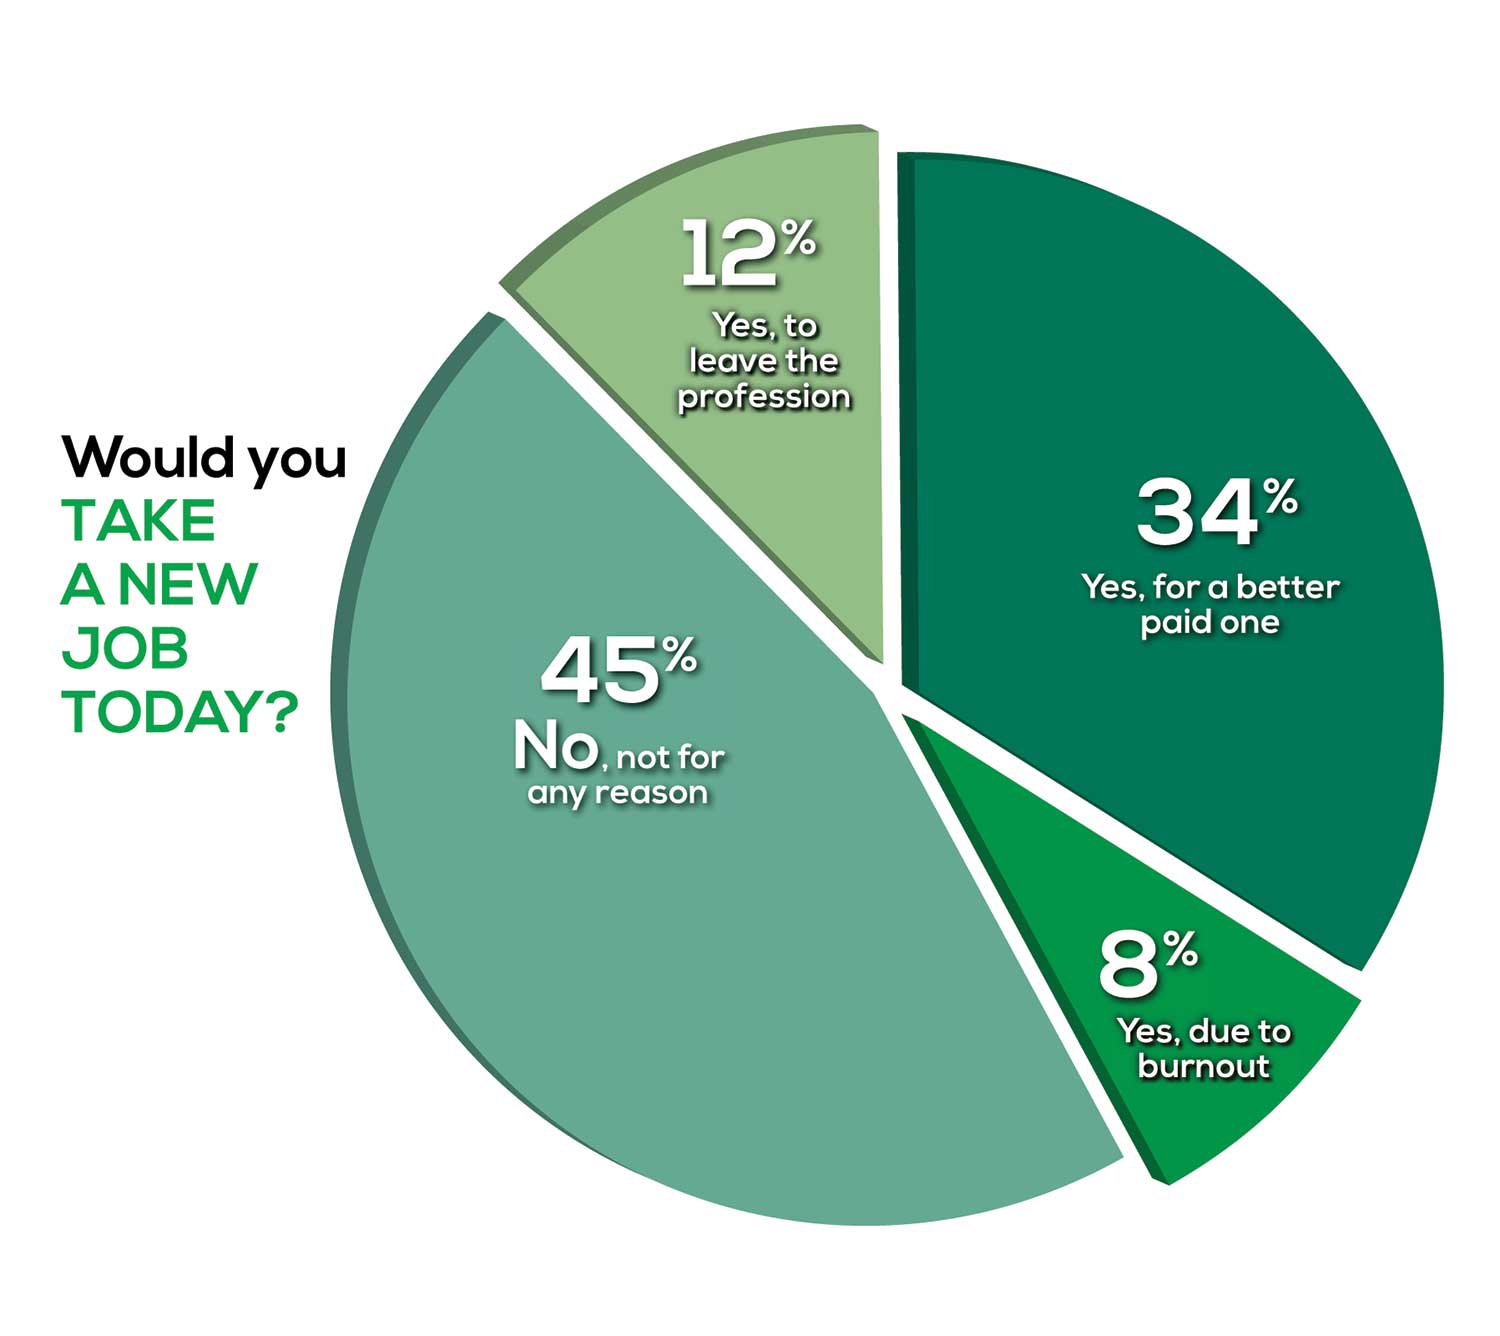
Compared to last year, PAs are 4% more likely to stay with their current job, stating that they would not make any changes, with 4% less likely to leave even if a higher salary were on offer. This is supported by the responses that indicate a fewer number of PAs (27%) have changed jobs at the highest rate (> 3 times) compared to 31% last year.
Although 19% of PAs have never changed jobs, 33% have changed 2 or 3 times, and 27% have changed more 3 times (down 4% from last year). However, more PAs report feeling burned out (up 2% from last year) and wish to leave for another profession (up 6% from last year) compared to last year.
Respondents indicated that the following 4 factors would strongly influence their decision to seek or accept a new position:
- Salary/compensation: 84%
- Work-life balance: 72%
- Schedule flexibility: 68%
- Working conditions: 64%
WHAT MAKES YOU MOST SATISFIED WITH YOUR WORK?
As you are aware, level of satisfaction depends on each of the following, which we asked respondents to rank from 1 to 5.
- Relationships with your colleagues (health care providers and clerical/administrative personnel)
- Quality and duration of patient relationships
- Respect received from patients, their families, and your community
- Ability to make a difference and provide significant help to patients, their families, and your community
To see what your colleagues said, go to the next page

Echoing the survey results—which ranked “Making a difference and providing significant help” as the topmost source of job satisfaction—one of your colleagues commented that, “Ability to offer meaningful support to client needs” affected their satisfaction. On the other hand, though, one clinician wrote, “I am starting to decrease my time in urgent care because I’m seeing more often that administration thinks we are selling a good, not a service—and because of lack of respect by patients as well.”
Compared to last year, the changes in response are
3% decrease: Making a difference and providing significant help
No change: Respect received from patients and their families
6% increase: Relationships with your colleagues
2% increase: Quality and duration of patient relationships
MOST SATISFIED BY SPECIALTY
Knowing that certain specialties offer more advantages than others, we presented a list of 19 medical specialties, asking which is your primary one. We also asked how often you typically feel satisfied with your job, with these answer choices.
- Never
- Occasionally
- About half the time
- Most of the time
- Always
To see what your colleagues said, go to the next page
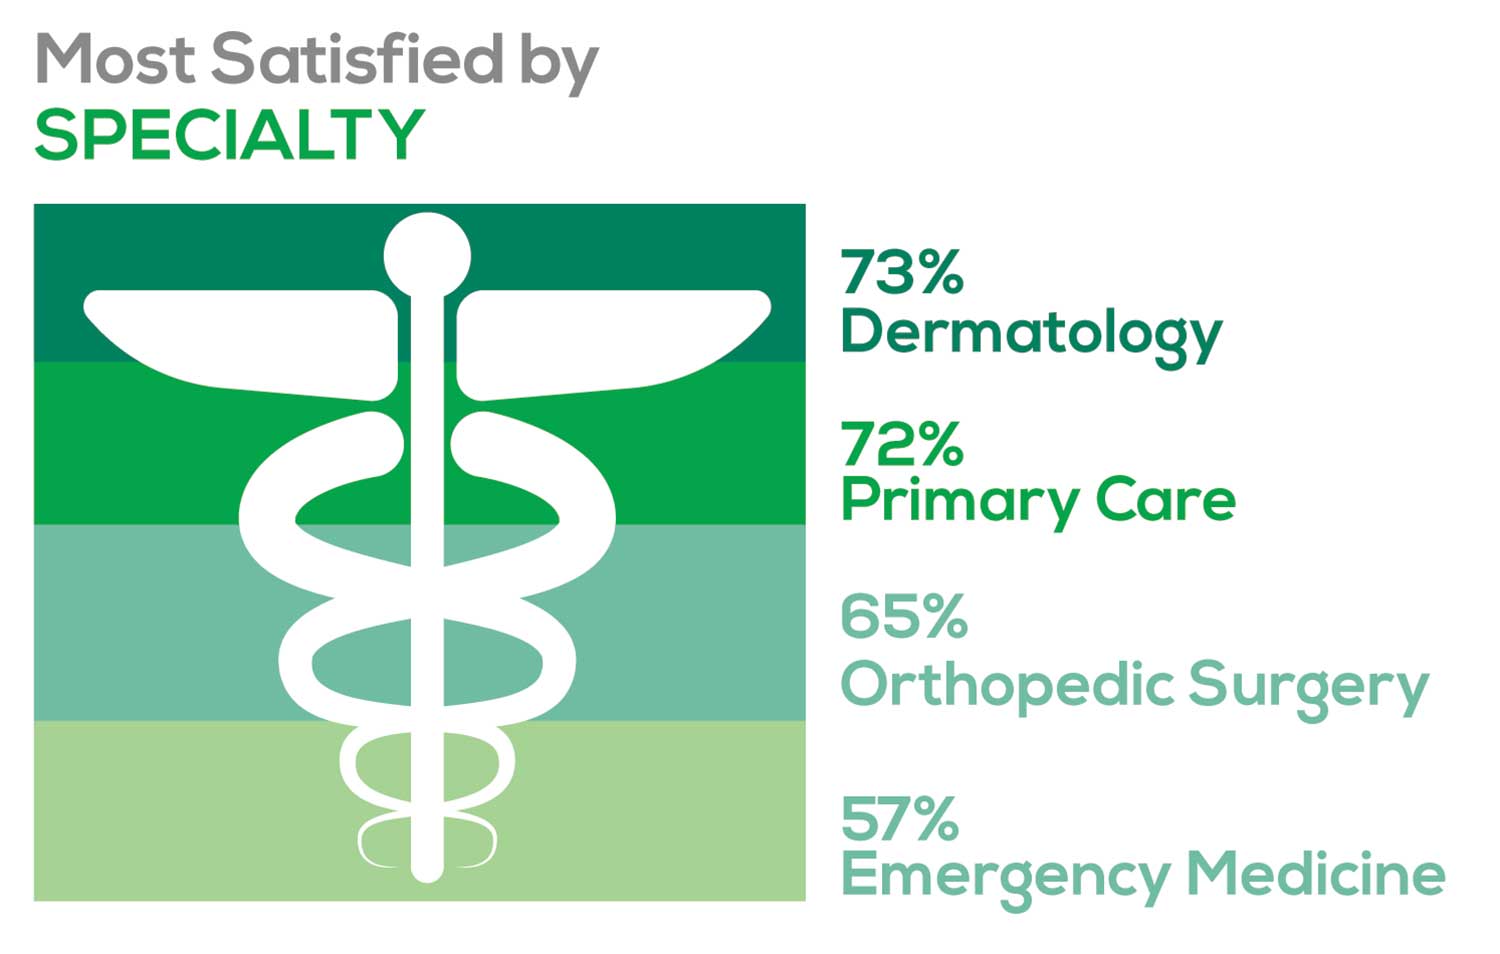
- Dermatology: 73%, a 9% decrease over last year
- Primary Care: 72%, virtually unchanged from last year
- Orthopedic Surgery: 65%, a new entry this year
- Emergency Medicine: 57%, an 8% decrease over last year
As one clinician commented, being “First assistant in surgery” makes a difference in their job satisfaction.
MOST SATISFIED BY PRACTICE SETTING
Working conditions and coworker collegiality are integral to job satisfaction. To learn more about these factors, we asked you to identify the practice settings where you work.
- Academic setting (faculty); school/college health services
- Hospital: inpatient care; outpatient setting or community clinic
- Locum
- Physician practice: solo; single-specialty; multi-specialty
- Public health/occupational health setting; military/government
- Retail/convenient care; urgent care clinic
- Skilled nursing/long-term care facility
We also asked how often you typically feel satisfied with your job, with 5 answer choices ranging from “Never” to “Always.”
To see what your colleagues said, go to the next page
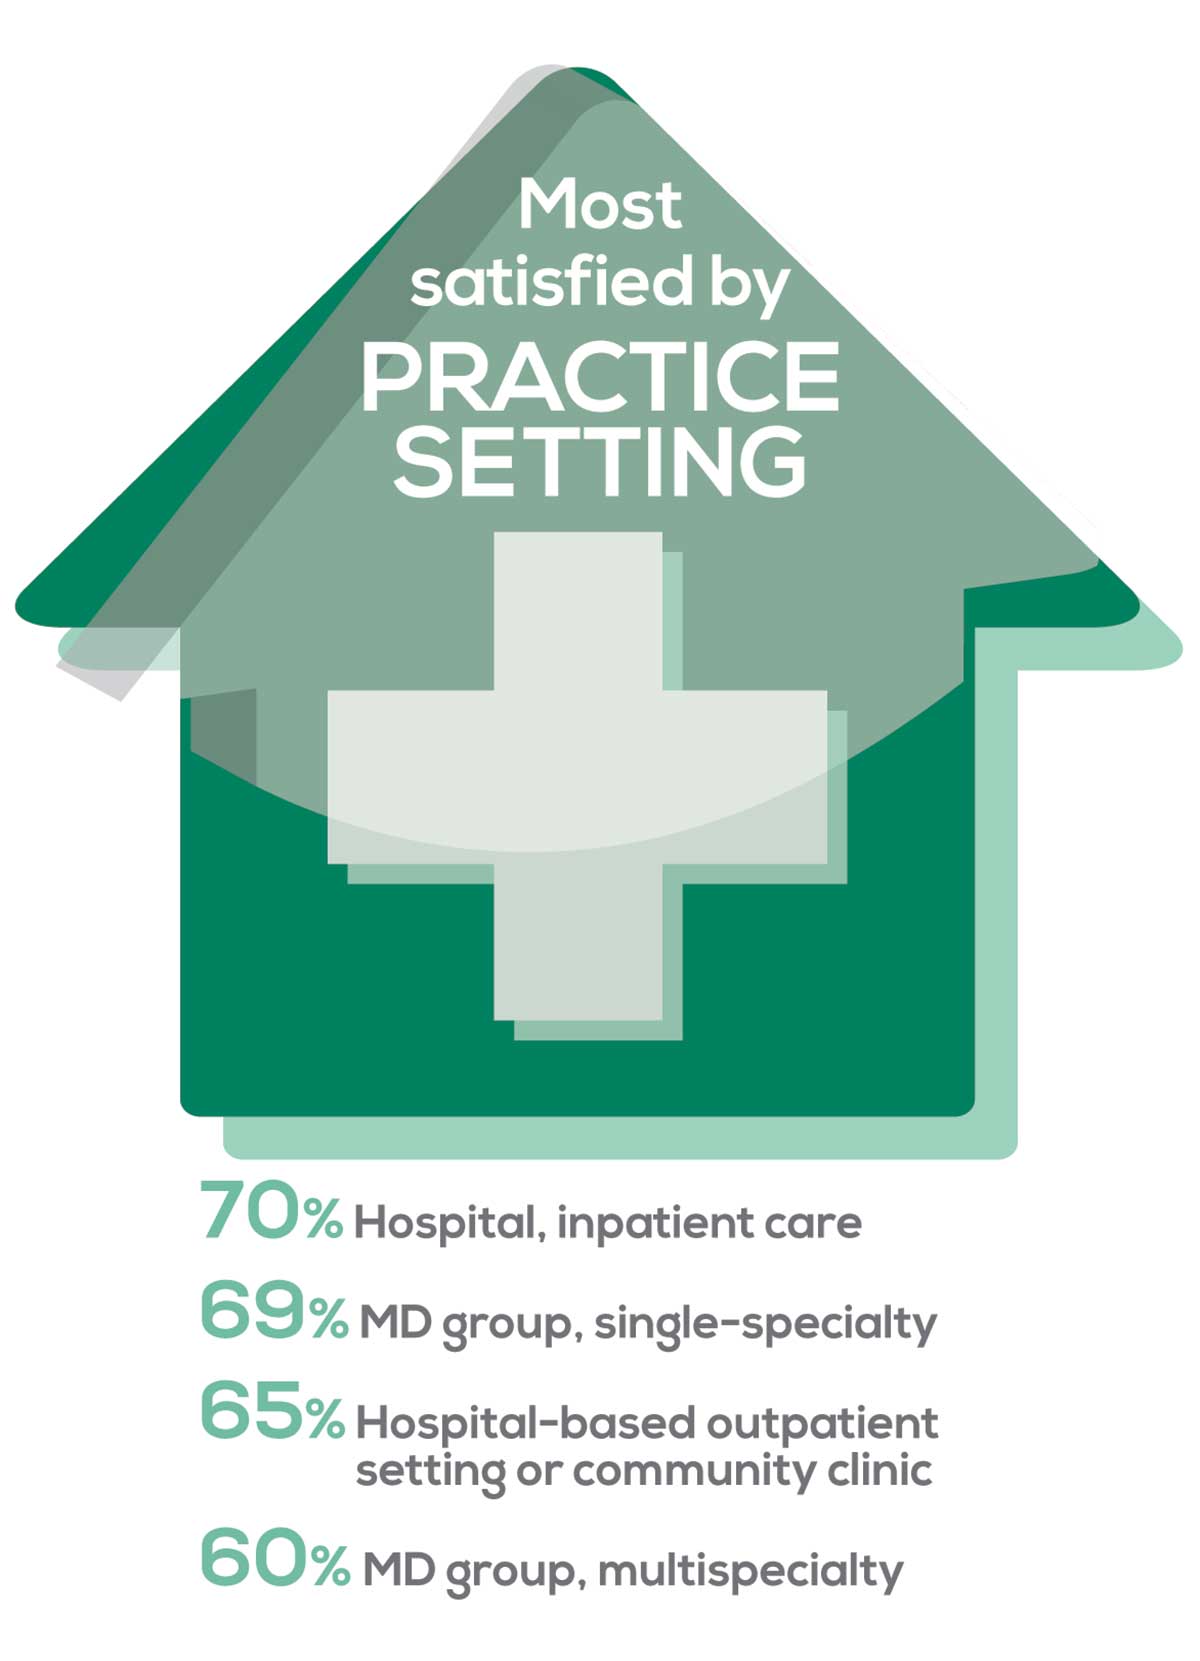
95% of PA respondents work as an employee; of these, 41% work in hospitals, and 31% work in physician offices.1 Therefore, it is gratifying to see that hospital settings and physician groups are satisfying places to work. In addition, this data has not changed significantly since last year.
- US Department of Health and Human Services, Health Resources and Services Administration, The U.S. Health Workforce Chartbook. Rockville, Maryland: U.S. Department of Health and Human Services, 2018.
BENEFITS
As you are aware, having access to the right benefits can go a long way to increasing job satisfaction. In addition to salary as a choice, we listed 30 benefits choices—insurance coverage, additional compensation opportunities, reimbursements, and other—asking which are offered by your employer (access) and which, in lieu of a modest increase in salary, are most important regardless of access. Your responses allowed us to identify the top 7 among your peers.
To see what your colleagues said, go to the next page
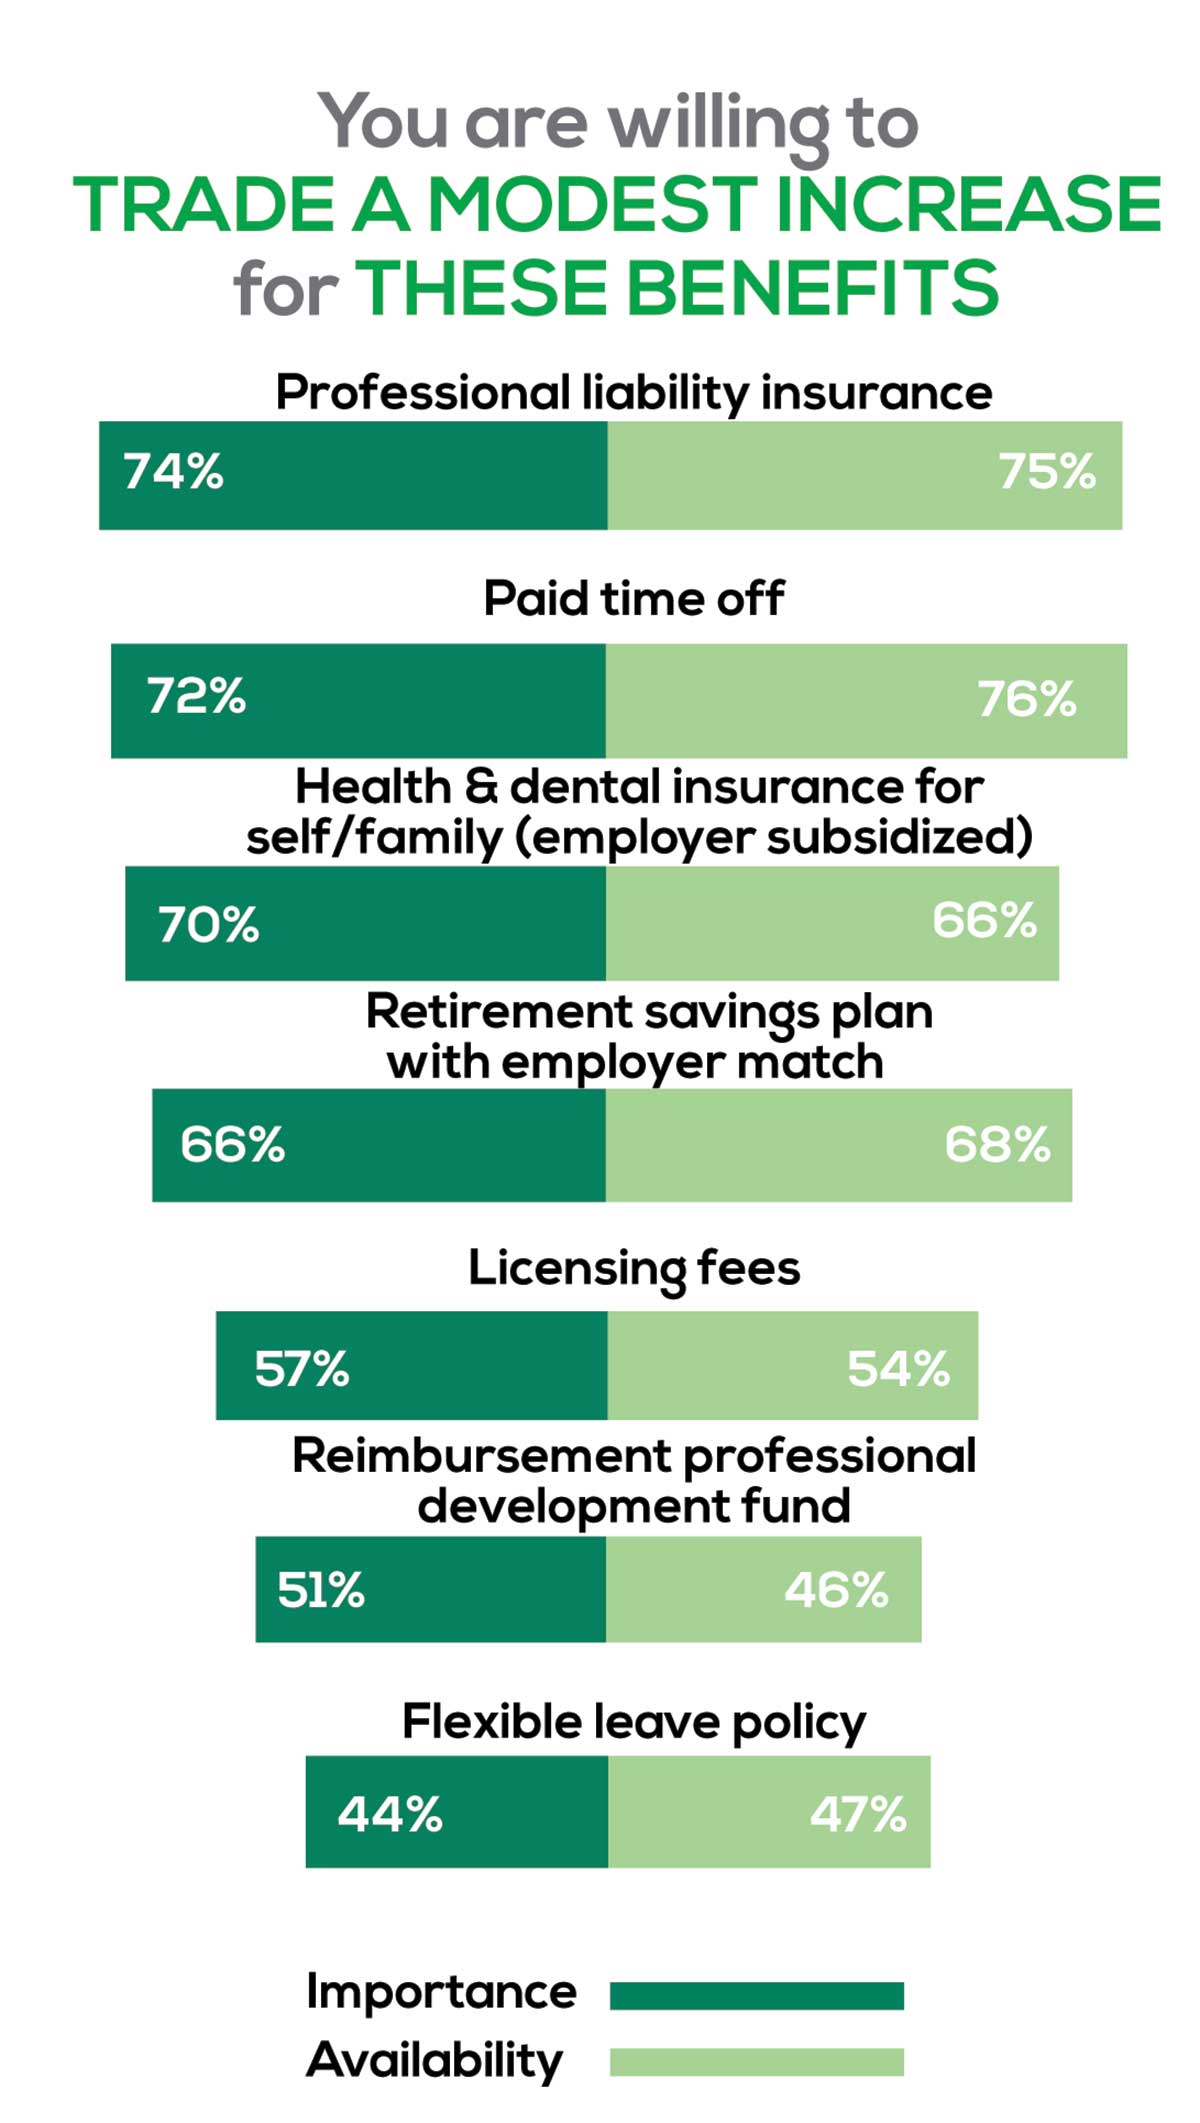
You are willing to trade a modest increase in salary for the following important benefits whether you are a new job seeker or an experienced practitioner.
- Compensation: Paid time off, retirement saving plan with employer match
- Insurance coverage: Professional liability insurance, health & dental insurance for self/family (employer subsidized)
- Reimbursements: Licensing fees, professional development fund
- Other: Flexible leave policy
MOST SATISFIED BY REGION
Location, location, location. Where you work depends in part on where your family is; in part on what jobs are available; what affects your commute, taxes and take home pay; and hence your satisfaction. So, we asked where you work—West, Midwest, Northeast, or South—and paired the data with responses to the question about how often you typically feel satisfied with your job, with 5 answer choices ranging from “Never” to “Always.”
To see what your colleagues said, go to the next page
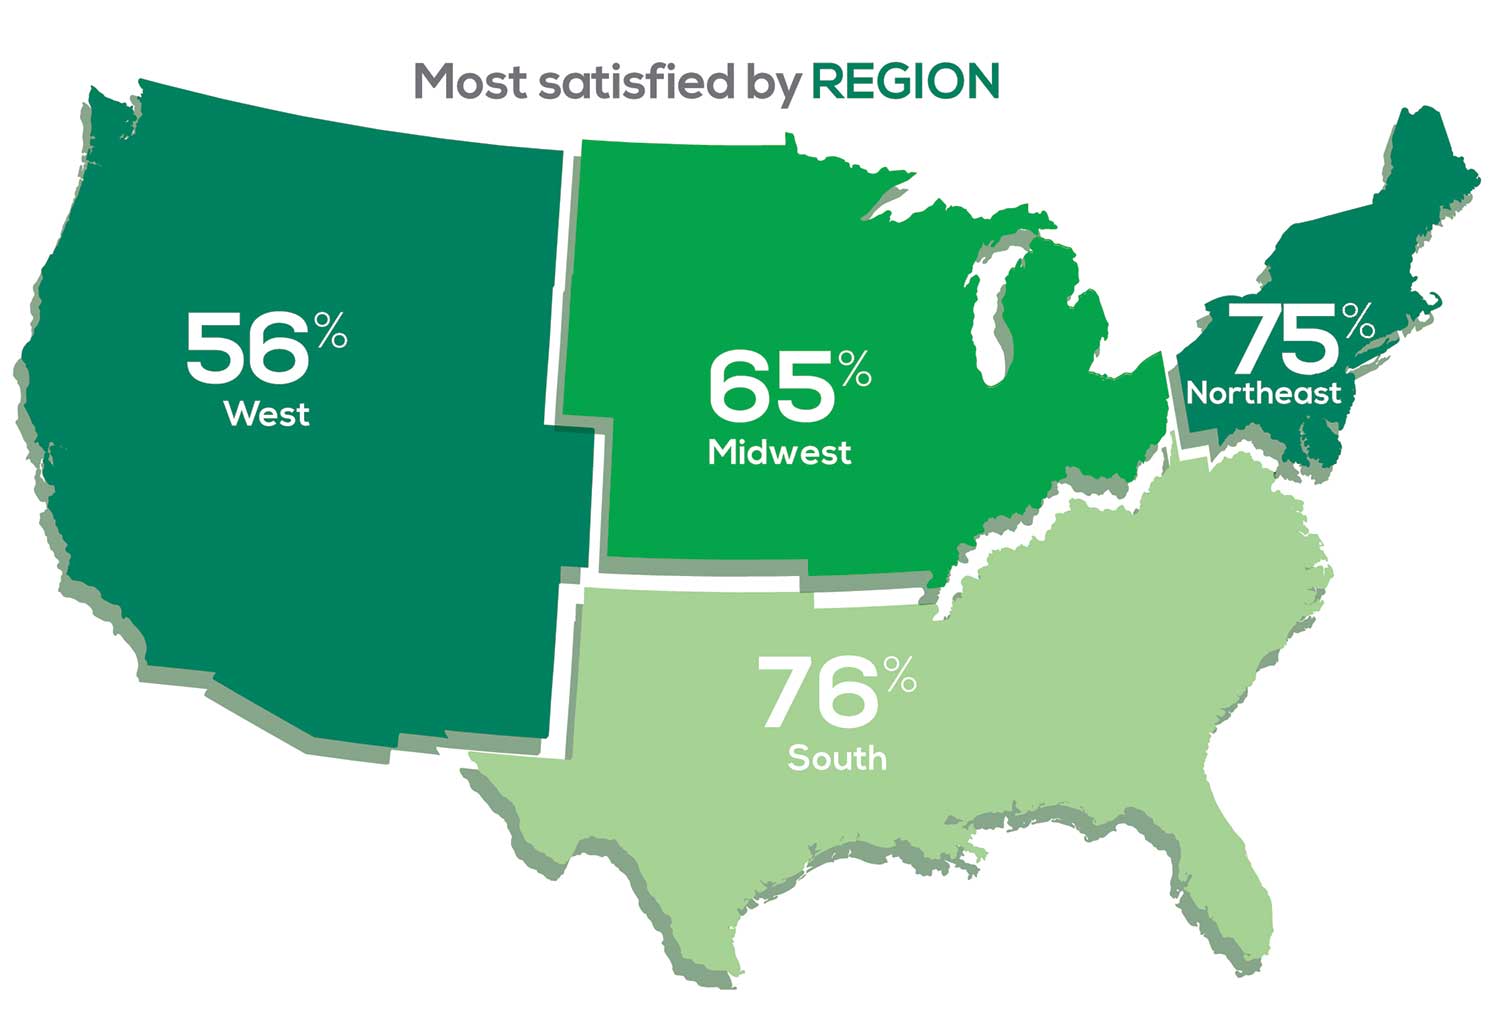
Geographic location is among the factors that influence the decision about seeking or accepting a new job for 53% of PA respondents. Compared to last year, satisfaction levels by region were
- 7% higher than last year in the Northeast
- 5% higher than last year in the South
- 12% lower than last year in the Midwest
- 17% lower than last year in the West
with 27% of PAs practicing in the Northeast; 32% in the South; 21% in the Midwest, and 19% in the West. 76% of PAs working in the South are “most of the time/always” satisfied with their job.
When base salaries are adjusted for cost of living, the top 10 ranked states are, from first to 10th, Oklahoma, Arkansas, Ohio, Texas, Michigan, Indiana, Iowa, New Mexico, Mississippi, and South Dakota.1
- American Academy of PAs. 2019 AAPA Salary Report. Alexandria, VA; 2019.
SALARY
Because you indicated that salary is second in importance only to professional liability insurance coverage as part of a desirable compensation package, we asked you to tell us what your salary bracket is. The amounts ranged from < $50,000 to > $175,000 per year (in $25,000 increments). Combining the responses to this question with those asking about gender and specialty, we are able to tie these factors together for you.
To see what your colleagues said, go to the next page
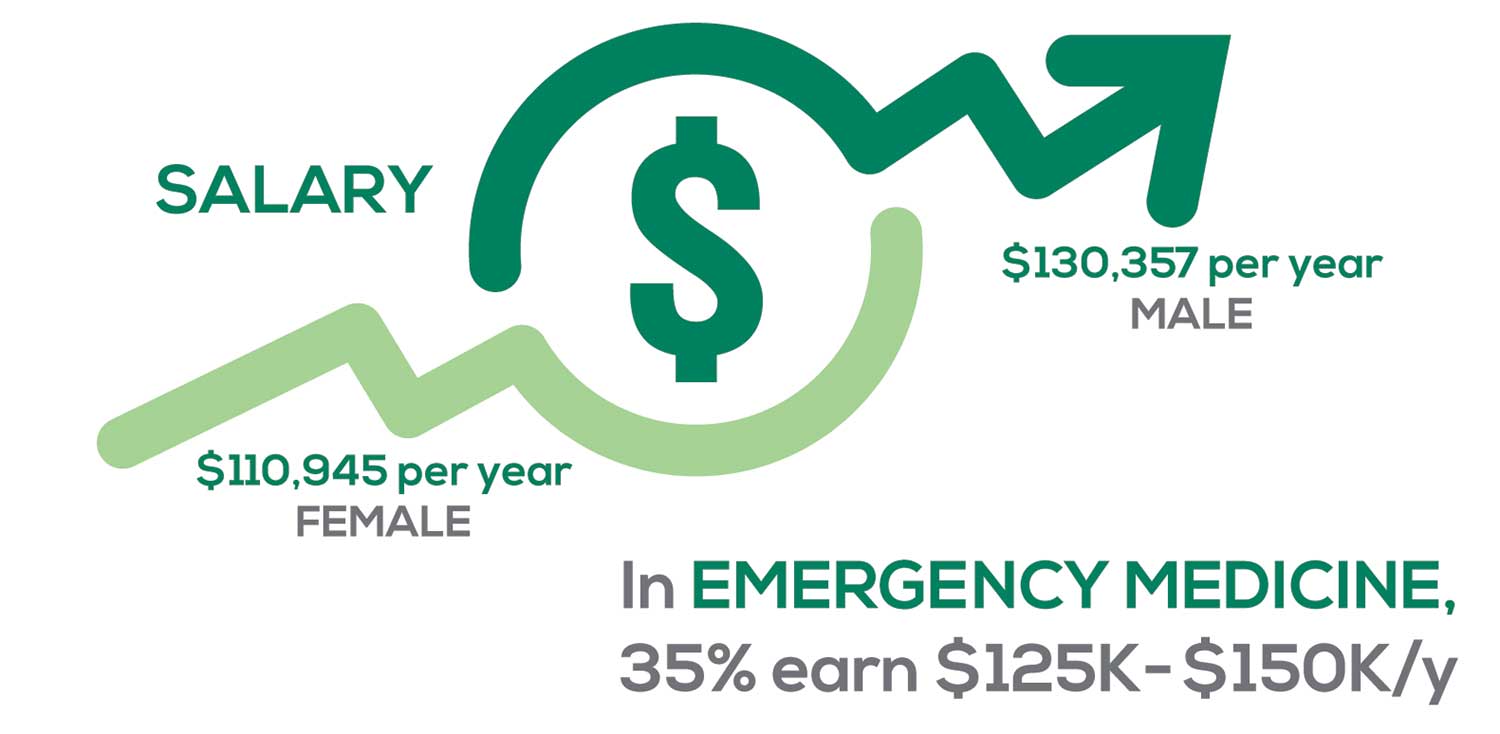
Approximately 5% of PAs earn $50K to $75K per year; 36%, earn $100K to $125K per year; and 5% earn > $175K per year. Similar to responses of previous years, women earn less than men in the PA profession.
PAs practicing in Emergency Medicine (EM) are the most highly compensated, with their median compensation being almost $117K.1 In fact, among those in EM, we found that 35% earn between $125K and $150K per year, up from 27% from last year. Clinicians working in the emergency room encounter more stressors (a clinician noted “Abuse of the emergency room by patients with ridiculous complaints” as a source of dissatisfaction) than those encountered in other specialties, which may be related to the higher compensation.
Although most PAs feel they are adequately compensated, we found that of those who practice in Family Medicine, 19% earn less than $75K per year, up from 6% from last year.
- American Academy of PAs. 2019 AAPA Salary Report. Alexandria, VA; 2019.
WORKWEEK
Job satisfaction, and its opposite, burnout are related to your workload (ie, what you do and how much autonomy you have in deciding how to proceed). To help us evaluate these factors, we asked your colleagues to indicate how many hours per week are typically spent in direct (examine/diagnose/treat) and indirect patient care (perform and interpret labs, x-rays, refill prescriptions, etc.), administrative duties, meetings, and teaching.
We were also interested in whether you assess, treat, and manage decisions
- Independently/by yourself
- In direct contact (in person or by phone) with a collaborating physician
- In consultation with a specialist when providing patient care.
Multiple answer choices were permitted.
To see what your colleagues said, go to the next page
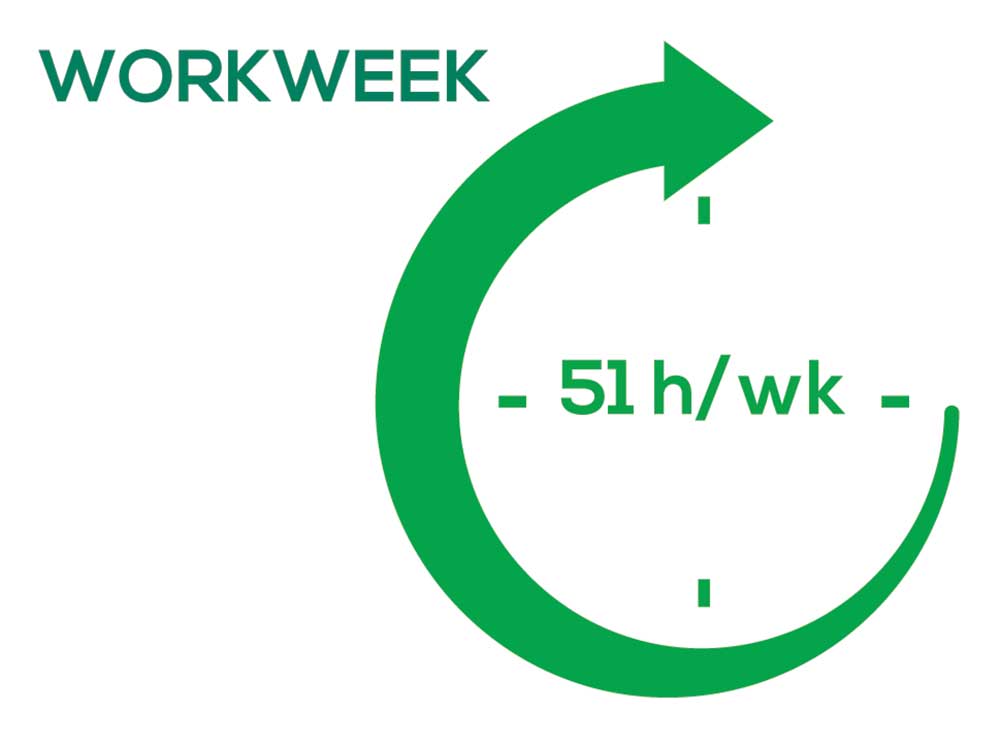
As you can imagine, workload is a very hot topic. In response to, “What else affects your job satisfaction?” the greatest number of comments related to electronic charting and data collection. These activities are felt to demand so much time and effort that it takes away from patient care. The survey responses support this: Compared to last year, although the number of hours worked is the same this year, PAs now spend 1 hour less per week on patient care (direct and indirect) and 1 hour more on other duties (administrative and teaching). As one clinician put it, “…availability of medical assistant/administrative support is huge” in alleviating the sense of being overworked or overextended.
Aside from work hours, clinicians told us they seek positions that allow them “input on all issues related to practice” and flexibility on “what/who I am allowed to treat.” According to the survey, when providing patient care,
- 84% of PAs assess, treat, and manage decisions independently
- 37% collaborate with a physician
- 19% consult with a specialist
supporting the fact that 58% of PAs are satisfied most of the time; 12% are always satisfied.
A side note: Of the 50% of PAs who responded that they are involved in teaching students (78% of whom are PAs), they spend approximately 4 hours a week,
- Either as a clinical preceptor (35%)
- In the classroom (5%)
- Or both (10%).
CME REIMBURSEMENT
As we know, PAs earn continuing medical education (CME) credits in order to maintain certification. Therefore, we asked you to indicate how much financial reimbursement you receive annually for CME; answer choices range from $0 to > $2,000 per year (in $500 increments). We also queried you about how much time you are allotted annually for CME; choices were from “None” to “More than 5 weeks.”
To see what your colleagues said, go to the next page
Many of your colleagues responded to the question “What else affects your job satisfaction?” with “Support for continuing learning” and “Educational opportunities.” This is reflected by 51% of survey respondents who stated that “Reimbursement for professional development” was an important benefit (see “Top 7 Benefits” above).
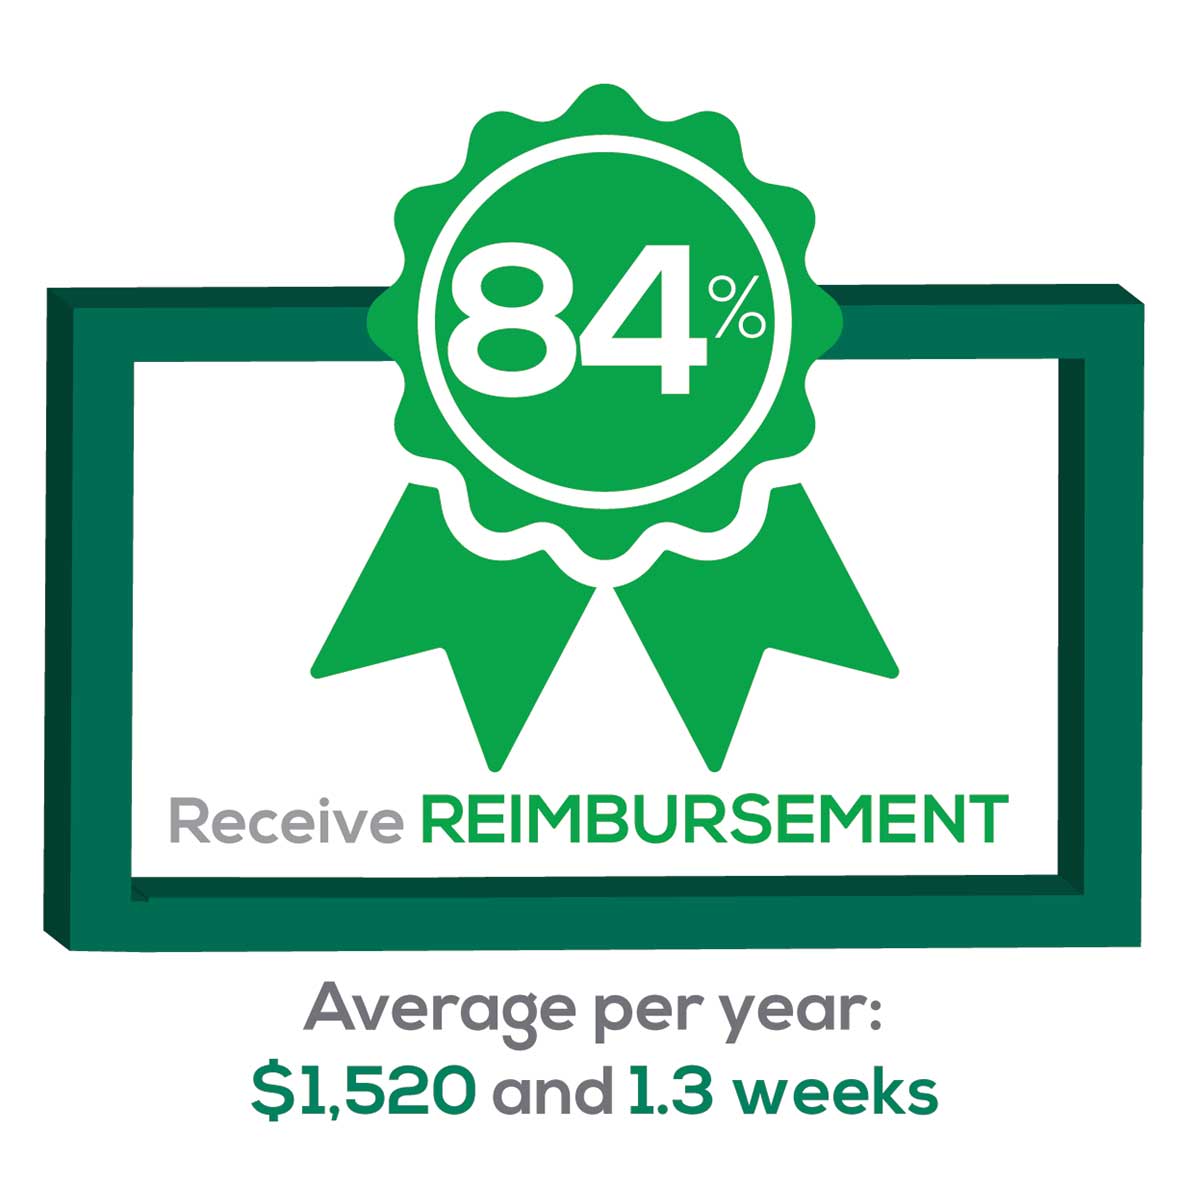
This year, 84% of respondents reported receiving remuneration—either money or time allowed or both—for CME, down 3% from last year. Specifically,
- 16% received $0
- 6%, less than $500
- 10%, between $500 - $1,000
- 25%, between $1,001 - $1,500
- 19%, between $1,501 - $2,000
- 24%, more than $2,000
with average monetary compensation per year up approximately $200 over last year.
Responses to the amount of time you are allotted annually for CME ranged from “None” to “more than 5 weeks.”
- 25%, no time
- 31%, less than 1 week
- 38%, 1-2 weeks
- 3%, 3 weeks
- 1%, 4 weeks
- 0.25%, 5 weeks
- 1%, more than 5 weeks.
In closing, we offer thanks to all the survey participants whose answers helped us understand your current state of job satisfaction and most especially for your frank and enlightening responses to the open-ended questions.
METHODOLOGY
Fielded electronically under the Clinician Reviews logo, an introductory email letter signed by the Editors-in-Chief invited participation in the online 4th annual NP/PA Job Satisfaction Survey of 35 questions.
The survey was fielded August 23, 2019 to a random representative sample of NPs and PAs within the United States, excluding students. The first 150 respondents to complete the survey received a $25 Amazon.com gift certificate.
A total of 1,323 usable responses—a projectable sample size—were received by October 3, 2019, the final cut-off date.
Of the total respondents, 70% are NPs (931) and 30% are PAs (396), which is proportional to the universe of NPs and PAs.1,2 This summary of results is based on only those respondents who designated their profession as NP or PA.
- American Association of Nurse Practitioners. NP Fact Sheet. www.aanp.org/all-about-nps/np-fact-sheet. Accessed November 22, 2019.
- NCCPA. 2018 Statistical Profile of Certified Physician Assistants: an Annual Report of the National Commission on Certification of Physician Assistants. https://prodcmsstoragesa.blob.core.windows.net/uploads/files/2018StatisticalProfileofCertifiedPhysicianAssistants.pdf. Accessed November 22, 2019.
1. American Association of Nurse Practitioners. NP Fact Sheet. www.aanp.org/all-about-nps/np-fact-sheet. Accessed November 22, 2019.
2. NCCPA. 2018 Statistical Profile of Certified Physician Assistants: an Annual Report of the National Commission on Certification of Physician Assistants. https://prodcmsstoragesa.blob.core.windows.net/uploads/files/2018StatisticalProfileofCertifiedPhysicianAssistants.pdf. Accessed November 22, 2019.
“I have the best job in the world.” This statement sums up how your colleagues feel about being a PA. Although there are certainly problems that deserve attention, the vast majority of clinicians, who are highly educated and practice in all specialties, state that they would re-enter the field if choosing again.
On the following pages, we focus on the details of the survey results, with breakouts by specialty, region, and practice setting. Be sure to check out which benefits your colleagues are getting, how much they’re being reimbursed for continuing medical education, information about salary by gender and time spent during the workweek, and much more. Participants, invited to comment, have provided several illuminating quotes, which we’ve included throughout the article, indicating what it’s like to be “in the trenches.”
WOULD YOU REPEAT THIS?
To get to the heart of the matter, we asked our survey takers “If you were to do it again, would you choose…”
- The same career
- The same educational preparation
- The same practice setting
To see what your colleagues said, go to the next page
The majority of your peers gave an enthusiastic thumbs up to PA practice as a profession choice. Knowing what you know now, 86% of you agreed that you would follow the same career path today as when you entered practice, which is up 5% from last year.
Educational preparation came in for a ringing endorsement, increasing since last year’s survey results (a 3% increase), and practice setting remained virtually the same.
Of PAs in practice between < 1 and 5 years, 94% felt their educational training was adequate; 53% felt their current responsibilities matched their expectations accurately; and 74% said their career expectations were met.
WOULD YOU TAKE A NEW JOB TODAY?
Continuing to probe about your level of satisfaction, we asked how you feel about changing your job. The answer choices were, “I would…”
- Change my job if I could get a better one (ie, better paid)
- Take any other job in which I could earn as much as I do now (ie, Yes, to leave the profession)
- Change both my job and my occupation (ie, I am burned out)
- Not make any changes (ie, No, not for any reason)
We also asked you how many times you’ve changed jobs since graduating from your PA program. The 4 answer choices ranged from “None” to “More than 3 times.” The final question asked which factors influence your decision about seeking/accepting a new position, allowing more than one choice from the list below.
- Salary/compensation
- Options for supplemental income
- Greater independence/more autonomy
- Opportunities for professional growth/development
- Formal career ladder for advancement
- Defined career path
- Recognition and appreciation
- Schedule flexibility
- Geographic location
- Access to and subsidy for more educational opportunities
- Employer reimbursement of school loans
- Specific state scope of practice and licensure law
- Work-life balance, including addressing burnout
- Working conditions
- Avoid toxic coworkers
- Top-of-the-line tools
- Telecommuting
- Cost of living
- Opportunity for outdoor activities/lifestyle
To see what your colleagues said, go to the next page
Compared to last year, PAs are 4% more likely to stay with their current job, stating that they would not make any changes, with 4% less likely to leave even if a higher salary were on offer. This is supported by the responses that indicate a fewer number of PAs (27%) have changed jobs at the highest rate (> 3 times) compared to 31% last year.
Although 19% of PAs have never changed jobs, 33% have changed 2 or 3 times, and 27% have changed more 3 times (down 4% from last year). However, more PAs report feeling burned out (up 2% from last year) and wish to leave for another profession (up 6% from last year) compared to last year.
Respondents indicated that the following 4 factors would strongly influence their decision to seek or accept a new position:
- Salary/compensation: 84%
- Work-life balance: 72%
- Schedule flexibility: 68%
- Working conditions: 64%
WHAT MAKES YOU MOST SATISFIED WITH YOUR WORK?
As you are aware, level of satisfaction depends on each of the following, which we asked respondents to rank from 1 to 5.
- Relationships with your colleagues (health care providers and clerical/administrative personnel)
- Quality and duration of patient relationships
- Respect received from patients, their families, and your community
- Ability to make a difference and provide significant help to patients, their families, and your community
To see what your colleagues said, go to the next page
Echoing the survey results—which ranked “Making a difference and providing significant help” as the topmost source of job satisfaction—one of your colleagues commented that, “Ability to offer meaningful support to client needs” affected their satisfaction. On the other hand, though, one clinician wrote, “I am starting to decrease my time in urgent care because I’m seeing more often that administration thinks we are selling a good, not a service—and because of lack of respect by patients as well.”
Compared to last year, the changes in response are
3% decrease: Making a difference and providing significant help
No change: Respect received from patients and their families
6% increase: Relationships with your colleagues
2% increase: Quality and duration of patient relationships
MOST SATISFIED BY SPECIALTY
Knowing that certain specialties offer more advantages than others, we presented a list of 19 medical specialties, asking which is your primary one. We also asked how often you typically feel satisfied with your job, with these answer choices.
- Never
- Occasionally
- About half the time
- Most of the time
- Always
To see what your colleagues said, go to the next page
- Dermatology: 73%, a 9% decrease over last year
- Primary Care: 72%, virtually unchanged from last year
- Orthopedic Surgery: 65%, a new entry this year
- Emergency Medicine: 57%, an 8% decrease over last year
As one clinician commented, being “First assistant in surgery” makes a difference in their job satisfaction.
MOST SATISFIED BY PRACTICE SETTING
Working conditions and coworker collegiality are integral to job satisfaction. To learn more about these factors, we asked you to identify the practice settings where you work.
- Academic setting (faculty); school/college health services
- Hospital: inpatient care; outpatient setting or community clinic
- Locum
- Physician practice: solo; single-specialty; multi-specialty
- Public health/occupational health setting; military/government
- Retail/convenient care; urgent care clinic
- Skilled nursing/long-term care facility
We also asked how often you typically feel satisfied with your job, with 5 answer choices ranging from “Never” to “Always.”
To see what your colleagues said, go to the next page
95% of PA respondents work as an employee; of these, 41% work in hospitals, and 31% work in physician offices.1 Therefore, it is gratifying to see that hospital settings and physician groups are satisfying places to work. In addition, this data has not changed significantly since last year.
- US Department of Health and Human Services, Health Resources and Services Administration, The U.S. Health Workforce Chartbook. Rockville, Maryland: U.S. Department of Health and Human Services, 2018.
BENEFITS
As you are aware, having access to the right benefits can go a long way to increasing job satisfaction. In addition to salary as a choice, we listed 30 benefits choices—insurance coverage, additional compensation opportunities, reimbursements, and other—asking which are offered by your employer (access) and which, in lieu of a modest increase in salary, are most important regardless of access. Your responses allowed us to identify the top 7 among your peers.
To see what your colleagues said, go to the next page
You are willing to trade a modest increase in salary for the following important benefits whether you are a new job seeker or an experienced practitioner.
- Compensation: Paid time off, retirement saving plan with employer match
- Insurance coverage: Professional liability insurance, health & dental insurance for self/family (employer subsidized)
- Reimbursements: Licensing fees, professional development fund
- Other: Flexible leave policy
MOST SATISFIED BY REGION
Location, location, location. Where you work depends in part on where your family is; in part on what jobs are available; what affects your commute, taxes and take home pay; and hence your satisfaction. So, we asked where you work—West, Midwest, Northeast, or South—and paired the data with responses to the question about how often you typically feel satisfied with your job, with 5 answer choices ranging from “Never” to “Always.”
To see what your colleagues said, go to the next page
Geographic location is among the factors that influence the decision about seeking or accepting a new job for 53% of PA respondents. Compared to last year, satisfaction levels by region were
- 7% higher than last year in the Northeast
- 5% higher than last year in the South
- 12% lower than last year in the Midwest
- 17% lower than last year in the West
with 27% of PAs practicing in the Northeast; 32% in the South; 21% in the Midwest, and 19% in the West. 76% of PAs working in the South are “most of the time/always” satisfied with their job.
When base salaries are adjusted for cost of living, the top 10 ranked states are, from first to 10th, Oklahoma, Arkansas, Ohio, Texas, Michigan, Indiana, Iowa, New Mexico, Mississippi, and South Dakota.1
- American Academy of PAs. 2019 AAPA Salary Report. Alexandria, VA; 2019.
SALARY
Because you indicated that salary is second in importance only to professional liability insurance coverage as part of a desirable compensation package, we asked you to tell us what your salary bracket is. The amounts ranged from < $50,000 to > $175,000 per year (in $25,000 increments). Combining the responses to this question with those asking about gender and specialty, we are able to tie these factors together for you.
To see what your colleagues said, go to the next page
Approximately 5% of PAs earn $50K to $75K per year; 36%, earn $100K to $125K per year; and 5% earn > $175K per year. Similar to responses of previous years, women earn less than men in the PA profession.
PAs practicing in Emergency Medicine (EM) are the most highly compensated, with their median compensation being almost $117K.1 In fact, among those in EM, we found that 35% earn between $125K and $150K per year, up from 27% from last year. Clinicians working in the emergency room encounter more stressors (a clinician noted “Abuse of the emergency room by patients with ridiculous complaints” as a source of dissatisfaction) than those encountered in other specialties, which may be related to the higher compensation.
Although most PAs feel they are adequately compensated, we found that of those who practice in Family Medicine, 19% earn less than $75K per year, up from 6% from last year.
- American Academy of PAs. 2019 AAPA Salary Report. Alexandria, VA; 2019.
WORKWEEK
Job satisfaction, and its opposite, burnout are related to your workload (ie, what you do and how much autonomy you have in deciding how to proceed). To help us evaluate these factors, we asked your colleagues to indicate how many hours per week are typically spent in direct (examine/diagnose/treat) and indirect patient care (perform and interpret labs, x-rays, refill prescriptions, etc.), administrative duties, meetings, and teaching.
We were also interested in whether you assess, treat, and manage decisions
- Independently/by yourself
- In direct contact (in person or by phone) with a collaborating physician
- In consultation with a specialist when providing patient care.
Multiple answer choices were permitted.
To see what your colleagues said, go to the next page
As you can imagine, workload is a very hot topic. In response to, “What else affects your job satisfaction?” the greatest number of comments related to electronic charting and data collection. These activities are felt to demand so much time and effort that it takes away from patient care. The survey responses support this: Compared to last year, although the number of hours worked is the same this year, PAs now spend 1 hour less per week on patient care (direct and indirect) and 1 hour more on other duties (administrative and teaching). As one clinician put it, “…availability of medical assistant/administrative support is huge” in alleviating the sense of being overworked or overextended.
Aside from work hours, clinicians told us they seek positions that allow them “input on all issues related to practice” and flexibility on “what/who I am allowed to treat.” According to the survey, when providing patient care,
- 84% of PAs assess, treat, and manage decisions independently
- 37% collaborate with a physician
- 19% consult with a specialist
supporting the fact that 58% of PAs are satisfied most of the time; 12% are always satisfied.
A side note: Of the 50% of PAs who responded that they are involved in teaching students (78% of whom are PAs), they spend approximately 4 hours a week,
- Either as a clinical preceptor (35%)
- In the classroom (5%)
- Or both (10%).
CME REIMBURSEMENT
As we know, PAs earn continuing medical education (CME) credits in order to maintain certification. Therefore, we asked you to indicate how much financial reimbursement you receive annually for CME; answer choices range from $0 to > $2,000 per year (in $500 increments). We also queried you about how much time you are allotted annually for CME; choices were from “None” to “More than 5 weeks.”
To see what your colleagues said, go to the next page
Many of your colleagues responded to the question “What else affects your job satisfaction?” with “Support for continuing learning” and “Educational opportunities.” This is reflected by 51% of survey respondents who stated that “Reimbursement for professional development” was an important benefit (see “Top 7 Benefits” above).
This year, 84% of respondents reported receiving remuneration—either money or time allowed or both—for CME, down 3% from last year. Specifically,
- 16% received $0
- 6%, less than $500
- 10%, between $500 - $1,000
- 25%, between $1,001 - $1,500
- 19%, between $1,501 - $2,000
- 24%, more than $2,000
with average monetary compensation per year up approximately $200 over last year.
Responses to the amount of time you are allotted annually for CME ranged from “None” to “more than 5 weeks.”
- 25%, no time
- 31%, less than 1 week
- 38%, 1-2 weeks
- 3%, 3 weeks
- 1%, 4 weeks
- 0.25%, 5 weeks
- 1%, more than 5 weeks.
In closing, we offer thanks to all the survey participants whose answers helped us understand your current state of job satisfaction and most especially for your frank and enlightening responses to the open-ended questions.
METHODOLOGY
Fielded electronically under the Clinician Reviews logo, an introductory email letter signed by the Editors-in-Chief invited participation in the online 4th annual NP/PA Job Satisfaction Survey of 35 questions.
The survey was fielded August 23, 2019 to a random representative sample of NPs and PAs within the United States, excluding students. The first 150 respondents to complete the survey received a $25 Amazon.com gift certificate.
A total of 1,323 usable responses—a projectable sample size—were received by October 3, 2019, the final cut-off date.
Of the total respondents, 70% are NPs (931) and 30% are PAs (396), which is proportional to the universe of NPs and PAs.1,2 This summary of results is based on only those respondents who designated their profession as NP or PA.
- American Association of Nurse Practitioners. NP Fact Sheet. www.aanp.org/all-about-nps/np-fact-sheet. Accessed November 22, 2019.
- NCCPA. 2018 Statistical Profile of Certified Physician Assistants: an Annual Report of the National Commission on Certification of Physician Assistants. https://prodcmsstoragesa.blob.core.windows.net/uploads/files/2018StatisticalProfileofCertifiedPhysicianAssistants.pdf. Accessed November 22, 2019.
1. American Association of Nurse Practitioners. NP Fact Sheet. www.aanp.org/all-about-nps/np-fact-sheet. Accessed November 22, 2019.
2. NCCPA. 2018 Statistical Profile of Certified Physician Assistants: an Annual Report of the National Commission on Certification of Physician Assistants. https://prodcmsstoragesa.blob.core.windows.net/uploads/files/2018StatisticalProfileofCertifiedPhysicianAssistants.pdf. Accessed November 22, 2019.