User login
OBJECTIVE: To develop a sensitive, reliable, responsive, and easy-to-use instrument for assessing the severity and functional impact of the common cold.
STUDY DESIGN: We created an illness-specific health-related quality-of-life outcomes instrument using previous scales, expert opinion, and common knowledge. This original questionnaire was used in a 1999 randomized trial of echinacea for the common cold. In 2000 we employed cognitive interview and focus group qualitative methods to further develop the instrument. Semistructured interviews used open-ended questions to elicit symptoms, terminology, and perceived functional impact. Responses were used to improve the instrument.
POPULATION: The randomized trial watched 142 University of Wisconsin students for a total of 953 days of illness. The subsequent qualitative instrument development project recruited 74 adults with self-diagnosed colds for 56 in-person interviews and 3 focus groups.
OUTCOMES MEASURED: We measured specific symptoms, symptom clusters (dimensions), functional impact, and global severity.
RESULTS: The original questionnaire included 20 questions: a global severity indicator, 15 symptom-severity items using 9-point severity scales, and 4 yes/no functional assessments. Data from the trial provided evidence of 4 underlying dimensions: nasal, throat, cough, and fever and aches, with reliability coefficients of 0.663, 0.668, 0.794, and 0.753, respectively. Qualitative assessments from the interviews and focus groups led us to expand from 15 to 32 symptom-specific items and from 4 to 10 functional impairment items. The original 9-point severity scale was revised to 7 points. Two global severity questions bring the item count to 44. The instrument fits comfortably on the front and back of a single sheet of paper and takes 5 to 10 minutes to complete.
CONCLUSIONS: The Wisconsin Upper Respiratory Symptom Survey (WURSS) is now ready for formal validity testing or practical use in common cold research.
The common cold, usually caused by viral infection of the upper respiratory tract, is a very prevalent illness. On average, US adults suffer from 1 to 4 episodes per year.1-3 This high incidence, along with significant symptomatic and functional impairment, combine to make this syndrome an important health problem. Hundreds of trials have attempted to demonstrate effective treatments.4,5 Unfortunately, few efforts have been made to develop and validate instruments to measure the symptomatic and functional impact of the common cold.
The term “upper respiratory infection” (URI) is a nosologic category constructed by physicians and other health professionals to reflect an upper airway, mucus-producing, inflammatory reaction to infection, usually viral. It is a disease category. The terms rhinitis, rhinosinusitis, pharyngitis, and bronchitis are often used to indicate the anatomic area most affected. The term “common cold” is an illness term constructed and used by the general populace. This distinction between professional (disease) and popular (illness) conceptions6 provides the reasoning for participant-based, patient-oriented qualitative development of measurement tools. While many medical professionals may choose to measure URI disease by physical examination, viral culture, or laboratory analysis of blood or nasal discharge, we believe that most people are more interested in how they can reduce the severity and duration of their symptoms and the functional impairments that result from their illness.
George Gee Jackson and colleagues7 began experimental work in the 1950s, observing and recording the cold symptoms produced by challenging more than 1,000 volunteers with filtered nasal secretions obtained from cold-sufferers. Eight symptoms–sneezing, headache, malaise, chilliness, nasal discharge, nasal obstruction, sore throat, and cough–were selected for evaluation and graded as absent (0), mild (1), moderate (2), or severe (3) every day for 6 days after inoculation. A score of 14 or higher was chosen as the cutoff value that best distinguished infected from noninfected participants. Thus, the original Jackson scale was apparently designed to discriminate between those with and without demonstrable viral infection, and not as a measure of severity. The tables and graphics in Jackson’s seminal works point toward reasonable internal consistency and discriminate validity.7-9 However, other important measurement properties, such as precision, reliability, responsiveness, and stability, were not reported. Despite these limitations, Jackson’s scale has been used for decades by most of the major common cold research groups.10-15
Using various modifications of the Jackson scale, researchers of the cold have characterized the frequency and severity of the 8 symptoms noted above in both natural colds and experimentally induced rhinovirus infections. Variability in symptom expression remains a hallmark of URI. Although specific pathogens are associated with the severity and distribution of symptoms at the population level, symptoms are poor predictors of etiology at the individual level. Infection itself is an imperfect predictor of symptom expression, as asymptomatic infections occur frequently, and as URI-like symptoms occur in people in whom it is not possible to demonstrate infections.16 Even among people with documented experimental infections of single strains of virus, variance outweighs central tendency in all symptom measurements.17,18
The search for objective disease measures with which to compare symptom scores has also progressed. To date, the following measures have been evaluated: detection of virus with culture or polymerase chain reaction,16,19 cytokine measurement,20-22 serologic markers,23 physical examination,9,24 radiologic imaging,25,26 rhinomanometry,27,28 mucus weight,29 mucus velocity, and number of tissues used.30 None have been shown to be superior to self-reported symptoms in terms of precision, reliability, or responsiveness or in their ability to predict functional impairment or subsequent illness. Perhaps more important, none have been shown to reflect the values of the people who experience colds. Although a number of quality-of-life instruments have been developed to assess allergic rhinitis,31-36 we have been unable to locate any specifically developed to assess URI.
We therefore decided to develop the Wisconsin Upper Respiratory Symptom Survey (WURSS) to provide a standardized measure for evaluating the negative consequences of the common cold. We were particularly interested in developing a health-related quality of life instrument that would represent the symptomatic and functional dimensions that are important to cold-sufferers.37-40 The instrument should be able to discriminate accurately between active intervention and placebo effects in randomized therapeutic trials and should balance brevity and ease of use with optimal precision, reliability, and responsiveness.41-43 It should be based on self-diagnosis and self-assessment because neither accepted criteria nor adequate tests are available to diagnose “upper respiratory infection” or “acute infectious rhinosinusitis”(with or without “pharyngitis”) and because the vast majority of cold treatments will be taken without professional input after self-diagnosis.
Methods
Phase 1: Initial development during a randomized trial
The development of this study began in 1998 during the design of a randomized controlled trial (RCT) of echinacea as a cold treatment. We created our first instrument by showing successive drafts to friends and colleagues (mostly family physicians), stopping once we were satisfied that the questionnaire had reasonable face validity. This initial instrument rated global severity of illness (“How sick do you feel today?”) and 15 individual symptoms on a 9-point Likert-type scale. The 15 symptom-measuring items were complemented by 4 dichotomous (yes/no) functional outcome questions, adapted with permission from the validated Medical Outcomes Study 36-item Short-Form Health Survey (SF-36).44
This initial instrument was used in the spring of 1999 in the echinacea RCT.45 This experience provided a good initial test of our instrument, as the participants were recruited within 36 hours of their first symptom and monitored each day until they had answered “No” to the question, “Do you think that you are still sick today?” for 2 days in a row. Each participant was asked to fill out the questionnaire both on paper and on a computerized data-collecting facsimile (available at http://www.fammed.wisc.edu/samplecold).
Phase 2: Further instrument development using qualitative methods
After the echinacea RCT was completed, our primary concern was that we might be overlooking or under-representing important illness domains. We also suspected that wording, question order, response range, and other formatting concerns could be improved. To achieve these goals, we used qualitative instrument-development methodologies, involving the people we wanted to measure–cold-sufferers–in the development process.40,46-50
After obtaining approval from the University of Wisconsin Medical School Human Subjects Committee, we began interviewing Madison-area adults who responded to community advertising asking for volunteers with colds. Inclusion criteria required answering “Yes” to the question, “Do you believe that you have a cold?” For an interview to be arranged, at least one cold symptom had to be present, and the research assistant had to be convinced that the caller was indeed suffering from a common cold. Prospective participants with itchy eyes, sneezing, or a history of allergy were excluded if either the participant or the interviewer felt that any current symptoms might have been caused by allergy. Interviews were held in a location of mutual convenience and with the aid of an interview guide developed by our research team. Interviewers were carefully trained in the research protocol and used interview guides for both the initial telephone screen and the in-person interviews. Interviewers included both clinicians and nonclinicians.
The semistructured interview guide used open-ended questions designed to elicit the participants’ own terminology for describing their colds (Table 1).51-53 We aimed for an understanding of how the experience of the cold influenced the lives of the participants. Participants were first asked to list all their symptoms, then to describe how each symptom bothered them. Next, we asked which symptom(s) appeared first and which one(s) followed. We then asked which symptoms were most bothersome and why. Participants were asked to describe what they did to relieve their cold symptoms, why, and whether the therapy provided any relief. Participants were then asked about how their cold affected their lifestyle with regard to work, relationships, activities, and so forth. Additionally, we asked about symptoms and effects of previous colds. This exploratory phase of the interview lasted approximately 20 to 30 minutes.
Once the interviewer had a thorough description and understanding of the participant’s cold, the participant was asked to complete the questionnaire-in-development. After marking answers on the questionnaire (which took 3 to 5 minutes), each participant was asked to comment on its ease of use, item wording, formatting, and response range as well as whether it accurately and comprehensively measured the symptoms and functional impact they were experiencing. The instrument development phase of the interview lasted for another 20 to 30 minutes.
We used focus group methods in the final month of the study as an additional window into participants’ experiences.54-56 The focus groups used the same inclusion criteria as the long interviews and followed the same general format, first using open-ended questions to elicit symptoms and their impact, then administrating the questionnaire and discussing item inclusion and formatting. However, we encouraged discussion rather than self-assessment, as the focus group methodology derives its strength from the interactive nature of conversation. For instance, a statement made by one participant would spark interest or recall in another, thereby generating a richer, fuller, and more representative description of symptoms and functional impact.
Individual interviews were held by 1 of 5 trained interviewers (B.B., L.L., R.M., E.S., J.S.). All 3 focus groups were run by the lead author, with at least 1 other research team member assisting. Interviews and focus groups were arranged as soon as possible after the initial telephone contact so that participants would still have cold symptoms while being interviewed. All interviews and focus groups were discussed in biweekly group meetings. Decisions on item inclusion, wording, and questionnaire format were made by research group consensus. Several versions of the questionnaire were brought back to cold-sufferers for further cognitive testing. The diversity of interviewers and respondents provided protection against personal bias in ascertaining and interpreting symptoms and impairments.
TABLE 1
QUESTIONS ASKED DURING INTERVIEW
| Current Symptom History and Evaluation |
|---|
| List and describe all symptoms you have with this cold. |
| How do these symptoms bother you? |
| What is the first symptom you noticed when getting this cold? The Next? |
| The next? |
| Which cold symptom bothers you the most? How and why? |
| Are there other symptoms that bother you? How and why? |
| Interventions |
| What do you do to relieve cold symptoms? Why? |
| What over-the-counter medicines would you use? Why? Did it help? |
| What herbal medicines would you use? Why? Did it help? |
| Do you do anything else to relieve symptoms or treat your cold? Why? |
| Did it help? |
| When would you see a doctor or other health care provider? Why? |
| Lifestyle |
| Has this cold interfered with your normal activities? How? |
| When does a cold keep you from doing what you want or need to do? How? |
| Describe what things are harder to do? |
| Previous Symptom History and Evaluation |
| How many colds did you have this past year? |
| How long did they usually last? |
| List and describe what symptoms you usually get with your colds? |
| How do these symptoms bother you? |
| Survey Evaluation (After Participant Has Completed the Questionnaire) |
| Is this form easy to read? |
| Are there any other symptoms that should be on this questionnaire? |
| Are there any questions that shouldn’t be there? |
| Are there any questions that could be worded better? |
| Is the 7-point scale appropriate? Why or why not? |
Results
Phase 1
Of the 148 college students enrolled, 142 followed protocol and were included in the analysis. Of the 853 person-days documented, 546 (64%) were covered by both data systems; 287 (33.6%) came from paper surveys only; and 18 (2.1%) were filled out via computer only. Because only 2 (0.2%) questionnaires were missing any data, our data capture rate was 99.8%. Comparing data from the computerized and paper data sources provided evidence of consistency. Of the 546 days in which both paper and computer instruments provided data, 512 yielded identical responses (94% concordant) to the global severity of illness question. Of the 34 (6%) discrepancies, 29 were off by 1 point on the 9-point Likert-type scale and 5 discrepancies were off by 2 points. Comparing computer and paper responses with the 15 specific symptom questions also yielded high levels of concordance. Of 8190 item responses, 7777 (95%) were concordant, while 413 (5%) were classified as data discrepancies. Of these, 293 were off by 1 point on the 9-point scale; 68 were off by 2 points; 27, by 3 points; 17, by 4 points; 7, by 5 points; and 1 by 6 points.
Factor analysis of the data provided further evidence of internal validity. Structural equation modeling techniques57,58 were used to model symptom severities over time. A 4-dimensional symptom-recovery model (df = 71; P = .000025) provided a goodness of fit index of 0.88, a root mean square residual of .095, and a chi-squared/df ratio of 139/71 = 1.95. From the pool of 15 scaled symptom scores, 14 items contributed significantly to the model. (In this data set, loss of appetite was an infrequent symptom contributing insignificantly toward the model, and was dropped.) The 14 symptoms naturally aggregated into 4 underlying symptomatic dimensions: cough, throat, nasal, and fever and aches. Table 2 provides the reliability coefficients, standardized item loading coefficients, and standard errors of these loadings for the 4 dimensions. The reliability coefficients of the symptom dimensions were calculated using a procedure proposed by Dillon and Goldstein.59 Scale recovery curves, generated using a mixed modeling approach,60,61 were internally predictive, responsive,37,62 and consistent with what is known about the natural history of URI.
TABLE 2
RELIABILITY OF SYMPTOM DIMENSION MODELS
| Item Loading (SE)* | |
|---|---|
| Cough Dimension (Reliability = 0.794) | |
| Coughing | 2.01 (0.20) |
| Coughing stuff up | 1.75 (0.18) |
| Cough interfering with sleep | 1.16 (0.17) |
| Fever and Aches Dimension (Reliability = 0.753) | |
| Headache | 1.28 (0.23) |
| Fever | 1.07 (0.13) |
| Sweats | 1.25 (0.16) |
| Muscle aches | 1.76 (0.19) |
| Feeling run down | 1.17 (0.19) |
| Throat Dimension (Reliability = 0.668) | |
| Sore throat | 1.10 (0.22) |
| Scratchy throat | 1.73 (0.23) |
| Hoarseness | 1.68 (0.24) |
| Nasal Dimension (Reliability = 0.663) | |
| Runny nose | 1.93 (0.28) |
| Stuffy nose | 1.05 (0.23) |
| Sneezing | 1.63 (0.26) |
| *All significant at P < .05. | |
| SE denotes standard error. | |
Phase 2
Between July and December 2000, 108 persons from the general population responded to advertising by calling a telephone number listed on posted flyers and in the newspaper. Of these 108 callers, 27 were eligible but declined to participate; 7 did not meet inclusion criteria (were younger than 18 years of age, had current allergy symptoms, or did not have cold symptoms); and 74 met study criteria and elected to participate (Table 3). Those declining to participate usually did so because of inconvenience in arranging an immediate interview or because compensation ($10 for interview, $15 for focus group) was insufficient. Participants were met in person for semistructured individual interviews (n = 56) or focus groups (3 groups, 20 individuals total). Two people were interviewed both individually and in focus group.
Based on the information gained during interviews, the instrument-in-development underwent 6 revisions during 2000. Each modification was tested with additional interviews. A final version was created in December 2000. A few items from the initial instrument used in the echinacea trial were modified in response to participants’ descriptions and insights. Several other items were added to reflect symptoms and functional impairments described by participants in response to our open-ended questions. All items used wording provided by participants or tested during subsequent interviews and focus groups.
All symptoms spontaneously reported by at least 3 participants in either individual interview or focus group were included in the final version (Table 4). Figure 1 provides a frequency distribution of the symptoms described during the individual interviews.
On the basis of our participants’ comments, the distribution of severity data from the echinacea trial, and recommendations from published studies, we decided to decrease the response range from a 9-point to a 7-point Likert-type severity scale. The resulting severity range was marked at 1 (very mild), 3 (mild), 5 (moderate), and 7 (severe), following the majority opinion of our respondents. Unmarked (even-numbered) options were included, as most of the respondents felt they should have “in-between” choices. The functional outcome questions adapted from the SF-36 were replaced with participant-generated items, which were then scaled in a 7-point format similar to that used for the symptoms. A final question comparing today’s global severity with yesterday’s was added to provide a comparative measure of change over time (responsiveness). Figure 2 displays the final format of WURSS items.
The qualitative data provided by our informants improved our understanding of the symptomatic and functional impact of the common cold and assisted the development of the WURSS questionnaire. Although it is clear that people experience colds in different ways, several common threads emerged. For instance, we found that our original instrument (like the Jackson criteria) had overrated individual symptoms and had underrated functional impact, interference with social relationships, and general malaise. Informants often told us that it was not necessarily the individual symptoms that bothered them, but the general feelings, described as “sick feeling,” “loss of energy,” “run down,” “tired,” “fatigue,” “malaise,” “lousy,” “lazy,” “spacey," "blah," "yucky," "foggy," "lightheaded," "fuzzy brain,” “cloudy,” “disoriented,” “uncomfortable,” “distracted,” and “miserable.” Our informants also told us that they were bothered by the way their cold interfered with day-to-day activities and relationships. Colds affected physical activities such as breathing or walking, performance at work or in the home, and interactions with friends, family, and coworkers. Terms describing the most frequent and bothersome effects were incorporated into the final WURSS instrument.
TABLE 3
INTERVIEW AND FOCUS GROUP PARTICIPANT DEMOGRAPHICS
| Number | |
|---|---|
| Method of Data Collection | |
| Individual interviews | 56 |
| Focus groups | 20 |
| Total | 74* |
| Sex | |
| Women | 49 |
| Men | 25 |
| Ethnicity | |
| Native American | 2 |
| Black | 12 |
| Hispanic | 2 |
| White | 57 |
| No response | 1 |
| Annual Income | |
| < $10,000 | 28 |
| $10,000–19,999 | 17 |
| $20,000–29,999 | 13 |
| $30,000–49,999 | 9 |
| $50,000–75,000 | 3 |
| $75,000 | 2 |
| No response | 2 |
| Education | |
| Some high school | 13 |
| High school or equivalent | 11 |
| Some college | 11 |
| Associate or technical degree | 6 |
| Bachelor’s degree | 21 |
| Master’s degree | 6 |
| Professional degree | 4 |
| No response | 2 |
| Tobacco Use | |
| Current | 26 |
| Past | 19 |
| Never smoker | 28 |
| No response | 1 |
| *Two participants were used in both data collection methods. | |
| NOTE: Age range was 19 to 71 years, mean = 35.9 years (standard deviation, 11.9). | |
TABLE 4
SYMPTOMS AND FUNCTIONAL IMPAIRMENTS EVALUATED BY THE WISCONSIN UPPER RESPIRATORY SYMPTOM SURVEY
| Symptoms | Plugged ears |
| Cough | Ear discomfort |
| “Coughing stuff up” | Watery eyes |
| Cough interfering with sleep | Eye discomfort |
| Sore throat | Head congestion |
| Scratchy throat | Chest congestion |
| Hoarseness | Chest tightness |
| Runny nose | Heaviness in chest |
| Plugged nose | Lack of energy |
| Sneezing | Loss of appetite |
| Headache | |
| Body aches | Functional Impairments |
| Feeling “run down” | Think clearly |
| Sweats | Speak clearly |
| Chills | Sleep well |
| Feeling feverish | Breathe easily |
| Feeling dizzy | Walk, climb stairs, exercise |
| Feeling tired | Accomplish daily activities |
| Irritability | Work outside the home |
| Sinus pain | Work inside the home |
| Sinus pressure | Interact with others |
| Sinus drainage | Live your personal life |
| Swollen glands |
FIGURE 1
SYMPTOMS REPORTED IN INDIVIDUAL INTERVIEWS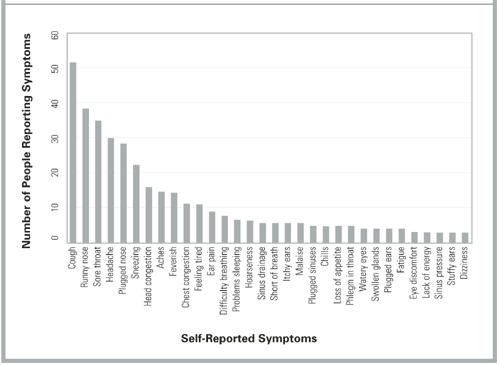
FIGURE 2
ITEM FORMAT FOR THE WISCONSIN UPPER RESPIRATORY SYMPTOM SURVEY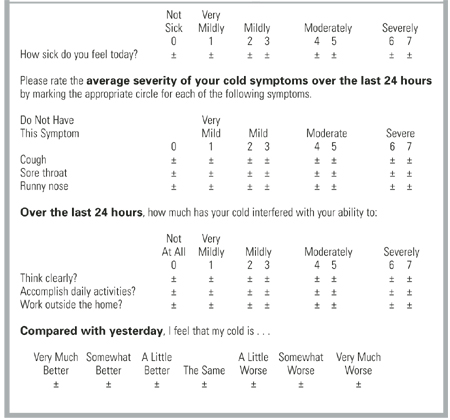
Discussion
Researchers of URIs and the common cold need a well-developed, standardized, validated outcomes instrument that reflects the experience and values of cold sufferers. While the Jackson scale and various modifications have been widely used, few data support the validity of these scales. Although correlations with external measures, such as physical examinations, mucus weight, and the ability to culture virus have been reported, the symptomatic and functional impact of colds has largely been neglected. Perhaps more important, the symptomatic measures used to date were apparently developed without significant input from the people whose illnesses were measured. Questionnaire development and cognitive testing methods have not been described, nor have adequate tests of psychometric properties been reported. Although the Jackson scale may demonstrate marginal face validity in terms of symptoms, it does not do so in terms of functional impact.
This article describes the first steps taken in the development and validation of a new illness-specific quality-of-life instrument for measuring the common cold. The WURSS instrument is more comprehensive than existing alternatives and better reflects cold-sufferers’ experiences and values. Therefore, it provides greater face validity. The length (44 items) reflects a compromise between ease of use and comprehensiveness.41 It is possible that a subset of the items will prove nearly as effective and that a short-form WURSS will eventually be available. Item reduction will need to be guided by both internal (factor analysis) and external (frequency and perceived value) considerations. The standardized 7-point severity scale used throughout the WURSS makes the instrument very easy to use.49 It also provides a severity range that our informants and previous researchers40,63,64 agree is optimal. The WURSS allows a cold-sufferer to swiftly and accurately assess his or her common cold. We hope that WURSS will prove worthy in terms of standard psychometric properties such as precision, reliability, and responsiveness.65-68 A large prospective study will be necessary for those assessments.
Limitations
The work described here has a number of limitations. The WURSS was developed in Madison, Wis., largely among people with self-diagnosed colds during the period from July to December 2000. The RCT occurred over several months in the spring of 1999 and was limited to college students. Our results are therefore limited by both population and etiologic agent, which in turn may influence the symptom and severity spectrums assessed. Although we aimed for and achieved a moderate degree of socioeconomic diversity (Table 3), our participants’ responses may not be representative of the larger universe of cold-sufferers. The symptom distribution in Figure 1, for example, is unlikely to represent global cold symptom frequency accurately. Previous research with both natural and induced colds suggests that nasal symptoms and sore throat are usually more frequent than cough.2,3,6-18 The comprehensiveness of the instrument is more important for instrument development than are the specific item frequencies. Here, we feel that we succeeded in representing a sufficient range of items.
Another important limitation is the inherent variability and subjectivity of information generated from qualitative research. A similar instrument development effort carried out by different researchers would inevitably yield a somewhat different questionnaire. Eliciting and formatting terminology that reflects symptomatic and functional impact presents a number of challenges. Future research could employ a quantitative importance scale for participants to use in assessing the value of symptoms and functional impacts. Such value scales could be used alongside factor analysis models of item and dimension frequency and severity. These could in turn be compared with external criteria such as physician assessment, tissue counts, and nasal mucus weights, measurements of inflammatory cytokines, and quantitative viral cultures. Because no gold standard exists, single-criterion validity assessment will not be sufficient. Instead, the concept of construct validity will need to be invoked for future attempts at validation. Construct validity has been defined as “validity assessed by comparing the results of several contrasting tests of validity (including concurrent, convergent, and divergent validation studies) with predictions from a theoretical model.”64 Our work so far has only begun to scratch the surface of such rigorous validity assessment.
Conclusions
We have developed an instrument that measures patient-oriented outcomes identified as important by people with self-diagnosed common colds. We expect that the WURSS will do well with physician-diagnosed “bronchitis,” “sinusitis,” or “pharyngitis,” but as yet have no data with which to evaluate that supposition. We hope that the development of the WURSS stimulates other researchers to undergo similar efforts at aimed at patient-oriented outcome measurement and that the efforts can be compared. We have made the WURSS available for general use by placing a printable facsimile online at http://www.fammed.wisc.edu/wurss/. University-based health care researchers and other nonprofit entities may use the WURSS freely, but we do ask to be notified of such use. For-profit entities should contact us before using this copyrighted instrument.
The next step will be for WURSS to undergo large-scale psychometric testing with the goal of assessing its internal and external validity properties more accurately. We welcome comments, consultation, and collaboration and hope to involve other researchers as we move further in the direction of an accurate and reliable method for assessing the impact of the common cold.
Acknowledgments
The authors would like to acknowledge the participants who contributed their time and energy while they were sick. We also thank the many physicians and coworkers who contributed their knowledge and opinions, especially Nora Cate Schaeffer, PhD; Mary Beth Plane, PhD; Jon Temte, MD, PhD; Donn D’Alessio, MD; and William Scheckler, MD, in Madison, Wis., and Jack Gwaltney, MD, in Charlottesville, Va. During most of this project, Dr Barrett has had support from the National Center for Complementary and Alter native Medicine at the National Institutes of Health, Grant #K23 AT00051-01.
1. Dingle JH, Badger GF, Jordan WS. Illness in the home: a study of 25,000 illnesses in a group of Cleveland families. Cleveland, Ohio: Western Reserve University Press; 1964.
2. Gwaltney JM, Hendley JO, Simon G, Jordan WS. Rhinovirus infections in an industrial population. JAMA 1967;202:158-64.
3. Monto AS, Ullman BM. Acute respiratory illness in an American community. JAMA 1974;227:164-9.
4. Smith MBH, Feldman W. Over-the-counter cold medications: a critical review of clinical trials between 1950 and 1991. JAMA 1993;269:2258-63.
5. Turner RB. The treatment of rhinovirus infections: progress and potential. Antiviral Res 2001;49:1-14.
6. Kleinman A. Culture, illness, and care: clinical lessons from anthropologic and cross-cultural research. Ann Intern Med 1978;88:251-8.
7. Jackson GG, Dowling HF, Spiesman IG, Boand AV. Transmission of the common cold to volunteers under controlled conditions. Arch Intern Med 1958;101:267-78.
8. Jackson GG, Dowling HF, Anderson TO, Riff L, Saporta J, Turck M. Susceptibility and immunity to common upper respiratory viral infections–the common cold. Ann Intern Med 1960;55:719-38.
9. Jackson GG, Dowling HF, Muldoon RL. Present concepts of the common cold. Am J Public Health 1962;52:940-5.
10. D’Alessio D, Peterson JA, Dick CR, Dick EC. Transmission of experimental rhinovirus colds in volunteer married couples. J Infect Dis 1976;133:28-36.
11. Dick EC, Jennings LC, Mink KA, Wartgrow CD, Inhorn SL. Aerosol transmission of rhinovirus colds. J Infect Dis 1987;156:442-8.
12. Gwaltney JM, Hendley JO. Transmission of experimental rhinovirus infection by contaminated surfaces. Am J Epidemiol 1982;116:828-33.
13. Hayden FG, Diamond L, Wood PB, Korts DC, Wecker MT. Effectiveness and safety of intranasal ipratropium bromide in common colds. Ann Intern Med 1996;125:89-97.
14. Cohen S, Frank E, Doyle WJ, Skoner DP, Rabin BS, Gwaltney JM. Types of stressors that increase susceptibility to the common cold in healthy adults. Health Psychol 1998;17:214-23.
15. Gern JE, Busse WW. Association of rhinovirus infections with asthma. Clin Microbiol Rev 1999;12:9-18.
16. Arruda E, Pitkäranta A, Witek TJ, Doyle CA, Hayden FG. Frequency and history of rhinovirus infections in adults during autumn. J Clin Microbiol 1997;35:2864-8.
17. Gwaltney JM, Buier RM, Rogers JL. The influence of signal variation, bias, noise and effect size on statistical significance in treatment studies of the common cold. Antiviral Res 1996;29:287-95.
18. Rao SS, Hendley JO, Hayden FG, Gwaltney JM. Symptom expression in natural and experimental rhinovirus colds. Am J Rhinol 1995;9:49-52.
19. Freymuth F, Vabret A, Brouard J, et al. Detection of viral, Chlamydia pneumoniae and Mycoplasma pneumoniae infections in exacerbations of asthma in children. J Clin Virol 1999;13:131-9.
20. Igarashi Y, Skoner DP, Doyle WJ, White MV, Fireman P, Kaliner MA. Analysis of nasal secretions during experimental rhinovirus upper respiratory infections. J Allergy Clin Immunol 1993;92:722-31.
21. Johnston SL, Papi A, Bates PJ, Mastronarde JG, Monick MM, Hunninghake GW. Low grade rhinovirus infection induces a prolonged release of IL-8 in pulmonary epithelium. J Immunol 1998;160:6172-81.
22. Teran LM, Johnston SL, Schroder JM, Church MK, Holgate ST. Role of nasal interleukin-8 in neutrophil recruitment and activation in children with virus induced asthma. Am J Respir Crit Care Med 1997;155:1362-6.
23. Korppi M, Kröger L. Laitinen. White blood cell and differential counts in acute respiratory viral and bacterial infections in children. Scand J Infect Dis 1993;25:435-40.
24. McBride TP, Doyle WJ, Hayden FG, Gwaltney JM. Alterations of the Eustachian tube, middle ear, and nose in rhinovirus infection. Arch Otolaryngol Head Neck Surg 1989;115:1054-9.
25. Gwaltney JM, Phillips CD, Miller RD, Riker DK. Computed tomographic study of the common cold. N Engl J Med 1994;330:25-30.
26. Turner BW, Cail WS, Hendley JO, et al. Physiologic abnormalities in the paranasal sinuses during experimental rhinovirus colds. J Allergy Clin Immunol 1992;90:474-8.
27. Dressler WE, Myers T, London SJ, Rankell AS, Poetsch CE. A system of rhinomanometry in the clinical evaluation of nasal decongestants. Ann Otol Rhinol Laryngol 1977;86:310-6.
28. Tomkinson A, Eccles R. Comparison of the relative abilities of acoustic rhinometry, rhinomanometry, and the visual analogue scale in detecting change in the nasal cavity in a healthy adult population. Am J Rhinol 1996;10:161-5.
29. Parekh HH, Cragun KT, Hayden FG, Hendley JO, Gwaltney JM. Nasal mucus weights in experimental rhinovirus infection. Am J Rhinol 1992;6:107-10.
30. Scaglione F, Lund B. Efficacy in the treatment of the common cold of a preparation containing an echinacea extract. Int J Immunopharmacol 1995;11:163-6.
31. Juniper EF, Guyatt GH, Griffith LE, Ferrie PJ. Interpretation of rhinoconjuctivitis quality of life questionnaire data. J Allergy Clin Immunol 1996;98:843-5.
32. Juniper EF. Measuring health-related quality of life in rhinitis. J Allergy Clin Immunol 1997;99:S742-9.
33. Kozma CM, Sadik MK, Watrous ML. Economic outcomes for the treatment of allergic rhinitis. PharmacoEconomics 1996;410:4-13.
34. Meltzer EO, Nathan RA, Selner JC, Storms W. The prevalence and medical and economic impact of allergic rhinitis in the United States. J Allergy Clin Immunol 1997;99:S807-28.
35. Meltzer EO, Nathan RA, Selner JC, Storms W. Quality of life and rhinitic symptoms: Result of a nationwide survey with the SF-36 and RQLQ questionnaires. J Allergy Clin Immunol 1997;99:815-9.
36. Piccirillo JF, Edwards D, Haiduk A, Yonan C, Thawley SE. Psychometric and clinimetric validity of the 31-item rhinosinusitis outcome measure (RSOM-31). Am J Rhinol 1995;9:297-306.
37. Deyo RA, Diehr P, Patrick DL. Reproducibility and responsiveness of health status measures. Controlled Clin Trials 1991;12(suppl 4):142S-158S.
38. Guyatt GH, Kirshner B, Jaeschke R. Measuring health status: What are the necessary measurement properties? J Clin Epidemiol 1992;45:1341-5.
39. Guyatt GH. Health status, quality of life, and the individual. JAMA 1994;272:630-1.
40. Juniper EF, Guyatt GH, Jaeschke R. How to develop and validate a new health-related quality of life instrument. In Spilker B, ed. Quality of life and pharmacoeconomics in clinical trials. Philadelphia, Pa: Lippincott-Raven; 1996;49-56.
41. Katz JN, Larson MG, Phillips CB. Comparative measurement sensitivity of short and longer health status instruments. Med Care 1992;30:917-25.
42. Schaeffer NC, Charng H-W. Two experiments in simplifying response categories: intensity and frequency categories. Sociol Perspect 1991;34:165-82.
43. Shrout PE, Yager TJ. Reliability and validity of screening scales: Effect of reducing scale length. J Clin Epidemiol 1989;42:69-78.
44. McHorney CA, Ware JE, Raczek AE. The MOS 36-item short-form health survey (SF-36): II. Psychometric and clinical tests of validity in measuring physical and mental health constructs. Med Care 1998;31:247-63.
45. Barrett B, Locken L, Maberry R, Brown RL, Bobula JA, D’Alessio D. A randomized double-blind trial of an unrefined mixture of Echinacea purpurea and E angustifolia used to treat the common cold: no benefit detected. Submitted for publication 2001.
46. Bullinger M, Anderson R, Cella D, Aaronson N. Developing and evaluating cross-cultural instruments from minimum requirements to optimal models. Qual Life Res 1993;2:451-9.
47. Fischer D, Stewart AL, Bloch DA, Lorig K, Laurent D, Holman H. Capturing the patient’s view of change as a clinical outcome measure. JAMA 1999;282:1157-62.
48. Harris-Kojetin LD, Fowler FJ, Brown JA, Schnaier JA, Sweeny SF. The use of cognitive testing to develop and evaluate CAHPS 1.0 core survey items. Consumer assessment of health plans study. Med Care 1999;37:MS10-21.
49. Mullin PA, Lohr KN, Bresnahan BW, McNulty P. Applying cognitive design principles to formatting HRQOL instruments. Qual Life Res 2000;9:13-27.
50. Schaeffer NC. Conversation with a purpose or conversation? Interaction in the standardized interview. In: Biemer P, Groves RM, Lyberg LE, Mathiowitz NA, Sudman S, eds. Measurement errors in surveys. New York, NY: Wiley; 1991;367-91.
51. Britten N. Qualitative interviews in medical research. BMJ 1995;311:251-3.
52. Crabtree BF, Miller WL. Qualitative approach to primary care research: the long interview. Fam Med 1991;23:145-51.
53. McCracken G. The long interview. Thousand Oaks, Calif: Sage Publications; 1988.
54. Hughes D, DuMont K. Using focus groups to facilitate culturally anchored research. Am J Community Psychol 1993;21:775-807.
55. Kitzinger J. Qualitative research: Introducing focus groups. BMJ 1995;311:299-302.
56. Morgan D. Focus groups and qualitative research. Thousand Oaks, Calif: Sage Publications; 1988.
57. Bolan KA. Structural equations with latent variables. New York, NY: John Wiley & Sons; 1989.
58. Joreskog KG, Sorbom D. LISREL 8 User’s Reference Guide. Chicago, Ill: Scientific Software International, Inc; 1993.
59. Dillon WR, Goldstein M. Multivariate analysis: methods and applications. New York, NY: John Wiley & Sons; 1984.
60. Davis CS. Semi-parametric and non-parametric methods for the analysis of repeated measurements with applications to clinical trials. Stat Med 1991;1:1959-80.
61. Goldstein H. Multilevel statistical models. New York: Halsted, 1995.
62. Hays RD, Hadom D. Responsiveness to change: an aspect of validity, not a separate dimension. Qual Life Res 1992;1:73-5.
63. Jaeschke R, Singer J, Guyatt GH. Measurement of health status: ascertaining the minimal clinically important difference. Control Clin Trials 1989;10:407-15.
64. McDowell I, Newell C. Measuring health: a guide to rating scales and questionnaires. Oxford, England: Oxford University Press; 1996.
65. Deyo RA, Centor RM. Assessing the responsiveness of functional scales to clinical change: an analogy to diagnostic test performance. J Chronic Dis 1986;39:897-906.
66. Guyatt GH, Walter S, Norman G. Measuring change over time: assessing the usefulness of evaluative instruments. J Chronic Dis 1987;40:171-8.
67. Hays RD, Anderson R, Revicki D. Psychometric considerations in evaluating health-related quality of life measures. Qual Life Res 1993;2:441-9.
68. Wright JG, Feinstein AR. A comparative contrast of clinimetric and psychometric methods for constructing indexes and rating scales. J Clin Epidemiol 1992;45:1201-18.
OBJECTIVE: To develop a sensitive, reliable, responsive, and easy-to-use instrument for assessing the severity and functional impact of the common cold.
STUDY DESIGN: We created an illness-specific health-related quality-of-life outcomes instrument using previous scales, expert opinion, and common knowledge. This original questionnaire was used in a 1999 randomized trial of echinacea for the common cold. In 2000 we employed cognitive interview and focus group qualitative methods to further develop the instrument. Semistructured interviews used open-ended questions to elicit symptoms, terminology, and perceived functional impact. Responses were used to improve the instrument.
POPULATION: The randomized trial watched 142 University of Wisconsin students for a total of 953 days of illness. The subsequent qualitative instrument development project recruited 74 adults with self-diagnosed colds for 56 in-person interviews and 3 focus groups.
OUTCOMES MEASURED: We measured specific symptoms, symptom clusters (dimensions), functional impact, and global severity.
RESULTS: The original questionnaire included 20 questions: a global severity indicator, 15 symptom-severity items using 9-point severity scales, and 4 yes/no functional assessments. Data from the trial provided evidence of 4 underlying dimensions: nasal, throat, cough, and fever and aches, with reliability coefficients of 0.663, 0.668, 0.794, and 0.753, respectively. Qualitative assessments from the interviews and focus groups led us to expand from 15 to 32 symptom-specific items and from 4 to 10 functional impairment items. The original 9-point severity scale was revised to 7 points. Two global severity questions bring the item count to 44. The instrument fits comfortably on the front and back of a single sheet of paper and takes 5 to 10 minutes to complete.
CONCLUSIONS: The Wisconsin Upper Respiratory Symptom Survey (WURSS) is now ready for formal validity testing or practical use in common cold research.
The common cold, usually caused by viral infection of the upper respiratory tract, is a very prevalent illness. On average, US adults suffer from 1 to 4 episodes per year.1-3 This high incidence, along with significant symptomatic and functional impairment, combine to make this syndrome an important health problem. Hundreds of trials have attempted to demonstrate effective treatments.4,5 Unfortunately, few efforts have been made to develop and validate instruments to measure the symptomatic and functional impact of the common cold.
The term “upper respiratory infection” (URI) is a nosologic category constructed by physicians and other health professionals to reflect an upper airway, mucus-producing, inflammatory reaction to infection, usually viral. It is a disease category. The terms rhinitis, rhinosinusitis, pharyngitis, and bronchitis are often used to indicate the anatomic area most affected. The term “common cold” is an illness term constructed and used by the general populace. This distinction between professional (disease) and popular (illness) conceptions6 provides the reasoning for participant-based, patient-oriented qualitative development of measurement tools. While many medical professionals may choose to measure URI disease by physical examination, viral culture, or laboratory analysis of blood or nasal discharge, we believe that most people are more interested in how they can reduce the severity and duration of their symptoms and the functional impairments that result from their illness.
George Gee Jackson and colleagues7 began experimental work in the 1950s, observing and recording the cold symptoms produced by challenging more than 1,000 volunteers with filtered nasal secretions obtained from cold-sufferers. Eight symptoms–sneezing, headache, malaise, chilliness, nasal discharge, nasal obstruction, sore throat, and cough–were selected for evaluation and graded as absent (0), mild (1), moderate (2), or severe (3) every day for 6 days after inoculation. A score of 14 or higher was chosen as the cutoff value that best distinguished infected from noninfected participants. Thus, the original Jackson scale was apparently designed to discriminate between those with and without demonstrable viral infection, and not as a measure of severity. The tables and graphics in Jackson’s seminal works point toward reasonable internal consistency and discriminate validity.7-9 However, other important measurement properties, such as precision, reliability, responsiveness, and stability, were not reported. Despite these limitations, Jackson’s scale has been used for decades by most of the major common cold research groups.10-15
Using various modifications of the Jackson scale, researchers of the cold have characterized the frequency and severity of the 8 symptoms noted above in both natural colds and experimentally induced rhinovirus infections. Variability in symptom expression remains a hallmark of URI. Although specific pathogens are associated with the severity and distribution of symptoms at the population level, symptoms are poor predictors of etiology at the individual level. Infection itself is an imperfect predictor of symptom expression, as asymptomatic infections occur frequently, and as URI-like symptoms occur in people in whom it is not possible to demonstrate infections.16 Even among people with documented experimental infections of single strains of virus, variance outweighs central tendency in all symptom measurements.17,18
The search for objective disease measures with which to compare symptom scores has also progressed. To date, the following measures have been evaluated: detection of virus with culture or polymerase chain reaction,16,19 cytokine measurement,20-22 serologic markers,23 physical examination,9,24 radiologic imaging,25,26 rhinomanometry,27,28 mucus weight,29 mucus velocity, and number of tissues used.30 None have been shown to be superior to self-reported symptoms in terms of precision, reliability, or responsiveness or in their ability to predict functional impairment or subsequent illness. Perhaps more important, none have been shown to reflect the values of the people who experience colds. Although a number of quality-of-life instruments have been developed to assess allergic rhinitis,31-36 we have been unable to locate any specifically developed to assess URI.
We therefore decided to develop the Wisconsin Upper Respiratory Symptom Survey (WURSS) to provide a standardized measure for evaluating the negative consequences of the common cold. We were particularly interested in developing a health-related quality of life instrument that would represent the symptomatic and functional dimensions that are important to cold-sufferers.37-40 The instrument should be able to discriminate accurately between active intervention and placebo effects in randomized therapeutic trials and should balance brevity and ease of use with optimal precision, reliability, and responsiveness.41-43 It should be based on self-diagnosis and self-assessment because neither accepted criteria nor adequate tests are available to diagnose “upper respiratory infection” or “acute infectious rhinosinusitis”(with or without “pharyngitis”) and because the vast majority of cold treatments will be taken without professional input after self-diagnosis.
Methods
Phase 1: Initial development during a randomized trial
The development of this study began in 1998 during the design of a randomized controlled trial (RCT) of echinacea as a cold treatment. We created our first instrument by showing successive drafts to friends and colleagues (mostly family physicians), stopping once we were satisfied that the questionnaire had reasonable face validity. This initial instrument rated global severity of illness (“How sick do you feel today?”) and 15 individual symptoms on a 9-point Likert-type scale. The 15 symptom-measuring items were complemented by 4 dichotomous (yes/no) functional outcome questions, adapted with permission from the validated Medical Outcomes Study 36-item Short-Form Health Survey (SF-36).44
This initial instrument was used in the spring of 1999 in the echinacea RCT.45 This experience provided a good initial test of our instrument, as the participants were recruited within 36 hours of their first symptom and monitored each day until they had answered “No” to the question, “Do you think that you are still sick today?” for 2 days in a row. Each participant was asked to fill out the questionnaire both on paper and on a computerized data-collecting facsimile (available at http://www.fammed.wisc.edu/samplecold).
Phase 2: Further instrument development using qualitative methods
After the echinacea RCT was completed, our primary concern was that we might be overlooking or under-representing important illness domains. We also suspected that wording, question order, response range, and other formatting concerns could be improved. To achieve these goals, we used qualitative instrument-development methodologies, involving the people we wanted to measure–cold-sufferers–in the development process.40,46-50
After obtaining approval from the University of Wisconsin Medical School Human Subjects Committee, we began interviewing Madison-area adults who responded to community advertising asking for volunteers with colds. Inclusion criteria required answering “Yes” to the question, “Do you believe that you have a cold?” For an interview to be arranged, at least one cold symptom had to be present, and the research assistant had to be convinced that the caller was indeed suffering from a common cold. Prospective participants with itchy eyes, sneezing, or a history of allergy were excluded if either the participant or the interviewer felt that any current symptoms might have been caused by allergy. Interviews were held in a location of mutual convenience and with the aid of an interview guide developed by our research team. Interviewers were carefully trained in the research protocol and used interview guides for both the initial telephone screen and the in-person interviews. Interviewers included both clinicians and nonclinicians.
The semistructured interview guide used open-ended questions designed to elicit the participants’ own terminology for describing their colds (Table 1).51-53 We aimed for an understanding of how the experience of the cold influenced the lives of the participants. Participants were first asked to list all their symptoms, then to describe how each symptom bothered them. Next, we asked which symptom(s) appeared first and which one(s) followed. We then asked which symptoms were most bothersome and why. Participants were asked to describe what they did to relieve their cold symptoms, why, and whether the therapy provided any relief. Participants were then asked about how their cold affected their lifestyle with regard to work, relationships, activities, and so forth. Additionally, we asked about symptoms and effects of previous colds. This exploratory phase of the interview lasted approximately 20 to 30 minutes.
Once the interviewer had a thorough description and understanding of the participant’s cold, the participant was asked to complete the questionnaire-in-development. After marking answers on the questionnaire (which took 3 to 5 minutes), each participant was asked to comment on its ease of use, item wording, formatting, and response range as well as whether it accurately and comprehensively measured the symptoms and functional impact they were experiencing. The instrument development phase of the interview lasted for another 20 to 30 minutes.
We used focus group methods in the final month of the study as an additional window into participants’ experiences.54-56 The focus groups used the same inclusion criteria as the long interviews and followed the same general format, first using open-ended questions to elicit symptoms and their impact, then administrating the questionnaire and discussing item inclusion and formatting. However, we encouraged discussion rather than self-assessment, as the focus group methodology derives its strength from the interactive nature of conversation. For instance, a statement made by one participant would spark interest or recall in another, thereby generating a richer, fuller, and more representative description of symptoms and functional impact.
Individual interviews were held by 1 of 5 trained interviewers (B.B., L.L., R.M., E.S., J.S.). All 3 focus groups were run by the lead author, with at least 1 other research team member assisting. Interviews and focus groups were arranged as soon as possible after the initial telephone contact so that participants would still have cold symptoms while being interviewed. All interviews and focus groups were discussed in biweekly group meetings. Decisions on item inclusion, wording, and questionnaire format were made by research group consensus. Several versions of the questionnaire were brought back to cold-sufferers for further cognitive testing. The diversity of interviewers and respondents provided protection against personal bias in ascertaining and interpreting symptoms and impairments.
TABLE 1
QUESTIONS ASKED DURING INTERVIEW
| Current Symptom History and Evaluation |
|---|
| List and describe all symptoms you have with this cold. |
| How do these symptoms bother you? |
| What is the first symptom you noticed when getting this cold? The Next? |
| The next? |
| Which cold symptom bothers you the most? How and why? |
| Are there other symptoms that bother you? How and why? |
| Interventions |
| What do you do to relieve cold symptoms? Why? |
| What over-the-counter medicines would you use? Why? Did it help? |
| What herbal medicines would you use? Why? Did it help? |
| Do you do anything else to relieve symptoms or treat your cold? Why? |
| Did it help? |
| When would you see a doctor or other health care provider? Why? |
| Lifestyle |
| Has this cold interfered with your normal activities? How? |
| When does a cold keep you from doing what you want or need to do? How? |
| Describe what things are harder to do? |
| Previous Symptom History and Evaluation |
| How many colds did you have this past year? |
| How long did they usually last? |
| List and describe what symptoms you usually get with your colds? |
| How do these symptoms bother you? |
| Survey Evaluation (After Participant Has Completed the Questionnaire) |
| Is this form easy to read? |
| Are there any other symptoms that should be on this questionnaire? |
| Are there any questions that shouldn’t be there? |
| Are there any questions that could be worded better? |
| Is the 7-point scale appropriate? Why or why not? |
Results
Phase 1
Of the 148 college students enrolled, 142 followed protocol and were included in the analysis. Of the 853 person-days documented, 546 (64%) were covered by both data systems; 287 (33.6%) came from paper surveys only; and 18 (2.1%) were filled out via computer only. Because only 2 (0.2%) questionnaires were missing any data, our data capture rate was 99.8%. Comparing data from the computerized and paper data sources provided evidence of consistency. Of the 546 days in which both paper and computer instruments provided data, 512 yielded identical responses (94% concordant) to the global severity of illness question. Of the 34 (6%) discrepancies, 29 were off by 1 point on the 9-point Likert-type scale and 5 discrepancies were off by 2 points. Comparing computer and paper responses with the 15 specific symptom questions also yielded high levels of concordance. Of 8190 item responses, 7777 (95%) were concordant, while 413 (5%) were classified as data discrepancies. Of these, 293 were off by 1 point on the 9-point scale; 68 were off by 2 points; 27, by 3 points; 17, by 4 points; 7, by 5 points; and 1 by 6 points.
Factor analysis of the data provided further evidence of internal validity. Structural equation modeling techniques57,58 were used to model symptom severities over time. A 4-dimensional symptom-recovery model (df = 71; P = .000025) provided a goodness of fit index of 0.88, a root mean square residual of .095, and a chi-squared/df ratio of 139/71 = 1.95. From the pool of 15 scaled symptom scores, 14 items contributed significantly to the model. (In this data set, loss of appetite was an infrequent symptom contributing insignificantly toward the model, and was dropped.) The 14 symptoms naturally aggregated into 4 underlying symptomatic dimensions: cough, throat, nasal, and fever and aches. Table 2 provides the reliability coefficients, standardized item loading coefficients, and standard errors of these loadings for the 4 dimensions. The reliability coefficients of the symptom dimensions were calculated using a procedure proposed by Dillon and Goldstein.59 Scale recovery curves, generated using a mixed modeling approach,60,61 were internally predictive, responsive,37,62 and consistent with what is known about the natural history of URI.
TABLE 2
RELIABILITY OF SYMPTOM DIMENSION MODELS
| Item Loading (SE)* | |
|---|---|
| Cough Dimension (Reliability = 0.794) | |
| Coughing | 2.01 (0.20) |
| Coughing stuff up | 1.75 (0.18) |
| Cough interfering with sleep | 1.16 (0.17) |
| Fever and Aches Dimension (Reliability = 0.753) | |
| Headache | 1.28 (0.23) |
| Fever | 1.07 (0.13) |
| Sweats | 1.25 (0.16) |
| Muscle aches | 1.76 (0.19) |
| Feeling run down | 1.17 (0.19) |
| Throat Dimension (Reliability = 0.668) | |
| Sore throat | 1.10 (0.22) |
| Scratchy throat | 1.73 (0.23) |
| Hoarseness | 1.68 (0.24) |
| Nasal Dimension (Reliability = 0.663) | |
| Runny nose | 1.93 (0.28) |
| Stuffy nose | 1.05 (0.23) |
| Sneezing | 1.63 (0.26) |
| *All significant at P < .05. | |
| SE denotes standard error. | |
Phase 2
Between July and December 2000, 108 persons from the general population responded to advertising by calling a telephone number listed on posted flyers and in the newspaper. Of these 108 callers, 27 were eligible but declined to participate; 7 did not meet inclusion criteria (were younger than 18 years of age, had current allergy symptoms, or did not have cold symptoms); and 74 met study criteria and elected to participate (Table 3). Those declining to participate usually did so because of inconvenience in arranging an immediate interview or because compensation ($10 for interview, $15 for focus group) was insufficient. Participants were met in person for semistructured individual interviews (n = 56) or focus groups (3 groups, 20 individuals total). Two people were interviewed both individually and in focus group.
Based on the information gained during interviews, the instrument-in-development underwent 6 revisions during 2000. Each modification was tested with additional interviews. A final version was created in December 2000. A few items from the initial instrument used in the echinacea trial were modified in response to participants’ descriptions and insights. Several other items were added to reflect symptoms and functional impairments described by participants in response to our open-ended questions. All items used wording provided by participants or tested during subsequent interviews and focus groups.
All symptoms spontaneously reported by at least 3 participants in either individual interview or focus group were included in the final version (Table 4). Figure 1 provides a frequency distribution of the symptoms described during the individual interviews.
On the basis of our participants’ comments, the distribution of severity data from the echinacea trial, and recommendations from published studies, we decided to decrease the response range from a 9-point to a 7-point Likert-type severity scale. The resulting severity range was marked at 1 (very mild), 3 (mild), 5 (moderate), and 7 (severe), following the majority opinion of our respondents. Unmarked (even-numbered) options were included, as most of the respondents felt they should have “in-between” choices. The functional outcome questions adapted from the SF-36 were replaced with participant-generated items, which were then scaled in a 7-point format similar to that used for the symptoms. A final question comparing today’s global severity with yesterday’s was added to provide a comparative measure of change over time (responsiveness). Figure 2 displays the final format of WURSS items.
The qualitative data provided by our informants improved our understanding of the symptomatic and functional impact of the common cold and assisted the development of the WURSS questionnaire. Although it is clear that people experience colds in different ways, several common threads emerged. For instance, we found that our original instrument (like the Jackson criteria) had overrated individual symptoms and had underrated functional impact, interference with social relationships, and general malaise. Informants often told us that it was not necessarily the individual symptoms that bothered them, but the general feelings, described as “sick feeling,” “loss of energy,” “run down,” “tired,” “fatigue,” “malaise,” “lousy,” “lazy,” “spacey," "blah," "yucky," "foggy," "lightheaded," "fuzzy brain,” “cloudy,” “disoriented,” “uncomfortable,” “distracted,” and “miserable.” Our informants also told us that they were bothered by the way their cold interfered with day-to-day activities and relationships. Colds affected physical activities such as breathing or walking, performance at work or in the home, and interactions with friends, family, and coworkers. Terms describing the most frequent and bothersome effects were incorporated into the final WURSS instrument.
TABLE 3
INTERVIEW AND FOCUS GROUP PARTICIPANT DEMOGRAPHICS
| Number | |
|---|---|
| Method of Data Collection | |
| Individual interviews | 56 |
| Focus groups | 20 |
| Total | 74* |
| Sex | |
| Women | 49 |
| Men | 25 |
| Ethnicity | |
| Native American | 2 |
| Black | 12 |
| Hispanic | 2 |
| White | 57 |
| No response | 1 |
| Annual Income | |
| < $10,000 | 28 |
| $10,000–19,999 | 17 |
| $20,000–29,999 | 13 |
| $30,000–49,999 | 9 |
| $50,000–75,000 | 3 |
| $75,000 | 2 |
| No response | 2 |
| Education | |
| Some high school | 13 |
| High school or equivalent | 11 |
| Some college | 11 |
| Associate or technical degree | 6 |
| Bachelor’s degree | 21 |
| Master’s degree | 6 |
| Professional degree | 4 |
| No response | 2 |
| Tobacco Use | |
| Current | 26 |
| Past | 19 |
| Never smoker | 28 |
| No response | 1 |
| *Two participants were used in both data collection methods. | |
| NOTE: Age range was 19 to 71 years, mean = 35.9 years (standard deviation, 11.9). | |
TABLE 4
SYMPTOMS AND FUNCTIONAL IMPAIRMENTS EVALUATED BY THE WISCONSIN UPPER RESPIRATORY SYMPTOM SURVEY
| Symptoms | Plugged ears |
| Cough | Ear discomfort |
| “Coughing stuff up” | Watery eyes |
| Cough interfering with sleep | Eye discomfort |
| Sore throat | Head congestion |
| Scratchy throat | Chest congestion |
| Hoarseness | Chest tightness |
| Runny nose | Heaviness in chest |
| Plugged nose | Lack of energy |
| Sneezing | Loss of appetite |
| Headache | |
| Body aches | Functional Impairments |
| Feeling “run down” | Think clearly |
| Sweats | Speak clearly |
| Chills | Sleep well |
| Feeling feverish | Breathe easily |
| Feeling dizzy | Walk, climb stairs, exercise |
| Feeling tired | Accomplish daily activities |
| Irritability | Work outside the home |
| Sinus pain | Work inside the home |
| Sinus pressure | Interact with others |
| Sinus drainage | Live your personal life |
| Swollen glands |
FIGURE 1
SYMPTOMS REPORTED IN INDIVIDUAL INTERVIEWS
FIGURE 2
ITEM FORMAT FOR THE WISCONSIN UPPER RESPIRATORY SYMPTOM SURVEY
Discussion
Researchers of URIs and the common cold need a well-developed, standardized, validated outcomes instrument that reflects the experience and values of cold sufferers. While the Jackson scale and various modifications have been widely used, few data support the validity of these scales. Although correlations with external measures, such as physical examinations, mucus weight, and the ability to culture virus have been reported, the symptomatic and functional impact of colds has largely been neglected. Perhaps more important, the symptomatic measures used to date were apparently developed without significant input from the people whose illnesses were measured. Questionnaire development and cognitive testing methods have not been described, nor have adequate tests of psychometric properties been reported. Although the Jackson scale may demonstrate marginal face validity in terms of symptoms, it does not do so in terms of functional impact.
This article describes the first steps taken in the development and validation of a new illness-specific quality-of-life instrument for measuring the common cold. The WURSS instrument is more comprehensive than existing alternatives and better reflects cold-sufferers’ experiences and values. Therefore, it provides greater face validity. The length (44 items) reflects a compromise between ease of use and comprehensiveness.41 It is possible that a subset of the items will prove nearly as effective and that a short-form WURSS will eventually be available. Item reduction will need to be guided by both internal (factor analysis) and external (frequency and perceived value) considerations. The standardized 7-point severity scale used throughout the WURSS makes the instrument very easy to use.49 It also provides a severity range that our informants and previous researchers40,63,64 agree is optimal. The WURSS allows a cold-sufferer to swiftly and accurately assess his or her common cold. We hope that WURSS will prove worthy in terms of standard psychometric properties such as precision, reliability, and responsiveness.65-68 A large prospective study will be necessary for those assessments.
Limitations
The work described here has a number of limitations. The WURSS was developed in Madison, Wis., largely among people with self-diagnosed colds during the period from July to December 2000. The RCT occurred over several months in the spring of 1999 and was limited to college students. Our results are therefore limited by both population and etiologic agent, which in turn may influence the symptom and severity spectrums assessed. Although we aimed for and achieved a moderate degree of socioeconomic diversity (Table 3), our participants’ responses may not be representative of the larger universe of cold-sufferers. The symptom distribution in Figure 1, for example, is unlikely to represent global cold symptom frequency accurately. Previous research with both natural and induced colds suggests that nasal symptoms and sore throat are usually more frequent than cough.2,3,6-18 The comprehensiveness of the instrument is more important for instrument development than are the specific item frequencies. Here, we feel that we succeeded in representing a sufficient range of items.
Another important limitation is the inherent variability and subjectivity of information generated from qualitative research. A similar instrument development effort carried out by different researchers would inevitably yield a somewhat different questionnaire. Eliciting and formatting terminology that reflects symptomatic and functional impact presents a number of challenges. Future research could employ a quantitative importance scale for participants to use in assessing the value of symptoms and functional impacts. Such value scales could be used alongside factor analysis models of item and dimension frequency and severity. These could in turn be compared with external criteria such as physician assessment, tissue counts, and nasal mucus weights, measurements of inflammatory cytokines, and quantitative viral cultures. Because no gold standard exists, single-criterion validity assessment will not be sufficient. Instead, the concept of construct validity will need to be invoked for future attempts at validation. Construct validity has been defined as “validity assessed by comparing the results of several contrasting tests of validity (including concurrent, convergent, and divergent validation studies) with predictions from a theoretical model.”64 Our work so far has only begun to scratch the surface of such rigorous validity assessment.
Conclusions
We have developed an instrument that measures patient-oriented outcomes identified as important by people with self-diagnosed common colds. We expect that the WURSS will do well with physician-diagnosed “bronchitis,” “sinusitis,” or “pharyngitis,” but as yet have no data with which to evaluate that supposition. We hope that the development of the WURSS stimulates other researchers to undergo similar efforts at aimed at patient-oriented outcome measurement and that the efforts can be compared. We have made the WURSS available for general use by placing a printable facsimile online at http://www.fammed.wisc.edu/wurss/. University-based health care researchers and other nonprofit entities may use the WURSS freely, but we do ask to be notified of such use. For-profit entities should contact us before using this copyrighted instrument.
The next step will be for WURSS to undergo large-scale psychometric testing with the goal of assessing its internal and external validity properties more accurately. We welcome comments, consultation, and collaboration and hope to involve other researchers as we move further in the direction of an accurate and reliable method for assessing the impact of the common cold.
Acknowledgments
The authors would like to acknowledge the participants who contributed their time and energy while they were sick. We also thank the many physicians and coworkers who contributed their knowledge and opinions, especially Nora Cate Schaeffer, PhD; Mary Beth Plane, PhD; Jon Temte, MD, PhD; Donn D’Alessio, MD; and William Scheckler, MD, in Madison, Wis., and Jack Gwaltney, MD, in Charlottesville, Va. During most of this project, Dr Barrett has had support from the National Center for Complementary and Alter native Medicine at the National Institutes of Health, Grant #K23 AT00051-01.
1. Dingle JH, Badger GF, Jordan WS. Illness in the home: a study of 25,000 illnesses in a group of Cleveland families. Cleveland, Ohio: Western Reserve University Press; 1964.
2. Gwaltney JM, Hendley JO, Simon G, Jordan WS. Rhinovirus infections in an industrial population. JAMA 1967;202:158-64.
3. Monto AS, Ullman BM. Acute respiratory illness in an American community. JAMA 1974;227:164-9.
4. Smith MBH, Feldman W. Over-the-counter cold medications: a critical review of clinical trials between 1950 and 1991. JAMA 1993;269:2258-63.
5. Turner RB. The treatment of rhinovirus infections: progress and potential. Antiviral Res 2001;49:1-14.
6. Kleinman A. Culture, illness, and care: clinical lessons from anthropologic and cross-cultural research. Ann Intern Med 1978;88:251-8.
7. Jackson GG, Dowling HF, Spiesman IG, Boand AV. Transmission of the common cold to volunteers under controlled conditions. Arch Intern Med 1958;101:267-78.
8. Jackson GG, Dowling HF, Anderson TO, Riff L, Saporta J, Turck M. Susceptibility and immunity to common upper respiratory viral infections–the common cold. Ann Intern Med 1960;55:719-38.
9. Jackson GG, Dowling HF, Muldoon RL. Present concepts of the common cold. Am J Public Health 1962;52:940-5.
10. D’Alessio D, Peterson JA, Dick CR, Dick EC. Transmission of experimental rhinovirus colds in volunteer married couples. J Infect Dis 1976;133:28-36.
11. Dick EC, Jennings LC, Mink KA, Wartgrow CD, Inhorn SL. Aerosol transmission of rhinovirus colds. J Infect Dis 1987;156:442-8.
12. Gwaltney JM, Hendley JO. Transmission of experimental rhinovirus infection by contaminated surfaces. Am J Epidemiol 1982;116:828-33.
13. Hayden FG, Diamond L, Wood PB, Korts DC, Wecker MT. Effectiveness and safety of intranasal ipratropium bromide in common colds. Ann Intern Med 1996;125:89-97.
14. Cohen S, Frank E, Doyle WJ, Skoner DP, Rabin BS, Gwaltney JM. Types of stressors that increase susceptibility to the common cold in healthy adults. Health Psychol 1998;17:214-23.
15. Gern JE, Busse WW. Association of rhinovirus infections with asthma. Clin Microbiol Rev 1999;12:9-18.
16. Arruda E, Pitkäranta A, Witek TJ, Doyle CA, Hayden FG. Frequency and history of rhinovirus infections in adults during autumn. J Clin Microbiol 1997;35:2864-8.
17. Gwaltney JM, Buier RM, Rogers JL. The influence of signal variation, bias, noise and effect size on statistical significance in treatment studies of the common cold. Antiviral Res 1996;29:287-95.
18. Rao SS, Hendley JO, Hayden FG, Gwaltney JM. Symptom expression in natural and experimental rhinovirus colds. Am J Rhinol 1995;9:49-52.
19. Freymuth F, Vabret A, Brouard J, et al. Detection of viral, Chlamydia pneumoniae and Mycoplasma pneumoniae infections in exacerbations of asthma in children. J Clin Virol 1999;13:131-9.
20. Igarashi Y, Skoner DP, Doyle WJ, White MV, Fireman P, Kaliner MA. Analysis of nasal secretions during experimental rhinovirus upper respiratory infections. J Allergy Clin Immunol 1993;92:722-31.
21. Johnston SL, Papi A, Bates PJ, Mastronarde JG, Monick MM, Hunninghake GW. Low grade rhinovirus infection induces a prolonged release of IL-8 in pulmonary epithelium. J Immunol 1998;160:6172-81.
22. Teran LM, Johnston SL, Schroder JM, Church MK, Holgate ST. Role of nasal interleukin-8 in neutrophil recruitment and activation in children with virus induced asthma. Am J Respir Crit Care Med 1997;155:1362-6.
23. Korppi M, Kröger L. Laitinen. White blood cell and differential counts in acute respiratory viral and bacterial infections in children. Scand J Infect Dis 1993;25:435-40.
24. McBride TP, Doyle WJ, Hayden FG, Gwaltney JM. Alterations of the Eustachian tube, middle ear, and nose in rhinovirus infection. Arch Otolaryngol Head Neck Surg 1989;115:1054-9.
25. Gwaltney JM, Phillips CD, Miller RD, Riker DK. Computed tomographic study of the common cold. N Engl J Med 1994;330:25-30.
26. Turner BW, Cail WS, Hendley JO, et al. Physiologic abnormalities in the paranasal sinuses during experimental rhinovirus colds. J Allergy Clin Immunol 1992;90:474-8.
27. Dressler WE, Myers T, London SJ, Rankell AS, Poetsch CE. A system of rhinomanometry in the clinical evaluation of nasal decongestants. Ann Otol Rhinol Laryngol 1977;86:310-6.
28. Tomkinson A, Eccles R. Comparison of the relative abilities of acoustic rhinometry, rhinomanometry, and the visual analogue scale in detecting change in the nasal cavity in a healthy adult population. Am J Rhinol 1996;10:161-5.
29. Parekh HH, Cragun KT, Hayden FG, Hendley JO, Gwaltney JM. Nasal mucus weights in experimental rhinovirus infection. Am J Rhinol 1992;6:107-10.
30. Scaglione F, Lund B. Efficacy in the treatment of the common cold of a preparation containing an echinacea extract. Int J Immunopharmacol 1995;11:163-6.
31. Juniper EF, Guyatt GH, Griffith LE, Ferrie PJ. Interpretation of rhinoconjuctivitis quality of life questionnaire data. J Allergy Clin Immunol 1996;98:843-5.
32. Juniper EF. Measuring health-related quality of life in rhinitis. J Allergy Clin Immunol 1997;99:S742-9.
33. Kozma CM, Sadik MK, Watrous ML. Economic outcomes for the treatment of allergic rhinitis. PharmacoEconomics 1996;410:4-13.
34. Meltzer EO, Nathan RA, Selner JC, Storms W. The prevalence and medical and economic impact of allergic rhinitis in the United States. J Allergy Clin Immunol 1997;99:S807-28.
35. Meltzer EO, Nathan RA, Selner JC, Storms W. Quality of life and rhinitic symptoms: Result of a nationwide survey with the SF-36 and RQLQ questionnaires. J Allergy Clin Immunol 1997;99:815-9.
36. Piccirillo JF, Edwards D, Haiduk A, Yonan C, Thawley SE. Psychometric and clinimetric validity of the 31-item rhinosinusitis outcome measure (RSOM-31). Am J Rhinol 1995;9:297-306.
37. Deyo RA, Diehr P, Patrick DL. Reproducibility and responsiveness of health status measures. Controlled Clin Trials 1991;12(suppl 4):142S-158S.
38. Guyatt GH, Kirshner B, Jaeschke R. Measuring health status: What are the necessary measurement properties? J Clin Epidemiol 1992;45:1341-5.
39. Guyatt GH. Health status, quality of life, and the individual. JAMA 1994;272:630-1.
40. Juniper EF, Guyatt GH, Jaeschke R. How to develop and validate a new health-related quality of life instrument. In Spilker B, ed. Quality of life and pharmacoeconomics in clinical trials. Philadelphia, Pa: Lippincott-Raven; 1996;49-56.
41. Katz JN, Larson MG, Phillips CB. Comparative measurement sensitivity of short and longer health status instruments. Med Care 1992;30:917-25.
42. Schaeffer NC, Charng H-W. Two experiments in simplifying response categories: intensity and frequency categories. Sociol Perspect 1991;34:165-82.
43. Shrout PE, Yager TJ. Reliability and validity of screening scales: Effect of reducing scale length. J Clin Epidemiol 1989;42:69-78.
44. McHorney CA, Ware JE, Raczek AE. The MOS 36-item short-form health survey (SF-36): II. Psychometric and clinical tests of validity in measuring physical and mental health constructs. Med Care 1998;31:247-63.
45. Barrett B, Locken L, Maberry R, Brown RL, Bobula JA, D’Alessio D. A randomized double-blind trial of an unrefined mixture of Echinacea purpurea and E angustifolia used to treat the common cold: no benefit detected. Submitted for publication 2001.
46. Bullinger M, Anderson R, Cella D, Aaronson N. Developing and evaluating cross-cultural instruments from minimum requirements to optimal models. Qual Life Res 1993;2:451-9.
47. Fischer D, Stewart AL, Bloch DA, Lorig K, Laurent D, Holman H. Capturing the patient’s view of change as a clinical outcome measure. JAMA 1999;282:1157-62.
48. Harris-Kojetin LD, Fowler FJ, Brown JA, Schnaier JA, Sweeny SF. The use of cognitive testing to develop and evaluate CAHPS 1.0 core survey items. Consumer assessment of health plans study. Med Care 1999;37:MS10-21.
49. Mullin PA, Lohr KN, Bresnahan BW, McNulty P. Applying cognitive design principles to formatting HRQOL instruments. Qual Life Res 2000;9:13-27.
50. Schaeffer NC. Conversation with a purpose or conversation? Interaction in the standardized interview. In: Biemer P, Groves RM, Lyberg LE, Mathiowitz NA, Sudman S, eds. Measurement errors in surveys. New York, NY: Wiley; 1991;367-91.
51. Britten N. Qualitative interviews in medical research. BMJ 1995;311:251-3.
52. Crabtree BF, Miller WL. Qualitative approach to primary care research: the long interview. Fam Med 1991;23:145-51.
53. McCracken G. The long interview. Thousand Oaks, Calif: Sage Publications; 1988.
54. Hughes D, DuMont K. Using focus groups to facilitate culturally anchored research. Am J Community Psychol 1993;21:775-807.
55. Kitzinger J. Qualitative research: Introducing focus groups. BMJ 1995;311:299-302.
56. Morgan D. Focus groups and qualitative research. Thousand Oaks, Calif: Sage Publications; 1988.
57. Bolan KA. Structural equations with latent variables. New York, NY: John Wiley & Sons; 1989.
58. Joreskog KG, Sorbom D. LISREL 8 User’s Reference Guide. Chicago, Ill: Scientific Software International, Inc; 1993.
59. Dillon WR, Goldstein M. Multivariate analysis: methods and applications. New York, NY: John Wiley & Sons; 1984.
60. Davis CS. Semi-parametric and non-parametric methods for the analysis of repeated measurements with applications to clinical trials. Stat Med 1991;1:1959-80.
61. Goldstein H. Multilevel statistical models. New York: Halsted, 1995.
62. Hays RD, Hadom D. Responsiveness to change: an aspect of validity, not a separate dimension. Qual Life Res 1992;1:73-5.
63. Jaeschke R, Singer J, Guyatt GH. Measurement of health status: ascertaining the minimal clinically important difference. Control Clin Trials 1989;10:407-15.
64. McDowell I, Newell C. Measuring health: a guide to rating scales and questionnaires. Oxford, England: Oxford University Press; 1996.
65. Deyo RA, Centor RM. Assessing the responsiveness of functional scales to clinical change: an analogy to diagnostic test performance. J Chronic Dis 1986;39:897-906.
66. Guyatt GH, Walter S, Norman G. Measuring change over time: assessing the usefulness of evaluative instruments. J Chronic Dis 1987;40:171-8.
67. Hays RD, Anderson R, Revicki D. Psychometric considerations in evaluating health-related quality of life measures. Qual Life Res 1993;2:441-9.
68. Wright JG, Feinstein AR. A comparative contrast of clinimetric and psychometric methods for constructing indexes and rating scales. J Clin Epidemiol 1992;45:1201-18.