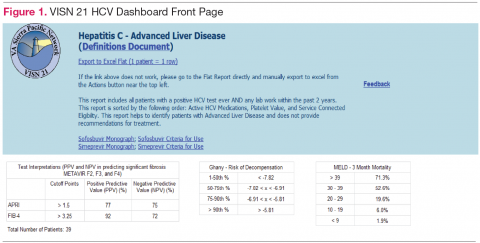
Population management. The VISN 21 HCV dashboard allows for a centralized approach to care across a large geographic area containing multiple facilities. One important function is to identify patients with advanced liver disease as well as those who have not been seen in specialty care within the previous 2 years. It also allows for pretreatment screening through identification of HCV viral characteristics (eg, genotype, viral load) and selected comorbidities (eg, renal function, mental health conditions) that may influence candidacy for specific antiviral therapies. Individual patient reports can be stratified by facility (eg, clinic or VAMC) to identify the burden of disease within a specific location.
Patient treatment outcome tracking. The HCV dashboard allows tracking of the numbers and characteristics of patients who have previously received antiviral therapy. The number of patients achieving virologic cure may be tracked at the VISN and station levels, or displayed based on user-selected parameters, such as treatment history.
Administrative planning. The high costs of HCV antiviral medication requires careful budgetary planning and close communication with local and regional leadership. The VISN 21 HCV dashboard provides information crucial to assessing future treatment needs. Specifically, it allows administrators to view the number of patients actively being treated. The dashboard also allows for comparison of treatment rates among different facilities and help allocate resources where needed.
Design Architecture
To construct the source data for the dashboards, relevant data elements are pulled into a base table using Structured Query Language (SQL) code. Subsequently, SQL Server Reporting Services (SSRS) (Microsoft, Redmond, WA) compiles the dashboard output into an interactive and user-friendly interface that can be tailored to individual end users’ needs.
Dashboard development process. Through collaboration and survey of clinical providers, clinical factors necessary to decide patient and treatment readiness were identified. Relevant data elements include HCV genotype, selected medical and psychiatric comorbidities, prior receipt of treatment, and presence of advanced liver disease. While liver disease severity may be determined by invasive means, such as liver biopsy, the dashboard offers a noninvasive assessment using laboratory values (eg, calculated Fibrosis 4 score, Model for End Stage Liver Disease score). 10,11
Once dashboard elements were selected, the variables were operationalized using data available in the CDW within the prescription, diagnostic, and laboratory data tables. As code was written, output was validated through chart review to ensure accuracy. Further validation was performed through comparison of the dashboard data with the clinical case registry, a registry of HCV viremic confirmed patients. Throughout dashboard development, the product was presented to end users to solicit requests for modifications. The code was refined over time to incorporate end user input.
Dashboard user interface . SSRS allows users to customize reports based on any variables defined within the data set including facility, severity of disease, HCV genotype, and prior antiviral treatment history among others. Results are displayed with summary information, including the total number of patients in the selected cohort, the number of patients who have been referred to a specialty liver clinic, and the number of patients who have been determined to achieve SVR. The end user has the option to export the results to excel for further use (eg, patient lists for telephone follow-up).


