Costs
We assessed changes in total dollars spent on cardiac enzyme testing during the pre- and postintervention periods. During the preintervention year, $9,400 (95% CI, $8,700-$10,100) was spent on average each month, which did not change significantly throughout the period. During the postintervention year, the cost was stable at $5,000 (95% CI, $4,600-$5,300) on average each month, a reduction of $4,400 (95% CI, $3,700-$5,100) (Figure 2).
CK-MB and Troponin Tests per Patient
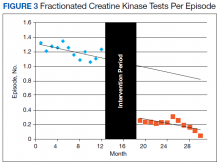
To further assess ordering practices for cardiac enzyme testing, we compared the changes in the monthly number of tests and the average number of CK-MB and troponin tests ordered per episode pre- and postintervention. On average during the preintervention year, 297 tests (95% CI, 278-315) were run per month, with an average of 1.21 CK tests (95% CI, 1.15-1.27) per episode (Table 2, Figure 3).
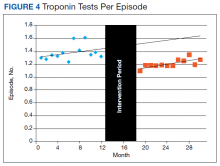
During the preintervention year, the total number of CK tests remained steady, but tests ordered per episode slowly decreased by 0.017 (95% CI, -0.030 to -0.003) per month. During the postintervention year, there were 52 tests (95% CI, 40-63) each month on average, a decrease of 246 (95% CI, 225-266). The number of CK tests per episode decreased by 1.01 (95% CI, 0.94-1.08) to an average of 0.20 (95% CI, 0.16-0.25) and continued to slowly decrease by 1.4% (95% CI, 0.3%-2.4%) each month. This slow decrease postintervention was not statistically different from that of the preintervention year.The changes in troponin testing were not as dramatic. The counts of tests each month remained similar, with a preintervention year average of 341 (95% CI, 306-377) and postintervention year average of 310 (95% CI, 287-332), which were not statistically different. However, there was a statistically significant decrease in the number of tests per episode. During the preintervention year, 1.38 troponin tests (95% CI, 1.31-1.45) were ordered per patient on average. This dropped by 0.17 (95% CI, 0.09-0.24) to the postintervention average of 1.21 (95% CI, 1.17-1.25) (Table 2, Figure 4).
Although there was no monthly change (0.011 [95% CI, -0.011-0.032]) in the preintervention year; in the postintervention year, it continued to slowly decrease by 0.013 (95% CI, -0.005- -0.021) monthly.ACS Prevalence
To determine whether there was an impact on ACS diagnoses, we looked at the numbers of ACS diagnoses and their prevalence among visits before and after the intervention. During the preintervention year, the average monthly number of diagnoses was 29.7 (95% CI, 26.1-33.2), and prevalence of ACS was 0.56% (95% CI, 0.48%-0.63%) of all episodes. Although the monthly rate was statistically decreasing by 0.022% (95% CI, 0.003-0.41), this has little meaning since the level of correlation (r2 = 0.2522, not displayed) was poor due to the essentially nonexistent correlation in number of visits each month (r2 = 0.0112, not displayed). During the postintervention year, the average number of diagnoses was 32.2 (95% CI, 27.9-36.6), and the prevalence of ACS was 0.62% (95% CI, 0.54-0.65). Neither of these values changed significantly between the pre- and postintervention period. All ICD-9 and ICD-10 diagnosis codes used for the analysis are available upon request from the authors.


