User login
PAs: Does Your Job Fulfill Your Expectations?
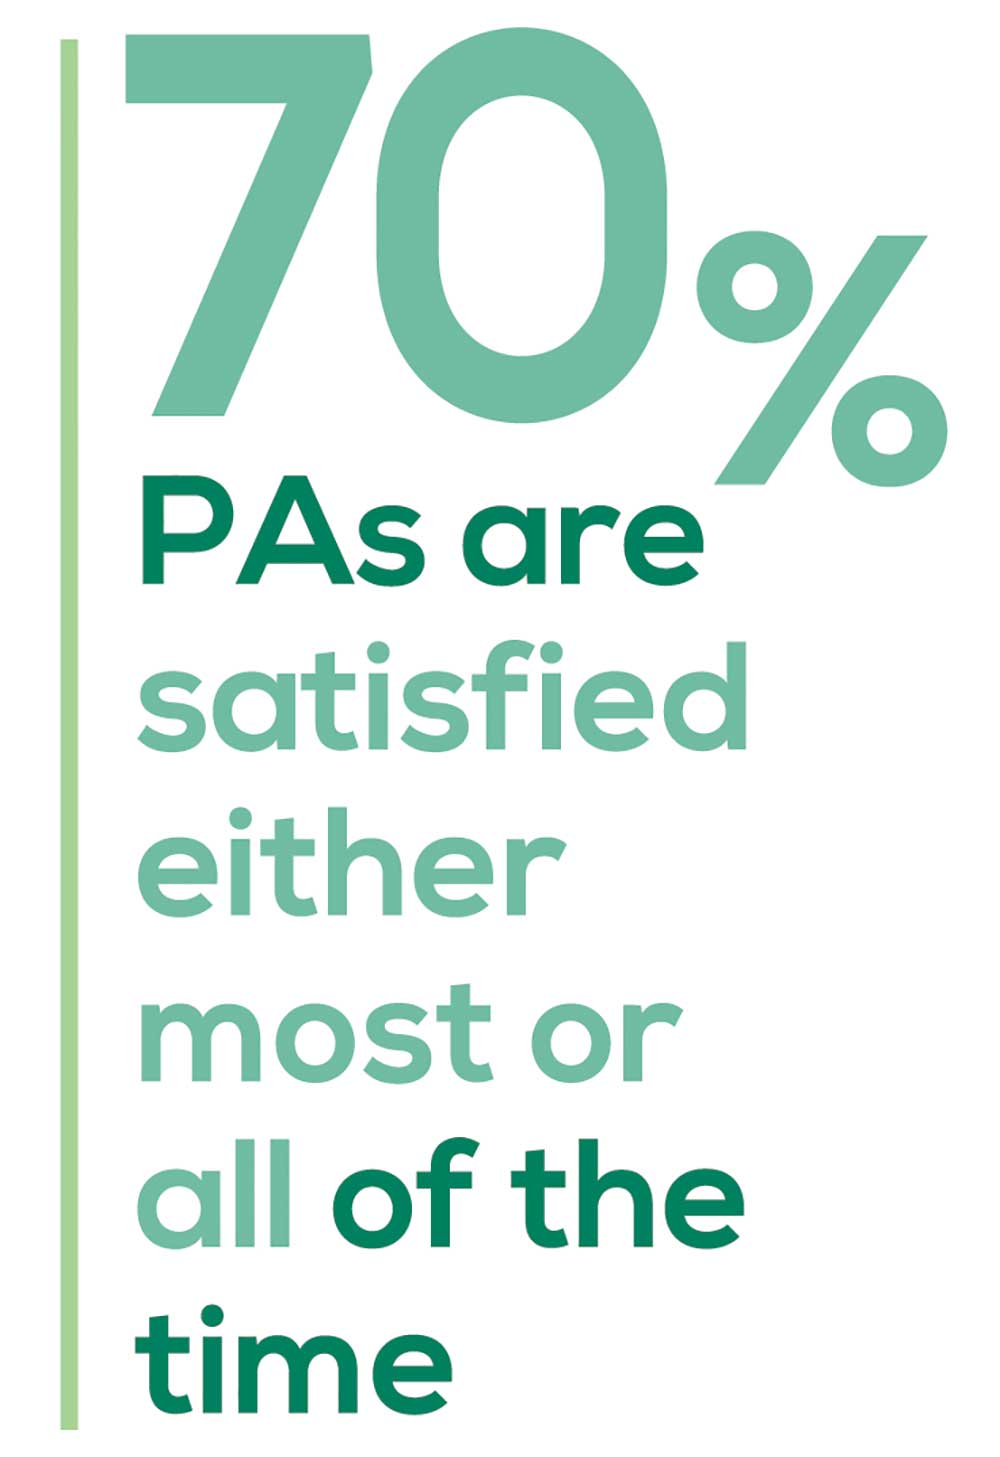
“I have the best job in the world.” This statement sums up how your colleagues feel about being a PA. Although there are certainly problems that deserve attention, the vast majority of clinicians, who are highly educated and practice in all specialties, state that they would re-enter the field if choosing again.
On the following pages, we focus on the details of the survey results, with breakouts by specialty, region, and practice setting. Be sure to check out which benefits your colleagues are getting, how much they’re being reimbursed for continuing medical education, information about salary by gender and time spent during the workweek, and much more. Participants, invited to comment, have provided several illuminating quotes, which we’ve included throughout the article, indicating what it’s like to be “in the trenches.”
WOULD YOU REPEAT THIS?
To get to the heart of the matter, we asked our survey takers “If you were to do it again, would you choose…”
- The same career
- The same educational preparation
- The same practice setting
To see what your colleagues said, go to the next page

The majority of your peers gave an enthusiastic thumbs up to PA practice as a profession choice. Knowing what you know now, 86% of you agreed that you would follow the same career path today as when you entered practice, which is up 5% from last year.
Educational preparation came in for a ringing endorsement, increasing since last year’s survey results (a 3% increase), and practice setting remained virtually the same.
Of PAs in practice between < 1 and 5 years, 94% felt their educational training was adequate; 53% felt their current responsibilities matched their expectations accurately; and 74% said their career expectations were met.
WOULD YOU TAKE A NEW JOB TODAY?
Continuing to probe about your level of satisfaction, we asked how you feel about changing your job. The answer choices were, “I would…”
- Change my job if I could get a better one (ie, better paid)
- Take any other job in which I could earn as much as I do now (ie, Yes, to leave the profession)
- Change both my job and my occupation (ie, I am burned out)
- Not make any changes (ie, No, not for any reason)
We also asked you how many times you’ve changed jobs since graduating from your PA program. The 4 answer choices ranged from “None” to “More than 3 times.” The final question asked which factors influence your decision about seeking/accepting a new position, allowing more than one choice from the list below.
- Salary/compensation
- Options for supplemental income
- Greater independence/more autonomy
- Opportunities for professional growth/development
- Formal career ladder for advancement
- Defined career path
- Recognition and appreciation
- Schedule flexibility
- Geographic location
- Access to and subsidy for more educational opportunities
- Employer reimbursement of school loans
- Specific state scope of practice and licensure law
- Work-life balance, including addressing burnout
- Working conditions
- Avoid toxic coworkers
- Top-of-the-line tools
- Telecommuting
- Cost of living
- Opportunity for outdoor activities/lifestyle
To see what your colleagues said, go to the next page
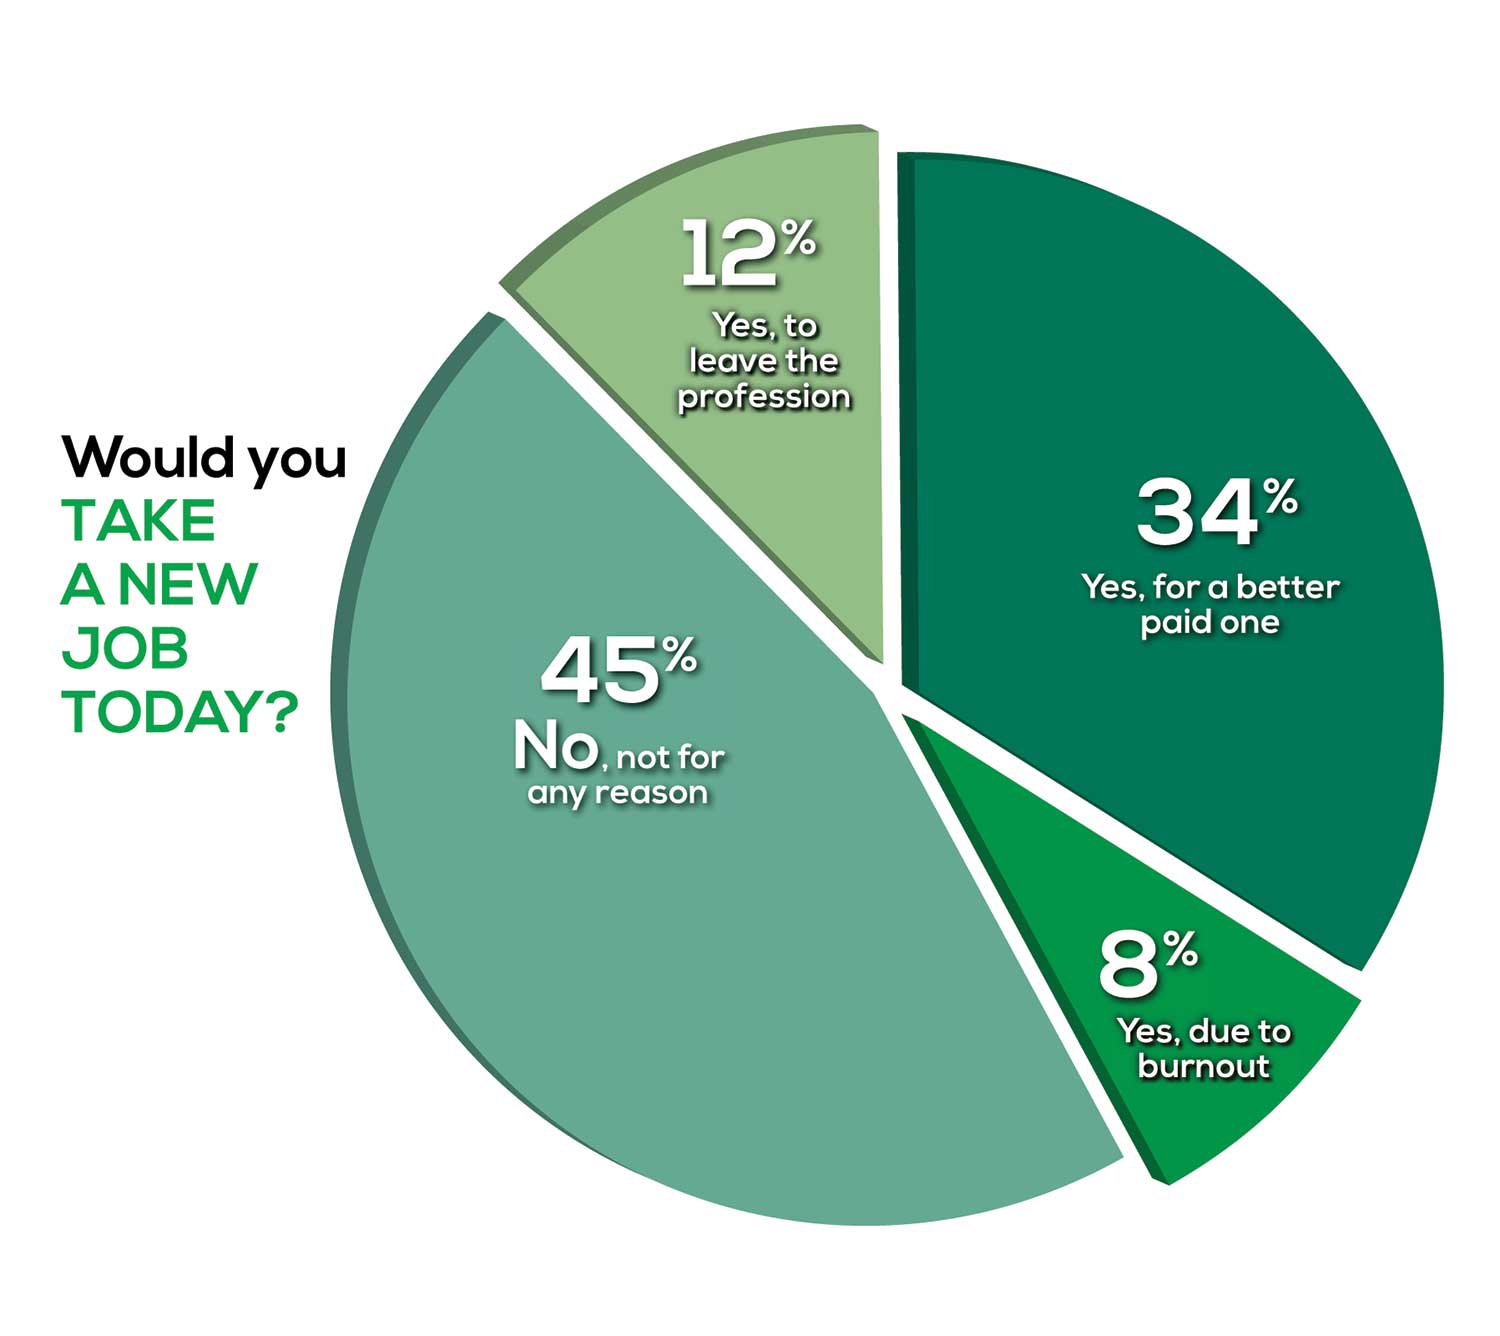
Compared to last year, PAs are 4% more likely to stay with their current job, stating that they would not make any changes, with 4% less likely to leave even if a higher salary were on offer. This is supported by the responses that indicate a fewer number of PAs (27%) have changed jobs at the highest rate (> 3 times) compared to 31% last year.
Although 19% of PAs have never changed jobs, 33% have changed 2 or 3 times, and 27% have changed more 3 times (down 4% from last year). However, more PAs report feeling burned out (up 2% from last year) and wish to leave for another profession (up 6% from last year) compared to last year.
Respondents indicated that the following 4 factors would strongly influence their decision to seek or accept a new position:
- Salary/compensation: 84%
- Work-life balance: 72%
- Schedule flexibility: 68%
- Working conditions: 64%
WHAT MAKES YOU MOST SATISFIED WITH YOUR WORK?
As you are aware, level of satisfaction depends on each of the following, which we asked respondents to rank from 1 to 5.
- Relationships with your colleagues (health care providers and clerical/administrative personnel)
- Quality and duration of patient relationships
- Respect received from patients, their families, and your community
- Ability to make a difference and provide significant help to patients, their families, and your community
To see what your colleagues said, go to the next page

Echoing the survey results—which ranked “Making a difference and providing significant help” as the topmost source of job satisfaction—one of your colleagues commented that, “Ability to offer meaningful support to client needs” affected their satisfaction. On the other hand, though, one clinician wrote, “I am starting to decrease my time in urgent care because I’m seeing more often that administration thinks we are selling a good, not a service—and because of lack of respect by patients as well.”
Compared to last year, the changes in response are
3% decrease: Making a difference and providing significant help
No change: Respect received from patients and their families
6% increase: Relationships with your colleagues
2% increase: Quality and duration of patient relationships
MOST SATISFIED BY SPECIALTY
Knowing that certain specialties offer more advantages than others, we presented a list of 19 medical specialties, asking which is your primary one. We also asked how often you typically feel satisfied with your job, with these answer choices.
- Never
- Occasionally
- About half the time
- Most of the time
- Always
To see what your colleagues said, go to the next page
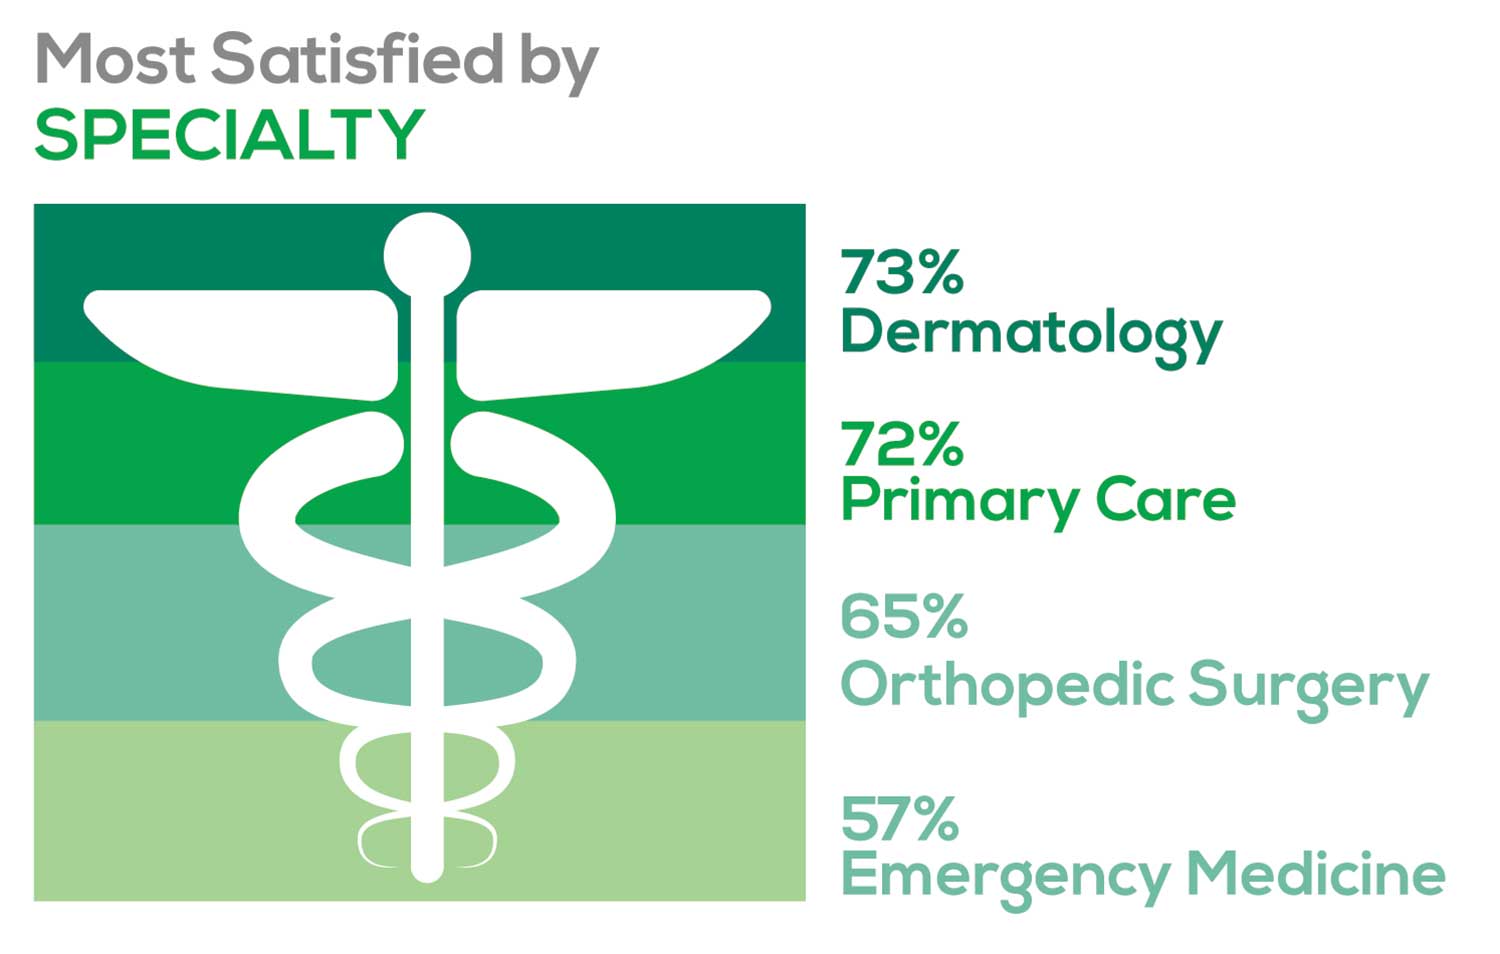
- Dermatology: 73%, a 9% decrease over last year
- Primary Care: 72%, virtually unchanged from last year
- Orthopedic Surgery: 65%, a new entry this year
- Emergency Medicine: 57%, an 8% decrease over last year
As one clinician commented, being “First assistant in surgery” makes a difference in their job satisfaction.
MOST SATISFIED BY PRACTICE SETTING
Working conditions and coworker collegiality are integral to job satisfaction. To learn more about these factors, we asked you to identify the practice settings where you work.
- Academic setting (faculty); school/college health services
- Hospital: inpatient care; outpatient setting or community clinic
- Locum
- Physician practice: solo; single-specialty; multi-specialty
- Public health/occupational health setting; military/government
- Retail/convenient care; urgent care clinic
- Skilled nursing/long-term care facility
We also asked how often you typically feel satisfied with your job, with 5 answer choices ranging from “Never” to “Always.”
To see what your colleagues said, go to the next page
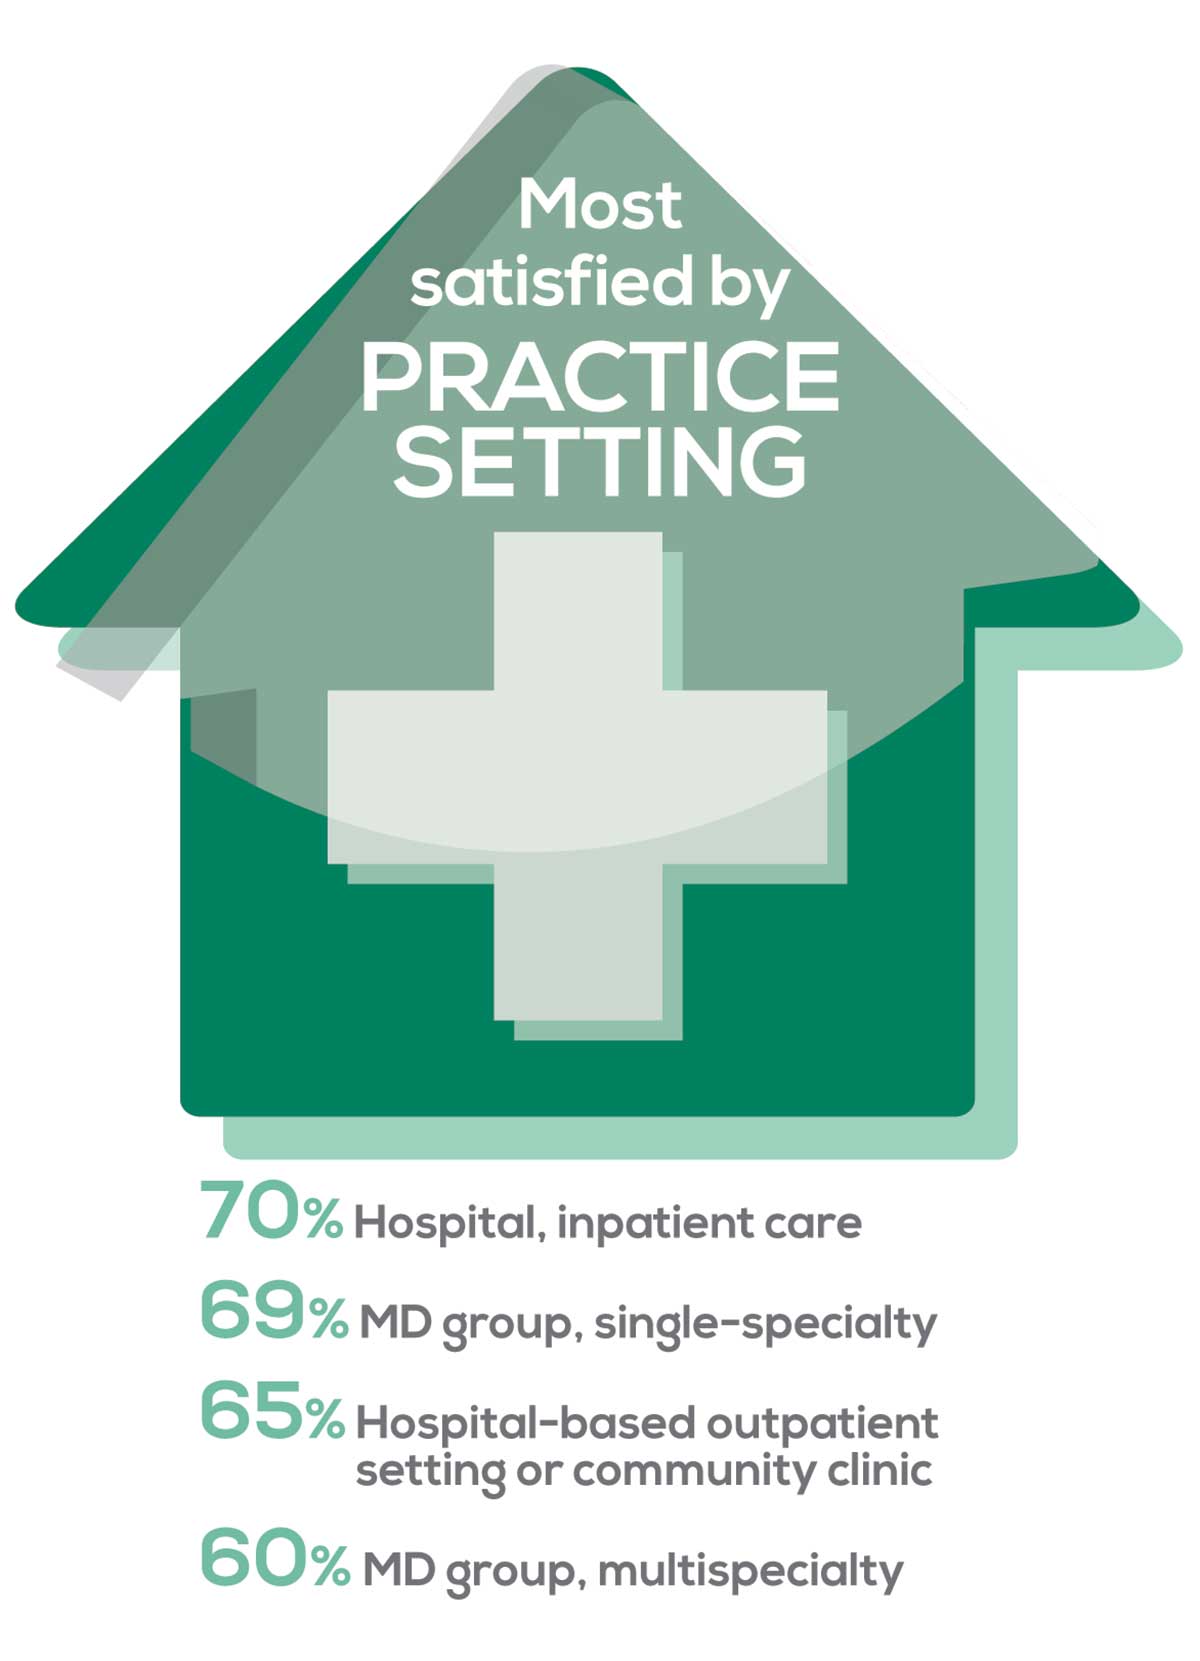
95% of PA respondents work as an employee; of these, 41% work in hospitals, and 31% work in physician offices.1 Therefore, it is gratifying to see that hospital settings and physician groups are satisfying places to work. In addition, this data has not changed significantly since last year.
- US Department of Health and Human Services, Health Resources and Services Administration, The U.S. Health Workforce Chartbook. Rockville, Maryland: U.S. Department of Health and Human Services, 2018.
BENEFITS
As you are aware, having access to the right benefits can go a long way to increasing job satisfaction. In addition to salary as a choice, we listed 30 benefits choices—insurance coverage, additional compensation opportunities, reimbursements, and other—asking which are offered by your employer (access) and which, in lieu of a modest increase in salary, are most important regardless of access. Your responses allowed us to identify the top 7 among your peers.
To see what your colleagues said, go to the next page
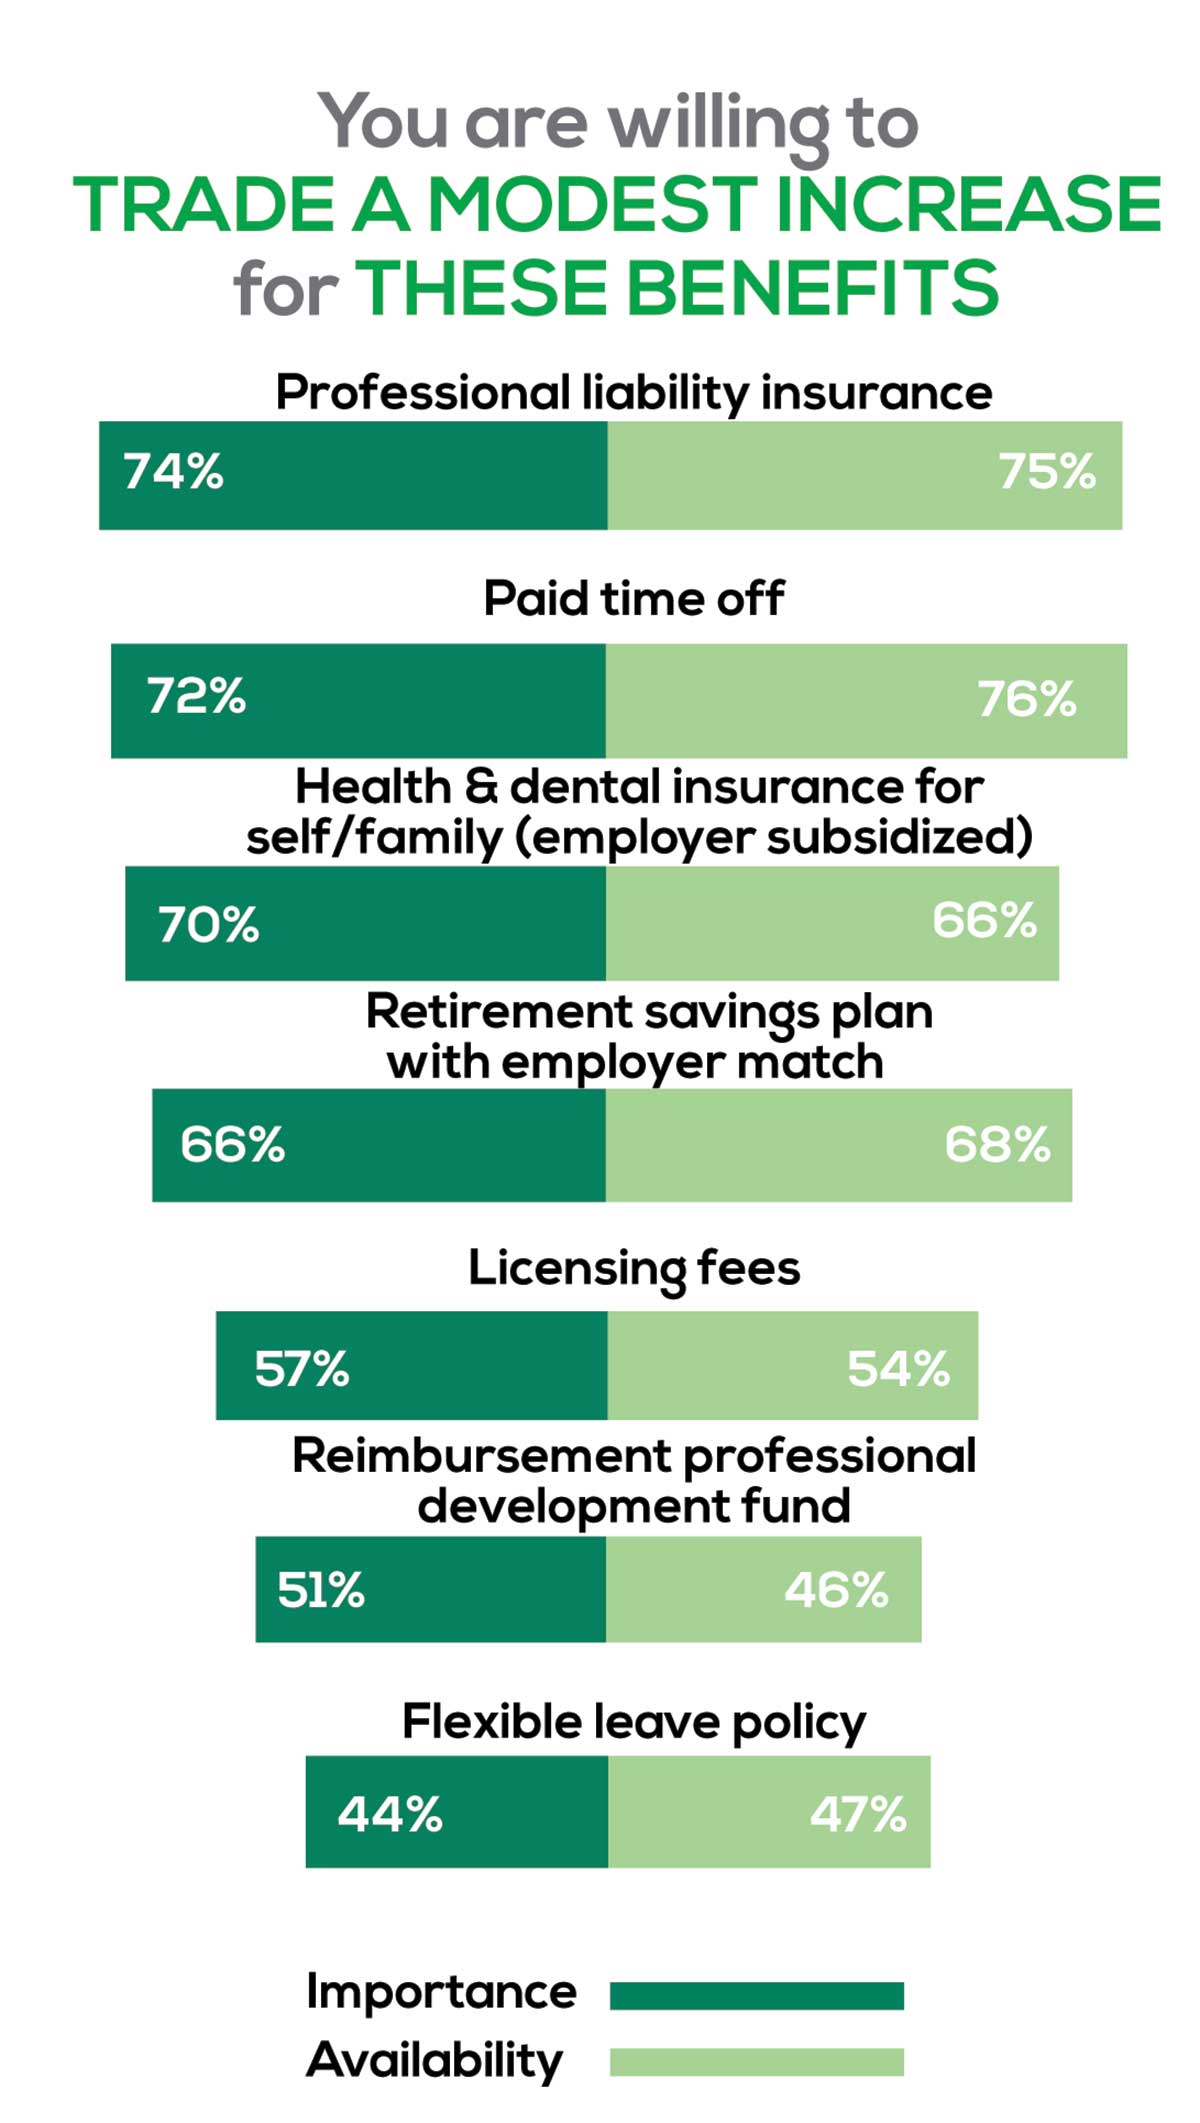
You are willing to trade a modest increase in salary for the following important benefits whether you are a new job seeker or an experienced practitioner.
- Compensation: Paid time off, retirement saving plan with employer match
- Insurance coverage: Professional liability insurance, health & dental insurance for self/family (employer subsidized)
- Reimbursements: Licensing fees, professional development fund
- Other: Flexible leave policy
MOST SATISFIED BY REGION
Location, location, location. Where you work depends in part on where your family is; in part on what jobs are available; what affects your commute, taxes and take home pay; and hence your satisfaction. So, we asked where you work—West, Midwest, Northeast, or South—and paired the data with responses to the question about how often you typically feel satisfied with your job, with 5 answer choices ranging from “Never” to “Always.”
To see what your colleagues said, go to the next page
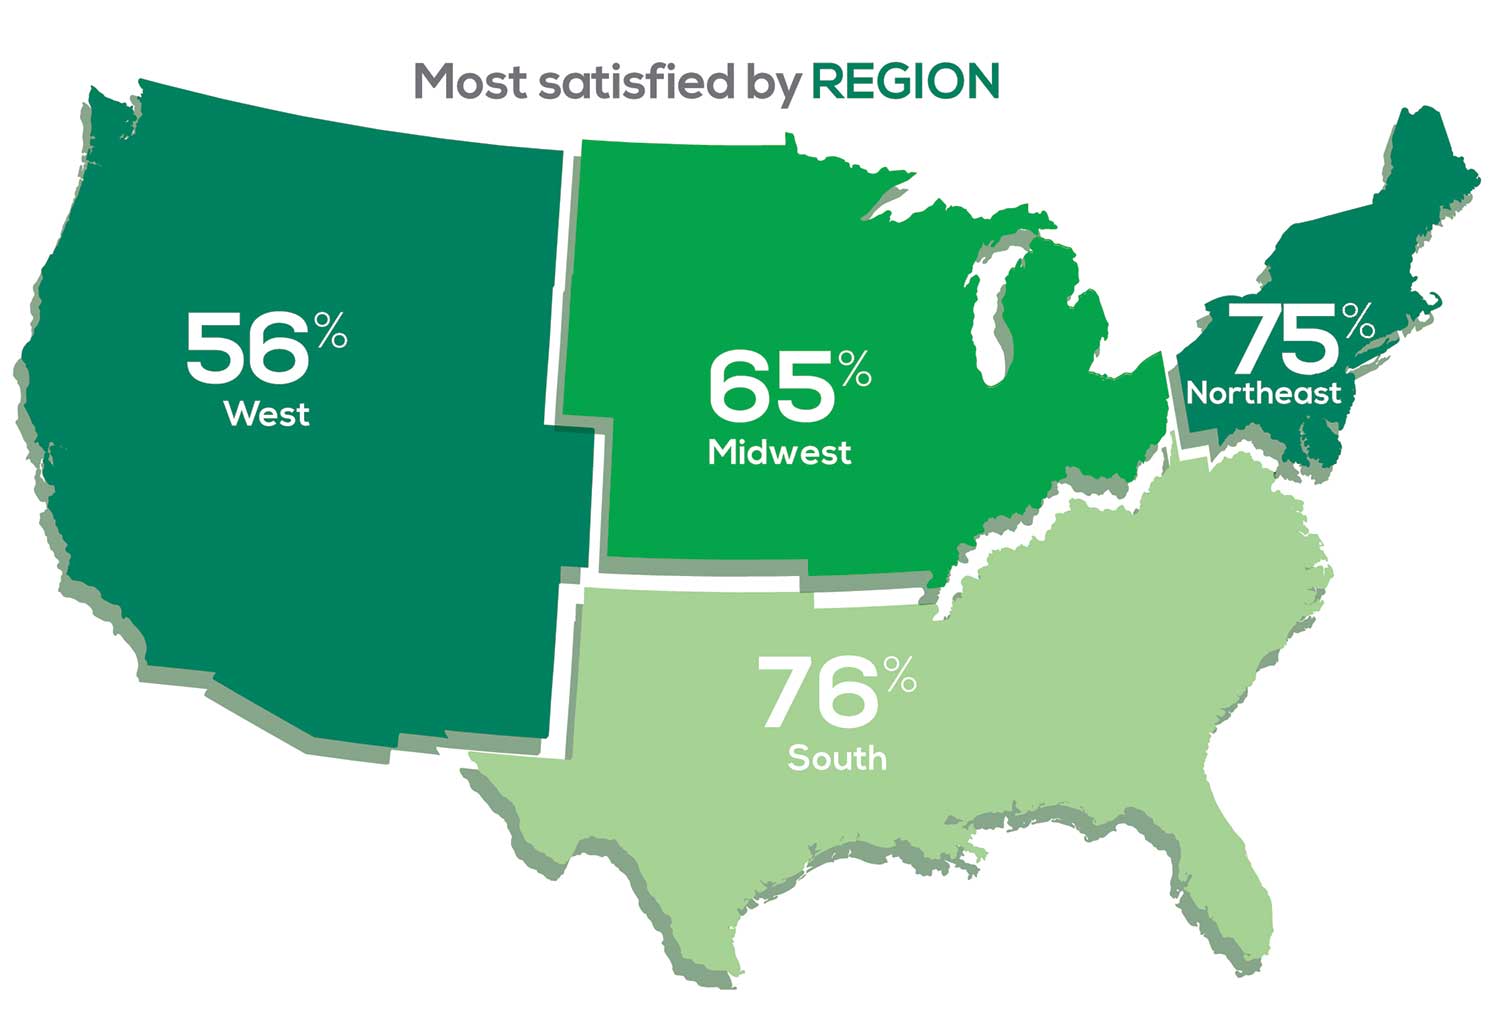
Geographic location is among the factors that influence the decision about seeking or accepting a new job for 53% of PA respondents. Compared to last year, satisfaction levels by region were
- 7% higher than last year in the Northeast
- 5% higher than last year in the South
- 12% lower than last year in the Midwest
- 17% lower than last year in the West
with 27% of PAs practicing in the Northeast; 32% in the South; 21% in the Midwest, and 19% in the West. 76% of PAs working in the South are “most of the time/always” satisfied with their job.
When base salaries are adjusted for cost of living, the top 10 ranked states are, from first to 10th, Oklahoma, Arkansas, Ohio, Texas, Michigan, Indiana, Iowa, New Mexico, Mississippi, and South Dakota.1
- American Academy of PAs. 2019 AAPA Salary Report. Alexandria, VA; 2019.
SALARY
Because you indicated that salary is second in importance only to professional liability insurance coverage as part of a desirable compensation package, we asked you to tell us what your salary bracket is. The amounts ranged from < $50,000 to > $175,000 per year (in $25,000 increments). Combining the responses to this question with those asking about gender and specialty, we are able to tie these factors together for you.
To see what your colleagues said, go to the next page
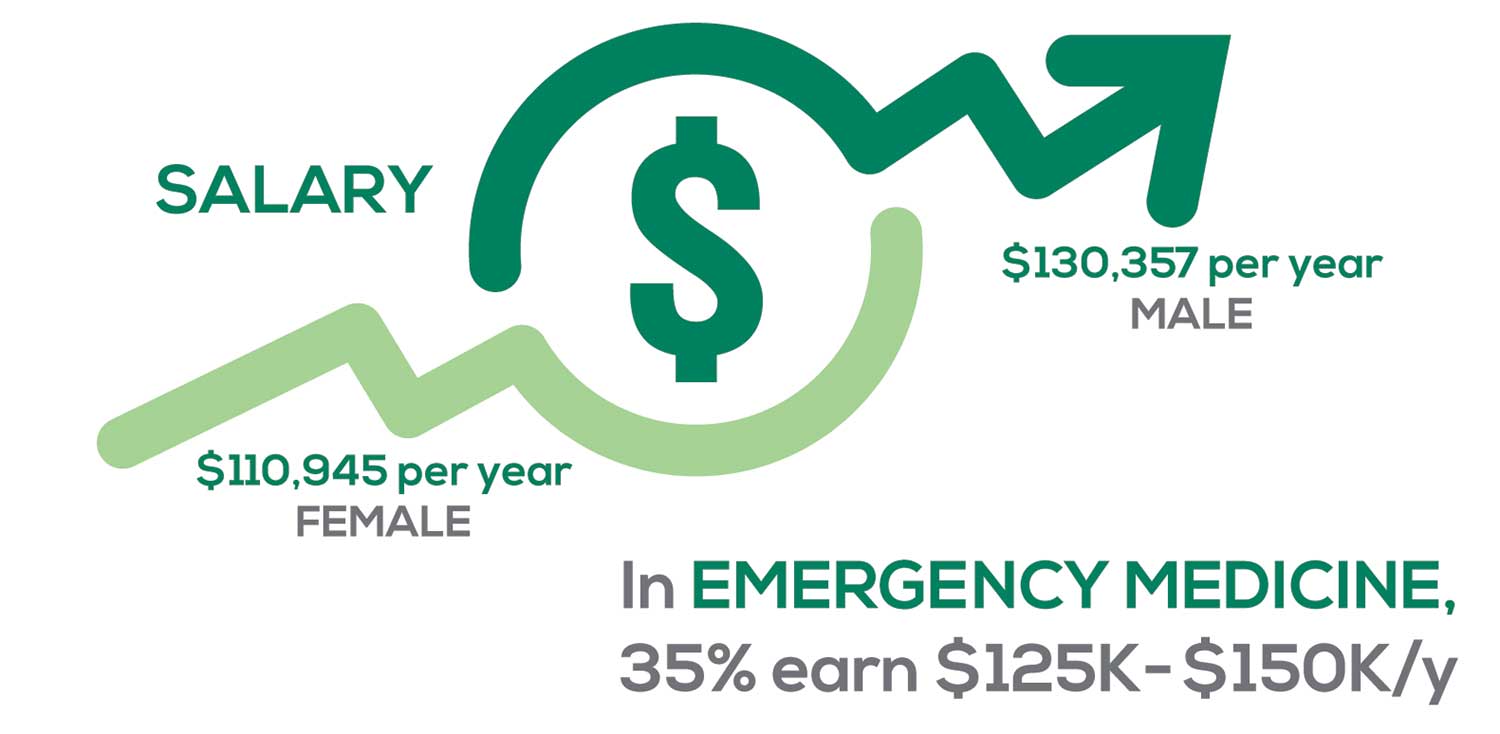
Approximately 5% of PAs earn $50K to $75K per year; 36%, earn $100K to $125K per year; and 5% earn > $175K per year. Similar to responses of previous years, women earn less than men in the PA profession.
PAs practicing in Emergency Medicine (EM) are the most highly compensated, with their median compensation being almost $117K.1 In fact, among those in EM, we found that 35% earn between $125K and $150K per year, up from 27% from last year. Clinicians working in the emergency room encounter more stressors (a clinician noted “Abuse of the emergency room by patients with ridiculous complaints” as a source of dissatisfaction) than those encountered in other specialties, which may be related to the higher compensation.
Although most PAs feel they are adequately compensated, we found that of those who practice in Family Medicine, 19% earn less than $75K per year, up from 6% from last year.
- American Academy of PAs. 2019 AAPA Salary Report. Alexandria, VA; 2019.
WORKWEEK
Job satisfaction, and its opposite, burnout are related to your workload (ie, what you do and how much autonomy you have in deciding how to proceed). To help us evaluate these factors, we asked your colleagues to indicate how many hours per week are typically spent in direct (examine/diagnose/treat) and indirect patient care (perform and interpret labs, x-rays, refill prescriptions, etc.), administrative duties, meetings, and teaching.
We were also interested in whether you assess, treat, and manage decisions
- Independently/by yourself
- In direct contact (in person or by phone) with a collaborating physician
- In consultation with a specialist when providing patient care.
Multiple answer choices were permitted.
To see what your colleagues said, go to the next page
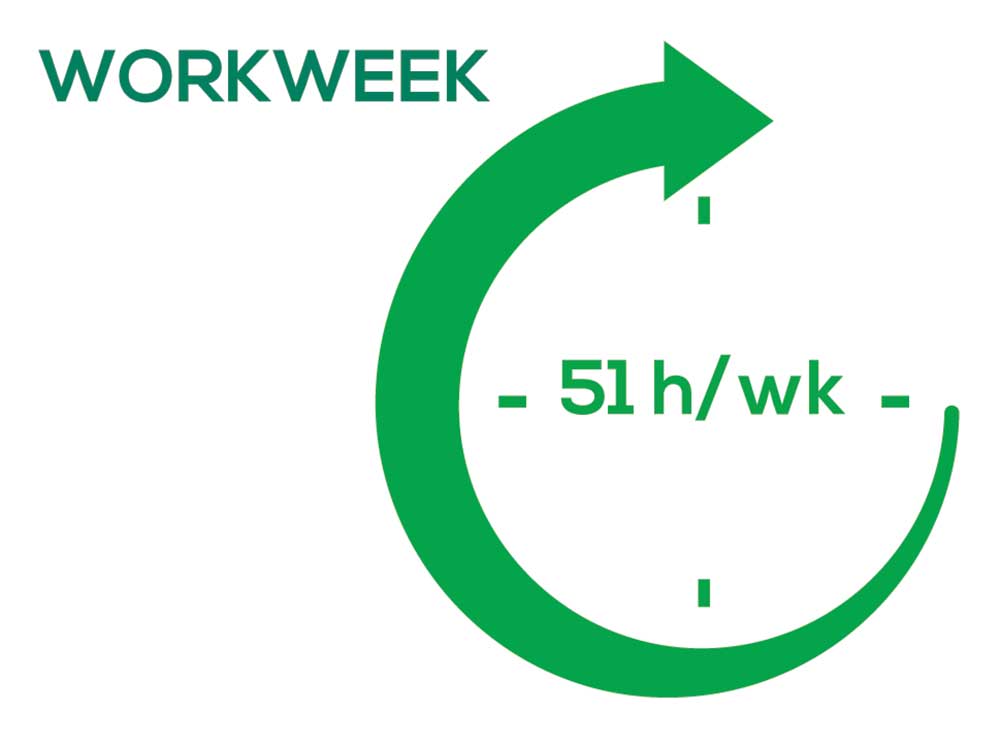
As you can imagine, workload is a very hot topic. In response to, “What else affects your job satisfaction?” the greatest number of comments related to electronic charting and data collection. These activities are felt to demand so much time and effort that it takes away from patient care. The survey responses support this: Compared to last year, although the number of hours worked is the same this year, PAs now spend 1 hour less per week on patient care (direct and indirect) and 1 hour more on other duties (administrative and teaching). As one clinician put it, “…availability of medical assistant/administrative support is huge” in alleviating the sense of being overworked or overextended.
Aside from work hours, clinicians told us they seek positions that allow them “input on all issues related to practice” and flexibility on “what/who I am allowed to treat.” According to the survey, when providing patient care,
- 84% of PAs assess, treat, and manage decisions independently
- 37% collaborate with a physician
- 19% consult with a specialist
supporting the fact that 58% of PAs are satisfied most of the time; 12% are always satisfied.
A side note: Of the 50% of PAs who responded that they are involved in teaching students (78% of whom are PAs), they spend approximately 4 hours a week,
- Either as a clinical preceptor (35%)
- In the classroom (5%)
- Or both (10%).
CME REIMBURSEMENT
As we know, PAs earn continuing medical education (CME) credits in order to maintain certification. Therefore, we asked you to indicate how much financial reimbursement you receive annually for CME; answer choices range from $0 to > $2,000 per year (in $500 increments). We also queried you about how much time you are allotted annually for CME; choices were from “None” to “More than 5 weeks.”
To see what your colleagues said, go to the next page
Many of your colleagues responded to the question “What else affects your job satisfaction?” with “Support for continuing learning” and “Educational opportunities.” This is reflected by 51% of survey respondents who stated that “Reimbursement for professional development” was an important benefit (see “Top 7 Benefits” above).
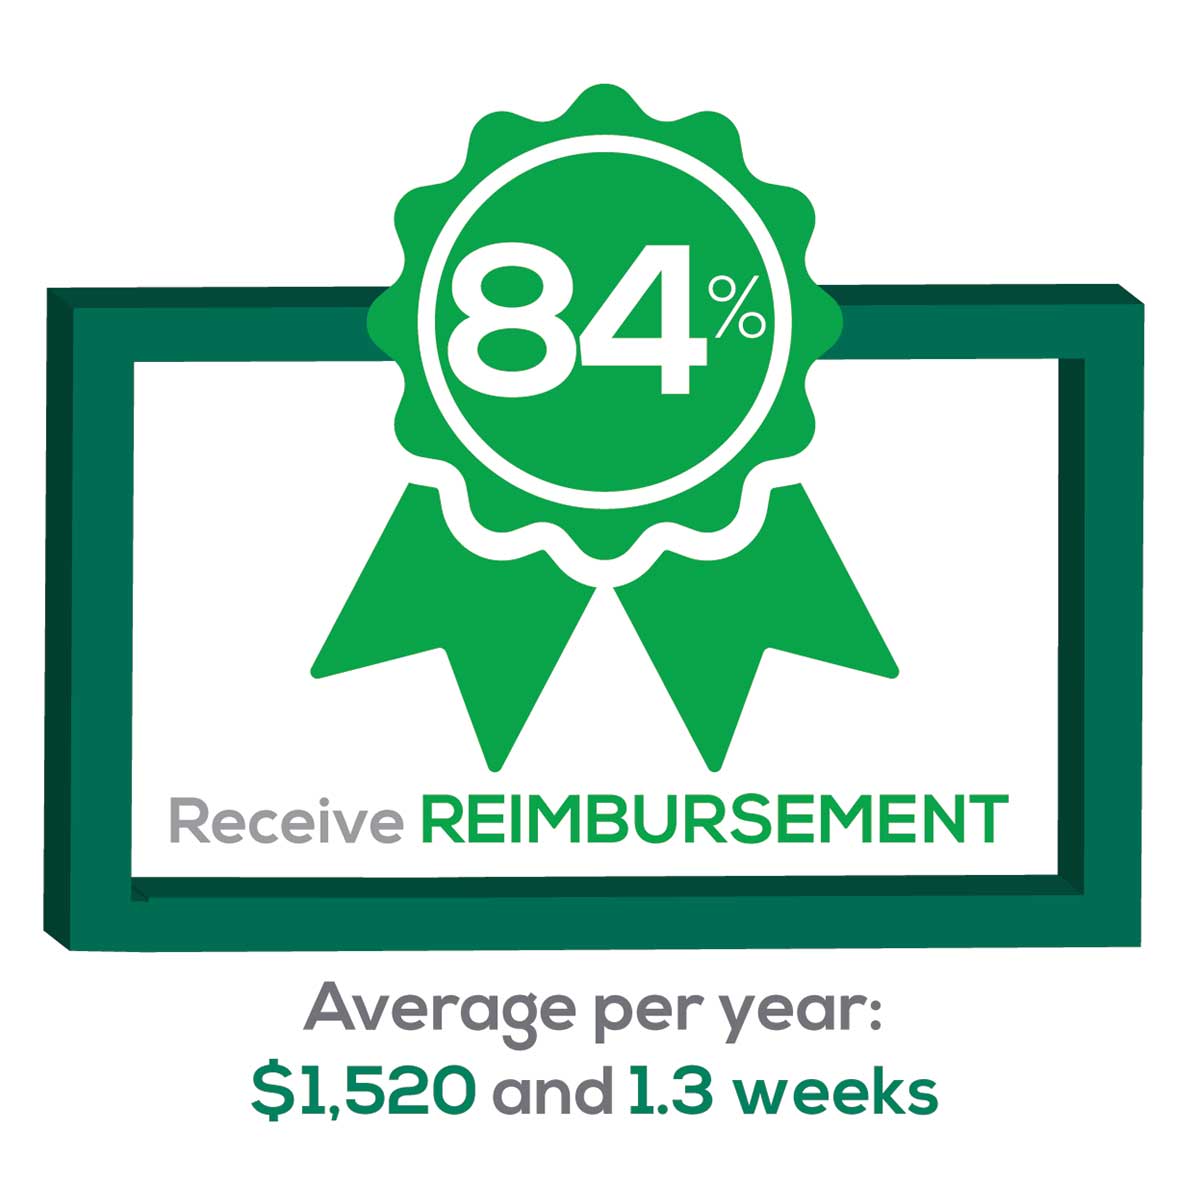
This year, 84% of respondents reported receiving remuneration—either money or time allowed or both—for CME, down 3% from last year. Specifically,
- 16% received $0
- 6%, less than $500
- 10%, between $500 - $1,000
- 25%, between $1,001 - $1,500
- 19%, between $1,501 - $2,000
- 24%, more than $2,000
with average monetary compensation per year up approximately $200 over last year.
Responses to the amount of time you are allotted annually for CME ranged from “None” to “more than 5 weeks.”
- 25%, no time
- 31%, less than 1 week
- 38%, 1-2 weeks
- 3%, 3 weeks
- 1%, 4 weeks
- 0.25%, 5 weeks
- 1%, more than 5 weeks.
In closing, we offer thanks to all the survey participants whose answers helped us understand your current state of job satisfaction and most especially for your frank and enlightening responses to the open-ended questions.
METHODOLOGY
Fielded electronically under the Clinician Reviews logo, an introductory email letter signed by the Editors-in-Chief invited participation in the online 4th annual NP/PA Job Satisfaction Survey of 35 questions.
The survey was fielded August 23, 2019 to a random representative sample of NPs and PAs within the United States, excluding students. The first 150 respondents to complete the survey received a $25 Amazon.com gift certificate.
A total of 1,323 usable responses—a projectable sample size—were received by October 3, 2019, the final cut-off date.
Of the total respondents, 70% are NPs (931) and 30% are PAs (396), which is proportional to the universe of NPs and PAs.1,2 This summary of results is based on only those respondents who designated their profession as NP or PA.
- American Association of Nurse Practitioners. NP Fact Sheet. www.aanp.org/all-about-nps/np-fact-sheet. Accessed November 22, 2019.
- NCCPA. 2018 Statistical Profile of Certified Physician Assistants: an Annual Report of the National Commission on Certification of Physician Assistants. https://prodcmsstoragesa.blob.core.windows.net/uploads/files/2018StatisticalProfileofCertifiedPhysicianAssistants.pdf. Accessed November 22, 2019.
1. American Association of Nurse Practitioners. NP Fact Sheet. www.aanp.org/all-about-nps/np-fact-sheet. Accessed November 22, 2019.
2. NCCPA. 2018 Statistical Profile of Certified Physician Assistants: an Annual Report of the National Commission on Certification of Physician Assistants. https://prodcmsstoragesa.blob.core.windows.net/uploads/files/2018StatisticalProfileofCertifiedPhysicianAssistants.pdf. Accessed November 22, 2019.
“I have the best job in the world.” This statement sums up how your colleagues feel about being a PA. Although there are certainly problems that deserve attention, the vast majority of clinicians, who are highly educated and practice in all specialties, state that they would re-enter the field if choosing again.
On the following pages, we focus on the details of the survey results, with breakouts by specialty, region, and practice setting. Be sure to check out which benefits your colleagues are getting, how much they’re being reimbursed for continuing medical education, information about salary by gender and time spent during the workweek, and much more. Participants, invited to comment, have provided several illuminating quotes, which we’ve included throughout the article, indicating what it’s like to be “in the trenches.”
WOULD YOU REPEAT THIS?
To get to the heart of the matter, we asked our survey takers “If you were to do it again, would you choose…”
- The same career
- The same educational preparation
- The same practice setting
To see what your colleagues said, go to the next page
The majority of your peers gave an enthusiastic thumbs up to PA practice as a profession choice. Knowing what you know now, 86% of you agreed that you would follow the same career path today as when you entered practice, which is up 5% from last year.
Educational preparation came in for a ringing endorsement, increasing since last year’s survey results (a 3% increase), and practice setting remained virtually the same.
Of PAs in practice between < 1 and 5 years, 94% felt their educational training was adequate; 53% felt their current responsibilities matched their expectations accurately; and 74% said their career expectations were met.
WOULD YOU TAKE A NEW JOB TODAY?
Continuing to probe about your level of satisfaction, we asked how you feel about changing your job. The answer choices were, “I would…”
- Change my job if I could get a better one (ie, better paid)
- Take any other job in which I could earn as much as I do now (ie, Yes, to leave the profession)
- Change both my job and my occupation (ie, I am burned out)
- Not make any changes (ie, No, not for any reason)
We also asked you how many times you’ve changed jobs since graduating from your PA program. The 4 answer choices ranged from “None” to “More than 3 times.” The final question asked which factors influence your decision about seeking/accepting a new position, allowing more than one choice from the list below.
- Salary/compensation
- Options for supplemental income
- Greater independence/more autonomy
- Opportunities for professional growth/development
- Formal career ladder for advancement
- Defined career path
- Recognition and appreciation
- Schedule flexibility
- Geographic location
- Access to and subsidy for more educational opportunities
- Employer reimbursement of school loans
- Specific state scope of practice and licensure law
- Work-life balance, including addressing burnout
- Working conditions
- Avoid toxic coworkers
- Top-of-the-line tools
- Telecommuting
- Cost of living
- Opportunity for outdoor activities/lifestyle
To see what your colleagues said, go to the next page
Compared to last year, PAs are 4% more likely to stay with their current job, stating that they would not make any changes, with 4% less likely to leave even if a higher salary were on offer. This is supported by the responses that indicate a fewer number of PAs (27%) have changed jobs at the highest rate (> 3 times) compared to 31% last year.
Although 19% of PAs have never changed jobs, 33% have changed 2 or 3 times, and 27% have changed more 3 times (down 4% from last year). However, more PAs report feeling burned out (up 2% from last year) and wish to leave for another profession (up 6% from last year) compared to last year.
Respondents indicated that the following 4 factors would strongly influence their decision to seek or accept a new position:
- Salary/compensation: 84%
- Work-life balance: 72%
- Schedule flexibility: 68%
- Working conditions: 64%
WHAT MAKES YOU MOST SATISFIED WITH YOUR WORK?
As you are aware, level of satisfaction depends on each of the following, which we asked respondents to rank from 1 to 5.
- Relationships with your colleagues (health care providers and clerical/administrative personnel)
- Quality and duration of patient relationships
- Respect received from patients, their families, and your community
- Ability to make a difference and provide significant help to patients, their families, and your community
To see what your colleagues said, go to the next page
Echoing the survey results—which ranked “Making a difference and providing significant help” as the topmost source of job satisfaction—one of your colleagues commented that, “Ability to offer meaningful support to client needs” affected their satisfaction. On the other hand, though, one clinician wrote, “I am starting to decrease my time in urgent care because I’m seeing more often that administration thinks we are selling a good, not a service—and because of lack of respect by patients as well.”
Compared to last year, the changes in response are
3% decrease: Making a difference and providing significant help
No change: Respect received from patients and their families
6% increase: Relationships with your colleagues
2% increase: Quality and duration of patient relationships
MOST SATISFIED BY SPECIALTY
Knowing that certain specialties offer more advantages than others, we presented a list of 19 medical specialties, asking which is your primary one. We also asked how often you typically feel satisfied with your job, with these answer choices.
- Never
- Occasionally
- About half the time
- Most of the time
- Always
To see what your colleagues said, go to the next page
- Dermatology: 73%, a 9% decrease over last year
- Primary Care: 72%, virtually unchanged from last year
- Orthopedic Surgery: 65%, a new entry this year
- Emergency Medicine: 57%, an 8% decrease over last year
As one clinician commented, being “First assistant in surgery” makes a difference in their job satisfaction.
MOST SATISFIED BY PRACTICE SETTING
Working conditions and coworker collegiality are integral to job satisfaction. To learn more about these factors, we asked you to identify the practice settings where you work.
- Academic setting (faculty); school/college health services
- Hospital: inpatient care; outpatient setting or community clinic
- Locum
- Physician practice: solo; single-specialty; multi-specialty
- Public health/occupational health setting; military/government
- Retail/convenient care; urgent care clinic
- Skilled nursing/long-term care facility
We also asked how often you typically feel satisfied with your job, with 5 answer choices ranging from “Never” to “Always.”
To see what your colleagues said, go to the next page
95% of PA respondents work as an employee; of these, 41% work in hospitals, and 31% work in physician offices.1 Therefore, it is gratifying to see that hospital settings and physician groups are satisfying places to work. In addition, this data has not changed significantly since last year.
- US Department of Health and Human Services, Health Resources and Services Administration, The U.S. Health Workforce Chartbook. Rockville, Maryland: U.S. Department of Health and Human Services, 2018.
BENEFITS
As you are aware, having access to the right benefits can go a long way to increasing job satisfaction. In addition to salary as a choice, we listed 30 benefits choices—insurance coverage, additional compensation opportunities, reimbursements, and other—asking which are offered by your employer (access) and which, in lieu of a modest increase in salary, are most important regardless of access. Your responses allowed us to identify the top 7 among your peers.
To see what your colleagues said, go to the next page
You are willing to trade a modest increase in salary for the following important benefits whether you are a new job seeker or an experienced practitioner.
- Compensation: Paid time off, retirement saving plan with employer match
- Insurance coverage: Professional liability insurance, health & dental insurance for self/family (employer subsidized)
- Reimbursements: Licensing fees, professional development fund
- Other: Flexible leave policy
MOST SATISFIED BY REGION
Location, location, location. Where you work depends in part on where your family is; in part on what jobs are available; what affects your commute, taxes and take home pay; and hence your satisfaction. So, we asked where you work—West, Midwest, Northeast, or South—and paired the data with responses to the question about how often you typically feel satisfied with your job, with 5 answer choices ranging from “Never” to “Always.”
To see what your colleagues said, go to the next page
Geographic location is among the factors that influence the decision about seeking or accepting a new job for 53% of PA respondents. Compared to last year, satisfaction levels by region were
- 7% higher than last year in the Northeast
- 5% higher than last year in the South
- 12% lower than last year in the Midwest
- 17% lower than last year in the West
with 27% of PAs practicing in the Northeast; 32% in the South; 21% in the Midwest, and 19% in the West. 76% of PAs working in the South are “most of the time/always” satisfied with their job.
When base salaries are adjusted for cost of living, the top 10 ranked states are, from first to 10th, Oklahoma, Arkansas, Ohio, Texas, Michigan, Indiana, Iowa, New Mexico, Mississippi, and South Dakota.1
- American Academy of PAs. 2019 AAPA Salary Report. Alexandria, VA; 2019.
SALARY
Because you indicated that salary is second in importance only to professional liability insurance coverage as part of a desirable compensation package, we asked you to tell us what your salary bracket is. The amounts ranged from < $50,000 to > $175,000 per year (in $25,000 increments). Combining the responses to this question with those asking about gender and specialty, we are able to tie these factors together for you.
To see what your colleagues said, go to the next page
Approximately 5% of PAs earn $50K to $75K per year; 36%, earn $100K to $125K per year; and 5% earn > $175K per year. Similar to responses of previous years, women earn less than men in the PA profession.
PAs practicing in Emergency Medicine (EM) are the most highly compensated, with their median compensation being almost $117K.1 In fact, among those in EM, we found that 35% earn between $125K and $150K per year, up from 27% from last year. Clinicians working in the emergency room encounter more stressors (a clinician noted “Abuse of the emergency room by patients with ridiculous complaints” as a source of dissatisfaction) than those encountered in other specialties, which may be related to the higher compensation.
Although most PAs feel they are adequately compensated, we found that of those who practice in Family Medicine, 19% earn less than $75K per year, up from 6% from last year.
- American Academy of PAs. 2019 AAPA Salary Report. Alexandria, VA; 2019.
WORKWEEK
Job satisfaction, and its opposite, burnout are related to your workload (ie, what you do and how much autonomy you have in deciding how to proceed). To help us evaluate these factors, we asked your colleagues to indicate how many hours per week are typically spent in direct (examine/diagnose/treat) and indirect patient care (perform and interpret labs, x-rays, refill prescriptions, etc.), administrative duties, meetings, and teaching.
We were also interested in whether you assess, treat, and manage decisions
- Independently/by yourself
- In direct contact (in person or by phone) with a collaborating physician
- In consultation with a specialist when providing patient care.
Multiple answer choices were permitted.
To see what your colleagues said, go to the next page
As you can imagine, workload is a very hot topic. In response to, “What else affects your job satisfaction?” the greatest number of comments related to electronic charting and data collection. These activities are felt to demand so much time and effort that it takes away from patient care. The survey responses support this: Compared to last year, although the number of hours worked is the same this year, PAs now spend 1 hour less per week on patient care (direct and indirect) and 1 hour more on other duties (administrative and teaching). As one clinician put it, “…availability of medical assistant/administrative support is huge” in alleviating the sense of being overworked or overextended.
Aside from work hours, clinicians told us they seek positions that allow them “input on all issues related to practice” and flexibility on “what/who I am allowed to treat.” According to the survey, when providing patient care,
- 84% of PAs assess, treat, and manage decisions independently
- 37% collaborate with a physician
- 19% consult with a specialist
supporting the fact that 58% of PAs are satisfied most of the time; 12% are always satisfied.
A side note: Of the 50% of PAs who responded that they are involved in teaching students (78% of whom are PAs), they spend approximately 4 hours a week,
- Either as a clinical preceptor (35%)
- In the classroom (5%)
- Or both (10%).
CME REIMBURSEMENT
As we know, PAs earn continuing medical education (CME) credits in order to maintain certification. Therefore, we asked you to indicate how much financial reimbursement you receive annually for CME; answer choices range from $0 to > $2,000 per year (in $500 increments). We also queried you about how much time you are allotted annually for CME; choices were from “None” to “More than 5 weeks.”
To see what your colleagues said, go to the next page
Many of your colleagues responded to the question “What else affects your job satisfaction?” with “Support for continuing learning” and “Educational opportunities.” This is reflected by 51% of survey respondents who stated that “Reimbursement for professional development” was an important benefit (see “Top 7 Benefits” above).
This year, 84% of respondents reported receiving remuneration—either money or time allowed or both—for CME, down 3% from last year. Specifically,
- 16% received $0
- 6%, less than $500
- 10%, between $500 - $1,000
- 25%, between $1,001 - $1,500
- 19%, between $1,501 - $2,000
- 24%, more than $2,000
with average monetary compensation per year up approximately $200 over last year.
Responses to the amount of time you are allotted annually for CME ranged from “None” to “more than 5 weeks.”
- 25%, no time
- 31%, less than 1 week
- 38%, 1-2 weeks
- 3%, 3 weeks
- 1%, 4 weeks
- 0.25%, 5 weeks
- 1%, more than 5 weeks.
In closing, we offer thanks to all the survey participants whose answers helped us understand your current state of job satisfaction and most especially for your frank and enlightening responses to the open-ended questions.
METHODOLOGY
Fielded electronically under the Clinician Reviews logo, an introductory email letter signed by the Editors-in-Chief invited participation in the online 4th annual NP/PA Job Satisfaction Survey of 35 questions.
The survey was fielded August 23, 2019 to a random representative sample of NPs and PAs within the United States, excluding students. The first 150 respondents to complete the survey received a $25 Amazon.com gift certificate.
A total of 1,323 usable responses—a projectable sample size—were received by October 3, 2019, the final cut-off date.
Of the total respondents, 70% are NPs (931) and 30% are PAs (396), which is proportional to the universe of NPs and PAs.1,2 This summary of results is based on only those respondents who designated their profession as NP or PA.
- American Association of Nurse Practitioners. NP Fact Sheet. www.aanp.org/all-about-nps/np-fact-sheet. Accessed November 22, 2019.
- NCCPA. 2018 Statistical Profile of Certified Physician Assistants: an Annual Report of the National Commission on Certification of Physician Assistants. https://prodcmsstoragesa.blob.core.windows.net/uploads/files/2018StatisticalProfileofCertifiedPhysicianAssistants.pdf. Accessed November 22, 2019.
1. American Association of Nurse Practitioners. NP Fact Sheet. www.aanp.org/all-about-nps/np-fact-sheet. Accessed November 22, 2019.
2. NCCPA. 2018 Statistical Profile of Certified Physician Assistants: an Annual Report of the National Commission on Certification of Physician Assistants. https://prodcmsstoragesa.blob.core.windows.net/uploads/files/2018StatisticalProfileofCertifiedPhysicianAssistants.pdf. Accessed November 22, 2019.

NPs: Does Your Job Fulfill Your Expectations?
“I have the best job in the world.” This statement sums up how your colleagues feel about being a NP. Although there are certainly problems that deserve attention, the vast majority of clinicians, who are highly educated and practice in all specialties, state that they would re-enter the field if choosing again.
On the following pages, we focus on the details of the survey results, with breakouts by specialty, region, and practice setting. Be sure to check out which benefits your colleagues are getting, how much they’re being reimbursed for continuing education, information about salary by gender and time spent during the workweek; and much more. Participants, invited to comment, have provided several illuminating quotes, which we’ve included throughout the article, indicating what it’s like to be “in the trenches.”
WOULD YOU REPEAT THIS?
To get to the heart of the matter, we asked our survey takers “If you were to do it again, would you choose…”
- The same career
- The same educational preparation
- The same practice setting
To see what your colleagues said, go to the next page

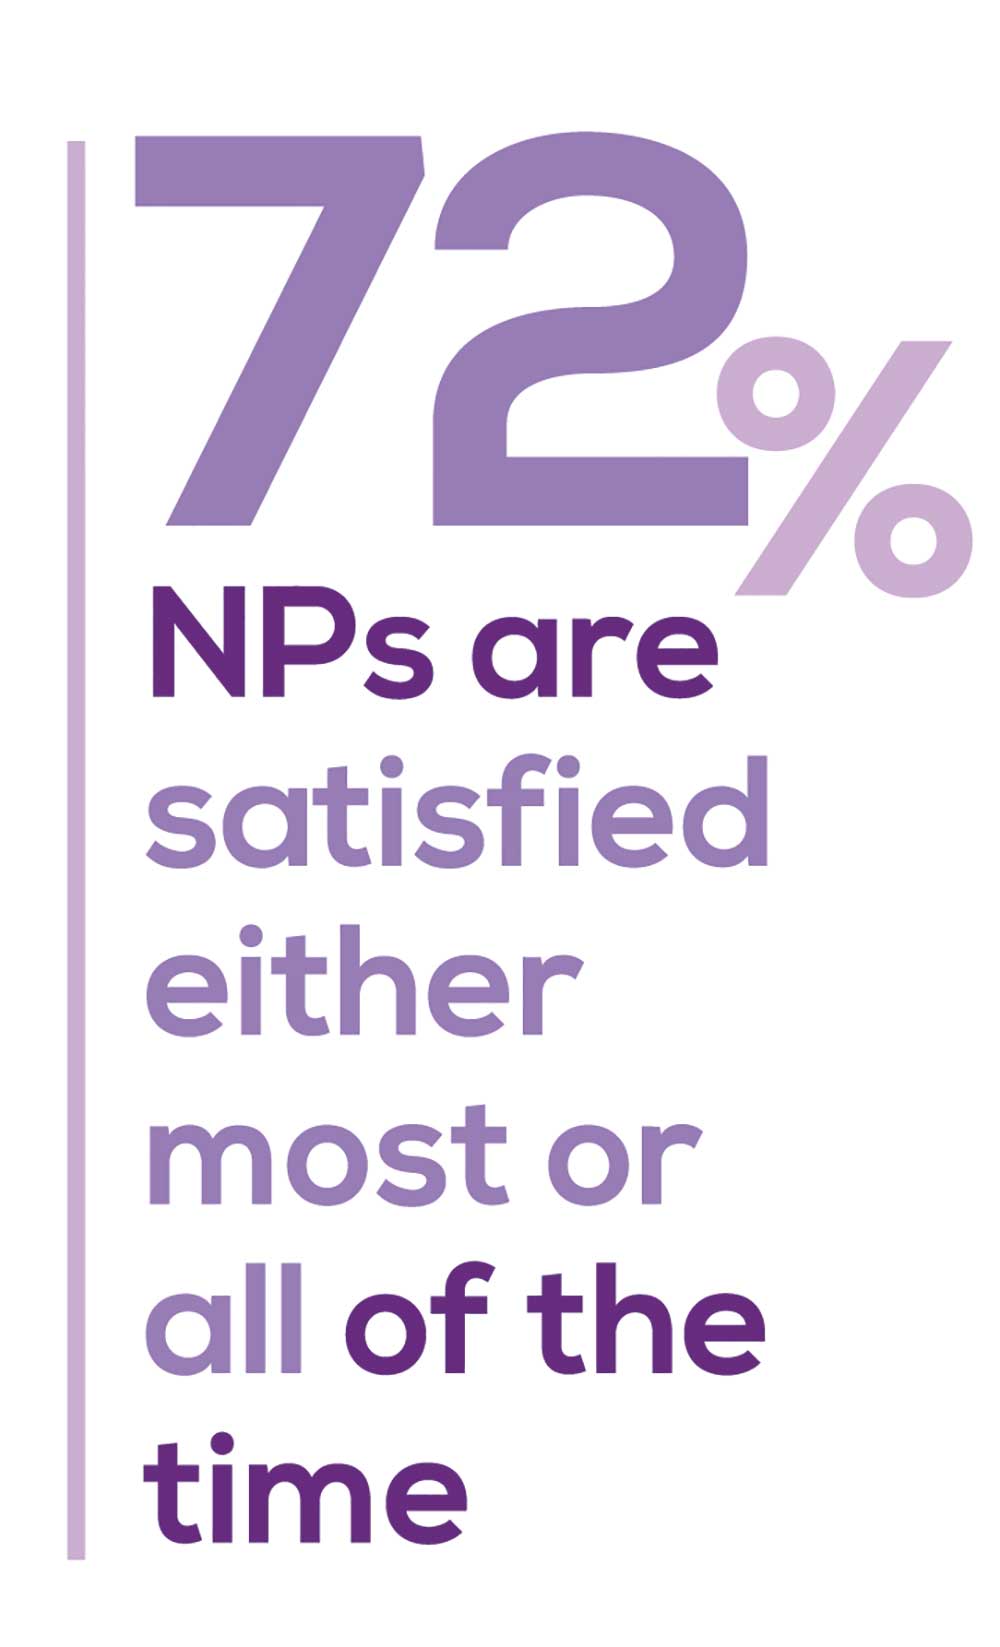
The majority of your peers gave an enthusiastic thumbs up to NP practice as a profession choice. Knowing what you know now, 84% of you agreed that you’d follow the same career path today as when you entered practice, which is up 2% from last year. Educational preparation came in for a ringing endorsement, increasing substantially since last year’s survey results (a 9% increase) and of practice setting up 4%.
Of NPs in practice between < 1 and 5 years, 62% felt their educational training was adequate; 74% felt their current responsibilities matched their expectations fairly accurately; and they were evenly divided on whether or not their career expectations were met.
“I enjoy being an NP and working with patients from all ethnic groups who are mostly uninsured.”
WOULD YOU TAKE A NEW JOB TODAY?
Continuing to probe about your level of satisfaction, we asked how you feel about changing your job. The answer choices were, “I would…”
- Change my job if I could get a better one (ie, better paid)
- Take any other job in which I could earn as much as I do now (ie, Yes, to leave the profession)
- Change both my job and my occupation (ie, I am burned out)
- Not make any changes (e, No, not for any reason)
We also asked you how many times have you’ve changed jobs since graduating from your PA program. The 4 answer choices ranged from “None” to “More than 3 times.” The final question asked which factors influence your decision about seeking/accepting a new position, allowing more than one choice from the list below.
- Salary/compensation
- Options for supplemental income
- Greater independence/more autonomy
- Opportunities for professional growth/development
- Formal career ladder for advancement
- Defined career path
- Recognition and appreciation
- Schedule flexibility
- Geographic location
- Access to and subsidy for more educational opportunities
- Employer reimbursement of school loans
- Specific state scope of practice and licensure law
- Work-life balance, including addressing burnout
- Working conditions
- Avoid toxic coworkers
- Top-of-the-line tools
- Telecommuting Cost of living
- Opportunity for outdoor activities/lifestyle
To see what your colleagues said, go to the next page
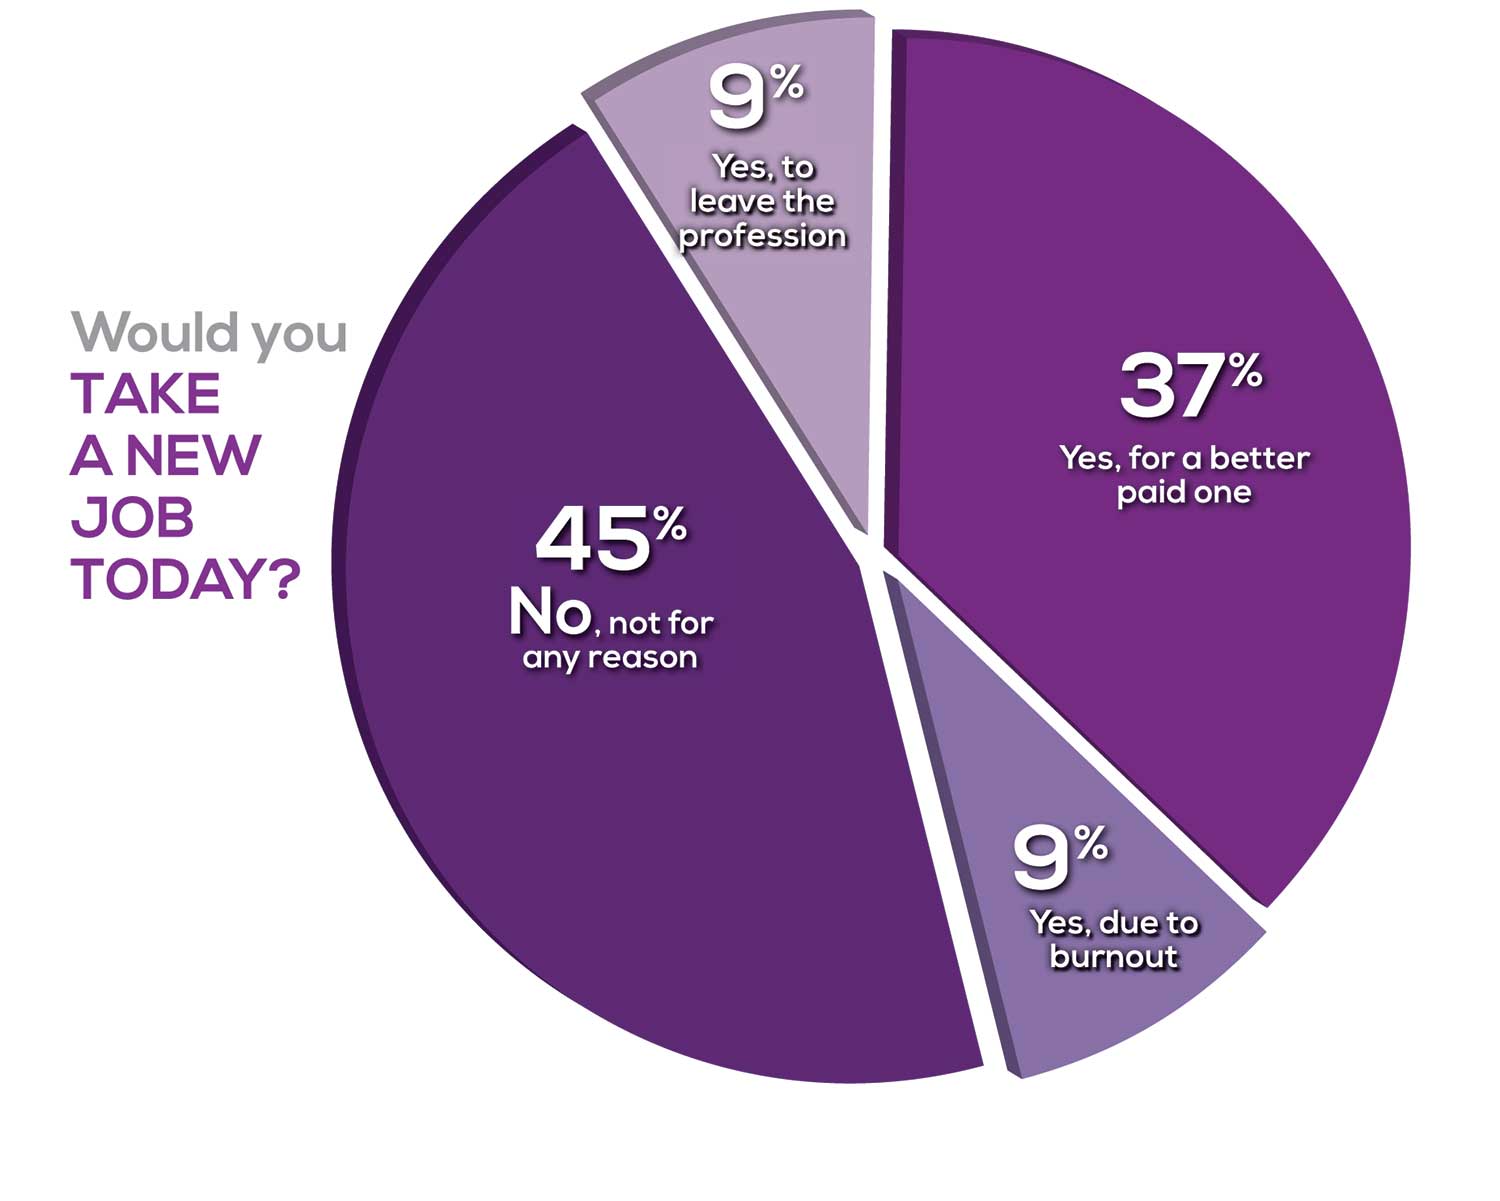
Compared to last year, NPs are 2% more likely to stay with their current job, stating that they would not make any changes. However, a greater number of NPs (31%) have changed jobs at the highest rate (> 3 times) compared to 25% last year.
Although 13% of NPs have never changed jobs, 37% have changed 2 or 3 times, and 31% have changed more 3 times (up 6% from last year). However, more NPs report feeling burned out (up 4% from last year) and wish to leave for another profession (up 3% from last year) compared to last year.
Respondents indicated that the following 4 factors would strongly influence their decision to seek or accept a new position:
- Salary/compensation: 82%
- Work-life balance & Schedule flexibility: 65%
- Working conditions: 63%
WHAT MAKES YOU MOST SATISFIED WITH YOUR WORK?
As you are aware, level of satisfaction depends on each of the following, which we asked respondents to rank from 1 to 5.
- Relationships with your colleagues (health care providers and clerical/admin personnel)
- Quality and duration of patient relationships
- Respect received from patients, their families, and your community
- Ability to make a difference and provide significant help to patients, their families, and your community
To see what your colleagues said, go to the next page
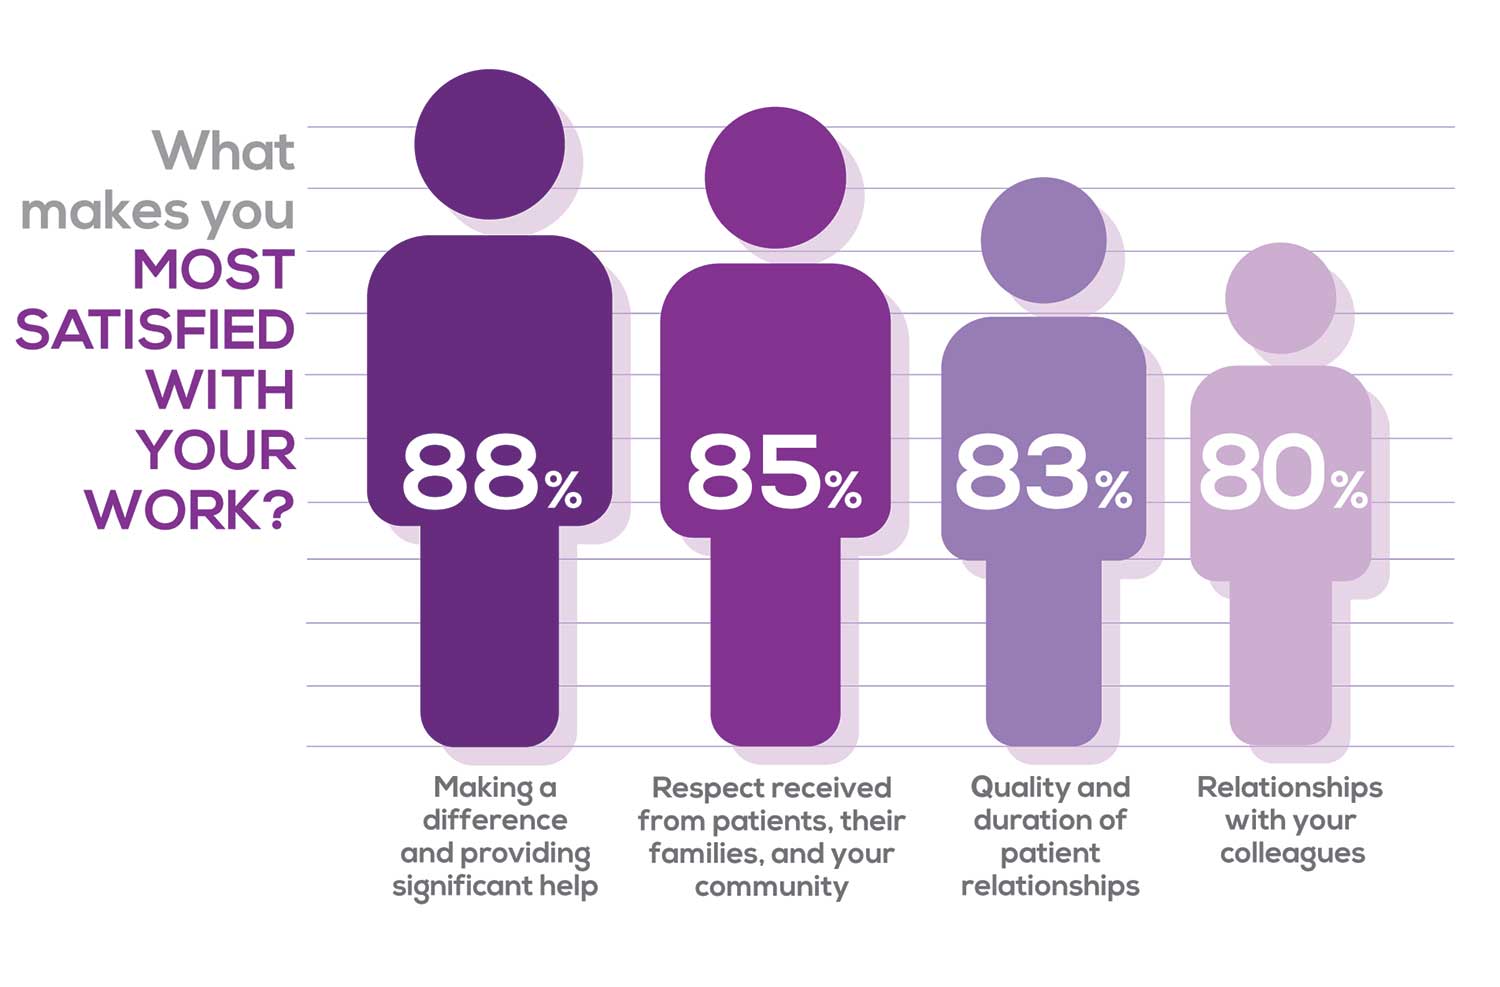
Echoing the survey results—which ranked “Making a difference and providing significant help” as the topmost source of job satisfaction—one of your colleagues commented that, “Ability to offer meaningful support to client needs” affected their satisfaction. On the other hand, though, one clinician wrote, “I feel like we are losing the art of caring and healing because we are rushed/pushed to do and see more.”
Compared to last year, the changes in response are
2% increase: Making a difference and providing significant help
3% increase: Respect received from patients and their families
No change: Relationships with your colleagues
3% increase: Quality and duration of patient relationships
MOST SATISFIED BY SPECIALTY
Knowing that certain specialties offer more advantages than others, we presented a list of 19 medical specialties, asking which is your primary one. We also asked how often you typically feel satisfied with your job, with these answer choices:
- Never
- Occasionally
- About half the time
- Most of the time
- Always
To see what your colleagues said, go to the next page
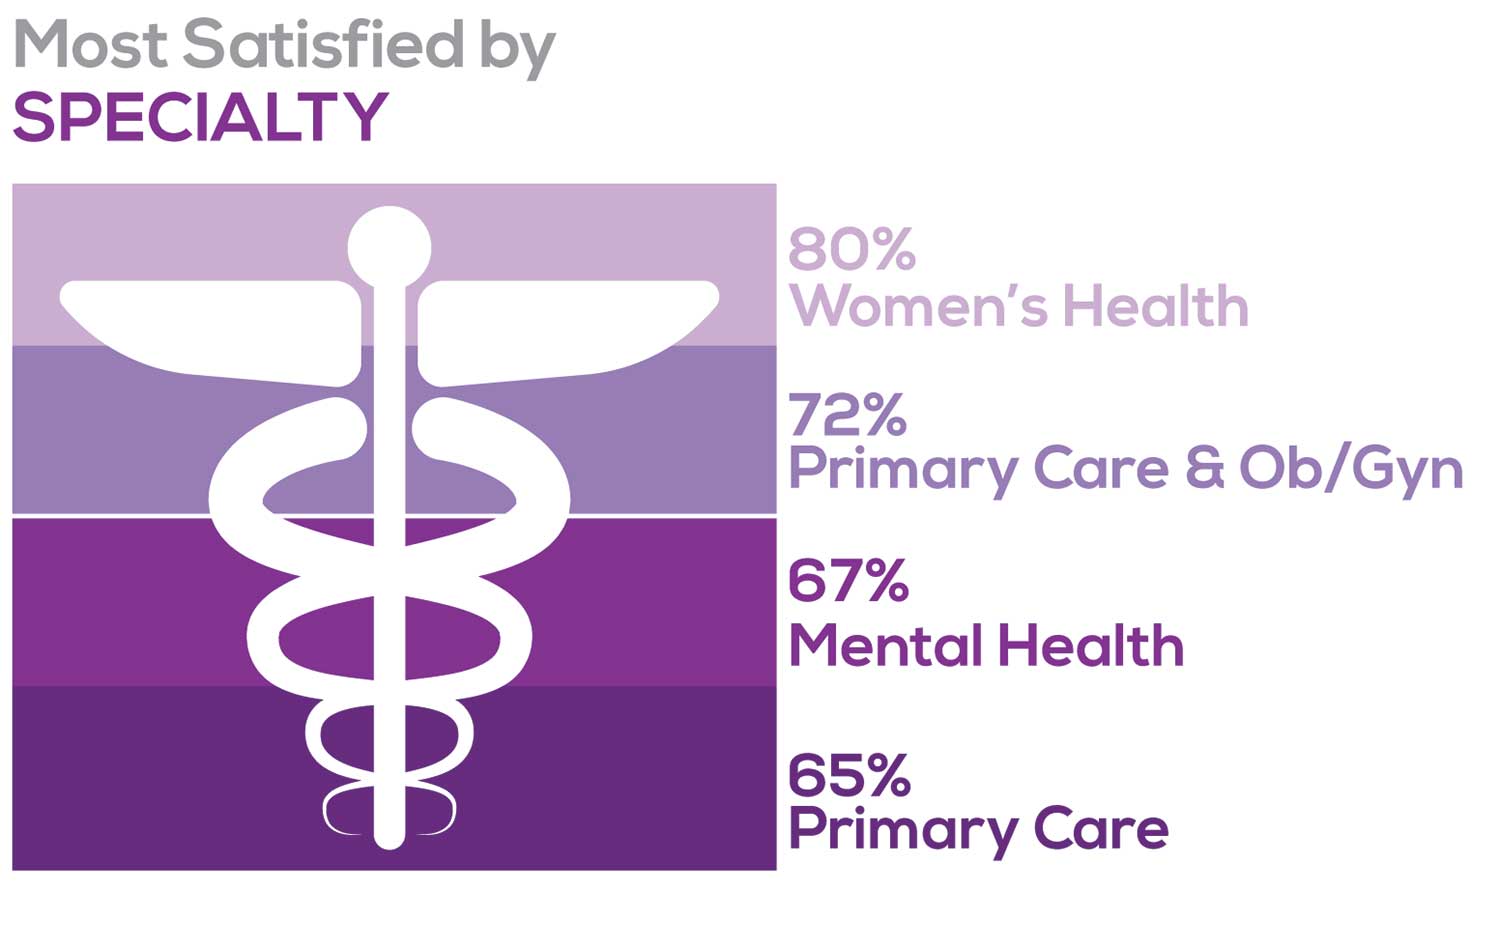
Correlating the data from the 2 questions (primary specialty and frequency of satisfaction) we posed, your peers indicated that the following specialties offered the highest levels of satisfaction.
- Women’s Health: 80%, a 9% increase over last year
- Primary Care & Ob/Gyn: 72%, a 3% increase over last year
- Psychiatric/Mental Health: 67%, a 6% decrease over last year
- Pediatrics: 65%, a 9% decrease over last year
MOST SATISFIED BY PRACTICE SETTING
Working conditions and coworker collegiality are integral to job satisfaction. To learn more about these factors, we asked you to identify the practice settings where you work.
- Academic setting (faculty); school/college health services
- Hospital: inpatient care; outpatient setting or community clinic
- Locum
- Physician practice: solo; single-specialty; multi-specialty
- Public health/occupational health setting; military/government
- Retail/convenient care; urgent care clinic
- Skilled nursing/long-term care facility
- NP practice
We also asked how often you typically feel satisfied with your job, with 5 answer choices ranging from “Never” to “Always.”
To see what your colleagues said, go to the next page
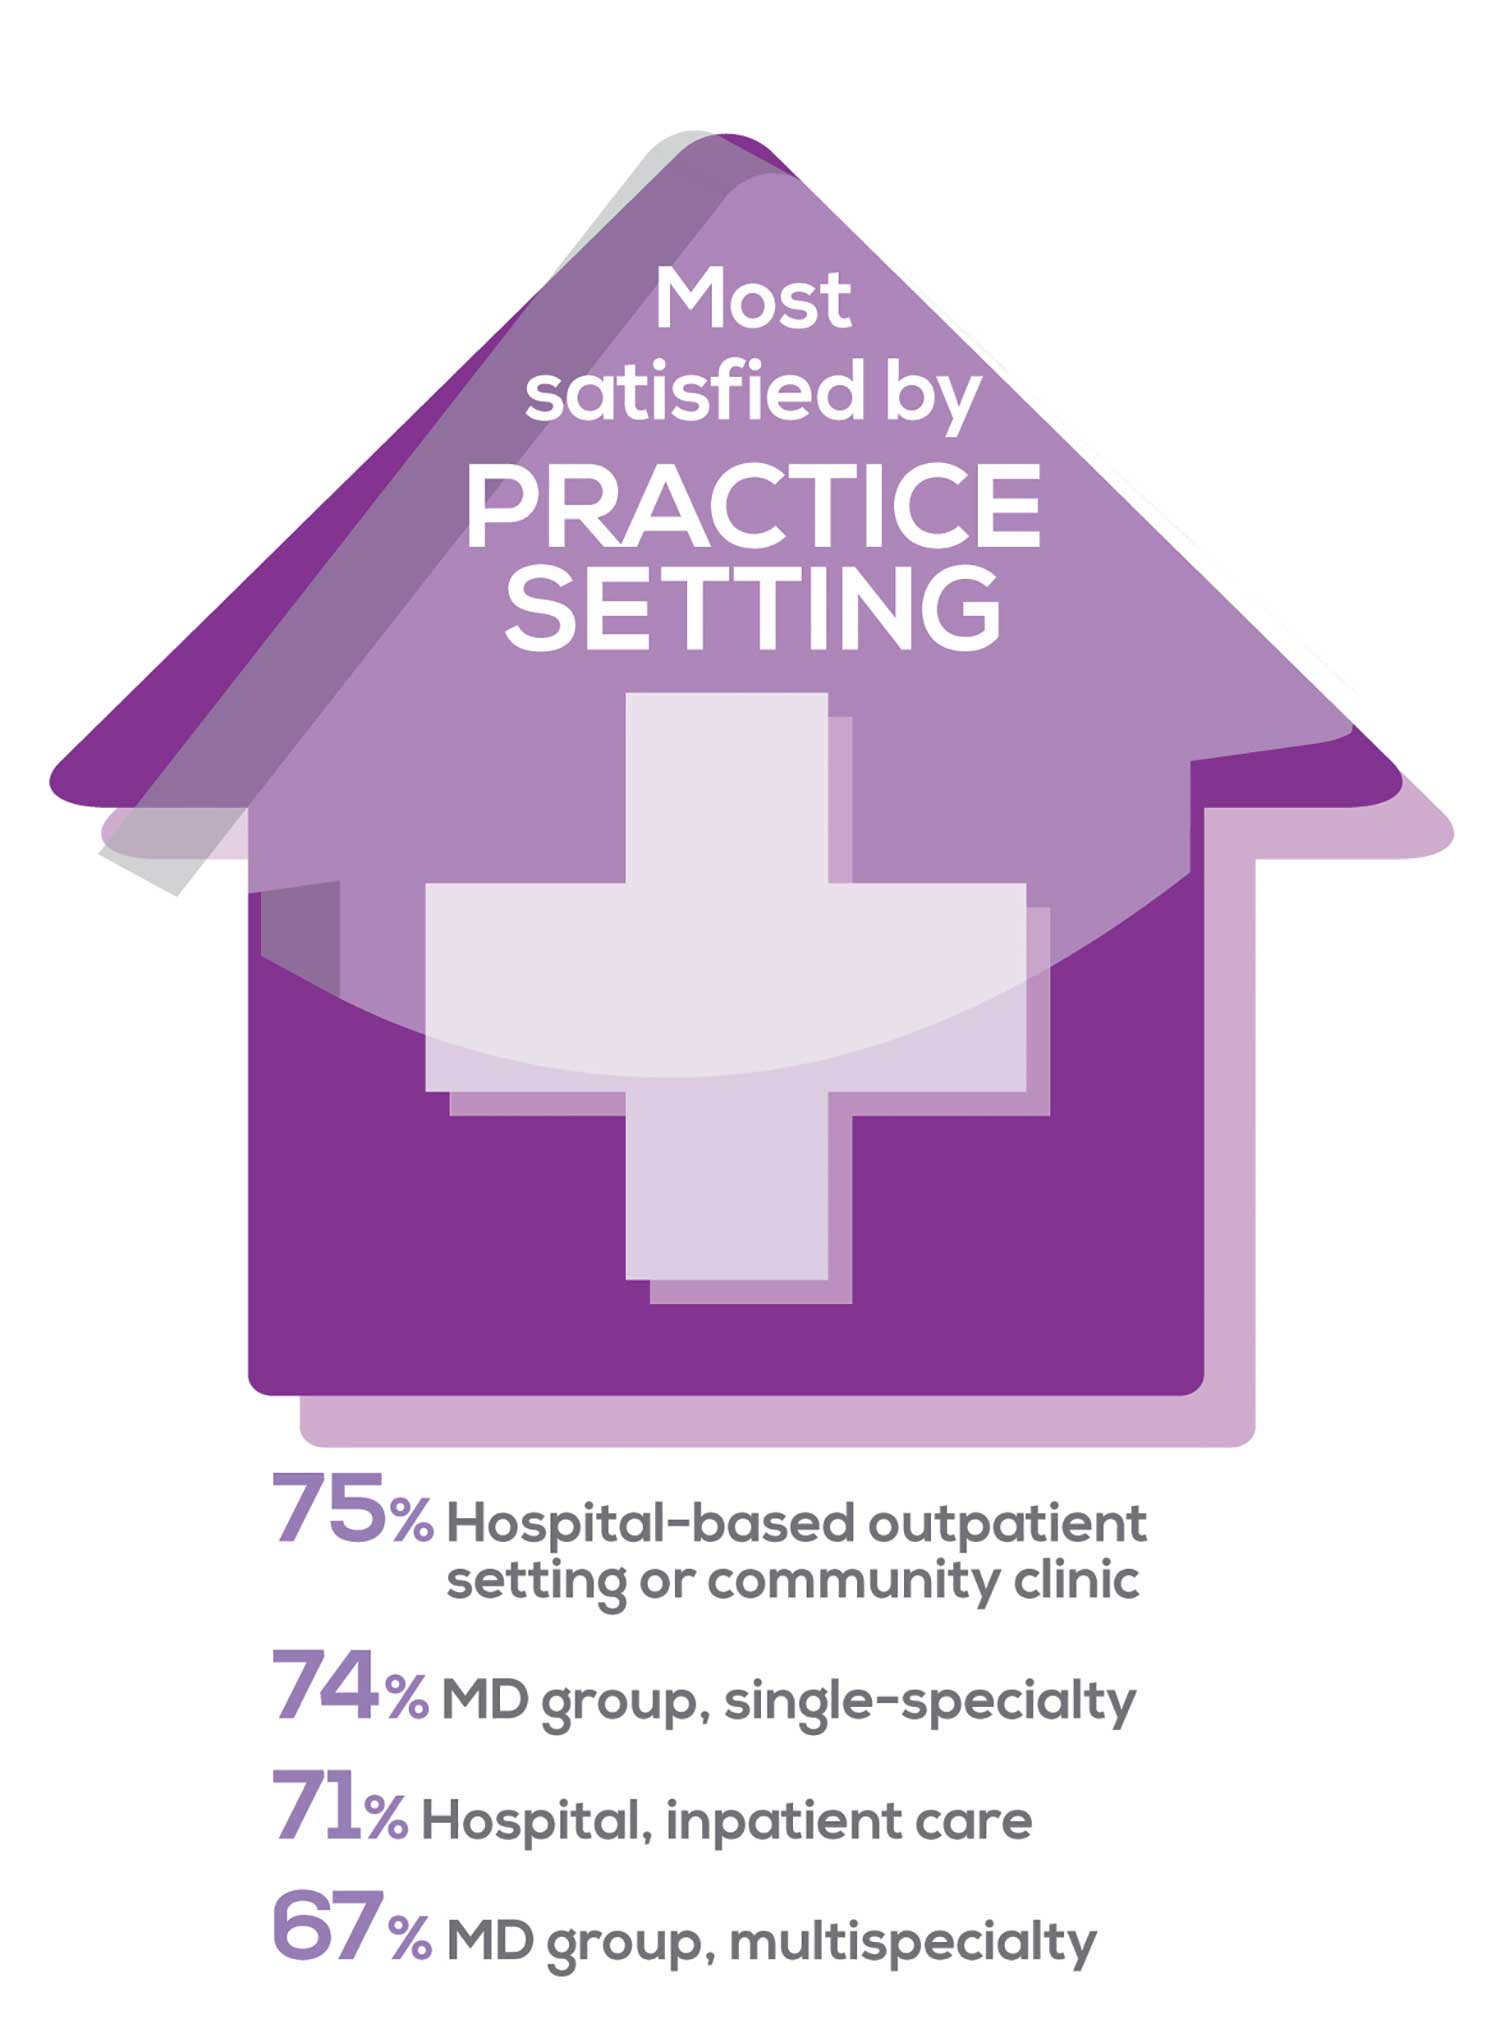
91% of NP respondents work as an employee; of these, 39% work in hospitals, and 25% work in physician offices.1 Therefore, it’s gratifying to see that hospital settings and physician groups are satisfying places to work. In addition, this data has not changed significantly since last year. Not surprisingly (based on comments that “ability to make administrative decisions and have a say in day-to-day operations” and “independent practice” matters), 83% of NPs who work solo were “most of the time/always” satisfied, compared with 72% of those in other practice settings.
- US Department of Health and Human Services, Health Resources and Services Administration, The U.S. Health Workforce Chartbook. Rockville, Maryland: U.S. Department of Health and Human Services, 2018.
BENEFITS
As you are aware, having access to the right benefits can go a long way to increasing job satisfaction. In addition to salary as a choice, we listed 30 benefits choices—insurance coverage, additional compensation opportunities, reimbursements, and other—asking which are offered by your employer (access) and which, in lieu of a modest increase in salary, are most important regardless of access. Your responses allowed us to identify the top 7 among your peers.
To see what your colleagues said, go to the next page
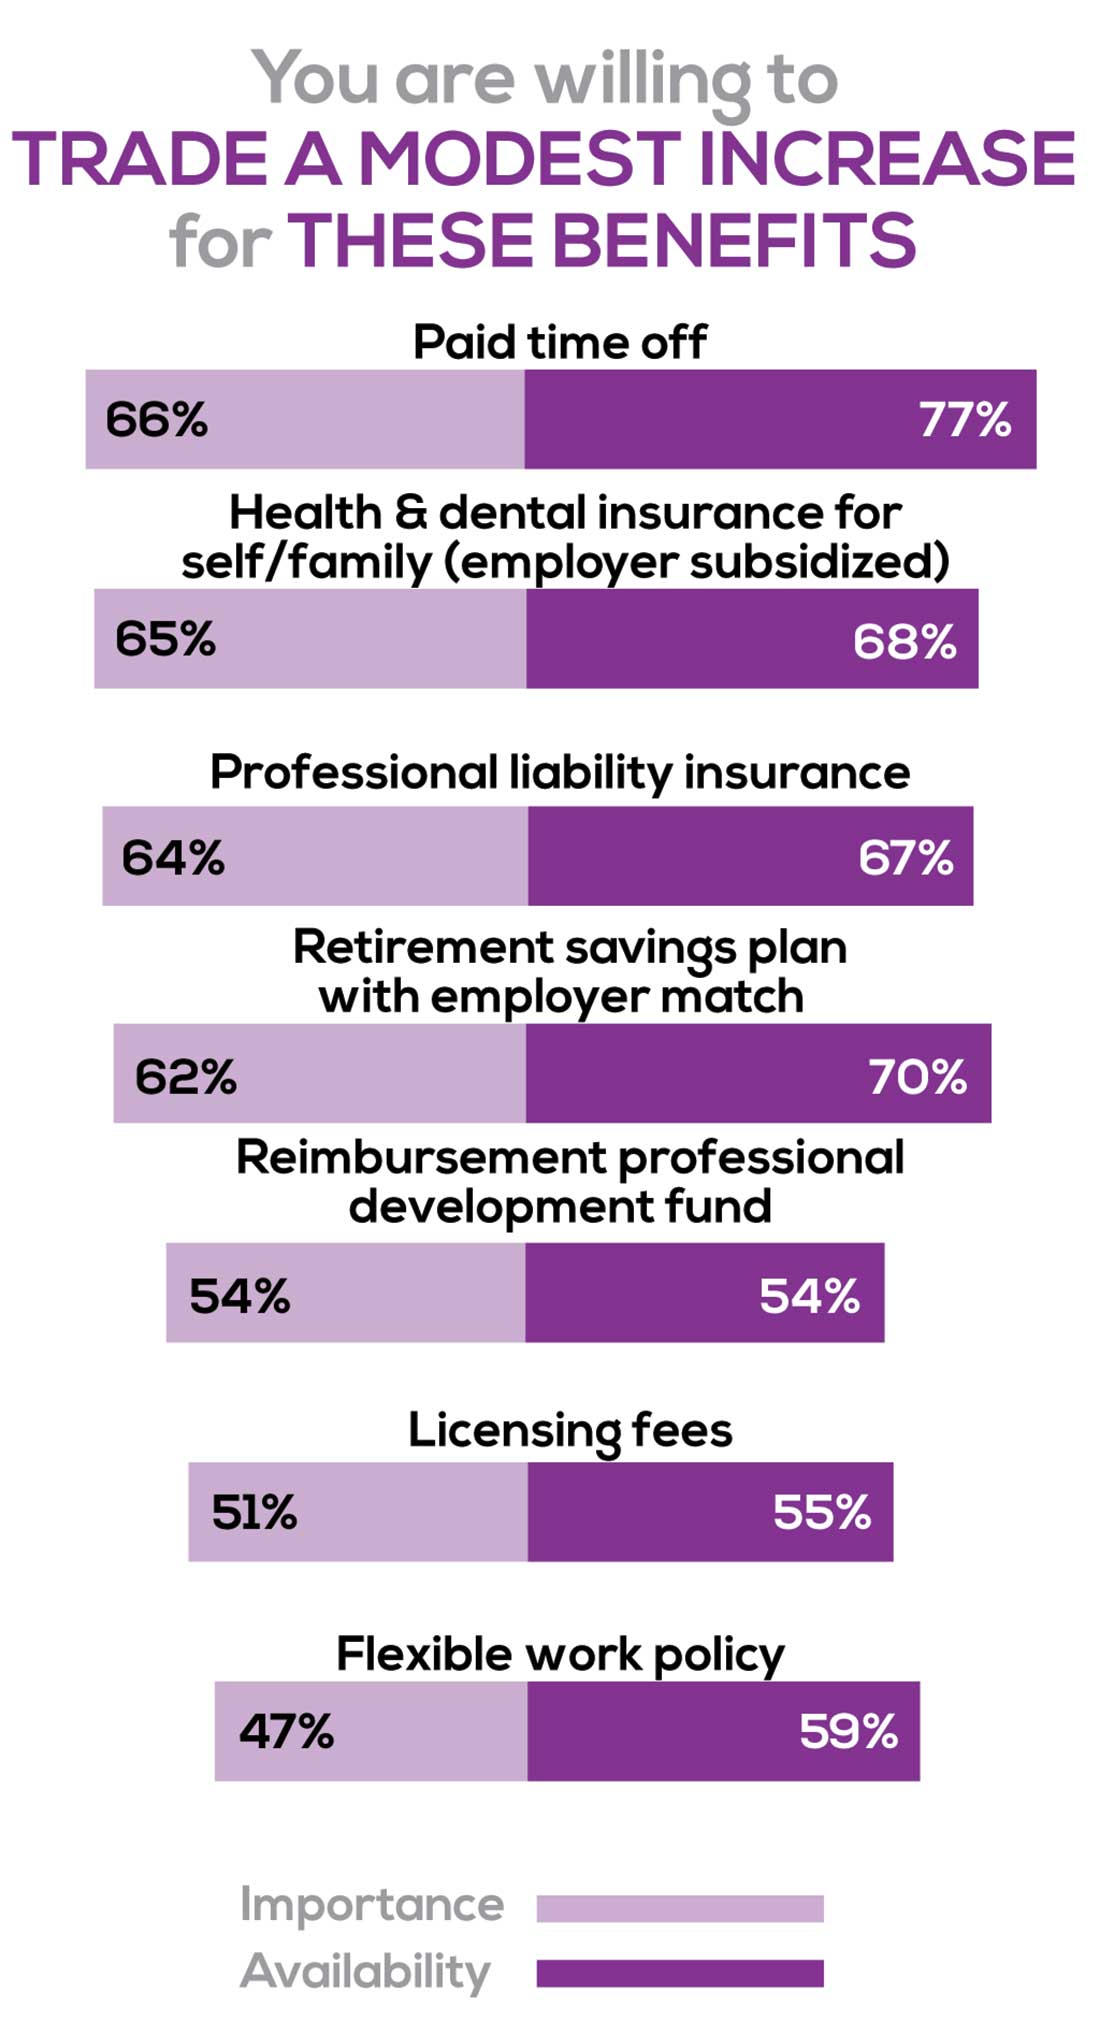
You are willing to trade a modest increase in salary for the following important benefits whether you are a new job seeker or an experienced practitioner.
- Compensation: Paid time off, retirement saving plan with employer match
- Insurance coverage: Health & dental insurance for self/family (employer subsidized), professional liability insurance
- Reimbursements: Professional development fund, licensing fees
- Other: Flexible work policy
MOST SATISFIED BY REGION
Location, location, location. Where you work depends in part on where your family is; in part on what jobs are available; what affects your commute, taxes and take home pay; and hence your satisfaction. Therefore, we asked where you work—West, Midwest, Northeast, or South—and paired the data with responses to the question about how often you typically feel satisfied with your job, with 5 answer choices ranging from “Never” to “Always.”
To see what your colleagues said, go to the next page
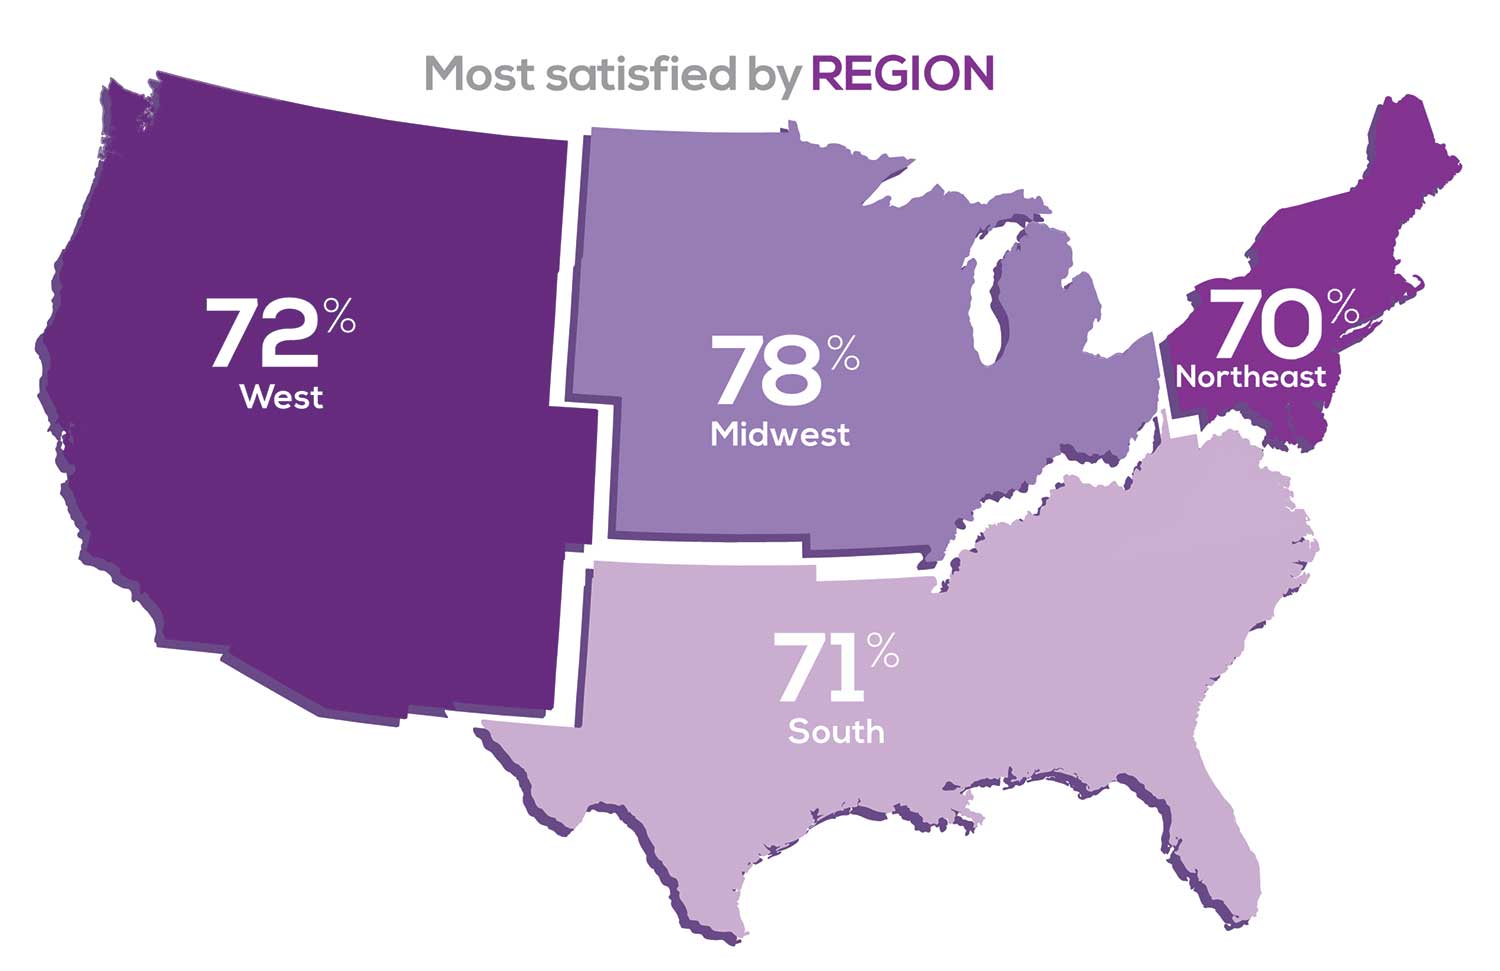
Geographic location is among the factors that influence the decision about seeking or accepting a new job for 50% of NP respondents. Compared to last year, satisfaction levels by region were
- 5% higher than last year in the Midwest
- 4% higher than last year in the South
- 2% lower than last year in the Northeast
- 14% lower than last year in the West
with 34% of NPs practicing in the South; 25% in the Northeast; 20% in the Midwest and West, each. 78% of NPs working in the Midwest are “most of the time/always” satisfied with their job.
SALARY
Because you indicated that salary is the most importance part of a desirable compensation package, we asked you to tell us what your salary bracket is. The amounts ranged from < $50,000 to > $175,000 per year (in $25,000 increments). Combining the responses to this question with those asking about gender and specialty, we are able to tie these factors together for you.
To see what your colleagues said, go to the next page
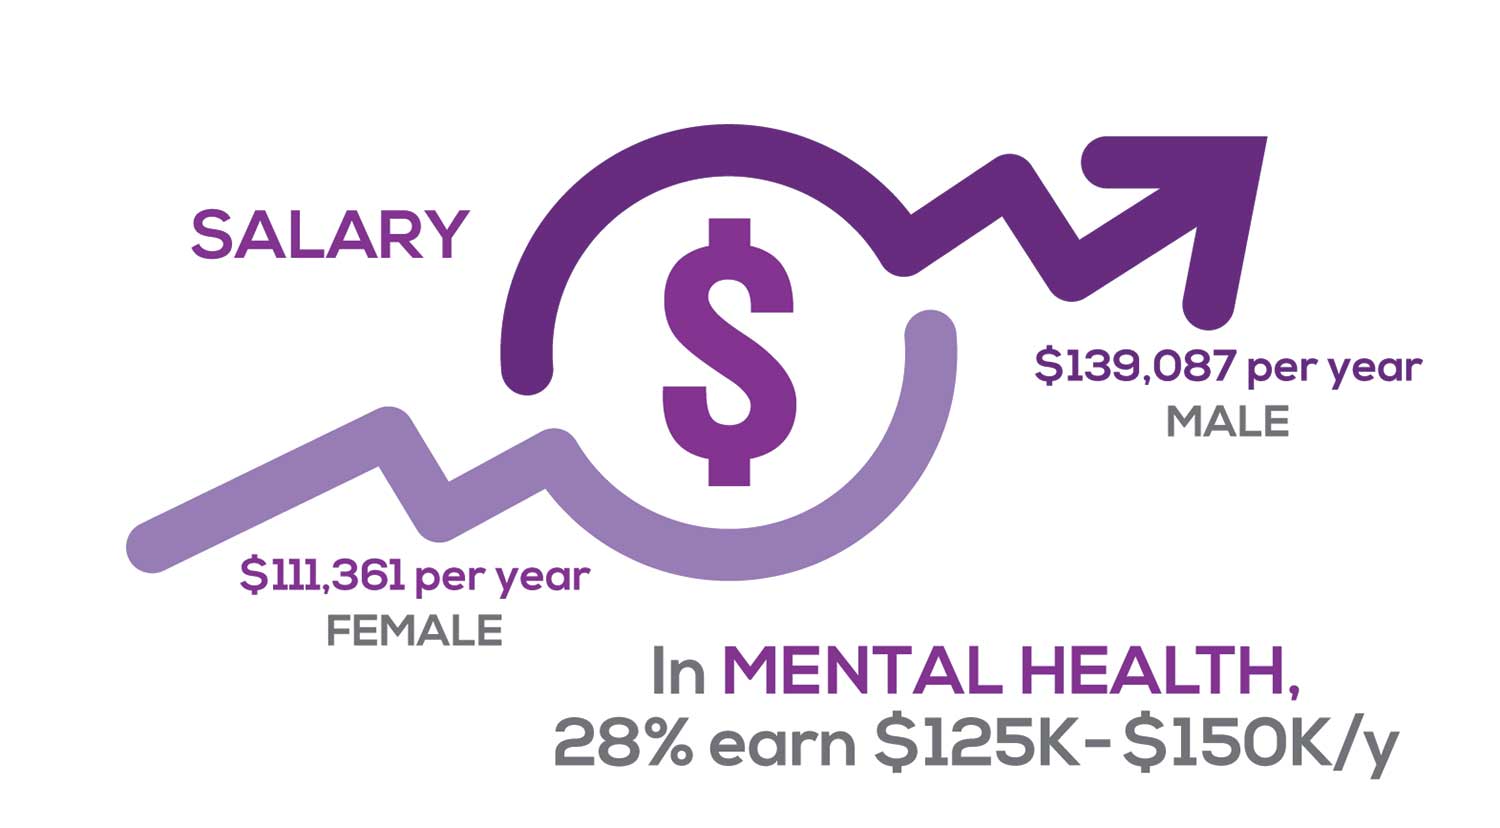
Approximately 11% of NPs earn up to $75K per year; 36% earn $100K to $125K per year; and 5% earn > $175K per year. The mean, full-time salary in 2018 was $106K per year.1 Similar to responses of previous years, women earn less than men in the NP profession.
Among NPs working in Psychiatric/Mental Health, we found that 28% earn between $125K to $150K per year, down 2% from last year. According to Pay Scale, the average salary for a Psychiatric NP is approximately $104K per year but varies according to job location.2 Although most NPs feel they are adequately compensated, we found that of NPs who practice in Pediatrics, 19% earn less than $75K per year, virtually unchanged from last year.
- NP Fact Sheet. 2018 AANP National Nurse Practitioner Sample Survey. https://www.aanp.org/about/all-about-nps/np-fact-sheet. Accessed December 19, 2019.
- Pay Scale. https://www.payscale.com/research/US/Job=Psychiatric_Nurse_Practitioner_(NP)/Salary. Accessed December 18, 2019.
WORKWEEK
Job satisfaction, and its opposite, burnout are related to your workload (ie, what you do and how much autonomy you have in deciding how to proceed). To help us evaluate these factors, we asked your colleagues to indicate how many hours per week are typically spent in direct (examine/diagnose/treat) and indirect patient care (perform and interpret labs, x-rays, refill prescriptions, etc), administrative duties, meetings, and teaching.
We were also interested in whether you assess, treat, and manage decisions
- Independently/by yourself
- In direct contact (in person or by phone) with a collaborating physician
- In consultation with a specialist
when providing patient care. Multiple answer choices were permitted.
To see what your colleagues said, go to the next page

As you can imagine, workload is a very hot topic. In response to, “What else affects your job satisfaction?” the greatest number of comments related to electronic charting and data collection. These activities are felt to demand so much time and effort that it takes away from patient care. The survey responses support this: Compared to last year, although the number of hours worked is the same this year, NPs now spend 1 hour less per week on patient care (direct and indirect) and 1 hour more on other duties (administrative and teaching). As one clinician put it, “…every year the administrative tasks increase but the admin time allowed to do these tasks does not.”
Aside from work hours, clinicians told us they seek positions that allow them “input on all issues related to practice” and flexibility on “what /who I am allowed to treat.” According to the survey, when providing patient care,
- 87% of NPs assess, treat, and manage decisions independently
- 22% collaborate with a physician
- 8% consult with a specialist
supporting the fact that 61% of NPs satisfied with your job most of the time; 11% are always satisfied.
A side note: Of the 68% of NPs who responded that they are involved in teaching students (82% of whom are NPs), they spend approximately 7 hours a week
- Either as a clinical preceptor (52%)
- In the classroom (3%)
- Or both (13%).
CE REIMBURSEMENT
As we know, NPs earn continuing education (CE) credits in order to maintain certification. Therefore, we asked you to indicate how much financial reimbursement you receive annually for CME; answer choices range from $0 to > $2,000 per year (in $500 increments). We also queried you about how much time you are allotted annually for CME; choices were from “None” to “More than 5 weeks.”
To see what your colleagues said, go to the next page
Many of your colleagues responded to the question “What else affects your job satisfaction?” with “Support for continuing learning” and “Educational opportunities.” This is reflected by 54% of survey respondents who stated that “Reimbursement for professional development” was an important benefit (see “Top 7 Benefits” above).
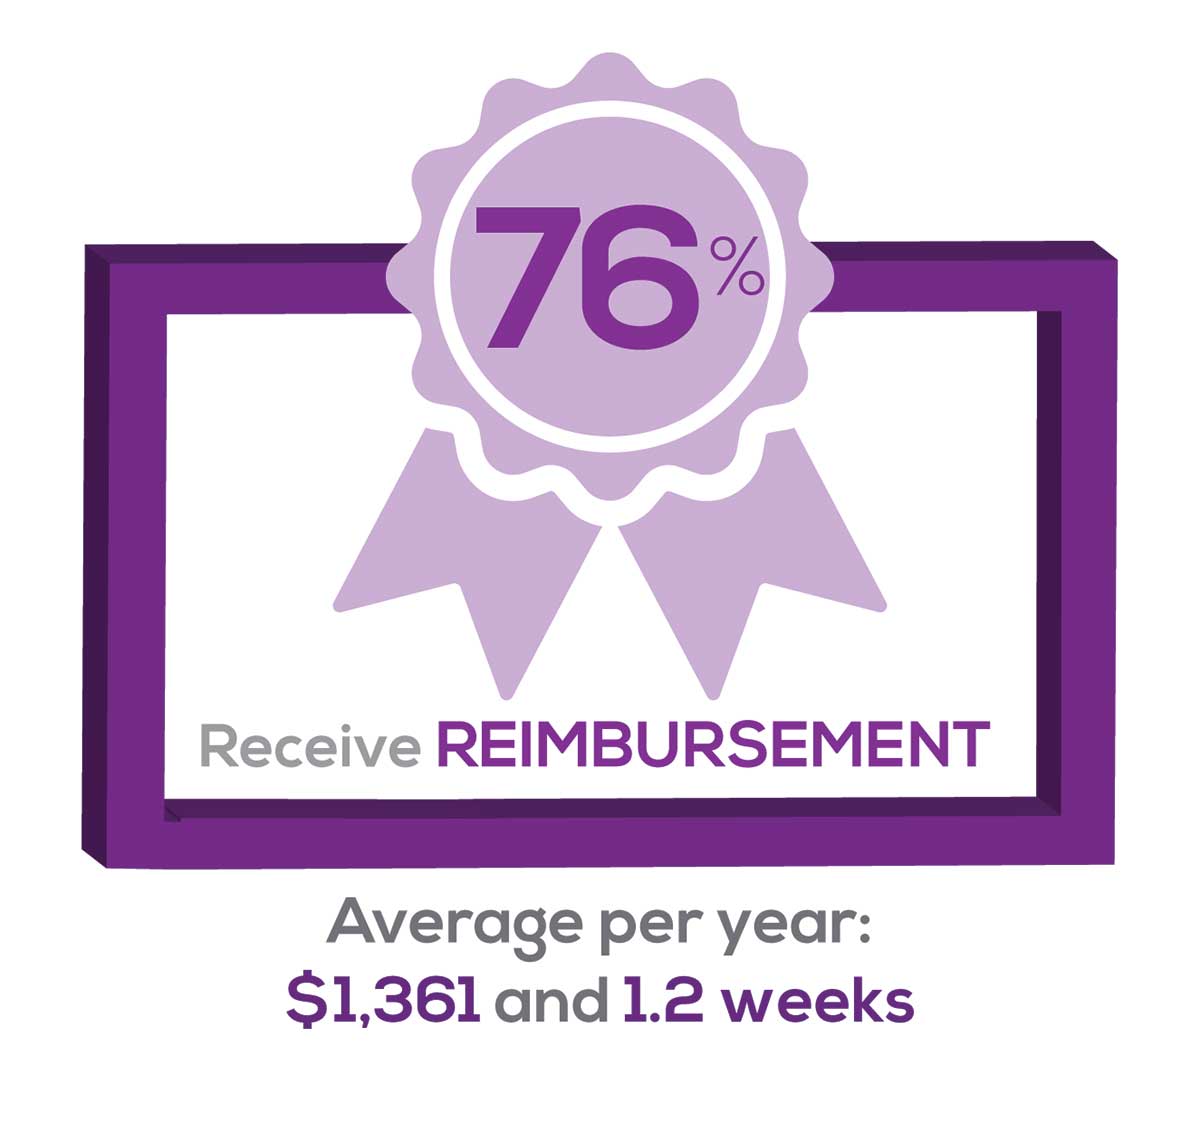
This year, 76% of respondents reported receiving remuneration—either money or time allowed or both—for CE, virtually unchanged from last year. Specifically,
- 24% received $0
- 10%, less than $500
- 13%, between $500 - $1,000
- 19%, between $1,001 - $1,500
- 19%, between $1,501 - $2,000
- 16%, more than $2,000
with average monetary compensation per year up approximately $350 over last year.
Responses to the amount of time you are allotted annually for CME ranged from “None” to “more than 5 weeks.”
- 29%, no time
- 33%, less than 1 week
- 33%, 1-2 weeks
- 2%, 3 weeks
- 1%, 4 weeks
- 0.11%, 5 weeks
- 2%, more than 5 weeks.
In closing, we offer thanks to all the survey participants whose answers helped us understand your current state of job satisfaction and most especially for your frank and enlightening responses to the open-ended questions.
METHODOLOGY
Fielded electronically under the Clinician Reviews logo, an introductory email letter signed by the Editors-in-Chief invited participation in the online 4th annual NP/PA Job Satisfaction Survey of 35 questions.
The survey was fielded August 23, 2019 to a random representative sample of NPs and PAs within the United States, excluding students. The first 150 respondents to complete the survey received a $25 Amazon.com gift certificate.
A total of 1,323 usable responses—a projectable sample size—were received by October 3, 2019, the final cut-off date.
Of the total respondents, 70% are NPs (931) and 30% are PAs (396), which is proportional to the universe of NPs and PAs.1,2 This summary of results is based on only those respondents who designated their profession as NP or PA.
- American Association of Nurse Practitioners. NP Fact Sheet. www.aanp.org/all-about-nps/np-fact-sheet. Accessed November 22, 2019.
- NCCPA. 2018 Statistical Profile of Certified Physician Assistants: an Annual Report of the National Commission on Certification of Physician Assistants. https://prodcmsstoragesa.blob.core.windows.net/uploads/files/2018StatisticalProfileofCertifiedPhysicianAssistants.pdf. Accessed November 22, 2019.
1. American Association of Nurse Practitioners. NP Fact Sheet. www.aanp.org/all-about-nps/np-fact-sheet. Accessed November 22, 2019.
2. NCCPA. 2018 Statistical Profile of Certified Physician Assistants: an Annual Report of the National Commission on Certification of Physician Assistants. https://prodcmsstoragesa.blob.core.windows.net/uploads/files/2018StatisticalProfileofCertifiedPhysicianAssistants.pdf. Accessed November 22, 2019.
“I have the best job in the world.” This statement sums up how your colleagues feel about being a NP. Although there are certainly problems that deserve attention, the vast majority of clinicians, who are highly educated and practice in all specialties, state that they would re-enter the field if choosing again.
On the following pages, we focus on the details of the survey results, with breakouts by specialty, region, and practice setting. Be sure to check out which benefits your colleagues are getting, how much they’re being reimbursed for continuing education, information about salary by gender and time spent during the workweek; and much more. Participants, invited to comment, have provided several illuminating quotes, which we’ve included throughout the article, indicating what it’s like to be “in the trenches.”
WOULD YOU REPEAT THIS?
To get to the heart of the matter, we asked our survey takers “If you were to do it again, would you choose…”
- The same career
- The same educational preparation
- The same practice setting
To see what your colleagues said, go to the next page
The majority of your peers gave an enthusiastic thumbs up to NP practice as a profession choice. Knowing what you know now, 84% of you agreed that you’d follow the same career path today as when you entered practice, which is up 2% from last year. Educational preparation came in for a ringing endorsement, increasing substantially since last year’s survey results (a 9% increase) and of practice setting up 4%.
Of NPs in practice between < 1 and 5 years, 62% felt their educational training was adequate; 74% felt their current responsibilities matched their expectations fairly accurately; and they were evenly divided on whether or not their career expectations were met.
“I enjoy being an NP and working with patients from all ethnic groups who are mostly uninsured.”
WOULD YOU TAKE A NEW JOB TODAY?
Continuing to probe about your level of satisfaction, we asked how you feel about changing your job. The answer choices were, “I would…”
- Change my job if I could get a better one (ie, better paid)
- Take any other job in which I could earn as much as I do now (ie, Yes, to leave the profession)
- Change both my job and my occupation (ie, I am burned out)
- Not make any changes (e, No, not for any reason)
We also asked you how many times have you’ve changed jobs since graduating from your PA program. The 4 answer choices ranged from “None” to “More than 3 times.” The final question asked which factors influence your decision about seeking/accepting a new position, allowing more than one choice from the list below.
- Salary/compensation
- Options for supplemental income
- Greater independence/more autonomy
- Opportunities for professional growth/development
- Formal career ladder for advancement
- Defined career path
- Recognition and appreciation
- Schedule flexibility
- Geographic location
- Access to and subsidy for more educational opportunities
- Employer reimbursement of school loans
- Specific state scope of practice and licensure law
- Work-life balance, including addressing burnout
- Working conditions
- Avoid toxic coworkers
- Top-of-the-line tools
- Telecommuting Cost of living
- Opportunity for outdoor activities/lifestyle
To see what your colleagues said, go to the next page
Compared to last year, NPs are 2% more likely to stay with their current job, stating that they would not make any changes. However, a greater number of NPs (31%) have changed jobs at the highest rate (> 3 times) compared to 25% last year.
Although 13% of NPs have never changed jobs, 37% have changed 2 or 3 times, and 31% have changed more 3 times (up 6% from last year). However, more NPs report feeling burned out (up 4% from last year) and wish to leave for another profession (up 3% from last year) compared to last year.
Respondents indicated that the following 4 factors would strongly influence their decision to seek or accept a new position:
- Salary/compensation: 82%
- Work-life balance & Schedule flexibility: 65%
- Working conditions: 63%
WHAT MAKES YOU MOST SATISFIED WITH YOUR WORK?
As you are aware, level of satisfaction depends on each of the following, which we asked respondents to rank from 1 to 5.
- Relationships with your colleagues (health care providers and clerical/admin personnel)
- Quality and duration of patient relationships
- Respect received from patients, their families, and your community
- Ability to make a difference and provide significant help to patients, their families, and your community
To see what your colleagues said, go to the next page
Echoing the survey results—which ranked “Making a difference and providing significant help” as the topmost source of job satisfaction—one of your colleagues commented that, “Ability to offer meaningful support to client needs” affected their satisfaction. On the other hand, though, one clinician wrote, “I feel like we are losing the art of caring and healing because we are rushed/pushed to do and see more.”
Compared to last year, the changes in response are
2% increase: Making a difference and providing significant help
3% increase: Respect received from patients and their families
No change: Relationships with your colleagues
3% increase: Quality and duration of patient relationships
MOST SATISFIED BY SPECIALTY
Knowing that certain specialties offer more advantages than others, we presented a list of 19 medical specialties, asking which is your primary one. We also asked how often you typically feel satisfied with your job, with these answer choices:
- Never
- Occasionally
- About half the time
- Most of the time
- Always
To see what your colleagues said, go to the next page
Correlating the data from the 2 questions (primary specialty and frequency of satisfaction) we posed, your peers indicated that the following specialties offered the highest levels of satisfaction.
- Women’s Health: 80%, a 9% increase over last year
- Primary Care & Ob/Gyn: 72%, a 3% increase over last year
- Psychiatric/Mental Health: 67%, a 6% decrease over last year
- Pediatrics: 65%, a 9% decrease over last year
MOST SATISFIED BY PRACTICE SETTING
Working conditions and coworker collegiality are integral to job satisfaction. To learn more about these factors, we asked you to identify the practice settings where you work.
- Academic setting (faculty); school/college health services
- Hospital: inpatient care; outpatient setting or community clinic
- Locum
- Physician practice: solo; single-specialty; multi-specialty
- Public health/occupational health setting; military/government
- Retail/convenient care; urgent care clinic
- Skilled nursing/long-term care facility
- NP practice
We also asked how often you typically feel satisfied with your job, with 5 answer choices ranging from “Never” to “Always.”
To see what your colleagues said, go to the next page
91% of NP respondents work as an employee; of these, 39% work in hospitals, and 25% work in physician offices.1 Therefore, it’s gratifying to see that hospital settings and physician groups are satisfying places to work. In addition, this data has not changed significantly since last year. Not surprisingly (based on comments that “ability to make administrative decisions and have a say in day-to-day operations” and “independent practice” matters), 83% of NPs who work solo were “most of the time/always” satisfied, compared with 72% of those in other practice settings.
- US Department of Health and Human Services, Health Resources and Services Administration, The U.S. Health Workforce Chartbook. Rockville, Maryland: U.S. Department of Health and Human Services, 2018.
BENEFITS
As you are aware, having access to the right benefits can go a long way to increasing job satisfaction. In addition to salary as a choice, we listed 30 benefits choices—insurance coverage, additional compensation opportunities, reimbursements, and other—asking which are offered by your employer (access) and which, in lieu of a modest increase in salary, are most important regardless of access. Your responses allowed us to identify the top 7 among your peers.
To see what your colleagues said, go to the next page
You are willing to trade a modest increase in salary for the following important benefits whether you are a new job seeker or an experienced practitioner.
- Compensation: Paid time off, retirement saving plan with employer match
- Insurance coverage: Health & dental insurance for self/family (employer subsidized), professional liability insurance
- Reimbursements: Professional development fund, licensing fees
- Other: Flexible work policy
MOST SATISFIED BY REGION
Location, location, location. Where you work depends in part on where your family is; in part on what jobs are available; what affects your commute, taxes and take home pay; and hence your satisfaction. Therefore, we asked where you work—West, Midwest, Northeast, or South—and paired the data with responses to the question about how often you typically feel satisfied with your job, with 5 answer choices ranging from “Never” to “Always.”
To see what your colleagues said, go to the next page
Geographic location is among the factors that influence the decision about seeking or accepting a new job for 50% of NP respondents. Compared to last year, satisfaction levels by region were
- 5% higher than last year in the Midwest
- 4% higher than last year in the South
- 2% lower than last year in the Northeast
- 14% lower than last year in the West
with 34% of NPs practicing in the South; 25% in the Northeast; 20% in the Midwest and West, each. 78% of NPs working in the Midwest are “most of the time/always” satisfied with their job.
SALARY
Because you indicated that salary is the most importance part of a desirable compensation package, we asked you to tell us what your salary bracket is. The amounts ranged from < $50,000 to > $175,000 per year (in $25,000 increments). Combining the responses to this question with those asking about gender and specialty, we are able to tie these factors together for you.
To see what your colleagues said, go to the next page
Approximately 11% of NPs earn up to $75K per year; 36% earn $100K to $125K per year; and 5% earn > $175K per year. The mean, full-time salary in 2018 was $106K per year.1 Similar to responses of previous years, women earn less than men in the NP profession.
Among NPs working in Psychiatric/Mental Health, we found that 28% earn between $125K to $150K per year, down 2% from last year. According to Pay Scale, the average salary for a Psychiatric NP is approximately $104K per year but varies according to job location.2 Although most NPs feel they are adequately compensated, we found that of NPs who practice in Pediatrics, 19% earn less than $75K per year, virtually unchanged from last year.
- NP Fact Sheet. 2018 AANP National Nurse Practitioner Sample Survey. https://www.aanp.org/about/all-about-nps/np-fact-sheet. Accessed December 19, 2019.
- Pay Scale. https://www.payscale.com/research/US/Job=Psychiatric_Nurse_Practitioner_(NP)/Salary. Accessed December 18, 2019.
WORKWEEK
Job satisfaction, and its opposite, burnout are related to your workload (ie, what you do and how much autonomy you have in deciding how to proceed). To help us evaluate these factors, we asked your colleagues to indicate how many hours per week are typically spent in direct (examine/diagnose/treat) and indirect patient care (perform and interpret labs, x-rays, refill prescriptions, etc), administrative duties, meetings, and teaching.
We were also interested in whether you assess, treat, and manage decisions
- Independently/by yourself
- In direct contact (in person or by phone) with a collaborating physician
- In consultation with a specialist
when providing patient care. Multiple answer choices were permitted.
To see what your colleagues said, go to the next page
As you can imagine, workload is a very hot topic. In response to, “What else affects your job satisfaction?” the greatest number of comments related to electronic charting and data collection. These activities are felt to demand so much time and effort that it takes away from patient care. The survey responses support this: Compared to last year, although the number of hours worked is the same this year, NPs now spend 1 hour less per week on patient care (direct and indirect) and 1 hour more on other duties (administrative and teaching). As one clinician put it, “…every year the administrative tasks increase but the admin time allowed to do these tasks does not.”
Aside from work hours, clinicians told us they seek positions that allow them “input on all issues related to practice” and flexibility on “what /who I am allowed to treat.” According to the survey, when providing patient care,
- 87% of NPs assess, treat, and manage decisions independently
- 22% collaborate with a physician
- 8% consult with a specialist
supporting the fact that 61% of NPs satisfied with your job most of the time; 11% are always satisfied.
A side note: Of the 68% of NPs who responded that they are involved in teaching students (82% of whom are NPs), they spend approximately 7 hours a week
- Either as a clinical preceptor (52%)
- In the classroom (3%)
- Or both (13%).
CE REIMBURSEMENT
As we know, NPs earn continuing education (CE) credits in order to maintain certification. Therefore, we asked you to indicate how much financial reimbursement you receive annually for CME; answer choices range from $0 to > $2,000 per year (in $500 increments). We also queried you about how much time you are allotted annually for CME; choices were from “None” to “More than 5 weeks.”
To see what your colleagues said, go to the next page
Many of your colleagues responded to the question “What else affects your job satisfaction?” with “Support for continuing learning” and “Educational opportunities.” This is reflected by 54% of survey respondents who stated that “Reimbursement for professional development” was an important benefit (see “Top 7 Benefits” above).
This year, 76% of respondents reported receiving remuneration—either money or time allowed or both—for CE, virtually unchanged from last year. Specifically,
- 24% received $0
- 10%, less than $500
- 13%, between $500 - $1,000
- 19%, between $1,001 - $1,500
- 19%, between $1,501 - $2,000
- 16%, more than $2,000
with average monetary compensation per year up approximately $350 over last year.
Responses to the amount of time you are allotted annually for CME ranged from “None” to “more than 5 weeks.”
- 29%, no time
- 33%, less than 1 week
- 33%, 1-2 weeks
- 2%, 3 weeks
- 1%, 4 weeks
- 0.11%, 5 weeks
- 2%, more than 5 weeks.
In closing, we offer thanks to all the survey participants whose answers helped us understand your current state of job satisfaction and most especially for your frank and enlightening responses to the open-ended questions.
METHODOLOGY
Fielded electronically under the Clinician Reviews logo, an introductory email letter signed by the Editors-in-Chief invited participation in the online 4th annual NP/PA Job Satisfaction Survey of 35 questions.
The survey was fielded August 23, 2019 to a random representative sample of NPs and PAs within the United States, excluding students. The first 150 respondents to complete the survey received a $25 Amazon.com gift certificate.
A total of 1,323 usable responses—a projectable sample size—were received by October 3, 2019, the final cut-off date.
Of the total respondents, 70% are NPs (931) and 30% are PAs (396), which is proportional to the universe of NPs and PAs.1,2 This summary of results is based on only those respondents who designated their profession as NP or PA.
- American Association of Nurse Practitioners. NP Fact Sheet. www.aanp.org/all-about-nps/np-fact-sheet. Accessed November 22, 2019.
- NCCPA. 2018 Statistical Profile of Certified Physician Assistants: an Annual Report of the National Commission on Certification of Physician Assistants. https://prodcmsstoragesa.blob.core.windows.net/uploads/files/2018StatisticalProfileofCertifiedPhysicianAssistants.pdf. Accessed November 22, 2019.
1. American Association of Nurse Practitioners. NP Fact Sheet. www.aanp.org/all-about-nps/np-fact-sheet. Accessed November 22, 2019.
2. NCCPA. 2018 Statistical Profile of Certified Physician Assistants: an Annual Report of the National Commission on Certification of Physician Assistants. https://prodcmsstoragesa.blob.core.windows.net/uploads/files/2018StatisticalProfileofCertifiedPhysicianAssistants.pdf. Accessed November 22, 2019.

How Motivational Interviewing Helps Patients with Diabetes
In 2019, 30.3 million US adults were reported to have diabetes—an epidemic according to some public health experts.1,2 Even more sobering, an estimated 84.1 million (or more than 1 in 3) American adults have prediabetes.1 Diabetes is associated with multiple complications, including an increased risk for heart disease or stroke.3 In 2015, it was the seventh leading cause of death and a major cause of kidney failure, lower limb amputations, stroke, and blindness.2,4
As clinicians we often ask ourselves, “How can I help my patients become more effective managers of their diabetes, so that they can maximize their quality of life over both the short and long term?” Unfortunately, management of diabetes is fraught with difficulty, both for the provider and the patient. Medications for glycemic control can be expensive and inconvenient and can have adverse effects—all of which may lead to inconsistent adherence. Lifestyle changes—including diet, regular physical activity, exercise, and weight management—are important low-risk interventions that help patients maintain glycemic values and reduce the risk for diabetic complications. However, some patients may find it difficult to make or are ambivalent to behavioral change.
These patients may benefit from having structured verbal encouragement—such as motivational interviewing (MI)—incorporated into their visits. The following discussion will explain how MI can be an effective communication tool for encouraging patients with diabetes or prediabetes to make important behavioral changes and improve health outcomes.
Q What is MI?
First created by William R. Miller and Stephen Rollnick in the 1980s as a counseling method to help patients with substance use disorders, MI was eventually expanded to address other clinical challenges, including tobacco cessation, weight management, and diabetes care. MI helps patients identify their motivations and goals to improve long-term outcomes and work through any ambivalence to change. It utilizes an empathic approach with open-ended questions.5 This helps reduce the resistance frequently encountered during an average “lecture-style” interaction and facilitates a collaborative relationship that empowers the patient to make positive lifestyle changes.
MI affirms the patient’s experience while exploring any discrepancies between goals and actions. Two important components for conducting MI are (1) verbally reflecting the patient’s motivations and thoughts about change and (2) allowing the patient to “voice the arguments for change.”6 These components help the patient take ownership of the overarching goal for behavioral change and in the development of an action plan.
MI involves 4 primary processes: engaging, focusing, evoking, and planning (defined in the Table).7 MI begins with building rapport and a trusting relationship by engaging with empathic responses that reflect the patient’s concerns and focusing on what is important to him or her. The clinician should evoke the patient’s reasons and motivations for change. During the planning process, the clinician highlights the salient points of the conversation and works with the patient to identify an action he or she could take as a first step toward change.7
Table
Motivational Interviewing Processes
Engaging: Demonstrating empathy |
Focusing: Identifying what is important to the patient |
Evoking: Eliciting patient’s internal motivations for change |
Planning: Reinforcing the patient’s commitment to change |
Source: Arkowitz H, et al. Motivational Interviewing in the Treatment of Psychological Problems. 2015. 7
Continue to: Q How can I use MI with my patients with diabetes?
Q How can I use MI with my patients with diabetes?
MI can be used in a variety of clinical settings, including primary care and behavioral health, and can be effective when employed even in short periods of time.8,9 This communication style can be incorporated into regular follow-up appointments to help the clinician and the patient work toward better glycemic control and improved long-term outcomes.
For clinicians who are new users of MI, consider the mnemonic OARS (Open-ended questions, Affirmations, accurate empathic Reflections, Summarizing) to utilize the core components of MI.10 The OARS techniques are vital MI tools that can help the clinician explore the patient’s motivation for pursuing change, and they help the clinician recognize and appreciate the patient’s perspective on the challenges of initiating change.10 The following sample conversation illustrates how OARS can be used.
Open-ended question:
Clinician: What do you think are the greatest challenges when it comes to controlling your diabetes?
Patient: It’s just so frustrating, I keep avoiding bad food and trying to eat healthy, but my sugar still goes up.
Affirmations:
Clinician: Thank you for sharing that with me. It sounds like you are persistent and have been working hard to make healthier choices.
Patient: Yes, but I’m so tired of trying. It just doesn’t seem to work.
Accurate empathic reflections:
Clinician: It is important for you to control your diabetes, but you feel discouraged by the results that you’ve seen.
Patient: Yeah, I just don’t know what else to do to make my sugar better.
Continue to: Summarizing
Summarizing:
Clinician: You’ve said that controlling your blood sugar is important to you and that you’ve tried eating healthily, but it just isn’t working well enough. It sounds like you are ready to explore alternatives that might help you gain better control of the situation. Is that right?
Patient: Well, yes, it is.
Here the patient recognizes the need for help in controlling his or her diabetes, and the clinician can then move the conversation to additional treatment options, such as medication changes or support group intervention. Using OARS, the provider can focus on what is important to the patient and evaluate any discrepancies between the patient’s goals and actions.
Q Does the research support MI for patients with diabetes?
Many studies have evaluated the efficacy of MI on behavioral change and health care–related outcomes.8,11-15 Since its inception, MI has shown great promise in addictive behavior modification.16 Multiple studies also show support for its beneficial effect on weight management as well as on physical activity level, which are 2 factors strongly associated with improved outcomes in patients with prediabetes and diabetes.8,11-15,17 In a 2017 meta-analysis of MI for patients with obesity, prediabetes, and type 2 diabetes, Phillips and Guarnaccia found significant support for behavioral change leading to improvements in quantifiable medical measurements.18
Systematic reviews of MI in health care settings have produced some conflicting findings. While there is evidence for the usefulness of MI in bringing about positive lifestyle changes, data supporting the effective use of MI in specific diabetes-related outcomes (eg, A1C levels) have been less robust.8,11-15,19 However, this is a particularly challenging area of study due in part to limitations of research designs and the inherent difficulties in assuring high-quality, consistent MI approaches. Despite these limitations, MI has significant positive results in improving patient adherence to treatment regimens.9,16,20,21
Conclusion
MI is a promising method that empowers patients to make modifications to their lifestyle choices, work through ambivalence, and better align goals with actions. Although the data on patient outcomes is inconclusive, evidence suggests that MI conducted across appointments holds benefit and that it is even more effective when combined with additional nonpharmacologic techniques, such as cognitive behavioral therapy.17,22 Additionally, research suggests that MI strengthens the clinician-patient relationship, with patients reporting greater empathy from their clinicians and overall satisfaction with interactions.23 Improved communication and mutual respect in clinician-patient interactions help maintain the therapeutic alliance for the future. For additional guidance and resources on MI, visit the Motivational Interviewing Network of Trainers website at motivationalinterviewing.org.
1. CDC. About diabetes. www.cdc.gov/diabetes/basics/diabetes.html. Reviewed August 6, 2019. Accessed December 2, 2019.
2. World Health Organization. Diabetes. www.who.int/news-room/fact-sheets/detail/diabetes. Published October 3, 2018. Accessed December 2, 2019.
3. CDC. Put the brakes on diabetes complications. www.cdc.gov/features/preventing-diabetes-complications/index.html. Reviewed October 21, 2019. Accessed December 2, 2019.
4. CDC. National Diabetes Statistics Report, 2017. Atlanta, GA: Centers for Disease Control and Prevention, US Dept of Health and Human Services; 2017. www.cdc.gov/diabetes/pdfs/data/statistics/national-diabetes-statistics-report.pdf. Accessed December 2, 2019.
5. Rollnick S, Miller WR. What is motivational interviewing? Behav Cogn Psychother. 1995;23(4):325-334.
6. Miller WR, Rose GS. Toward a theory of motivational interviewing. Am Psychol. 2009;64(6):527-537.
7. Arkowitz H, Miller WR, Rollnick S, eds. Motivational Interviewing in the Treatment of Psychological Problems. 2nd ed. New York, NY: The Guilford Press; 2015.
8. VanBuskirk KA, Wetherell JL. Motivational interviewing with primary care populations: a systematic review and meta-analysis. J Behav Med. 2014;37(4):768-780.
9. Palacio A, Garay D, Langer B, et al. Motivational interviewing improves medication adherence: a systematic review and meta-analysis. J Gen Intern Med. 2016;31(8):929-940.
10. Miller WR, Rollnick S. Motivational Interviewing: Helping People Change. 3rd ed. New York, NY: The Guilford Press; 2013.
11. Armstrong MJ, Mottershead TA, Ronksley PE, et al. Motivational interviewing to improve weight loss in overweight and/or obese patients: a systematic review and meta-analysis of randomized controlled trials. Obes Rev. 2011;12(9):709-723.
12. Frost H, Campbell P, Maxwell M, et al. Effectiveness of motivational interviewing on adult behaviour change in health and social care settings: a systematic review of reviews. PLoS One. 2018;13(10):e0204890.
13. Burke BL, Arkowitz H, Menchola M. The efficacy of motivational interviewing: a meta-analysis of controlled clinical trials. J Consult Clin Psychol. 2003;71(5):843-861.
14. Rubak S, Sandbaek A, Lauritzen T, Christensen B. Motivational interviewing: a systematic review and meta-analysis. Br J Gen Pract. 2005;55(513):305-312.
15. Hardcastle S, Taylor A, Bailey M, Castle R. A randomised controlled trial on the effectiveness of a primary health care based counselling intervention on physical activity, diet and CHD risk factors. Patient Educ Couns. 2008:70(1):31-39.
16. Hettema J, Steele J, Miller WR. Motivational interviewing. Annu Rev Clin Psychol. 2005;1:91-111.
17. Morton K, Beauchamp M, Prothero A, et al. The effectiveness of motivational interviewing for health behaviour change in primary care settings: a systematic review. Health Psychol Rev. 2015;9(2):205-223.
18. Phillips AS, Guarnaccia CA. Self-determination theory and motivational interviewing interventions for type 2 diabetes prevention and treatment: a systematic review. J Health Psychol. 2017:135910531773760.
19. Mathiesen AS, Egerod I, Jensen T, et al. Psychosocial interventions for reducing diabetes distress in vulnerable people with type 2 diabetes mellitus: a systematic review and meta-analysis. Diabetes Metab Syndr Obes. 2018;12:19-33.
20. Skolasky RL, Maggard AM, Wegener ST, Riley LH 3rd. Telephone-based intervention to improve rehabilitation engagement after spinal stenosis surgery: a prospective lagged controlled trial. J Bone Joint Surg Am. 2018;100(1):21-30.
21. Schaefer MR, Kavookjian J. The impact of motivational interviewing on adherence and symptom severity in adolescents and young adults with chronic illness: a systematic review. Patient Educ Couns. 2017;100(12):2190-2199.
22. Barrett, S, Begg, S, O’Halloran, P, et al. Integrated motivational interviewing and cognitive behaviour therapy for lifestyle mediators of overweight and obesity in community-dwelling adults: a systematic review and meta-analyses. BMC Public Health. 2018;18:1160.
23. Wagoner ST, Kavookjian J. The influence of motivational interviewing on patients with inflammatory bowel disease: a systematic review of the literature. J Clin Med Res. 2017;9(8):659-666.
Clinician Reviews in partnership with
Courtney Bennett Wilke is an Assistant Professor at Florida State University College of Medicine, School of Physician Assistant Practice, Tallahassee.
Clinician Reviews in partnership with
Courtney Bennett Wilke is an Assistant Professor at Florida State University College of Medicine, School of Physician Assistant Practice, Tallahassee.
Clinician Reviews in partnership with
Courtney Bennett Wilke is an Assistant Professor at Florida State University College of Medicine, School of Physician Assistant Practice, Tallahassee.
In 2019, 30.3 million US adults were reported to have diabetes—an epidemic according to some public health experts.1,2 Even more sobering, an estimated 84.1 million (or more than 1 in 3) American adults have prediabetes.1 Diabetes is associated with multiple complications, including an increased risk for heart disease or stroke.3 In 2015, it was the seventh leading cause of death and a major cause of kidney failure, lower limb amputations, stroke, and blindness.2,4
As clinicians we often ask ourselves, “How can I help my patients become more effective managers of their diabetes, so that they can maximize their quality of life over both the short and long term?” Unfortunately, management of diabetes is fraught with difficulty, both for the provider and the patient. Medications for glycemic control can be expensive and inconvenient and can have adverse effects—all of which may lead to inconsistent adherence. Lifestyle changes—including diet, regular physical activity, exercise, and weight management—are important low-risk interventions that help patients maintain glycemic values and reduce the risk for diabetic complications. However, some patients may find it difficult to make or are ambivalent to behavioral change.
These patients may benefit from having structured verbal encouragement—such as motivational interviewing (MI)—incorporated into their visits. The following discussion will explain how MI can be an effective communication tool for encouraging patients with diabetes or prediabetes to make important behavioral changes and improve health outcomes.
Q What is MI?
First created by William R. Miller and Stephen Rollnick in the 1980s as a counseling method to help patients with substance use disorders, MI was eventually expanded to address other clinical challenges, including tobacco cessation, weight management, and diabetes care. MI helps patients identify their motivations and goals to improve long-term outcomes and work through any ambivalence to change. It utilizes an empathic approach with open-ended questions.5 This helps reduce the resistance frequently encountered during an average “lecture-style” interaction and facilitates a collaborative relationship that empowers the patient to make positive lifestyle changes.
MI affirms the patient’s experience while exploring any discrepancies between goals and actions. Two important components for conducting MI are (1) verbally reflecting the patient’s motivations and thoughts about change and (2) allowing the patient to “voice the arguments for change.”6 These components help the patient take ownership of the overarching goal for behavioral change and in the development of an action plan.
MI involves 4 primary processes: engaging, focusing, evoking, and planning (defined in the Table).7 MI begins with building rapport and a trusting relationship by engaging with empathic responses that reflect the patient’s concerns and focusing on what is important to him or her. The clinician should evoke the patient’s reasons and motivations for change. During the planning process, the clinician highlights the salient points of the conversation and works with the patient to identify an action he or she could take as a first step toward change.7
Table
Motivational Interviewing Processes
Engaging: Demonstrating empathy |
Focusing: Identifying what is important to the patient |
Evoking: Eliciting patient’s internal motivations for change |
Planning: Reinforcing the patient’s commitment to change |
Source: Arkowitz H, et al. Motivational Interviewing in the Treatment of Psychological Problems. 2015. 7
Continue to: Q How can I use MI with my patients with diabetes?
Q How can I use MI with my patients with diabetes?
MI can be used in a variety of clinical settings, including primary care and behavioral health, and can be effective when employed even in short periods of time.8,9 This communication style can be incorporated into regular follow-up appointments to help the clinician and the patient work toward better glycemic control and improved long-term outcomes.
For clinicians who are new users of MI, consider the mnemonic OARS (Open-ended questions, Affirmations, accurate empathic Reflections, Summarizing) to utilize the core components of MI.10 The OARS techniques are vital MI tools that can help the clinician explore the patient’s motivation for pursuing change, and they help the clinician recognize and appreciate the patient’s perspective on the challenges of initiating change.10 The following sample conversation illustrates how OARS can be used.
Open-ended question:
Clinician: What do you think are the greatest challenges when it comes to controlling your diabetes?
Patient: It’s just so frustrating, I keep avoiding bad food and trying to eat healthy, but my sugar still goes up.
Affirmations:
Clinician: Thank you for sharing that with me. It sounds like you are persistent and have been working hard to make healthier choices.
Patient: Yes, but I’m so tired of trying. It just doesn’t seem to work.
Accurate empathic reflections:
Clinician: It is important for you to control your diabetes, but you feel discouraged by the results that you’ve seen.
Patient: Yeah, I just don’t know what else to do to make my sugar better.
Continue to: Summarizing
Summarizing:
Clinician: You’ve said that controlling your blood sugar is important to you and that you’ve tried eating healthily, but it just isn’t working well enough. It sounds like you are ready to explore alternatives that might help you gain better control of the situation. Is that right?
Patient: Well, yes, it is.
Here the patient recognizes the need for help in controlling his or her diabetes, and the clinician can then move the conversation to additional treatment options, such as medication changes or support group intervention. Using OARS, the provider can focus on what is important to the patient and evaluate any discrepancies between the patient’s goals and actions.
Q Does the research support MI for patients with diabetes?
Many studies have evaluated the efficacy of MI on behavioral change and health care–related outcomes.8,11-15 Since its inception, MI has shown great promise in addictive behavior modification.16 Multiple studies also show support for its beneficial effect on weight management as well as on physical activity level, which are 2 factors strongly associated with improved outcomes in patients with prediabetes and diabetes.8,11-15,17 In a 2017 meta-analysis of MI for patients with obesity, prediabetes, and type 2 diabetes, Phillips and Guarnaccia found significant support for behavioral change leading to improvements in quantifiable medical measurements.18
Systematic reviews of MI in health care settings have produced some conflicting findings. While there is evidence for the usefulness of MI in bringing about positive lifestyle changes, data supporting the effective use of MI in specific diabetes-related outcomes (eg, A1C levels) have been less robust.8,11-15,19 However, this is a particularly challenging area of study due in part to limitations of research designs and the inherent difficulties in assuring high-quality, consistent MI approaches. Despite these limitations, MI has significant positive results in improving patient adherence to treatment regimens.9,16,20,21
Conclusion
MI is a promising method that empowers patients to make modifications to their lifestyle choices, work through ambivalence, and better align goals with actions. Although the data on patient outcomes is inconclusive, evidence suggests that MI conducted across appointments holds benefit and that it is even more effective when combined with additional nonpharmacologic techniques, such as cognitive behavioral therapy.17,22 Additionally, research suggests that MI strengthens the clinician-patient relationship, with patients reporting greater empathy from their clinicians and overall satisfaction with interactions.23 Improved communication and mutual respect in clinician-patient interactions help maintain the therapeutic alliance for the future. For additional guidance and resources on MI, visit the Motivational Interviewing Network of Trainers website at motivationalinterviewing.org.
1. CDC. About diabetes. www.cdc.gov/diabetes/basics/diabetes.html. Reviewed August 6, 2019. Accessed December 2, 2019.
2. World Health Organization. Diabetes. www.who.int/news-room/fact-sheets/detail/diabetes. Published October 3, 2018. Accessed December 2, 2019.
3. CDC. Put the brakes on diabetes complications. www.cdc.gov/features/preventing-diabetes-complications/index.html. Reviewed October 21, 2019. Accessed December 2, 2019.
4. CDC. National Diabetes Statistics Report, 2017. Atlanta, GA: Centers for Disease Control and Prevention, US Dept of Health and Human Services; 2017. www.cdc.gov/diabetes/pdfs/data/statistics/national-diabetes-statistics-report.pdf. Accessed December 2, 2019.
5. Rollnick S, Miller WR. What is motivational interviewing? Behav Cogn Psychother. 1995;23(4):325-334.
6. Miller WR, Rose GS. Toward a theory of motivational interviewing. Am Psychol. 2009;64(6):527-537.
7. Arkowitz H, Miller WR, Rollnick S, eds. Motivational Interviewing in the Treatment of Psychological Problems. 2nd ed. New York, NY: The Guilford Press; 2015.
8. VanBuskirk KA, Wetherell JL. Motivational interviewing with primary care populations: a systematic review and meta-analysis. J Behav Med. 2014;37(4):768-780.
9. Palacio A, Garay D, Langer B, et al. Motivational interviewing improves medication adherence: a systematic review and meta-analysis. J Gen Intern Med. 2016;31(8):929-940.
10. Miller WR, Rollnick S. Motivational Interviewing: Helping People Change. 3rd ed. New York, NY: The Guilford Press; 2013.
11. Armstrong MJ, Mottershead TA, Ronksley PE, et al. Motivational interviewing to improve weight loss in overweight and/or obese patients: a systematic review and meta-analysis of randomized controlled trials. Obes Rev. 2011;12(9):709-723.
12. Frost H, Campbell P, Maxwell M, et al. Effectiveness of motivational interviewing on adult behaviour change in health and social care settings: a systematic review of reviews. PLoS One. 2018;13(10):e0204890.
13. Burke BL, Arkowitz H, Menchola M. The efficacy of motivational interviewing: a meta-analysis of controlled clinical trials. J Consult Clin Psychol. 2003;71(5):843-861.
14. Rubak S, Sandbaek A, Lauritzen T, Christensen B. Motivational interviewing: a systematic review and meta-analysis. Br J Gen Pract. 2005;55(513):305-312.
15. Hardcastle S, Taylor A, Bailey M, Castle R. A randomised controlled trial on the effectiveness of a primary health care based counselling intervention on physical activity, diet and CHD risk factors. Patient Educ Couns. 2008:70(1):31-39.
16. Hettema J, Steele J, Miller WR. Motivational interviewing. Annu Rev Clin Psychol. 2005;1:91-111.
17. Morton K, Beauchamp M, Prothero A, et al. The effectiveness of motivational interviewing for health behaviour change in primary care settings: a systematic review. Health Psychol Rev. 2015;9(2):205-223.
18. Phillips AS, Guarnaccia CA. Self-determination theory and motivational interviewing interventions for type 2 diabetes prevention and treatment: a systematic review. J Health Psychol. 2017:135910531773760.
19. Mathiesen AS, Egerod I, Jensen T, et al. Psychosocial interventions for reducing diabetes distress in vulnerable people with type 2 diabetes mellitus: a systematic review and meta-analysis. Diabetes Metab Syndr Obes. 2018;12:19-33.
20. Skolasky RL, Maggard AM, Wegener ST, Riley LH 3rd. Telephone-based intervention to improve rehabilitation engagement after spinal stenosis surgery: a prospective lagged controlled trial. J Bone Joint Surg Am. 2018;100(1):21-30.
21. Schaefer MR, Kavookjian J. The impact of motivational interviewing on adherence and symptom severity in adolescents and young adults with chronic illness: a systematic review. Patient Educ Couns. 2017;100(12):2190-2199.
22. Barrett, S, Begg, S, O’Halloran, P, et al. Integrated motivational interviewing and cognitive behaviour therapy for lifestyle mediators of overweight and obesity in community-dwelling adults: a systematic review and meta-analyses. BMC Public Health. 2018;18:1160.
23. Wagoner ST, Kavookjian J. The influence of motivational interviewing on patients with inflammatory bowel disease: a systematic review of the literature. J Clin Med Res. 2017;9(8):659-666.
Tender Papules on the Bilateral Dorsal Hands
The Diagnosis: Interstitial Granulomatous Dermatitis
Interstitial granulomatous dermatitis (IGD) is rare, and the exact incidence is unknown, with only a few cases reported in the literature annually.1 Although IGD may arise in both children and adults, it occurs more commonly in adults, with an age of onset of 52 to 58.5 years. Interstitial granulomatous dermatitis also shows a female predominance.1
Interstitial granulomatous dermatitis may present as annular flesh-colored or erythematous to violaceous papules and plaques, or less commonly erythematous linear cordlike subcutaneous nodules (called the rope sign).1 Lesions often are asymptomatic but may be pruritic or tender. Interstitial granulomatous dermatitis has been associated with autoimmune conditions such as rheumatoid arthritis, systemic lupus erythematosus, and primary biliary cholangitis, and rarely malignancy.2 Interstitial granulomatous drug reactions can occur months to years after initiation of therapy with offending agents, and common causes include calcium channel blockers, statins, and tumor necrosis factor α inhibitors.3
Interstitial granulomatous dermatitis and palisaded neutrophilic and granulomatous dermatitis (PNGD) demonstrate overlapping clinical features and are thought to be part of the same spectrum of granulomatous dermatitis.4 Both IGD and PNGD may present with symmetric flesh-colored to erythematous papules or erythematous annular or linear plaques.5 Interstitial granulomatous dermatitis and PNGD may be differentiated through histopathologic examination.
Histopathology of IGD shows an interstitial infiltrate of epithelioid histiocytes in the dermis, often surrounding foci of degenerated collagen resembling palisading granulomas (quiz images).1 Perivascular and interstitial lymphocytic infiltrates also are present in most cases. Epidermal changes are minimal in IGD but can be associated with interstitial granulomatous drug reactions.1 There usually is no vasculitis, and mucin typically is absent, unlike granuloma annulare (GA).3,6 In comparison, histopathologic examination of PNGD shows basophilic degenerated collagen surrounded by palisades of histiocytes, neutrophils, and nuclear debris with focal areas of leukocytoclastic vasculitis and rare mucin.5
No specific treatment is recommended, and lesions may resolve without any therapy. Reported treatments include topical, intralesional, or systemic steroids; nonsteroidal anti-inflammatory drugs; methotrexate; hydroxychloroquine; and cyclosporine.6 Due to the strong association with systemic diseases, it is important to evaluate patients with IGD for autoimmune diseases and conduct age-appropriate cancer screening. Furthermore, a review of medications is warranted to assess the possibility of interstitial granulomatous drug reactions.6 In our patient, rheumatologic workup and age-appropriate cancer screenings were negative, and the rash spontaneously resolved without treatment.
Granuloma annulare presents with asymptomatic flesh-colored to erythematous papules and plaques in an annular configuration. In the localized variant of GA, plaques frequently localize to the distal extremities, especially the dorsal hands, as in our patient. Other variants include generalized GA, subcutaneous GA, and perforating GA. Mucin and a palisading or interstitial pattern of granulomatous inflammation are key features on histopathology in all subtypes of GA (Figure 1).7 Patch GA is a rare variant that presents with asymptomatic erythematous to brown patches, is associated with interstitial-type inflammation on histopathology, and can be difficult to distinguish from IGD.8 Granuloma annulare with interstitial inflammation on histology can be differentiated from IGD by the comparative lack of mucin in IGD.7
Sweet syndrome (SS) is characterized by sudden-onset, painful, erythematous plaques and/or nodules, commonly associated with fever and leukocytosis. Clinical variants of SS include pustular and bullous SS; giant cellulitis-like SS; necrotizing SS; and neutrophilic dermatosis of the dorsal hands presenting with hemorrhagic bullae, plaques, and pustules.7-9 Histopathologic examination shows dense nodular or perivascular neutrophilic infiltrate in the dermis without evidence of vasculitis (Figure 2).10 Histopathologic variants include histiocytoid, lymphocytic, subcutaneous, and cryptococcoid.9 The classic variant of SS has a bandlike, predominantly neutrophilic infiltrate with marked leukocytoclasia, which can be differentiated from the histiocytoid infiltrate of IGD.11 It has been shown that the infiltrate of the histiocytoid variant of SS is composed of myeloperoxidase-positive, immature myeloid cells rather than true histiocytes, and therefore can be differentiated from IGD.12 Lastly, all variants of SS have dermal edema, which typically is absent in IGD, and SS has no evidence of necrobiosis.
Erythema elevatum diutinum (EED) is a rare disease that presents with bilateral violaceous or erythematous to brown papules, plaques, or nodules. Lesions frequently localize to extensor surfaces, including the hands and fingers, and may be asymptomatic or associated with pruritus, burning, or tingling.13 Early EED lesions are characterized by leukocytoclastic vasculitis of the papillary and mid-dermal vessels with a perivascular neutrophilic infiltrate and perivascular fibrinoid necrosis. With older EED lesions, dermal and perivascular onion skin-like fibrosis become more prominent (Figure 3).14 The neutrophilic infiltrate, dermal fibrosis, and chronic vasculitic changes distinguish EED from IGD.
Necrobiosis lipoidica (NL) is a rare disease that presents with well-demarcated, yellow to red-brown papules and nodules most commonly localized to the bilateral lower extremities on the pretibial area. Papules and nodules evolve into plaques over time, and ulceration is common.15 On histopathology, NL primarily exhibits granulomatous inflammation with parallel palisading (Figure 4). The hallmark feature is necrobiosis--or degeneration--of collagen; the alternation of necrobiotic collagen and inflammatory infiltrate creates a layered cake-like appearance on low power.16 The clinical presentation as well as the dermal necrobiotic granuloma consisting of a large confluent area of necrobiosis centered in the superficial dermis and subcutaneous tissue of NL distinguishes it from the histiocytic infiltrate of IGD.
- Peroni A, Colato C, Schena D, et al. Interstitial granulomatous dermatitis: a distinct entity with characteristic histological and clinical pattern. Br J Dermatol. 2012;166:775-783.
- Terziroli Beretta-Piccoli B, Mainetti C, Peeters MA, et al. Cutaneous granulomatosis: a comprehensive review. Clin Rev Allergy Immunol. 2018;54:131-146.
- Rosenbach MA, Wanat KA, Reisenauer A, et al. Non-infectious granulomas. In: Bolognia J, Jorizzo JL, Schaffer JV, eds. Dermatology. 4th ed. Philadelphia, PA: Elsevier Saunders; 2018:1644-1663.
- Chu P, Connolly MK, LeBoit PE. The histopathologic spectrum of palisaded neutrophilic and granulomatous dermatitis in patients with collagen vascular disease. Arch Dermatol. 1994;130:1278-1283.
- Huizenga T, Kado JA, Pellicane B, et al. Interstitial granulomatous dermatitis and palisaded neutrophilic granulomatous dermatitis. Cutis. 2018;101:E19-E21.
- Rosenbach M, English JC 3rd. Reactive granulomatous dermatitis: a review of palisaded neutrophilic and granulomatous dermatitis, interstitial granulomatous dermatitis, interstitial granulomatous drug reaction, and a proposed reclassification. Dermatol Clin. 2015;33:373-387.
- Piette EW, Rosenbach M. Granuloma annulare: clinical and histologic variants, epidemiology, and genetics. J Am Acad Dermatol. 2016;75:457-465.
- Mutasim DF, Bridges AG. Patch granuloma annulare: clinicopathologic study of 6 patients. J Am Acad Dermatol. 2000;42:417-421.
- Nelson CA, Stephen S, Ashchyan HJ, et al. Neutrophilic dermatoses: pathogenesis, Sweet syndrome, neutrophilic eccrine hidradenitis, and Behçet disease. J Am Acad Dermatol. 2018;79:987-1006.
- Dabade TS, Davis MD. Diagnosis and treatment of the neutrophilic dermatoses (pyoderma gangrenosum, Sweet's syndrome). Dermatol Ther. 2011;24:273-284.
- Davis M, Moschella L. Neutrophilic dermatoses. In: Bolognia J, Jorizzo JL, Schaffer JV, eds. Dermatology. 4th ed. Philadelphia, PA: Elsevier Saunders; 2018:2102-2112.
- Requena L, Kutzner H, Palmedo G, et al. Histiocytoid Sweet syndrome: a dermal infiltration of immature neutrophilic granulocytes. Arch Dermatol. 2005;141:834-842.
- Gibson LE, el-Azhary RA. Erythema elevatum diutinum. Clin Dermatol. 2000;18:295-299.
- Sardiña LA, Jour G, Piliang MP, et al. Erythema elevatum diutinum a rare and poorly understood cutaneous vasculitis: a single institution experience. J Cutan Pathol. 2019;46:97-101.
- Reid SD, Ladizinski B, Lee K, et al. Update on necrobiosis lipoidica: a review of etiology, diagnosis, and treatment options. J Am Acad Dermatol. 2013;69:783-791.
- Sibbald C, Reid S, Alavi A. Necrobiosis lipoidica. Dermatol Clin. 2015;33:343-360.
The Diagnosis: Interstitial Granulomatous Dermatitis
Interstitial granulomatous dermatitis (IGD) is rare, and the exact incidence is unknown, with only a few cases reported in the literature annually.1 Although IGD may arise in both children and adults, it occurs more commonly in adults, with an age of onset of 52 to 58.5 years. Interstitial granulomatous dermatitis also shows a female predominance.1
Interstitial granulomatous dermatitis may present as annular flesh-colored or erythematous to violaceous papules and plaques, or less commonly erythematous linear cordlike subcutaneous nodules (called the rope sign).1 Lesions often are asymptomatic but may be pruritic or tender. Interstitial granulomatous dermatitis has been associated with autoimmune conditions such as rheumatoid arthritis, systemic lupus erythematosus, and primary biliary cholangitis, and rarely malignancy.2 Interstitial granulomatous drug reactions can occur months to years after initiation of therapy with offending agents, and common causes include calcium channel blockers, statins, and tumor necrosis factor α inhibitors.3
Interstitial granulomatous dermatitis and palisaded neutrophilic and granulomatous dermatitis (PNGD) demonstrate overlapping clinical features and are thought to be part of the same spectrum of granulomatous dermatitis.4 Both IGD and PNGD may present with symmetric flesh-colored to erythematous papules or erythematous annular or linear plaques.5 Interstitial granulomatous dermatitis and PNGD may be differentiated through histopathologic examination.
Histopathology of IGD shows an interstitial infiltrate of epithelioid histiocytes in the dermis, often surrounding foci of degenerated collagen resembling palisading granulomas (quiz images).1 Perivascular and interstitial lymphocytic infiltrates also are present in most cases. Epidermal changes are minimal in IGD but can be associated with interstitial granulomatous drug reactions.1 There usually is no vasculitis, and mucin typically is absent, unlike granuloma annulare (GA).3,6 In comparison, histopathologic examination of PNGD shows basophilic degenerated collagen surrounded by palisades of histiocytes, neutrophils, and nuclear debris with focal areas of leukocytoclastic vasculitis and rare mucin.5
No specific treatment is recommended, and lesions may resolve without any therapy. Reported treatments include topical, intralesional, or systemic steroids; nonsteroidal anti-inflammatory drugs; methotrexate; hydroxychloroquine; and cyclosporine.6 Due to the strong association with systemic diseases, it is important to evaluate patients with IGD for autoimmune diseases and conduct age-appropriate cancer screening. Furthermore, a review of medications is warranted to assess the possibility of interstitial granulomatous drug reactions.6 In our patient, rheumatologic workup and age-appropriate cancer screenings were negative, and the rash spontaneously resolved without treatment.
Granuloma annulare presents with asymptomatic flesh-colored to erythematous papules and plaques in an annular configuration. In the localized variant of GA, plaques frequently localize to the distal extremities, especially the dorsal hands, as in our patient. Other variants include generalized GA, subcutaneous GA, and perforating GA. Mucin and a palisading or interstitial pattern of granulomatous inflammation are key features on histopathology in all subtypes of GA (Figure 1).7 Patch GA is a rare variant that presents with asymptomatic erythematous to brown patches, is associated with interstitial-type inflammation on histopathology, and can be difficult to distinguish from IGD.8 Granuloma annulare with interstitial inflammation on histology can be differentiated from IGD by the comparative lack of mucin in IGD.7
Sweet syndrome (SS) is characterized by sudden-onset, painful, erythematous plaques and/or nodules, commonly associated with fever and leukocytosis. Clinical variants of SS include pustular and bullous SS; giant cellulitis-like SS; necrotizing SS; and neutrophilic dermatosis of the dorsal hands presenting with hemorrhagic bullae, plaques, and pustules.7-9 Histopathologic examination shows dense nodular or perivascular neutrophilic infiltrate in the dermis without evidence of vasculitis (Figure 2).10 Histopathologic variants include histiocytoid, lymphocytic, subcutaneous, and cryptococcoid.9 The classic variant of SS has a bandlike, predominantly neutrophilic infiltrate with marked leukocytoclasia, which can be differentiated from the histiocytoid infiltrate of IGD.11 It has been shown that the infiltrate of the histiocytoid variant of SS is composed of myeloperoxidase-positive, immature myeloid cells rather than true histiocytes, and therefore can be differentiated from IGD.12 Lastly, all variants of SS have dermal edema, which typically is absent in IGD, and SS has no evidence of necrobiosis.
Erythema elevatum diutinum (EED) is a rare disease that presents with bilateral violaceous or erythematous to brown papules, plaques, or nodules. Lesions frequently localize to extensor surfaces, including the hands and fingers, and may be asymptomatic or associated with pruritus, burning, or tingling.13 Early EED lesions are characterized by leukocytoclastic vasculitis of the papillary and mid-dermal vessels with a perivascular neutrophilic infiltrate and perivascular fibrinoid necrosis. With older EED lesions, dermal and perivascular onion skin-like fibrosis become more prominent (Figure 3).14 The neutrophilic infiltrate, dermal fibrosis, and chronic vasculitic changes distinguish EED from IGD.
Necrobiosis lipoidica (NL) is a rare disease that presents with well-demarcated, yellow to red-brown papules and nodules most commonly localized to the bilateral lower extremities on the pretibial area. Papules and nodules evolve into plaques over time, and ulceration is common.15 On histopathology, NL primarily exhibits granulomatous inflammation with parallel palisading (Figure 4). The hallmark feature is necrobiosis--or degeneration--of collagen; the alternation of necrobiotic collagen and inflammatory infiltrate creates a layered cake-like appearance on low power.16 The clinical presentation as well as the dermal necrobiotic granuloma consisting of a large confluent area of necrobiosis centered in the superficial dermis and subcutaneous tissue of NL distinguishes it from the histiocytic infiltrate of IGD.
- Peroni A, Colato C, Schena D, et al. Interstitial granulomatous dermatitis: a distinct entity with characteristic histological and clinical pattern. Br J Dermatol. 2012;166:775-783.
- Terziroli Beretta-Piccoli B, Mainetti C, Peeters MA, et al. Cutaneous granulomatosis: a comprehensive review. Clin Rev Allergy Immunol. 2018;54:131-146.
- Rosenbach MA, Wanat KA, Reisenauer A, et al. Non-infectious granulomas. In: Bolognia J, Jorizzo JL, Schaffer JV, eds. Dermatology. 4th ed. Philadelphia, PA: Elsevier Saunders; 2018:1644-1663.
- Chu P, Connolly MK, LeBoit PE. The histopathologic spectrum of palisaded neutrophilic and granulomatous dermatitis in patients with collagen vascular disease. Arch Dermatol. 1994;130:1278-1283.
- Huizenga T, Kado JA, Pellicane B, et al. Interstitial granulomatous dermatitis and palisaded neutrophilic granulomatous dermatitis. Cutis. 2018;101:E19-E21.
- Rosenbach M, English JC 3rd. Reactive granulomatous dermatitis: a review of palisaded neutrophilic and granulomatous dermatitis, interstitial granulomatous dermatitis, interstitial granulomatous drug reaction, and a proposed reclassification. Dermatol Clin. 2015;33:373-387.
- Piette EW, Rosenbach M. Granuloma annulare: clinical and histologic variants, epidemiology, and genetics. J Am Acad Dermatol. 2016;75:457-465.
- Mutasim DF, Bridges AG. Patch granuloma annulare: clinicopathologic study of 6 patients. J Am Acad Dermatol. 2000;42:417-421.
- Nelson CA, Stephen S, Ashchyan HJ, et al. Neutrophilic dermatoses: pathogenesis, Sweet syndrome, neutrophilic eccrine hidradenitis, and Behçet disease. J Am Acad Dermatol. 2018;79:987-1006.
- Dabade TS, Davis MD. Diagnosis and treatment of the neutrophilic dermatoses (pyoderma gangrenosum, Sweet's syndrome). Dermatol Ther. 2011;24:273-284.
- Davis M, Moschella L. Neutrophilic dermatoses. In: Bolognia J, Jorizzo JL, Schaffer JV, eds. Dermatology. 4th ed. Philadelphia, PA: Elsevier Saunders; 2018:2102-2112.
- Requena L, Kutzner H, Palmedo G, et al. Histiocytoid Sweet syndrome: a dermal infiltration of immature neutrophilic granulocytes. Arch Dermatol. 2005;141:834-842.
- Gibson LE, el-Azhary RA. Erythema elevatum diutinum. Clin Dermatol. 2000;18:295-299.
- Sardiña LA, Jour G, Piliang MP, et al. Erythema elevatum diutinum a rare and poorly understood cutaneous vasculitis: a single institution experience. J Cutan Pathol. 2019;46:97-101.
- Reid SD, Ladizinski B, Lee K, et al. Update on necrobiosis lipoidica: a review of etiology, diagnosis, and treatment options. J Am Acad Dermatol. 2013;69:783-791.
- Sibbald C, Reid S, Alavi A. Necrobiosis lipoidica. Dermatol Clin. 2015;33:343-360.
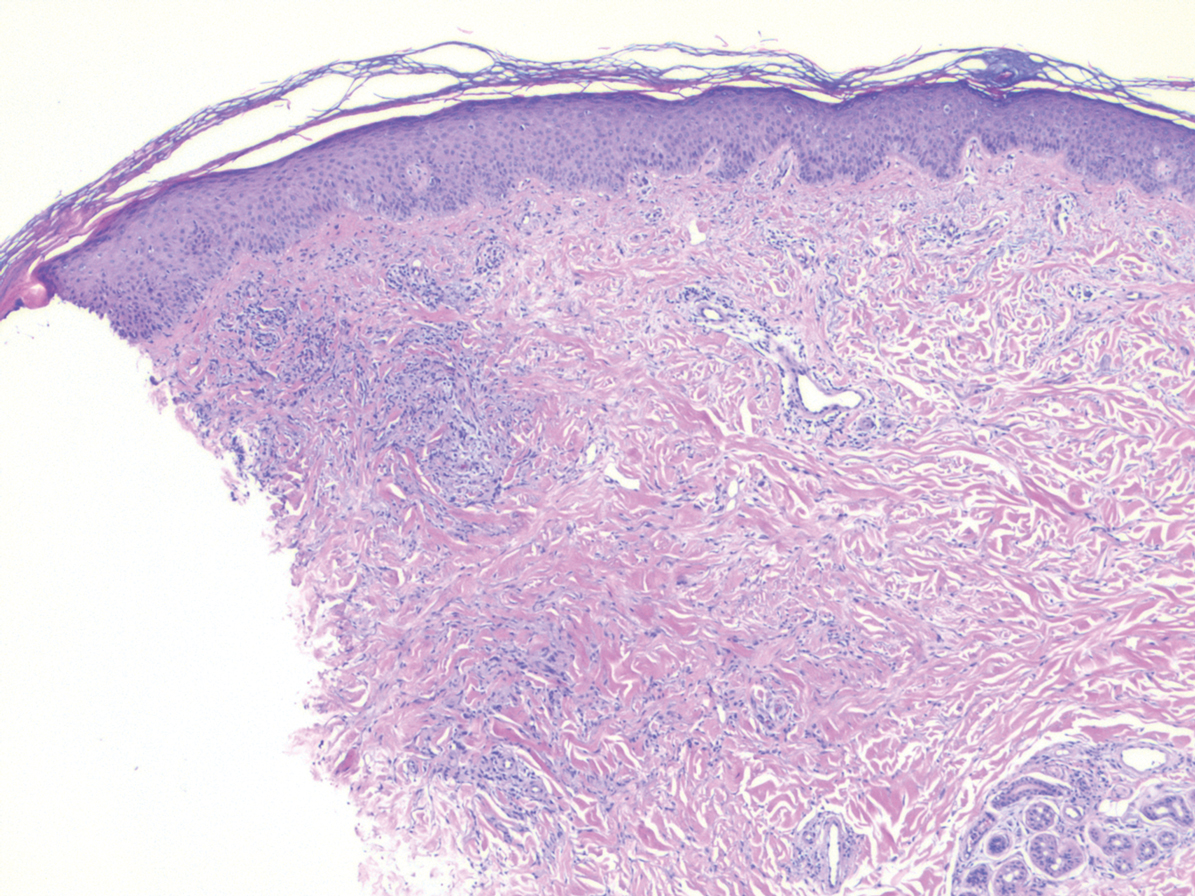
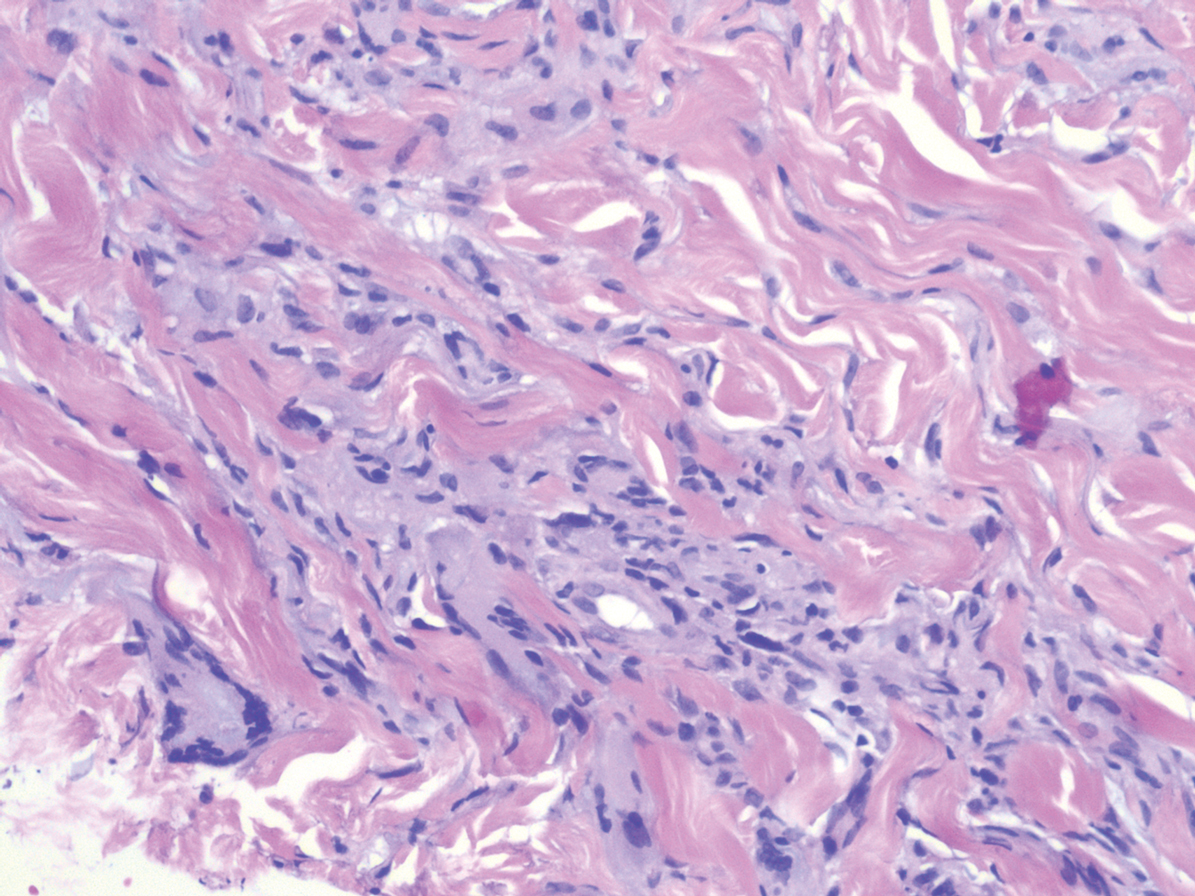
A 58-year-old woman with a medical history of asthma, hypertension, hypothyroidism, and hyperlipidemia presented with a painful rash of 10 days' duration. The rash was associated with fever at home (temperature, 38.5.2 °C), and a review of systems was positive for joint pain. Physical examination revealed numerous 8- to 10-mm, erythematous, discus-shaped papules on the bilateral dorsal hands, bilateral palms, right knee, and right dorsal foot with slight tenderness to palpation. A papule on the right dorsal hand was biopsied.
ADA2 is a potent new biomarker for macrophage activation syndrome
ATLANTA – Adenosine deaminase 2 above the upper limit of normal is 86% sensitive and 94% specific for distinguishing macrophage activation syndrome from active systemic juvenile idiopathic arthritis, making it perhaps the most potent blood marker yet identified to differentiate the two, according to a report presented at the annual meeting of the American College of Rheumatology.

The upper limit of normal was 27.8 U/L, two standard deviations above the median of 13 U/L (interquartile range, 10.6-16.1) in 174 healthy children. The work was published simultaneously in Annals of the Rheumatic Diseases.
In children with active systemic juvenile idiopathic arthritis (JIA), adenosine deaminase 2 (ADA2) “beyond the upper limit of normal is strong evidence for concomitant” macrophage activation syndrome (MAS). “Our work represents a new method to diagnose this condition,” said lead investigator Pui Y. Lee, MD, PhD, a pediatric rheumatologist at Boston Children’s Hospital.
The hope, he said, is that the finding will lead to quicker recognition and treatment of MAS, a devastating complication of systemic JIA in which rampant inflammation begets further inflammation in a downward spiral that ultimately proves fatal in about 20% of cases. The problem is that the clinical features of MAS overlap with those of active systemic JIA, which makes early diagnosis difficult.
Ferritin and other common markers are not very specific unless “the cutoff is raised significantly to distinguish MAS from general inflammation. Most labs will not tell you ‘this is an active systemic JIA range; this is an MAS-like range.’ It’s hard for them to define that for you. ADA2 is more black and white; if you go above the upper limit, you most likely have MAS,” Dr. Lee explained at the meeting.
Potentially, “we can combine this test with other tests to define a single MAS panel,” he said.
ADA2 is measured by a simple, inexpensive enzyme assay that’s been around for 20 years, but it hasn’t caught on because the protein’s function is unknown and the clinical relevance of ADA2 levels has been uncertain. With the new findings, “it is our hope that ADA2 testing will become more available,” Dr. Lee said.
The protein appears to be a product of monocytes and macrophages, and a genetic deficiency has recently been linked to congenital vasculitis, which made Dr. Lee and colleagues curious about ADA2 in other rheumatic diseases. The first step was to define normal limits in healthy controls; the 13 U/L median in children proved to be a bit higher than in 150 healthy adults.
The team then found that levels were completely normal in 25 children with active Kawasaki disease, and only mildly elevated in 13 children with systemic lupus and 13 with juvenile dermatomyositis. The Kawasaki children, in particular “were highly inflamed, so this protein is not just simply a marker of inflammation,” Dr. Lee said.
They next turned to 120 children with JIA, with a mix of systemic and nonsystemic cases. “The ones with very high levels, far beyond the upper limit of normal, were” almost exclusively the 23 children with systemic JIA and clinically diagnosed MAS. “As long as [JIA children] didn’t have MAS, their levels were pretty much close to normal,” he said.
In eight MAS children with repeat testing, levels fell below the upper limit of normal with treatment and remission, but children prone to repeat MAS seemed to hover closer to the limit even when they were well.
Blood sample testing showed that interleukin-18 and interferon-gamma were the main drivers of ADA2 expression in the periphery, “which makes sense because these two cytokines are very involved in the process of MAS,” Dr. Lee said.
The work was funded by the National Institutes of Health, among others. Dr. Lee didn’t have any disclosures.
SOURCE: Lee PY et al. Arthritis Rheumatol. 2019;71(suppl 10), Abstract 920.
ATLANTA – Adenosine deaminase 2 above the upper limit of normal is 86% sensitive and 94% specific for distinguishing macrophage activation syndrome from active systemic juvenile idiopathic arthritis, making it perhaps the most potent blood marker yet identified to differentiate the two, according to a report presented at the annual meeting of the American College of Rheumatology.
The upper limit of normal was 27.8 U/L, two standard deviations above the median of 13 U/L (interquartile range, 10.6-16.1) in 174 healthy children. The work was published simultaneously in Annals of the Rheumatic Diseases.
In children with active systemic juvenile idiopathic arthritis (JIA), adenosine deaminase 2 (ADA2) “beyond the upper limit of normal is strong evidence for concomitant” macrophage activation syndrome (MAS). “Our work represents a new method to diagnose this condition,” said lead investigator Pui Y. Lee, MD, PhD, a pediatric rheumatologist at Boston Children’s Hospital.
The hope, he said, is that the finding will lead to quicker recognition and treatment of MAS, a devastating complication of systemic JIA in which rampant inflammation begets further inflammation in a downward spiral that ultimately proves fatal in about 20% of cases. The problem is that the clinical features of MAS overlap with those of active systemic JIA, which makes early diagnosis difficult.
Ferritin and other common markers are not very specific unless “the cutoff is raised significantly to distinguish MAS from general inflammation. Most labs will not tell you ‘this is an active systemic JIA range; this is an MAS-like range.’ It’s hard for them to define that for you. ADA2 is more black and white; if you go above the upper limit, you most likely have MAS,” Dr. Lee explained at the meeting.
Potentially, “we can combine this test with other tests to define a single MAS panel,” he said.
ADA2 is measured by a simple, inexpensive enzyme assay that’s been around for 20 years, but it hasn’t caught on because the protein’s function is unknown and the clinical relevance of ADA2 levels has been uncertain. With the new findings, “it is our hope that ADA2 testing will become more available,” Dr. Lee said.
The protein appears to be a product of monocytes and macrophages, and a genetic deficiency has recently been linked to congenital vasculitis, which made Dr. Lee and colleagues curious about ADA2 in other rheumatic diseases. The first step was to define normal limits in healthy controls; the 13 U/L median in children proved to be a bit higher than in 150 healthy adults.
The team then found that levels were completely normal in 25 children with active Kawasaki disease, and only mildly elevated in 13 children with systemic lupus and 13 with juvenile dermatomyositis. The Kawasaki children, in particular “were highly inflamed, so this protein is not just simply a marker of inflammation,” Dr. Lee said.
They next turned to 120 children with JIA, with a mix of systemic and nonsystemic cases. “The ones with very high levels, far beyond the upper limit of normal, were” almost exclusively the 23 children with systemic JIA and clinically diagnosed MAS. “As long as [JIA children] didn’t have MAS, their levels were pretty much close to normal,” he said.
In eight MAS children with repeat testing, levels fell below the upper limit of normal with treatment and remission, but children prone to repeat MAS seemed to hover closer to the limit even when they were well.
Blood sample testing showed that interleukin-18 and interferon-gamma were the main drivers of ADA2 expression in the periphery, “which makes sense because these two cytokines are very involved in the process of MAS,” Dr. Lee said.
The work was funded by the National Institutes of Health, among others. Dr. Lee didn’t have any disclosures.
SOURCE: Lee PY et al. Arthritis Rheumatol. 2019;71(suppl 10), Abstract 920.
REPORTING FROM ACR 2019
Reduced kidney function linked to fractures in older women
Moderate reductions in kidney function in older women are associated with an increased short-term risk of fractures, according to a study published in Osteoporosis International.
However, the longitudinal, population-based cohort study did not find an association with fracture risk either in women older than 80 years or in those with worse kidney function.
“Since the kidneys regulate homeostasis of PTH [parathyroid hormone], phosphate, calcium, and vitamin D, any disruption in function can be expected to disturb bone remodeling and have implications for skeletal health,” wrote Linnea Malmgren, MD, and colleagues from Skåne University Hospital in Malmö, Sweden.
Previous studies have found that a large proportion of older women have reduced kidney function equivalent to a diagnosis of chronic kidney disease and that it is associated with bone loss. However, there have been few studies exploring that association in a population without a diagnosis of chronic kidney disease.
In their study, Dr. Malmgren and colleagues followed 981 women aged 75 years and 685 women aged 80 years, who underwent assessment of kidney function and bone mineral density and were followed up for fracture.
They found that women who experienced an osteoporotic fracture between the ages of 75 and 80 years had significantly lower baseline kidney function, compared with those who did not experience a fracture.
Compared with women with normal kidney function at age 75, women with intermediate kidney function (estimated glomerular filtration rate 45-59 mL/min per 1.73m2) had a significant 2.21-fold higher risk of osteoporotic fracture within 2 years, a 1.51-fold higher risk up to 5 years, and an elevated risk of hip fracture.
A similar trend was seen in women with poor kidney function (eGFR less than 45 mL/min per 1.73m2), but it was not statistically significant.
The analysis also found that kidney function at age 80 years was not significantly associated with long-term fracture risk, nor was there a significant association for 10-year fracture risk in those aged 75 years.
Reduced kidney function was also associated with a higher fracture risk even in women without osteoporosis.
“As expected, fracture risk was high among those with osteoporosis, but risk seemed to further increase in women with both osteoporosis and reduced kidney function, compared with those with osteoporosis and normal function,” the authors reported.
“These findings indicate that implications for bone health and fracture risk might occur in the very common modest reduction of kidney function in the elderly, and also possibly before a diagnosis of CKD-MBD [chronic kidney disease–mineral and bone disorder].”
The study was supported by Lund University; the Swedish Research Council; Forte, Greta and Johan Kock Foundation; A. Påhlsson Foundation; A. Osterlund Foundation; H Järnhardt Foundation; King Gustav V 80-year Fund; Thelma Zoegas Foundation; Swedish Rheumatism Foundation; Skåne University Hospital Research Fund; and the Research and Development Council of Region Skåne, Sweden. No conflicts of interest were declared.
SOURCE: Malmgren L et al. Osteoporos Int. 2019 Nov 21. doi: 10.1007/s00198-019-05152-x.
FROM OSTEOPOROSIS INTERNATIONAL
FDA panel rejects vernakalant bid for AFib cardioversion indication
for cardioversion of recent-onset atrial fibrillation (AFib).

It was the second time before an FDA advisory panel for vernakalant (Brinavess, Correvio International Sàrl), which the agency had declined to approve in 2008 due to safety concerns. That time, however, its advisors had given the agency a decidedly positive recommendation.
Since then, registry data collected for the drug’s resubmission seemed only to raise further safety issues, especially evidence that a single infusion may cause severe hypotension and suppress left ventricular function.
Some members of the Cardiovascular and Renal Drugs Advisory Committee (CRDAC), including a number who voted against approval, expressed hopes for further research aimed at identifying specific AFib patient groups who might safely benefit from vernakalant.
Of note, the drug has long been available for AFib cardioversion in Europe, where there are a number of other pharmacologic options, and was recently approved in Canada.
“We do recognize there’s a significant clinical need here,” observed Paul M. Ridker, MD, MPH, of Harvard Medical School and Brigham and Women’s Hospital Boston, a CRDAC panelist.
The results of the safety study that Correvio presented to the panel were “pretty marginal,” Dr. Ridker said. Given the negative safety signals and the available cardioversion alternatives, he questioned whether vernakalant represented a “substantial advance versus just another option. Right now, I’m not convinced it’s a substantial advance.”
FDA representatives were skeptical about vernakalant when they walked into the meeting room, as noted in briefing documents they had circulated beforehand. The drug’s safety experience under consideration included one case of ventricular arrhythmia and cardiogenic shock in a treated patient without apparent structural heart disease, who subsequently died. That case was much discussed throughout the meeting.
In its resubmission of vernakalant to regulators, Correvio also pointed to a significant unmet need for AFib cardioversion options in the United States, given the few alternatives.
For example, ibutilide is FDA-approved for recent-onset AFib or atrial flutter; but as the company and panelists noted, the drug isn’t often used for that indication. Patients with recent-onset AFib are often put on rate-control meds without cardioversion. Or clinicians may resort to electrical cardioversion, which can be logistically cumbersome and require anesthesia and generally a hospital stay.
Oral or intravenous amiodarone and oral dofetilide, flecainide, and propafenone are guideline-recommended but not actually FDA-approved for recent-onset AFib, the company noted.
Correvio made its “pre-infusion checklist” a core feature of its case. It was designed to guide selection of patients for vernakalant cardioversion based on contraindications such as a systolic blood pressure under 100 mm Hg, severe heart failure, aortic stenosis, severe bradycardia or heart block, or a prolonged QT interval.
In his presentation to the panel, FDA medical officer Preston Dunnmon, MD, said the safety results from the SPECTRUM registry, another main pillar of support for the vernakalant resubmission, “are not reassuring.”
As reasons, Dr. Dunnmon cited likely patient-selection bias and its high proportion of patients who were not prospectively enrolled; 21% were retrospectively entered from records.
Moreover, “the proposed preinfusion checklist will not reliably predict which subjects will experience serious cardiovascular adverse events with vernakalant,” he said.
“Vernakalant has induced harm that cannot be reliably predicted, prevented, or in some cases, treated. In contrast to vernakalant, electrical cardioversion and ibutilide pharmacologic cardioversion can cause adverse events, but these are transient and treatable,” he said.
Many on the panel agreed. “I thought the totality of evidence supported the hypothesis that this drug has a potential for a fatal side effect in a disease that you can live with, potentially, and that there are other treatments for,” said Julia B. Lewis, MD, Vanderbilt Medical Center, Nashville, Tenn., who chaired the CRDAC panel.
“The drug clearly converts atrial fibrillation, although it’s only transient,” observed John H. Alexander, MD, MHSc, Duke University, Durham, N.C., one of the two panelists who voted to recommend approval of vernakalant.
“And, there clearly is a serious safety signal in some populations of patients,” he agreed. “However, I was more reassured by the SPECTRUM data.” There is likely to be a low-risk group of patients for whom vernakalant could represent an important option that “outweighs the relatively low risk of serious complications,” Dr. Alexander said.
“So more work needs to be done to clarify who are the low risk patients where it would be favorable.”
Panelist Matthew Needleman, MD, Walter Reed National Military Medical Center, Bethesda, Md., also voted in favor of approval.
“We’ve all known patients with normal ejection fractions who keep coming in with symptomatic atrial fib, want to get out of it quickly, and get back to their lives. So having an option like this I think would be good for a very select group of patients,” Dr. Needleman said.
But the preinfusion checklist and other potential ways to select low-risk patients for vernakalant could potentially backfire, warned John M. Mandrola, MD, Baptist Medical Associates, Louisville, Ky., from the panel.
The FDA representatives had presented evidence that the drug can seriously depress ventricular function, and that the lower cardiac output is what leads to hypotension, he elaborated in an interview after the meeting.
If the checklist is used to exclude hemodynamically unstable patients from receiving vernakalant, he said, “Then you’re really giving this drug to relatively healthy patients for convenience, to decrease hospitalization or the hospital stay.”
The signal for substantial harm, Dr. Mandrola said, has to be balanced against that modest benefit.
Moreover, those in whom the drug doesn’t work may be left in a worse situation, he proposed. Only about half of patients are successfully converted on vernakalant, the company and FDA data suggested. The other half of patients who don’t achieve sinus rhythm on the drug still must face the significant hazards of depressed ejection fraction and hypotension, a high price to pay for an unsuccessful treatment.
Dr. Mandrola is Chief Cardiology Correspondent for theheart.org | Medscape Cardiology; his disclosure statement states no relevant financial relationships.
This article first appeared on Medscape.com.
for cardioversion of recent-onset atrial fibrillation (AFib).
It was the second time before an FDA advisory panel for vernakalant (Brinavess, Correvio International Sàrl), which the agency had declined to approve in 2008 due to safety concerns. That time, however, its advisors had given the agency a decidedly positive recommendation.
Since then, registry data collected for the drug’s resubmission seemed only to raise further safety issues, especially evidence that a single infusion may cause severe hypotension and suppress left ventricular function.
Some members of the Cardiovascular and Renal Drugs Advisory Committee (CRDAC), including a number who voted against approval, expressed hopes for further research aimed at identifying specific AFib patient groups who might safely benefit from vernakalant.
Of note, the drug has long been available for AFib cardioversion in Europe, where there are a number of other pharmacologic options, and was recently approved in Canada.
“We do recognize there’s a significant clinical need here,” observed Paul M. Ridker, MD, MPH, of Harvard Medical School and Brigham and Women’s Hospital Boston, a CRDAC panelist.
The results of the safety study that Correvio presented to the panel were “pretty marginal,” Dr. Ridker said. Given the negative safety signals and the available cardioversion alternatives, he questioned whether vernakalant represented a “substantial advance versus just another option. Right now, I’m not convinced it’s a substantial advance.”
FDA representatives were skeptical about vernakalant when they walked into the meeting room, as noted in briefing documents they had circulated beforehand. The drug’s safety experience under consideration included one case of ventricular arrhythmia and cardiogenic shock in a treated patient without apparent structural heart disease, who subsequently died. That case was much discussed throughout the meeting.
In its resubmission of vernakalant to regulators, Correvio also pointed to a significant unmet need for AFib cardioversion options in the United States, given the few alternatives.
For example, ibutilide is FDA-approved for recent-onset AFib or atrial flutter; but as the company and panelists noted, the drug isn’t often used for that indication. Patients with recent-onset AFib are often put on rate-control meds without cardioversion. Or clinicians may resort to electrical cardioversion, which can be logistically cumbersome and require anesthesia and generally a hospital stay.
Oral or intravenous amiodarone and oral dofetilide, flecainide, and propafenone are guideline-recommended but not actually FDA-approved for recent-onset AFib, the company noted.
Correvio made its “pre-infusion checklist” a core feature of its case. It was designed to guide selection of patients for vernakalant cardioversion based on contraindications such as a systolic blood pressure under 100 mm Hg, severe heart failure, aortic stenosis, severe bradycardia or heart block, or a prolonged QT interval.
In his presentation to the panel, FDA medical officer Preston Dunnmon, MD, said the safety results from the SPECTRUM registry, another main pillar of support for the vernakalant resubmission, “are not reassuring.”
As reasons, Dr. Dunnmon cited likely patient-selection bias and its high proportion of patients who were not prospectively enrolled; 21% were retrospectively entered from records.
Moreover, “the proposed preinfusion checklist will not reliably predict which subjects will experience serious cardiovascular adverse events with vernakalant,” he said.
“Vernakalant has induced harm that cannot be reliably predicted, prevented, or in some cases, treated. In contrast to vernakalant, electrical cardioversion and ibutilide pharmacologic cardioversion can cause adverse events, but these are transient and treatable,” he said.
Many on the panel agreed. “I thought the totality of evidence supported the hypothesis that this drug has a potential for a fatal side effect in a disease that you can live with, potentially, and that there are other treatments for,” said Julia B. Lewis, MD, Vanderbilt Medical Center, Nashville, Tenn., who chaired the CRDAC panel.
“The drug clearly converts atrial fibrillation, although it’s only transient,” observed John H. Alexander, MD, MHSc, Duke University, Durham, N.C., one of the two panelists who voted to recommend approval of vernakalant.
“And, there clearly is a serious safety signal in some populations of patients,” he agreed. “However, I was more reassured by the SPECTRUM data.” There is likely to be a low-risk group of patients for whom vernakalant could represent an important option that “outweighs the relatively low risk of serious complications,” Dr. Alexander said.
“So more work needs to be done to clarify who are the low risk patients where it would be favorable.”
Panelist Matthew Needleman, MD, Walter Reed National Military Medical Center, Bethesda, Md., also voted in favor of approval.
“We’ve all known patients with normal ejection fractions who keep coming in with symptomatic atrial fib, want to get out of it quickly, and get back to their lives. So having an option like this I think would be good for a very select group of patients,” Dr. Needleman said.
But the preinfusion checklist and other potential ways to select low-risk patients for vernakalant could potentially backfire, warned John M. Mandrola, MD, Baptist Medical Associates, Louisville, Ky., from the panel.
The FDA representatives had presented evidence that the drug can seriously depress ventricular function, and that the lower cardiac output is what leads to hypotension, he elaborated in an interview after the meeting.
If the checklist is used to exclude hemodynamically unstable patients from receiving vernakalant, he said, “Then you’re really giving this drug to relatively healthy patients for convenience, to decrease hospitalization or the hospital stay.”
The signal for substantial harm, Dr. Mandrola said, has to be balanced against that modest benefit.
Moreover, those in whom the drug doesn’t work may be left in a worse situation, he proposed. Only about half of patients are successfully converted on vernakalant, the company and FDA data suggested. The other half of patients who don’t achieve sinus rhythm on the drug still must face the significant hazards of depressed ejection fraction and hypotension, a high price to pay for an unsuccessful treatment.
Dr. Mandrola is Chief Cardiology Correspondent for theheart.org | Medscape Cardiology; his disclosure statement states no relevant financial relationships.
This article first appeared on Medscape.com.
Cardiac arrhythmia heightens mortality risk during epilepsy hospitalizations
BALTIMORE – Patients hospitalized for epilepsy may have higher odds of death if they have a secondary diagnosis of arrhythmia, whereas the presence of apnea alone may not significantly increase mortality, according to an analysis of data from the Nationwide Inpatient Sample presented at the annual meeting of the American Epilepsy Society.
“If you have someone with arrhythmia and epilepsy, you have to be more concerned about possible SUDEP [sudden unexpected death in epilepsy],” relative to someone with apnea and epilepsy, said senior study author Sanjay P. Singh, MD, professor of neurology at Creighton University, Omaha, Neb.
Research indicates that apnea and cardiac arrhythmias may contribute to SUDEP, and the incidence of SUDEP is higher in patients with intractable epilepsy.
To identify the prevalence of apnea, arrhythmia, and both conditions in epilepsy hospitalizations, as well as the prevalence of intractable epilepsy and mortality, Dr. Singh and colleagues performed a retrospective, cross-sectional analysis of pediatric and adult epilepsy hospitalizations between 2003 and 2014 in the Nationwide Inpatient Sample. They determined apnea and arrhythmia diagnoses using ICD-9-CM codes.
Among more than 2.6 million epilepsy hospitalizations, the prevalence of apnea was 2.75%, the prevalence of arrhythmia was 8.91%, and the prevalence of both was 0.49%. The proportion of patients with intractable epilepsy was 7.7%. Among the more than 207,000 hospitalizations with intractable epilepsy, the prevalence of apnea was 3.62%, the prevalence of arrhythmia was 3.34%, and the prevalence of both was 0.36%. The prevalence trend of apnea, arrhythmia, and both together increased between 2003 and 2014.
“In univariate analysis, prevalence of mortality was highest among patients with arrhythmia,” the researchers reported, at – 3.1% in patients with arrhythmia versus 0.48% in patients with apnea, 2.91% in patients with both, and 0.46% in patients without apnea or arrhythmia.
In a multivariable regression analysis, significant and independent predictors of death included intractable epilepsy (odds ratio, 1.17), apnea (OR, 0.84), arrhythmia (OR, 3.29), and the presence of both apnea and arrhythmia (OR, 3.24). When hospitalization was complicated by intractable epilepsy, the odds of death rose with the presence of apnea (OR, 2.07), arrhythmia (OR, 8.39), and with both apnea and arrhythmia (OR, 11.64).
The results highlight the importance of effective epilepsy management, said first author Urvish K. Patel, MBBS, also with Creighton University. “If we can stop [conversion to intractable epilepsy], then this odds ratio can go down.”
Attention to arrhythmias, as well as the combination of arrhythmias and apnea, may “be important in identifying patients at risk for SUDEP,” the authors concluded.
The researchers had no disclosures and reported receiving no outside funding for their work.
SOURCE: Patel UK et al. AES 2019, Abstract 2.140.
REPORTING FROM AES 2019
Poll: Do you agree that hormonal contraception (OCPs, progesterone-only pills, the patch, vaginal rings, and DMPA) should be offered OTC?
[polldaddy:10476065]
[polldaddy:10476065]
[polldaddy:10476065]
Tofacitinib improves disease activity in patients with polyarticular-course JIA
ATLANTA – Treatment of polyarticular-course juvenile idiopathic arthritis with tofacitinib led to significantly fewer disease flares and greater improvement in disease activity than with placebo in a phase 3, multinational, randomized, double-blind, controlled withdrawal study presented at the annual meeting of the American College of Rheumatology.

Hermine I. Brunner, MD, director of the division of rheumatology at Cincinnati Children’s Hospital Medical Center, and colleagues conducted the study in 225 patients between 2 and less than 18 years old with polyarticular-course juvenile idiopathic arthritis (pJIA; n = 184), psoriatic arthritis (PsA; n = 20), or enthesitis-related arthritis (ERA; n = 21). Patients were included if they had an inadequate response or intolerance to a disease-modifying antirheumatic drug and active disease with five or more active joints in the case of pJIA and three or more active joints in PsA or ERA.
Dr. Brunner presented results only for pJIA patients; the results for PsA and ERA patients will be assessed and presented separately.
The researchers divided their study into two sections. In the open-label portion of the study, patients received twice-daily tofacitinib (Xeljanz) at a dose of 5 mg or a weight-based lower dose in patients under 40 kg for 18 weeks. A total of 173 patients met JIA ACR30 response criteria, defined as 30% or greater improvement in three of six JIA core set variables and worsening in no more than one of the core set variables, and then were randomized in part 2 of the study to continue the same dose of tofacitinib or receive placebo until 44 weeks. Dr. Brunner noted that most patients who discontinued treatment in parts 1 and 2 did so because of insufficient clinical response rather than from adverse events.
Disease flare occurrence between 18 and 44 weeks was measured as a primary endpoint, and key secondary endpoints included JIA ACR30/50/70 response and change in Childhood Health Assessment Questionnaire Disability Index (CHAQ-DI) scores from part 2 baseline. The researchers used a “gatekeeping approach” that sequenced outcome measures in their statistical analysis to control for false positives in primary and secondary outcomes, where statistical significance could be achieved only if the previous outcome in the sequence was statistically significant.
Patients had a median age of 13 years, and most were female, white (about 87%), and between one-third and one-half of patients were based in North America. JIA disease duration was a median of about 2.5 years, C-reactive protein was about 0.3 mg/dL, and median CHAQ-DI scores were about 0.9 across tofacitinib and placebo groups. Other baseline characteristics were balanced between the two groups, Dr. Brunner said.
“Patients with polyarticular-course JIA in the open-label study experienced a rapid improvement of their disease activity from very high to moderate within 18 weeks,” Dr. Brunner said in her presentation. “[T]ofacitinib demonstrated significantly greater efficacy versus placebo in patients with polyarticular-course JIA based on occurrence of fewer flares in part 2.”
Specifically, disease flare occurred in 29.2% of patients by 44 weeks in the tofacitinib group, compared with 52.9% of patients in the placebo group (P = .0031), for an overall 54% lower risk of flare among patients receiving tofacitinib (hazard ratio, 0.459; 95% confidence interval, 0.268-0.785; P = .0037). The response rate was higher for patients receiving tofacitinib at 44 weeks when measured by JIA ACR30 (70.8% vs. 47.1% with placebo; P = .0031) or by JIA ACR50 (66.7% vs. 47.1%; P = .0166) and JIA ACR70 criteria (54.2% vs. 37.1%; P = .0387). The change in CHAQ-DI score also improved at 44 weeks to a significantly greater extent in the tofacitinib group than with placebo (–0.09 vs. 0.03; P = .0292).
“The safety profile of tofacitinib in children with JIA was comparable to what you have seen or known in the [rheumatoid arthritis] population, and no new safety risks were identified in this pediatric population,” Dr. Brunner said.
The researchers reported ties with Pfizer, which funded the study, and more than two dozen other pharmaceutical companies.
SOURCE: Brunner HI et al. Arthritis Rheumatol. 2019;71(suppl 10), Abstract L22.
ATLANTA – Treatment of polyarticular-course juvenile idiopathic arthritis with tofacitinib led to significantly fewer disease flares and greater improvement in disease activity than with placebo in a phase 3, multinational, randomized, double-blind, controlled withdrawal study presented at the annual meeting of the American College of Rheumatology.
Hermine I. Brunner, MD, director of the division of rheumatology at Cincinnati Children’s Hospital Medical Center, and colleagues conducted the study in 225 patients between 2 and less than 18 years old with polyarticular-course juvenile idiopathic arthritis (pJIA; n = 184), psoriatic arthritis (PsA; n = 20), or enthesitis-related arthritis (ERA; n = 21). Patients were included if they had an inadequate response or intolerance to a disease-modifying antirheumatic drug and active disease with five or more active joints in the case of pJIA and three or more active joints in PsA or ERA.
Dr. Brunner presented results only for pJIA patients; the results for PsA and ERA patients will be assessed and presented separately.
The researchers divided their study into two sections. In the open-label portion of the study, patients received twice-daily tofacitinib (Xeljanz) at a dose of 5 mg or a weight-based lower dose in patients under 40 kg for 18 weeks. A total of 173 patients met JIA ACR30 response criteria, defined as 30% or greater improvement in three of six JIA core set variables and worsening in no more than one of the core set variables, and then were randomized in part 2 of the study to continue the same dose of tofacitinib or receive placebo until 44 weeks. Dr. Brunner noted that most patients who discontinued treatment in parts 1 and 2 did so because of insufficient clinical response rather than from adverse events.
Disease flare occurrence between 18 and 44 weeks was measured as a primary endpoint, and key secondary endpoints included JIA ACR30/50/70 response and change in Childhood Health Assessment Questionnaire Disability Index (CHAQ-DI) scores from part 2 baseline. The researchers used a “gatekeeping approach” that sequenced outcome measures in their statistical analysis to control for false positives in primary and secondary outcomes, where statistical significance could be achieved only if the previous outcome in the sequence was statistically significant.
Patients had a median age of 13 years, and most were female, white (about 87%), and between one-third and one-half of patients were based in North America. JIA disease duration was a median of about 2.5 years, C-reactive protein was about 0.3 mg/dL, and median CHAQ-DI scores were about 0.9 across tofacitinib and placebo groups. Other baseline characteristics were balanced between the two groups, Dr. Brunner said.
“Patients with polyarticular-course JIA in the open-label study experienced a rapid improvement of their disease activity from very high to moderate within 18 weeks,” Dr. Brunner said in her presentation. “[T]ofacitinib demonstrated significantly greater efficacy versus placebo in patients with polyarticular-course JIA based on occurrence of fewer flares in part 2.”
Specifically, disease flare occurred in 29.2% of patients by 44 weeks in the tofacitinib group, compared with 52.9% of patients in the placebo group (P = .0031), for an overall 54% lower risk of flare among patients receiving tofacitinib (hazard ratio, 0.459; 95% confidence interval, 0.268-0.785; P = .0037). The response rate was higher for patients receiving tofacitinib at 44 weeks when measured by JIA ACR30 (70.8% vs. 47.1% with placebo; P = .0031) or by JIA ACR50 (66.7% vs. 47.1%; P = .0166) and JIA ACR70 criteria (54.2% vs. 37.1%; P = .0387). The change in CHAQ-DI score also improved at 44 weeks to a significantly greater extent in the tofacitinib group than with placebo (–0.09 vs. 0.03; P = .0292).
“The safety profile of tofacitinib in children with JIA was comparable to what you have seen or known in the [rheumatoid arthritis] population, and no new safety risks were identified in this pediatric population,” Dr. Brunner said.
The researchers reported ties with Pfizer, which funded the study, and more than two dozen other pharmaceutical companies.
SOURCE: Brunner HI et al. Arthritis Rheumatol. 2019;71(suppl 10), Abstract L22.
REPORTING FROM ACR 2019