User login
Smoking impairs cognition and shrinks brain volume in MS
STOCKHOLM – Ebtesam Alshehri, MD, said at the annual congress of the European Committee for Treatment and Research in Multiple Sclerosis.

“We found that smokers have reduced Processing Speed Test scores compared with nonsmokers. They also have more brain atrophy. And we found that former smokers had intermediate results between current smokers and never smokers, suggesting that there is a benefit of smoking cessation early in the course of the disease,” explained Dr. Alshehri, a clinical neuroimmunology fellow at the Cleveland Clinic.
Dr. Alshehri and colleagues presented a cross-sectional study of 997 patients with MS. At the Cleveland Clinic, patients with MS routinely undergo the Processing Speed Test (PST) – an electronic version of the Symbol Digit Modalities Test – at each clinical visit as a means of assessing cognitive function. All 997 patients also underwent quantitative brain MRI within 90 days of their cognitive function test. The study population consisted of 520 never smokers, 335 ex-smokers, and 142 current smokers. Seventy-seven percent of the patients had relapsing-remitting MS, and most of the rest had progressive disease.
The impetus for this hypothesis-generating study was a recognition that while smoking has previously been reported to be a risk factor for MS and has also been associated with accelerated progression of disability in patients who already have the disease, the impact of smoking on cognition and brain atrophy in the MS population has been a murky area, according to Dr. Alshehri.
In a multivariate analysis adjusted for age, disease duration, and disease course, smoking status was an independent predictor of PST score. Former smokers scored an average of 3.6 points lower than never smokers, and current smokers scored 5.9 points lower than the never smokers. Similarly, former smokers appeared better off than current smokers in terms of brain atrophy as measured by whole brain function on MRI: The ex-smokers had significantly greater brain atrophy than that of never smokers, an effect that was magnified in current smokers.
For Dr. Alshehri, these findings contain an important message for physicians: “I think as clinicians we should ask our patients with MS about tobacco use at each visit, remind patients about the risks of smoking and the negative impact not only on their general health, but also the impact on disease progression and disability worsening, encourage patients to stop smoking, and provide them with this encouraging data.”
She reported having no financial conflicts regarding this study, which was conducted free of commercial support.
STOCKHOLM – Ebtesam Alshehri, MD, said at the annual congress of the European Committee for Treatment and Research in Multiple Sclerosis.
“We found that smokers have reduced Processing Speed Test scores compared with nonsmokers. They also have more brain atrophy. And we found that former smokers had intermediate results between current smokers and never smokers, suggesting that there is a benefit of smoking cessation early in the course of the disease,” explained Dr. Alshehri, a clinical neuroimmunology fellow at the Cleveland Clinic.
Dr. Alshehri and colleagues presented a cross-sectional study of 997 patients with MS. At the Cleveland Clinic, patients with MS routinely undergo the Processing Speed Test (PST) – an electronic version of the Symbol Digit Modalities Test – at each clinical visit as a means of assessing cognitive function. All 997 patients also underwent quantitative brain MRI within 90 days of their cognitive function test. The study population consisted of 520 never smokers, 335 ex-smokers, and 142 current smokers. Seventy-seven percent of the patients had relapsing-remitting MS, and most of the rest had progressive disease.
The impetus for this hypothesis-generating study was a recognition that while smoking has previously been reported to be a risk factor for MS and has also been associated with accelerated progression of disability in patients who already have the disease, the impact of smoking on cognition and brain atrophy in the MS population has been a murky area, according to Dr. Alshehri.
In a multivariate analysis adjusted for age, disease duration, and disease course, smoking status was an independent predictor of PST score. Former smokers scored an average of 3.6 points lower than never smokers, and current smokers scored 5.9 points lower than the never smokers. Similarly, former smokers appeared better off than current smokers in terms of brain atrophy as measured by whole brain function on MRI: The ex-smokers had significantly greater brain atrophy than that of never smokers, an effect that was magnified in current smokers.
For Dr. Alshehri, these findings contain an important message for physicians: “I think as clinicians we should ask our patients with MS about tobacco use at each visit, remind patients about the risks of smoking and the negative impact not only on their general health, but also the impact on disease progression and disability worsening, encourage patients to stop smoking, and provide them with this encouraging data.”
She reported having no financial conflicts regarding this study, which was conducted free of commercial support.
REPORTING FROM ECTRIMS 2019
Vaping-linked injuries top 1,600 cases
according to the latest update provided by the Centers for Disease Control and Prevention. Thirty-four deaths have been confirmed.
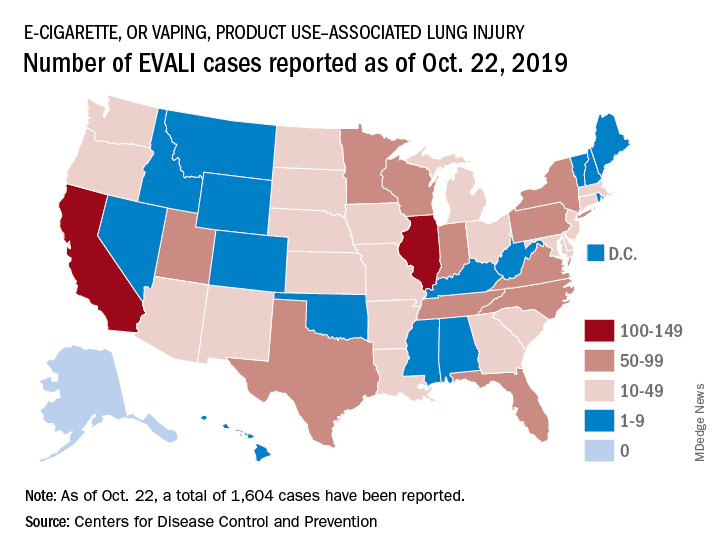
E-cigarette–linked lung injuries, now called EVALI, occurred in all U.S. states (except Alaska), the District of Columbia, and the U.S. Virgin Islands. Deaths have occurred in 24 states: Alabama, California (3), Connecticut, Delaware, Florida, Georgia (2), Illinois (2), Indiana (3), Kansas (2), Massachusetts, Michigan, Minnesota (3), Mississippi, Missouri, Montana, Nebraska, New Jersey, New York, Oregon (2), Pennsylvania, Tennessee, Texas, Utah, and Virginia. More deaths are under investigation.
The median age of deceased patients was 49 years and ranged from 17 to 75 years.
Data on age, sex, and substances used in e-cigarette, or vaping, products will be updated in the Morbidity and Mortality Weekly Report (MMWR) report being released on Friday, Oct. 25, 2019.
The CDC is now doing additional testing on available samples for chemical in the bronchoalveolar lavage fluid, blood, or urine, as well as lung biopsy or autopsy specimens. It also is validating methods for aerosol emission testing of case-associated product samples from vaping products and e-liquids.
For more information and resources visit For the Public, For Healthcare Providers, and For State and Local Health Departments pages, as well as the CDC’s Publications and Resources page.
according to the latest update provided by the Centers for Disease Control and Prevention. Thirty-four deaths have been confirmed.
E-cigarette–linked lung injuries, now called EVALI, occurred in all U.S. states (except Alaska), the District of Columbia, and the U.S. Virgin Islands. Deaths have occurred in 24 states: Alabama, California (3), Connecticut, Delaware, Florida, Georgia (2), Illinois (2), Indiana (3), Kansas (2), Massachusetts, Michigan, Minnesota (3), Mississippi, Missouri, Montana, Nebraska, New Jersey, New York, Oregon (2), Pennsylvania, Tennessee, Texas, Utah, and Virginia. More deaths are under investigation.
The median age of deceased patients was 49 years and ranged from 17 to 75 years.
Data on age, sex, and substances used in e-cigarette, or vaping, products will be updated in the Morbidity and Mortality Weekly Report (MMWR) report being released on Friday, Oct. 25, 2019.
The CDC is now doing additional testing on available samples for chemical in the bronchoalveolar lavage fluid, blood, or urine, as well as lung biopsy or autopsy specimens. It also is validating methods for aerosol emission testing of case-associated product samples from vaping products and e-liquids.
For more information and resources visit For the Public, For Healthcare Providers, and For State and Local Health Departments pages, as well as the CDC’s Publications and Resources page.
REPORTING FROM THE CDC
SEER analysis reveals medication adherence factors in newly diagnosed myeloma
Black race, polypharmacy, and increasing age were associated with poor adherence to lenalidomide in older patients with newly-diagnosed multiple myeloma, according to an analysis of Surveillance, Epidemiology, and End Results (SEER)–Medicare linked data.

The objective of the study was to examine factors affecting adherence in older adults who received lenalidomide.
Of 793 patients diagnosed and treated between 2007 and 2014, 302 (38%) had poor adherence to lenalidomide, reported Hira Mian, MD, of McMaster University, Hamilton, Ont., and colleagues. The findings were published in Clinical Lymphoma, Myeloma & Leukemia.
The researchers studied patients 65 years and older who had received at least two lenalidomide prescriptions in the first year following diagnosis. Only patients who filled a prescription for lenalidomide within 60 days of a myeloma diagnosis were included.
The median age of the patients was 73 years; 43% were aged 75 years or older. Most of the patients included in the analysis were white.
The medication possession ratio, defined as the “ratio of the number of days the patient had pills in their possession to the number of days in the observation period,” was used to evaluate adherence to therapy. A ratio of less than 90% was deemed poor adherence by the researchers.
After analysis, the researchers found that black race (adjusted odds ratio, 1.72; P = .022), polypharmacy (aOR, 1.04 per drug; P = .008), and increasing age (aOR, 1.03 per year; P = .024) were all significantly associated with poor adherence to lenalidomide.
The mean medication possession ratio among study patients was 89.5%. Overall, 38% of patients in the study had poor adherence to lenalidomide, while just 7% of patients in the study had a medication possession ratio of 100%, indicating “perfect adherence.”
There was a trend toward inferior overall survival among patients with poor adherence to lenalidomide, but it was not statistically significant (hazard ratio 1.10, 95% confidence interval, 0.88-1.38).
“Our study emphasizes the need for both better clinical monitoring of adherence and for future prospective studies in accurately understanding the rates and predictors of adherence while simultaneously developing strategies for improving adherence for patients that are at high risk of nonadherence,” the researchers wrote.
The National Institutes of Health funded the study. No conflicts of interest were reported.
SOURCE: Mian H et al. Clin Lymphoma Myeloma Leuk. 2019 Oct 9. doi: 10.1016/j.clml.2019.09.618.
Black race, polypharmacy, and increasing age were associated with poor adherence to lenalidomide in older patients with newly-diagnosed multiple myeloma, according to an analysis of Surveillance, Epidemiology, and End Results (SEER)–Medicare linked data.
The objective of the study was to examine factors affecting adherence in older adults who received lenalidomide.
Of 793 patients diagnosed and treated between 2007 and 2014, 302 (38%) had poor adherence to lenalidomide, reported Hira Mian, MD, of McMaster University, Hamilton, Ont., and colleagues. The findings were published in Clinical Lymphoma, Myeloma & Leukemia.
The researchers studied patients 65 years and older who had received at least two lenalidomide prescriptions in the first year following diagnosis. Only patients who filled a prescription for lenalidomide within 60 days of a myeloma diagnosis were included.
The median age of the patients was 73 years; 43% were aged 75 years or older. Most of the patients included in the analysis were white.
The medication possession ratio, defined as the “ratio of the number of days the patient had pills in their possession to the number of days in the observation period,” was used to evaluate adherence to therapy. A ratio of less than 90% was deemed poor adherence by the researchers.
After analysis, the researchers found that black race (adjusted odds ratio, 1.72; P = .022), polypharmacy (aOR, 1.04 per drug; P = .008), and increasing age (aOR, 1.03 per year; P = .024) were all significantly associated with poor adherence to lenalidomide.
The mean medication possession ratio among study patients was 89.5%. Overall, 38% of patients in the study had poor adherence to lenalidomide, while just 7% of patients in the study had a medication possession ratio of 100%, indicating “perfect adherence.”
There was a trend toward inferior overall survival among patients with poor adherence to lenalidomide, but it was not statistically significant (hazard ratio 1.10, 95% confidence interval, 0.88-1.38).
“Our study emphasizes the need for both better clinical monitoring of adherence and for future prospective studies in accurately understanding the rates and predictors of adherence while simultaneously developing strategies for improving adherence for patients that are at high risk of nonadherence,” the researchers wrote.
The National Institutes of Health funded the study. No conflicts of interest were reported.
SOURCE: Mian H et al. Clin Lymphoma Myeloma Leuk. 2019 Oct 9. doi: 10.1016/j.clml.2019.09.618.
FROM CLINICAL LYMPHOMA, MYELOMA & LEUKEMIA
ACIP approves 2020 adult vaccination schedule
The Centers for Disease Control and Prevention’s Advisory Committee on Immunization Practices voted unanimously to approve the adult immunization schedule for 2020, although some fine-tuning may occur before publication.

“Some of the wordsmithing may be done later,” ACIP executive secretary Amanda Cohn, MD, said at the ACIP October meeting.
Key updates to the schedule included a change in wording for the definition of the red bars on the table to include “not recommended or contraindicated” instead of only the word “contraindicated.” Committee members were especially interested in changing this wording to guide clinicians in use of the live attenuated influenza vaccine because of its potential value in vaccinating health care personnel.
Other updates include language that vaccination of adolescents and young adults aged 16-23 years who are not at increased risk for meningococcal disease should be vaccinated as follows: “Based on shared clinical decision making, 2-dose series MenB-4C at least 1 month apart or 2-dose series MenB-FHbp at 0, 6 months.”
Similarly, clinical decision-making language was added to the notes for the pneumococcal polysaccharide vaccine (PPSV23) and the 13-valent pneumococcal conjugate vaccine (PCV13).
The routine vaccination calls for only one dose of PPSV23 given on or after the individual’s 65th birthday. Then, based on shared clinical decision making, a dose of PCV13 is recommended for immunocompetent individuals aged 65 years and older. The notes also state that, based on shared clinical decision making, PCV13 and PPSV23 should not be given in the same visit and, if both will be given, PCV13 should be first and should be given 1 year before PPSV23. In addition, “PPSV23 should be given at least 5 years after any previous PPSV23 dose.”
The schedule also adds shared clinical decision making to the notes on human papillomavirus vaccination for adults aged 27-45 years.
The committee members acknowledged the increasing complexity of the adult vaccination schedule, but several members agreed that it is accessible to many clinicians.
“We can’t let the perfect be the enemy of the good” said Jason Goldman, MD, liaison representing the American College of Physicians. “Those who want to learn the schedule will learn it; the health system will learn it,” even if not every specialist does.
The table “is something to draw you in,” said Sandra Fryhofer, MD, an internist who is liaison for the American Medical Association. The notes provide more details.
More specific information about contraindications for patients with cochlear implants, which also came up in the discussion, may be added to the schedule at a later date.
View the current adult vaccination schedule here.
The ACIP members had no financial conflicts to disclose.
The Centers for Disease Control and Prevention’s Advisory Committee on Immunization Practices voted unanimously to approve the adult immunization schedule for 2020, although some fine-tuning may occur before publication.
“Some of the wordsmithing may be done later,” ACIP executive secretary Amanda Cohn, MD, said at the ACIP October meeting.
Key updates to the schedule included a change in wording for the definition of the red bars on the table to include “not recommended or contraindicated” instead of only the word “contraindicated.” Committee members were especially interested in changing this wording to guide clinicians in use of the live attenuated influenza vaccine because of its potential value in vaccinating health care personnel.
Other updates include language that vaccination of adolescents and young adults aged 16-23 years who are not at increased risk for meningococcal disease should be vaccinated as follows: “Based on shared clinical decision making, 2-dose series MenB-4C at least 1 month apart or 2-dose series MenB-FHbp at 0, 6 months.”
Similarly, clinical decision-making language was added to the notes for the pneumococcal polysaccharide vaccine (PPSV23) and the 13-valent pneumococcal conjugate vaccine (PCV13).
The routine vaccination calls for only one dose of PPSV23 given on or after the individual’s 65th birthday. Then, based on shared clinical decision making, a dose of PCV13 is recommended for immunocompetent individuals aged 65 years and older. The notes also state that, based on shared clinical decision making, PCV13 and PPSV23 should not be given in the same visit and, if both will be given, PCV13 should be first and should be given 1 year before PPSV23. In addition, “PPSV23 should be given at least 5 years after any previous PPSV23 dose.”
The schedule also adds shared clinical decision making to the notes on human papillomavirus vaccination for adults aged 27-45 years.
The committee members acknowledged the increasing complexity of the adult vaccination schedule, but several members agreed that it is accessible to many clinicians.
“We can’t let the perfect be the enemy of the good” said Jason Goldman, MD, liaison representing the American College of Physicians. “Those who want to learn the schedule will learn it; the health system will learn it,” even if not every specialist does.
The table “is something to draw you in,” said Sandra Fryhofer, MD, an internist who is liaison for the American Medical Association. The notes provide more details.
More specific information about contraindications for patients with cochlear implants, which also came up in the discussion, may be added to the schedule at a later date.
View the current adult vaccination schedule here.
The ACIP members had no financial conflicts to disclose.
Policy help needed as rheumatology drug prices continue to rise
Rheumatology drugs, like most drugs, are seeing significant price hikes in recent years and, according to a new analysis, those hikes account for the majority of growth in spending.
From 2012 to 2016, annual spending on public-payer claims for 10 biologic disease-modifying antirheumatic drugs (bDMARDs) more than doubled (from $3.8 billion to $8.6 billion), with median drug price increases of 51% in the Medicare Part D prescription drug plans (mean, 54%) and 8% within Medicare Part B drugs administered within the physician office (mean, 21%).
“The prominent bDMARD drug cost increases observed in this study, which were substantially greater under Part D than Part B, even when accounting for rebates, represent a growing burden to taxpayers and beneficiaries,” first author Natalie McCormick, PhD, a research fellow at Massachusetts General Hospital, Boston, and colleagues wrote in Arthritis & Rheumatology.
“The magnitude of these increases is independent from any assessment of value,” the authors continued.
Dr. McCormick and colleagues highlighted the limited effect that rebates negotiated by pharmacy benefit managers (PBMs) for Part D have on patient out-of-pocket costs.
Negotiations “may not necessarily result in lower price increases since pharmacy benefit managers, who negotiate on behalf of Part D plans, retain a percentage of the negotiated rebates as compensation, and higher list prices can achieve higher rebates,” they stated. “While these rebates accrue to insurance plans and pharmacy benefit managers, they do not directly impact Part D beneficiaries’ out-of-pocket costs, which are driven by prerebate prices. Thus, many patients end up paying higher out-of-pocket costs when the list price increases, creating financial barriers to use and adherence.”
They further noted that, for most Part D drugs individually, “drug prices accounted for approximately 50% or more of the increase in spending. Adalimumab and etanercept, two of the oldest bDMARDs, were prescribed to the largest number of Part D beneficiaries (more than 47,000 in 2016) and had the biggest 5-year price increases: 84% and 88%, respectively (72% and 75% respectively, accounting for rebates).”
It is not surprising that the analysis found that prices are rising and are a driving force in spending.
“We know that high launch prices of a new drug is an important consideration for patient access,” Jeromie Ballreich, PhD, a health economist at Johns Hopkins University, Baltimore, said in an interview. “But we also know that a number of these drugs, particularly Humira and Enbrel, have been on the market for a while. They have experienced a tremendous price increase over the past 10 years plus. That’s exactly what the authors found. So that is really not surprising. Analysis of drug spending changes over the time [shows that] it is indeed price increases that really have been driving increases in drug spending.”
Angus Worthing, MD, a rheumatologist at Arthritis & Rheumatism Associates in Washington, D.C., and current chair of the American College of Rheumatology’s Government Affairs Committee, said that the faster price hikes in Part D stood out in the analysis and the role PBMs played in it.
“I was a little surprised at just how much more PBMs were responsible for higher inflation, compared to the part B system,” he said in an interview. “In the McCormick article, drug prices went up 45% after rebates in the Part D space, but only 21% in the Part B space, and we had seen hints that drug prices were going up faster, we just didn’t know just how much faster, so more than double the increase is more than I expected, and it is very concerning to look at that and realize that PBMs are more than doubling an already high inflation rate in drug prices.”
He suggested that part of the rise in Part D bDMARD prices observed in the study might be because of the application of step therapy in Part D.
“In Medicare specifically, step therapy is allowed in Part D but not in Part B – except in Medicare Advantage plans starting in 2019 – and this important difference between Part B and Part D explains how Part D rebates, linked with step therapy, may be the main reason that bDMARD prices rose more in Part D compared to the open formulary system in Medicare Part B,” Dr. Worthing wrote in an editorial on Dr. McCormick’s study.
The Pharmaceutical Care Management Association, the lobby group representing PBMs, declined an interview request, but challenged the analysis’ portrayal of the role of PBMs in an email. It pointed to a Government Accountability Organization report from July 2019 that found that Part D rebates helped offset spending by about 20% and that PBM compensation was primarily derived from administrative fees and not from maintaining a portion of rebates that the PBM negotiated on behalf of the plan.
Dr. Worthing said in an interview that these bDMARD price hikes are causing access issues, particularly in Medicare where beneficiaries cannot take advantage of manufacturer programs, such as discount cards and copay coupons, and potentially face coinsurance payments based on the list price and not the net-of-rebate price.
From a policy standpoint, he advocated for a cap on out-of-pocket spending for Medicare Part D drugs, which is a feature of legislation (H.R. 3, Lower Drug Costs Now Act of 2019) that is moving through the House of Representatives, most recently passing the House Ways and Means Committee in a party-line vote of 24-17, with 1 Democrat not voting.
Dr. Worthing’s editorial covers a few other policy options, including more financial transparency in the role PBMs play in the drug supply chain, the elimination of rebates in favor of a flat fee for PBMs or requiring all rebates on drugs to be passed through to Part D beneficiaries, penalties on manufacturers for price increases that exceed inflation, and usage of a price index based on what foreign countries pay for the same drug.
Many of the suggestions from Dr. Worthing’s editorial are in H.R. 3 and face an uphill battle to get through the Senate.
Dr. Worthing said that tackling the rebate issue by removing incentives for manufacturers to raise prices in order to offer higher rebates and changing step-therapy rules are things Congress could probably get accomplished as it heads into an election year, but there is a chance it could be even more comprehensive.
“With such an important issue like high drug prices, it probably benefits both parties, and everybody facing an election will be able to go back to their constituents and say, ‘Look we got something done. I was part of this,’ and there is a better chance they will do it if they hear about it from their constituents,” he said.
Dr. Ballreich was less optimistic that H.R. 3 is going to be able to survive.
“The interesting thing with this bill is that a number of pieces of it have been endorsed by President Trump, and the question is, [is] that a meaningful endorsement? Is the Trump administration going to want to use the this plan as a win for him, as a win for showing potential voters that he can work in a bipartisan way, [that] he could take on ‘big drug companies’ – all those successful soundbites? Can then Trump use his power to push this bill through the Senate? I think that is a question mark,” he said, noting that it could take a lot of political capital to counter the powerful industry lobby. Ultimately, he expects that, if drug pricing does make it to the White House, it will go through some changes from where H.R. 3 is right now.
“I don’t think it will pass in its current iteration,” he said.
Each author of Dr. McCormick’s report had funding from different sources, though the funders had no role in the design and conduct of the study. No other disclosures were made.
SOURCES: McCormick N et al. Arthritis Rheumatol. 2019 Oct 14. doi: 10.1002/ART.41138; Worthing A. Arthritis Rheumatol. 2019 Oct 14. doi: 10.1002/art.41135.
FROM ARTHRITIS & RHEUMATOLOGY
Strong showing for TAVR after 5 years in PARTNER 2A
SAN FRANCISCO – At 5 years, the rates of disabling stroke or death were similar among patients with severe aortic stenosis and intermediate surgical risk who underwent transcatheter aortic valve replacement or surgical aortic valve replacement.
At the same time, patients who underwent TAVR using a transthoracic approach had poorer outcomes, compared with their counterparts who underwent SAVR, Vinod H. Thourani, MD, reported at the Transcatheter Cardiovascular Therapeutics annual meeting. The findings come from an analysis of the PARTNER 2A trial, the largest randomized study ever conducted in the field of TAVR and SAVR.
In an effort to compare the key clinical outcomes, bioprosthetic valve function, and quality-of-life measures at 5 years for TAVR versus surgery, Dr. Thourani and his colleagues used data from 2,032 intermediate-risk patients with severe AS assigned to either TAVR or SAVR at 57 centers in the PARTNER 2A trial. Their mean age was 82 years, and their average Society of Thoracic Surgery risk score was 5.8%. The 2-year primary endpoint was all-cause death or disabling stroke in the intention-to-treat (ITT) population. At 5 years, the researchers analyzed all primary and secondary clinical and echo endpoints in both ITT and prespecified as-treated populations.
At 5 years, the primary endpoint of death and disabling stroke at 5 years was 47.9% in the TAVR group and 43.4% in the surgery group, a difference that did not reach statistical significance (hazard ratio, 1.09; P = .21). In the transfemoral cohort, rates of the primary endpoint were also similar between TAVR and SAVR (44.5% vs. 42%, respectively; HR, 1.02; P = .80). In the transthoracic cohort, however, the researchers observed a divergence in the primary outcome starting at year 1, such that it was higher with TAVR at 5 years, compared with SAVR (59.3% vs. 48.3%; P = .03), reported Dr. Thourani, chair of cardiac surgery at Medstar Heart and Vascular Institute, Washington.
When he and his colleagues examined freedom from aortic valve reintervention at 5 years, the hazard ratios showed some difference between TAVR and SAVR (HR, 3.93; P = .003), yet clinically the freedom from reintervention rate was very high (96.8% vs. 99.4%, respectively). “The other issue we’ve been interested in is the difference between mean aortic valve gradients between the groups,” Dr. Thourani said at the meeting. “There was no difference in mean aortic valve gradients between TAVR and SAVR at 5 years (a mean of 11.4 mm Hg vs. 10.8 mm Hg, respectively; P = .23).”
Paravalvular regurgitation (PVR) was more common in the TAVR vs. SAVR group at all follow-up times (P less than .001 in all categories). By year 5, the proportion of patients with moderate to severe PVR was 6.5% in the TAVR group vs. 0.4% in the SAVR group, respectively, while the proportion of those with mild PVR was 26.8%, compared with 5.9%.
In other findings, no difference in mortality was seen in the TAVR cohort between those with mild PVR and no or trace PVR (48.7% vs. 41.1%; P = .07). However, those with moderate to severe PVR at the end of the procedure had an increased mortality at the end of 5 years (64.8%; P = .007). “If you had none or trace PVR at baseline, there was no major difference in mortality between the two groups at 2 years,” Dr. Thourani said. “That difference was maintained at 5 years.”
The overall findings, he continued, support the notion that TAVR should be considered as an alternative to surgery in intermediate-risk patients with severe aortic stenosis. “However, in patients without acceptable transfemoral access, surgery may be the preferred alternative,” he said.
Roxana Mehran, MD,, director of interventional cardiovascular research and clinical trials at Mount Sinai School of Medicine, New York, commented that the reassurance of the same outcomes at 5 years between the two approaches “makes TAVR superior. It’s a less invasive and durable result. One of the things we have yet to figure out is the need for anticoagulation to prevent stroke in these patients. We have very little data and understanding about that.”
The PARTNER 2A study was funded by Edwards Lifesciences. Dr. Thourani has received grant or research support from and participation in steering committees for Edwards Lifesciences, Abbott Vascular, Boston Scientific, Gore Vascular, JenaValve, and Cryolife.
AT TCT 2019
Skin changes on abdomen

The FP suspected that the child had morphea because the skin was somewhat firm and thickened, and there was hypo- and hyperpigmentation.
Morphea is a localized type of scleroderma and may be seen in children. Fortunately, it does not involve the internal organs. There are no blood tests needed for the diagnosis and antinuclear antibodies should be normal. While a punch biopsy could be considered in less obvious cases in older children, it is probably unnecessary to put a 5-year-old child through the trauma of a biopsy.
The FP referred the child to a dermatologist to confirm the diagnosis and initiate treatment. Typical treatments include topical mid- to high-potency steroids and/or topical calcineurin inhibitors.
Photos and text for Photo Rounds Friday courtesy of Richard P. Usatine, MD. This case was adapted from: Mayeaux EJ, Usatine R. Scleroderma and morphea. In: Usatine R, Smith M, Mayeaux EJ, Chumley H. eds. Color Atlas and Synopsis of Family Medicine, 3rd Edition. New York, NY: McGraw-Hill; 2019:1204-1212.
To learn more about the newest 3rd edition of the Color Atlas and Synopsis of Family Medicine, see: https://www.amazon.com/Color-Atlas-Synopsis-Family-Medicine/dp/1259862046/
You can get the 3rd edition of the Color Atlas and Synopsis of Family Medicine as an app by clicking on this link: https://usatinemedia.com/app/color-atlas-of-family-medicine/

Stereotactic body radiation therapy safe, effective for moderately central NSCLC
Trial success with a stereotactic body radiation therapy (SBRT) regimen for centrally located non–small cell lung cancer (NSCLC) can be largely replicated in real-world practice, suggests a prospective cohort study published in Clinical Oncology.
The Radiation Therapy Oncology Group (RTOG) 0813 trial established the safety and efficacy of 50 Gy or 60 Gy given in five fractions to patients with early-stage central NSCLC (J Clin Oncol. 2019;37:1316-25). But whether similar outcomes can be achieved in routine care and how the degree of tumor centrality affects outcomes remain unclear.
Investigators led by Robert Rulach, MBChB, from the Beatson West of Scotland Cancer Centre, Glasgow, analyzed outcomes for 50 patients treated with the regimen of 50-Gy in five fractions at their institution for T1-2N0M0 stage NSCLC. All had tumors that were moderately central (within 2 cm of the trachea, bronchi, or proximal bronchial tree or having a planning target volume that abutted mediastinal pleura or pericardium); one had an additional tumor that was ultracentral (having a planning target volume that abutted the trachea).
The patients had a median age of 75.1 years. Notably, the majority were medically unfit for surgery (84%) and had an Eastern Cooperative Oncology Group performance status score of 2 or worse (56%). In 60% of patients, the diagnosis was made radiographically using PET/CT imaging; in the rest, the diagnosis was biopsy proven.
Study results showed that all patients completed the radiotherapy regimen of 50 Gy in 5 fractions on alternate days as planned, without treatment delays.
Two patients (4%) died within 90 days of treatment (1 from a chest infection, 1 from an unknown cause). A single patient each experienced early grade 3 esophagitis and grade 3 late dyspnea, for an overall rate of grade 3 toxicity of 4%. None of the patients experienced grade 4 toxicity. The 90-day rate of hospital admission was 20%.
With a median follow-up of 25.2 months, 34 patients died: 18 from causes unrelated to cancer and 16 from cancer recurrence. The cohort had a median overall survival of 27.0 months and a median cancer-specific survival of 39.8 months. The 2-year overall survival rate was 67.6%.
“For patients with early stage moderately central NSCLC, SABR [stereotactic ablative body radiotherapy] using a schedule of 50 Gy/five fractions has acceptable toxicity and overall survival comparable with the published literature, despite treating a majority of patients with a performance status of 2 or worse,” the investigators concluded.
Dr. Rulach disclosed no conflicts of interest. The study did not receive any specific funding.
SOURCE: Rulach R et al. Clin Oncol. 2019 Oct 10. doi: 10.1016/j.clon.2019.09.055.
FROM CLINICAL ONCOLOGY
NAM offers recommendations to fight clinician burnout
WASHINGTON – a condition now estimated to affect a third to a half of clinicians in the United States, according to a report from an influential federal panel.
The National Academy of Medicine (NAM) on Oct. 23 released a report, “Taking Action Against Clinician Burnout: A Systems Approach to Professional Well-Being.” The report calls for a broad and unified approach to tackling the root causes of burnout.
There must be a concerted effort by leaders of many fields of health care to create less stressful workplaces for clinicians, Pascale Carayon, PhD, cochair of the NAM committee that produced the report, said during the NAM press event.
“This is not an easy process,” said Dr. Carayon, a researcher into patient safety issues at the University of Wisconsin–Madison. “There is no single solution.”
The NAM report assigns specific tasks to many different participants in health care through a six-goal approach, as described below.
–Create positive workplaces. Leaders of health care systems should consider how their business and management decisions will affect clinicians’ jobs, taking into account the potential to add to their levels of burnout. Executives need to continuously monitor and evaluate the extent of burnout in their organizations, and report on this at least annually.
–Address burnout in training and in clinicians’ early years. Medical, nursing, and pharmacy schools should consider steps such as monitoring workload, implementing pass-fail grading, improving access to scholarships and affordable loans, and creating new loan repayment systems.
–Reduce administrative burden. Federal and state bodies and organizations such as the National Quality Forum should reconsider how their regulations and recommendations contribute to burnout. Organizations should seek to eliminate tasks that do not improve the care of patients.
–Improve usability and relevance of health information technology (IT). Medical organizations should develop and buy systems that are as user-friendly and easy to operate as possible. They also should look to use IT to reduce documentation demands and automate nonessential tasks.
–Reduce stigma and improve burnout recovery services. State officials and legislative bodies should make it easier for clinicians to use employee assistance programs, peer support programs, and mental health providers without the information being admissible in malpractice litigation. The report notes the recommendations from the Federation of State Medical Boards, American Medical Association, and the American Psychiatric Association on limiting inquiries in licensing applications about a clinician’s mental health. Questions should focus on current impairment rather than reach well into a clinician’s past.
–Create a national research agenda on clinician well-being. By the end of 2020, federal agencies – including the Agency for Healthcare Research and Quality, the National Institute for Occupational Safety and Health, the Health Resources and Services Administration, and the U.S. Department of Veterans Affairs – should develop a coordinated research agenda on clinician burnout, the report said.
In casting a wide net and assigning specific tasks, the NAM report seeks to establish efforts to address clinician burnout as a broad and shared responsibility. It would be too easy for different medical organizations to depict addressing burnout as being outside of their responsibilities, Christine K. Cassel, MD, the cochair of the NAM committee that produced the report, said during the press event.

“Nothing could be farther from the truth. Everyone is necessary to solve this problem,” said Dr. Cassel, who is a former chief executive officer of the National Quality Forum.
Darrell G. Kirch, MD, chief executive of the Association of American Medical Colleges, described the report as a “call to action” at the press event.
Previously published research has found between 35% and 54% of nurses and physicians in the United States have substantial symptoms of burnout, with the prevalence of burnout ranging between 45% and 60% for medical students and residents, the NAM report said.
Leaders of health organizations must consider how the policies they set will add stress for clinicians and make them less effective in caring for patients, said Vindell Washington, MD, chief medical officer of Blue Cross Blue Shield of Louisiana and a member of the NAM committee that wrote the report.

“Those linkages should be incentives and motivations for boards and leaders more broadly to act on the problem,” Dr. Washington said at the NAM event.
Dr. Kirch said he experienced burnout as a first-year medical student. He said a “brilliant aspect” of the NAM report is its emphasis on burnout as a response to the conditions under which medicine is practiced. In the past, burnout has been viewed as being the fault of the physician or nurse experiencing it, with the response then being to try to “fix” this individual, Dr. Kirch said at the event.
The NAM report instead defines burnout as a “work-related phenomenon studied since at least the 1970s,” in which an individual may experience exhaustion and detachment. Depression and other mental health issues such as anxiety disorders and addiction can follow burnout, he said. “That involves a real human toll.”
Joe Rotella, MD, MBA, chief medical officer at American Academy of Hospice and Palliative Medicine, said in an interview that this NAM paper has the potential to spark the kind of transformation that its earlier research did for the quality of care. Then called the Institute of Medicine(IOM), NAM in 1999 issued a report, “To Err Is Human,” which is broadly seen as a key catalyst in efforts in the ensuing decades to improve the quality of care. IOM then followed up with a 2001 report, “Crossing the Quality Chasm.”
“Those papers over a period of time really did change the way we do health care,” said Dr. Rotella, who was not involved with the NAM report.
In Dr. Rotella’s view, the NAM report provides a solid framework for what remains a daunting task, addressing the many factors involved in burnout.
“The most exciting thing about this is that they don’t have 500 recommendations. They had six and that’s something people can organize around,” he said. “They are not small goals. I’m not saying they are simple.”
The NAM report delves into the factors that contribute to burnout. These include a maze of government and commercial insurance plans that create “a confusing and onerous environment for clinicians,” with many of them juggling “multiple payment systems with complex rules, processes, metrics, and incentives that may frequently change.”
Clinicians face a growing field of measurements intended to judge the quality of their performance. While some of these are useful, others are duplicative and some are not relevant to patient care, the NAM report said.
The report also noted that many clinicians describe electronic health records (EHRs) as taking a toll on their work and private lives. Previously published research has found that for every hour spent with a patient, physicians spend an additional 1-2 hours on the EHR at work, with additional time needed to complete this data entry at home after work hours, the report said.
In an interview, Cynda Rushton, RN, PhD, a Johns Hopkins University researcher and a member of the NAM committee that produced the report, said this new publication will support efforts to overhaul many aspects of current medical practice. She said she hopes it will be a “catalyst for bold and fundamental reform.
“It’s taking a deep dive into the evidence to see how we can begin to dismantle the system’s contributions to burnout,” she said. “No longer can we put Band-Aids on a gaping wound.”
WASHINGTON – a condition now estimated to affect a third to a half of clinicians in the United States, according to a report from an influential federal panel.
The National Academy of Medicine (NAM) on Oct. 23 released a report, “Taking Action Against Clinician Burnout: A Systems Approach to Professional Well-Being.” The report calls for a broad and unified approach to tackling the root causes of burnout.
There must be a concerted effort by leaders of many fields of health care to create less stressful workplaces for clinicians, Pascale Carayon, PhD, cochair of the NAM committee that produced the report, said during the NAM press event.
“This is not an easy process,” said Dr. Carayon, a researcher into patient safety issues at the University of Wisconsin–Madison. “There is no single solution.”
The NAM report assigns specific tasks to many different participants in health care through a six-goal approach, as described below.
–Create positive workplaces. Leaders of health care systems should consider how their business and management decisions will affect clinicians’ jobs, taking into account the potential to add to their levels of burnout. Executives need to continuously monitor and evaluate the extent of burnout in their organizations, and report on this at least annually.
–Address burnout in training and in clinicians’ early years. Medical, nursing, and pharmacy schools should consider steps such as monitoring workload, implementing pass-fail grading, improving access to scholarships and affordable loans, and creating new loan repayment systems.
–Reduce administrative burden. Federal and state bodies and organizations such as the National Quality Forum should reconsider how their regulations and recommendations contribute to burnout. Organizations should seek to eliminate tasks that do not improve the care of patients.
–Improve usability and relevance of health information technology (IT). Medical organizations should develop and buy systems that are as user-friendly and easy to operate as possible. They also should look to use IT to reduce documentation demands and automate nonessential tasks.
–Reduce stigma and improve burnout recovery services. State officials and legislative bodies should make it easier for clinicians to use employee assistance programs, peer support programs, and mental health providers without the information being admissible in malpractice litigation. The report notes the recommendations from the Federation of State Medical Boards, American Medical Association, and the American Psychiatric Association on limiting inquiries in licensing applications about a clinician’s mental health. Questions should focus on current impairment rather than reach well into a clinician’s past.
–Create a national research agenda on clinician well-being. By the end of 2020, federal agencies – including the Agency for Healthcare Research and Quality, the National Institute for Occupational Safety and Health, the Health Resources and Services Administration, and the U.S. Department of Veterans Affairs – should develop a coordinated research agenda on clinician burnout, the report said.
In casting a wide net and assigning specific tasks, the NAM report seeks to establish efforts to address clinician burnout as a broad and shared responsibility. It would be too easy for different medical organizations to depict addressing burnout as being outside of their responsibilities, Christine K. Cassel, MD, the cochair of the NAM committee that produced the report, said during the press event.
“Nothing could be farther from the truth. Everyone is necessary to solve this problem,” said Dr. Cassel, who is a former chief executive officer of the National Quality Forum.
Darrell G. Kirch, MD, chief executive of the Association of American Medical Colleges, described the report as a “call to action” at the press event.
Previously published research has found between 35% and 54% of nurses and physicians in the United States have substantial symptoms of burnout, with the prevalence of burnout ranging between 45% and 60% for medical students and residents, the NAM report said.
Leaders of health organizations must consider how the policies they set will add stress for clinicians and make them less effective in caring for patients, said Vindell Washington, MD, chief medical officer of Blue Cross Blue Shield of Louisiana and a member of the NAM committee that wrote the report.
“Those linkages should be incentives and motivations for boards and leaders more broadly to act on the problem,” Dr. Washington said at the NAM event.
Dr. Kirch said he experienced burnout as a first-year medical student. He said a “brilliant aspect” of the NAM report is its emphasis on burnout as a response to the conditions under which medicine is practiced. In the past, burnout has been viewed as being the fault of the physician or nurse experiencing it, with the response then being to try to “fix” this individual, Dr. Kirch said at the event.
The NAM report instead defines burnout as a “work-related phenomenon studied since at least the 1970s,” in which an individual may experience exhaustion and detachment. Depression and other mental health issues such as anxiety disorders and addiction can follow burnout, he said. “That involves a real human toll.”
Joe Rotella, MD, MBA, chief medical officer at American Academy of Hospice and Palliative Medicine, said in an interview that this NAM paper has the potential to spark the kind of transformation that its earlier research did for the quality of care. Then called the Institute of Medicine(IOM), NAM in 1999 issued a report, “To Err Is Human,” which is broadly seen as a key catalyst in efforts in the ensuing decades to improve the quality of care. IOM then followed up with a 2001 report, “Crossing the Quality Chasm.”
“Those papers over a period of time really did change the way we do health care,” said Dr. Rotella, who was not involved with the NAM report.
In Dr. Rotella’s view, the NAM report provides a solid framework for what remains a daunting task, addressing the many factors involved in burnout.
“The most exciting thing about this is that they don’t have 500 recommendations. They had six and that’s something people can organize around,” he said. “They are not small goals. I’m not saying they are simple.”
The NAM report delves into the factors that contribute to burnout. These include a maze of government and commercial insurance plans that create “a confusing and onerous environment for clinicians,” with many of them juggling “multiple payment systems with complex rules, processes, metrics, and incentives that may frequently change.”
Clinicians face a growing field of measurements intended to judge the quality of their performance. While some of these are useful, others are duplicative and some are not relevant to patient care, the NAM report said.
The report also noted that many clinicians describe electronic health records (EHRs) as taking a toll on their work and private lives. Previously published research has found that for every hour spent with a patient, physicians spend an additional 1-2 hours on the EHR at work, with additional time needed to complete this data entry at home after work hours, the report said.
In an interview, Cynda Rushton, RN, PhD, a Johns Hopkins University researcher and a member of the NAM committee that produced the report, said this new publication will support efforts to overhaul many aspects of current medical practice. She said she hopes it will be a “catalyst for bold and fundamental reform.
“It’s taking a deep dive into the evidence to see how we can begin to dismantle the system’s contributions to burnout,” she said. “No longer can we put Band-Aids on a gaping wound.”
Climate change, health systems, and hospital medicine
Working toward carbon neutrality
I have always enjoyed talking with my patients from coastal Louisiana. They enjoy life, embrace their environment, and give me a perspective which is both similar and different than that of residents of New Orleans where I practice hospital medicine.

Their hospitalization is often a reflective moment in their lives. Lately I have been asking them about their advice to their children concerning the future of southern Louisiana in reference to sea rise, global warming, and increasing climatic events. More often than not, they have been telling their children it is time to move away.
These are a people who have strong devotion to family, but they are also practical. More than anything they would like their children to stay and preserve their heritage, but concern for their children’s future outweighs that. They have not come to this conclusion by scientific reports, but rather by what is happening before them. This group of people doesn’t alarm easily, but they see the unrelenting evidence of land loss and sea rise before them with little reason to believe it will change.
I am normally not one to speak out about climate change. Like most I have listened to the continuous alarms sounded by experts but have always assumed someone more qualified than myself should lead the efforts. But when I see the tangible effects of climate change both in my own life and the lives of my patients, I feel a sense of urgency.
12 years
Twelve years. That is the time we have to significantly reduce carbon emissions before catastrophic and potentially irreversible events will occur. This evidence is according to the authors of the landmark report by the UN Intergovernmental Panel on Climate Change released in October 2018. The report states urgent and unprecedented changes are needed to limit temperature elevations of 1.5°C and 2°C, as compared with the preindustrial era. Exceeding a 2°C elevation will likely lead to global adverse events at an unprecedented level.1
The events forecast by the U.N. report are not abstract, particularly as they relate to public health. With high confidence, the report outlines with high specificity: increases in extreme heat, floods, crop failures, and a multitude of economic and social stressors which will affect the care of our most vulnerable patients.1
This statement by Dr. Dana Hanson, president of the World Medical Association, summarizes the effects of climate change on the delivery of health care: “Climate change represents an inevitable massive threat to global health that will likely eclipse the major pandemics as a leading cause of death in the 21st century.”
So, what does the health care system have to do with climate change and its primary driver, carbon emissions? More than I realized, as the U.S. health care industry produces 10% of the nation’s carbon emissions.2 If the U.S. health care system was a country it would be ranked seventh, ahead of the United Kingdom; 10% of all smog and 9% of all particulate-related respiratory disease can be attributed to the carbon emissions of the health care industry. This breaks down to possibly 20,000 premature deaths per year.2 Our current health care industry is a significant driver of environmentally related disease and will continue to be so, unless major change occurs.
Although much of it is behind the scenes, providing health care 24/7 is a highly energy-intensive and waste-producing endeavor. Many of the innovations to reduce carbon emissions that have been seen in other industries have lagged behind in health care, as we have focused on other issues.
But the health care system is transitioning. It strives to address the whole person, including where they live, work, and play. A key component of this will be addressing our impact on the environments we serve. How can we make that argument if we don’t first address our own impact on the climate?
Carbon-neutral health care
Health care is one of the few industries that has the economic clout, the scientific basis, the community engagement, and perhaps most importantly the motivations to “first, do no harm” that could lead a national (if not a global) transformation in environmental stewardship among all industries.
Many agree that action is needed, but is essential that we set specific meaningful goals that take into account the urgency of the situation. One possible solution is to encourage every health care system to begin the process of becoming carbon neutral. Simply defined, carbon neutrality is balancing the activities that result in carbon emissions with activities that reduce carbon emissions. Carbon neutrality has become the standard by which an industry’s commitment to reducing carbon emissions is measured. The measurement is standardized and achievable, and the basic concept is understood by most. It results not only in long-term benefits to climate change, but immediate improvement of air quality in the local community. In addition, achieving carbon neutrality serves as a catalyst of new desired industries, improves employee morale, and aids in recruitment.3
So, what would a carbon-neutral health care system look like? In short, sustainability should be considered in all of its actions. Risks and benefits would be contemplated, as we do with all treatments, except now environmental risks would be brought into the equation. This includes the obvious, such as purchasing and supporting the development of renewable energy, but also transportation of patients and employees, food supply chains, and even the use of virtual visits to reduce the environmental impact of patient transportation.
I am optimistic that carbon neutrality is achievable in the health care sector. It can drive economic development and engage the community in environmental stewardship efforts. But time is of the essence and leaders for these efforts are needed now. As hospitalists, we are on the front lines of the health care system. We see the direct impact of social, economic, and environmental issues on our patients. We have credibility with both our patients and hospital administration. Among all industries, there need to be champions of environmental sustainability efforts. Hospitalists are uniquely positioned to fill that role.
My concern is that 12 years is right around the corner. We are at an inflection point on our efforts to reduce carbon emissions and that is good, but time has become our enemy. The difference between terrible and unlivable will be our, and the world’s, response to reducing carbon emissions.
It is time for bold action from us, the health care community. It is our moment and our place to lead those efforts, so let’s take advantage of both this challenge and this opportunity. Consider leading those efforts in your health care system.
Dr. Conrad is medical director of community affairs and health policy at Ochsner Health Systems in New Orleans.
References
1. Special Report on Global Warming of 1.5°C. Incheon [Republic of Korea]: Intergovernmental Panel on Climate Change. 7 Oct 2018.
2. Eckelman MJ, Sherman J. Environmental Impacts of the U.S. Health Care System and Effects on Public Health. PLoS ONE. 11(6):e0157014.
3. McCunn LJ, Gifford R. Do green offices affect employee engagement and environmental attitudes? Archit Sci Rev. 55:2;128-34. doi: 10.1080/00038628.2012.667939.
Working toward carbon neutrality
Working toward carbon neutrality
I have always enjoyed talking with my patients from coastal Louisiana. They enjoy life, embrace their environment, and give me a perspective which is both similar and different than that of residents of New Orleans where I practice hospital medicine.
Their hospitalization is often a reflective moment in their lives. Lately I have been asking them about their advice to their children concerning the future of southern Louisiana in reference to sea rise, global warming, and increasing climatic events. More often than not, they have been telling their children it is time to move away.
These are a people who have strong devotion to family, but they are also practical. More than anything they would like their children to stay and preserve their heritage, but concern for their children’s future outweighs that. They have not come to this conclusion by scientific reports, but rather by what is happening before them. This group of people doesn’t alarm easily, but they see the unrelenting evidence of land loss and sea rise before them with little reason to believe it will change.
I am normally not one to speak out about climate change. Like most I have listened to the continuous alarms sounded by experts but have always assumed someone more qualified than myself should lead the efforts. But when I see the tangible effects of climate change both in my own life and the lives of my patients, I feel a sense of urgency.
12 years
Twelve years. That is the time we have to significantly reduce carbon emissions before catastrophic and potentially irreversible events will occur. This evidence is according to the authors of the landmark report by the UN Intergovernmental Panel on Climate Change released in October 2018. The report states urgent and unprecedented changes are needed to limit temperature elevations of 1.5°C and 2°C, as compared with the preindustrial era. Exceeding a 2°C elevation will likely lead to global adverse events at an unprecedented level.1
The events forecast by the U.N. report are not abstract, particularly as they relate to public health. With high confidence, the report outlines with high specificity: increases in extreme heat, floods, crop failures, and a multitude of economic and social stressors which will affect the care of our most vulnerable patients.1
This statement by Dr. Dana Hanson, president of the World Medical Association, summarizes the effects of climate change on the delivery of health care: “Climate change represents an inevitable massive threat to global health that will likely eclipse the major pandemics as a leading cause of death in the 21st century.”
So, what does the health care system have to do with climate change and its primary driver, carbon emissions? More than I realized, as the U.S. health care industry produces 10% of the nation’s carbon emissions.2 If the U.S. health care system was a country it would be ranked seventh, ahead of the United Kingdom; 10% of all smog and 9% of all particulate-related respiratory disease can be attributed to the carbon emissions of the health care industry. This breaks down to possibly 20,000 premature deaths per year.2 Our current health care industry is a significant driver of environmentally related disease and will continue to be so, unless major change occurs.
Although much of it is behind the scenes, providing health care 24/7 is a highly energy-intensive and waste-producing endeavor. Many of the innovations to reduce carbon emissions that have been seen in other industries have lagged behind in health care, as we have focused on other issues.
But the health care system is transitioning. It strives to address the whole person, including where they live, work, and play. A key component of this will be addressing our impact on the environments we serve. How can we make that argument if we don’t first address our own impact on the climate?
Carbon-neutral health care
Health care is one of the few industries that has the economic clout, the scientific basis, the community engagement, and perhaps most importantly the motivations to “first, do no harm” that could lead a national (if not a global) transformation in environmental stewardship among all industries.
Many agree that action is needed, but is essential that we set specific meaningful goals that take into account the urgency of the situation. One possible solution is to encourage every health care system to begin the process of becoming carbon neutral. Simply defined, carbon neutrality is balancing the activities that result in carbon emissions with activities that reduce carbon emissions. Carbon neutrality has become the standard by which an industry’s commitment to reducing carbon emissions is measured. The measurement is standardized and achievable, and the basic concept is understood by most. It results not only in long-term benefits to climate change, but immediate improvement of air quality in the local community. In addition, achieving carbon neutrality serves as a catalyst of new desired industries, improves employee morale, and aids in recruitment.3
So, what would a carbon-neutral health care system look like? In short, sustainability should be considered in all of its actions. Risks and benefits would be contemplated, as we do with all treatments, except now environmental risks would be brought into the equation. This includes the obvious, such as purchasing and supporting the development of renewable energy, but also transportation of patients and employees, food supply chains, and even the use of virtual visits to reduce the environmental impact of patient transportation.
I am optimistic that carbon neutrality is achievable in the health care sector. It can drive economic development and engage the community in environmental stewardship efforts. But time is of the essence and leaders for these efforts are needed now. As hospitalists, we are on the front lines of the health care system. We see the direct impact of social, economic, and environmental issues on our patients. We have credibility with both our patients and hospital administration. Among all industries, there need to be champions of environmental sustainability efforts. Hospitalists are uniquely positioned to fill that role.
My concern is that 12 years is right around the corner. We are at an inflection point on our efforts to reduce carbon emissions and that is good, but time has become our enemy. The difference between terrible and unlivable will be our, and the world’s, response to reducing carbon emissions.
It is time for bold action from us, the health care community. It is our moment and our place to lead those efforts, so let’s take advantage of both this challenge and this opportunity. Consider leading those efforts in your health care system.
Dr. Conrad is medical director of community affairs and health policy at Ochsner Health Systems in New Orleans.
References
1. Special Report on Global Warming of 1.5°C. Incheon [Republic of Korea]: Intergovernmental Panel on Climate Change. 7 Oct 2018.
2. Eckelman MJ, Sherman J. Environmental Impacts of the U.S. Health Care System and Effects on Public Health. PLoS ONE. 11(6):e0157014.
3. McCunn LJ, Gifford R. Do green offices affect employee engagement and environmental attitudes? Archit Sci Rev. 55:2;128-34. doi: 10.1080/00038628.2012.667939.