User login
How Well Does the Braden Nutrition Subscale Agree With the VA Nutrition Classification Scheme Related to Pressure Ulcer Risk?
A pressure ulcer (PrU) is a localized injury to the skin and/or deep tissues that is due to pressure, friction, or shearing forces. Pressure ulcers are strongly associated with serious comorbidities, particularly inadequate nutrition and immobility.1,2 Pressure ulcers increase hospital costs significantly. In the U.S., PrU care is about $11 billion annually and a cost of between $2,000 and $21,410 per individual PrU.3-5
The impact of nosocomial PrUs remains a key health and economic concern of acute care facilities worldwide. In the U.S., about 2.5 million inpatients annually develop some degree of a PrU during their hospital stay. The reported incidence rates range from 0.4% to 38%.3,6 Each year about 60,000 people die of complications of a PrU.3,6,7 Inadequate nutrition is a critical factor that contributes to the incidence of PrUs.8-12 Consequences of inadequate nutrition have included alterations in skin integrity resulting in PrUs, longer hospital stays, increased costs of care, and higher rates of mortality.9 As a patient’s nutritional status becomes compromised, the likelihood of developing a PrU increases, especially if an individual is immobilized.7,9-11,13
Braden Scale History
The Braden Scale for Predicting Pressure Sore Risk was developed by Barbara Braden, PhD, RN, and Nancy Bergstrom, PhD, RN, in 1987.
The scale is composed of 6 factors: sensory perception, moisture, activity, mobility, friction and shear, and nutrition.14 Each factor is scored on a scale of 1 to 4 points (friction and shear are scored on a point scale of only 1 to 3) for a total possible score of 6 to 23 points (the lower the score, the greater the assumed PrU risk).
The Braden nutrition subscale relies heavily on recording observed or patient self-reported eating habits. It is typically documented by nurses who assess the daily intake of meals: recording a score of 4 if the patient’s meal intake is excellent (eats most of every meal), 3 if the patient’s intake is adequate (eats more than half of most meals), 2 if the patient’s intake is probably inadequate (rarely eats a complete meal), and 1 if a patient’s intake is very poor (never eats a complete meal) (Table 1).14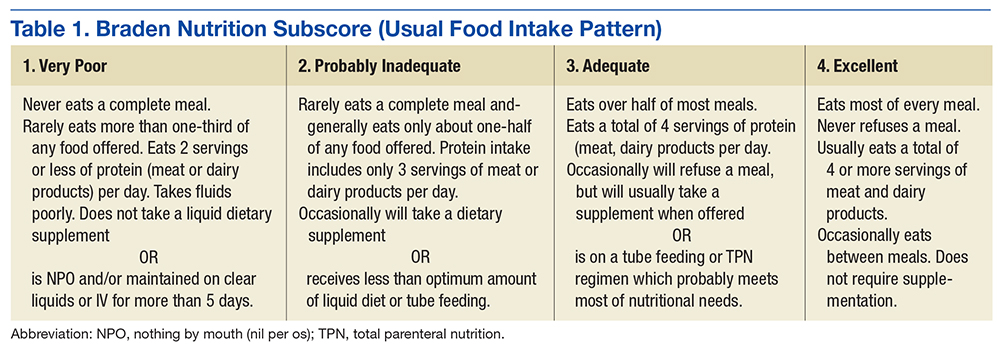
Historically, the Braden scale is reported to have good reliability when used by registered nurses as a risk prediction tool.14,16 A recent review also reported high interrater reliability of the Braden scale total score among nurses, nursing assistants, and graduate assistants.17 However, other studies suggest certain subscales (such as sensory and nutrition) may have very low interrater reliability among nurses and poor PrU predictability.18,19 To date, there are no known studies evaluating the agreement of the Braden nutrition subscale primarily used by nurses and the VA Nutrition Classification Scheme (VANCS) used by dietitians.
The VA standard of care recommends that PrU risk assessments are documented for all hospitalized veterans within 24 hours of admission, daily, with transfers or discharges, and when there is a status change in the patient. In addition, nutritional assessments by dietitians (using the VANCS) are encouraged within 24 hours of acute care hospitalization.20
The VANCS performed by dietitians consists of 4 classifications: no nutritional compromise, mild nutritional compromise, moderate nutritional compromise, and severenutritional compromise. These classifications are based on well-documented “comprehensive approaches to defining nutritional status that uses multiple parameters” including nutrition history, weight (body mass index and weight loss), diagnoses, diet (and diet orders), brief physical assessment, and preliminary laboratory data (serum albumin/pre-albumin and total lymphocyte count).20,21
The predictive ability of a risk assessment tool is critical to its clinical effectiveness in determining a clinical outcome.17 The Braden scale has been used for more than 30 years in various settings without any significant change to the scale or subscales. In a 2012 study, 4 medical factors were found to be more predictive of PrUs than the Braden scale total score in a sample of 213 acutely ill adult veterans.8 By performing a retrospective study using logistic regression predictive models, severe nutritional compromise (as identified by a dietitian), pneumonia, candidiasis, and surgery were identified as stronger predictors of PrU risk than was the Braden total score.8
With malnutrition as one of the most significant predictive factors in PrU risk, it is critical to determine whether discrepancies exist between the Braden nutrition subscale used primarily by nurses and the VANCS used by dietitians. Hence, the overall purpose of this study was to determine the level of agreement between the Braden nutrition subscale scores documented by nurses and the VANCS used by dietitians and examine the relationship of these assessments with PrU development.
Methods
The parent study was approved by the University of Florida Institutional Review Board before data collection. This secondary analysis of the parent study examined data already collected by Cowan and colleagues, which demonstrated the significance of nutritional compromise in PrU risk.
The de-identified data subset consisted of general demographics, hospital length of stay, specific diagnoses, Braden scores, PrU status, and registered dietician nutritional classification data from 213 acutely ill veterans admitted to North Florida/South Georgia Veterans Health System (NF/SGVHS) in Florida for more than 3 days between January and July 2008.8 The sample consisted of 100 veterans with nosocomial PrUs and 113 veterans without PrUs during their admission.
Scoring
Using the de-identified dataset, the variables of interest (VANCS, Braden nutrition subscale score, and the presence/absence of PrU) were coded. The VANCS was given a corresponding score ranging from 1 to 4 (1, severe nutritional compromise; 2, moderate nutritional compromise; 3, mild nutritional compromise; and 4, no nutritional compromise). The Braden nutrition subscale ranged from 1 to 4 (1 very poor nutrition; 2, probably inadequate nutrition; 3, adequate nutrition; and 4, excellent nutrition). PrU development was coded as 0, no PrU development and 1, PrU development. All nutritional assessments had been recorded in the electronic health record before any PrU reported in the parent study.
Statistical Analysis
After coding the variables of interest, the data were transferred into SAS v 9.4 (Cary, NC). The data collected compared VANCS and Braden nutrition subscale results. In addition, the authors examined the agreement between the score assigned to the VANCS and Braden nutrition subscale results with a weighted
Additionally, the authors computed sensitivity and specificity of the Braden nutrition subscale using the VANCS as the gold standard. The severe and moderately compromised categories of the VANCS combined to form the high-risk category, and the mild-to-no compromise categories were combined to form the low-risk category. The Braden nutrition subscale was similarly dichotomized with the very poor and probably inadequate intake forming the high-risk category and the adequate and excellent intake forming the low-risk category. Sensitivity and specificity of the Braden were then calculated.
Results
Nursing assessments using the Braden nutrition subscale were completed on 213 patients whose mean age (SD) was 71.0 (10.6) years. The VANCS documented by dietitians was completed on 205 patients. For 7 patients, a nutrition assessment was documented only by the Braden nutrition subscale and not the VANCS. Most of the patients were male (97%, n = 206), and white (81.4%, n = 171). The weighted
Landis and colleagues suggest that a 
Figure 2 shows the percentage of patients who developed a PrU during hospitalization among different measures of Braden nutrition subscale vs VANCS. In Figure 2, nutritional categories 1, 2, and 3 correspond to very poor intake (Braden)/severe compromise (VANCS), probably inadequate intake (Braden)/moderate compromise (VANCS), and adequate intake (Braden)/mild compromise (VANCS), respectively. There were 3 patients who had a no compromise VANCS; none of these had a PrU, so their data are not represented in Figure 2.
Discussion
Findings from this study indicate that the VANCS documented by dietitians is superior in assessing nutritional risk and predicting the development of PrUs in acutely ill hospitalized veterans compared with the Braden nutrition subscale. This study also shows that the Braden nutrition subscale did not accurately predict PrU development in acutely ill veterans. This finding concurs with the Serpa and Santos study in which the Braden nutrition subscale scores were not predictive for PrU development in hospitalized patients.
One possible explanation for the findings in this study is that the nutrition subscale of the Braden tool asks the assessing clinician to evaluate the amount of food intake the patient is currently taking in for their usual meals. This assessment is highly subjective and speculative and does not account for recent intake fluctuations or weight loss. By comparison, the VANCS is more comprehensive in its ability to assess nutritional compromise based on multiple factors, such as recent weight loss, laboratory indices, body habitus, dentition, and swallowing ability.20 The National Pressure Ulcer Advisory Panel suggests that following an acute care admission, a patient receive a consult from a dietitian if the health care provider suspects that the patient may be nutritionally compromised.1 The study findings demonstrate the utility of the VANCS as predictive of PrU risk.
Unfortunately, the authors have learned that the VANCS may be phased out soon, and many VA facilities are no longer using it. Findings from this study and other recent scientific literature suggest that all inpatients may benefit from nutritional assessments by dietitians. When performed, dietitian assessments provide the basis for more accurate nursing assessment of nutritional risk and targeted interventions. Nursing professionals should be encouraged to review the dietitian assessment and consultation notes and to incorporate this information into a more comprehensive PrU prevention and treatment plan.
Interestingly, in spite of those assessed to have severe nutritional compromise by dietitian assessment (n = 39), very few of these patients (n = 4) had an ICD-9 diagnosis related to malnutrition (ICD-9 codes, 262, 273.8, 269.9, 263.9) entered in their chart for that hospitalization. This observation suggests that 88% of patients with severe nutritional compromise were not appropriately coded at discharge. Improper coding has implications for researchers using ICD-9 diagnosis codes at discharge for accurate analysis of risk factors as well as for health care providers who may look at coded diagnoses information in the charts when considering comorbid conditions for health management.
This study highlights the importance of nutritional status as a risk factor for PrU development. Reasons suggested for nutritional status seeming to be the most significant correlate to PrUs in the acute care setting include the following: decreased protein alters oncotic pressure, making tissue prone to edema; decreases in subcutaneous fat reduce protection from pressure effects; nutritional compromise alters cellular transport of nutrients and waste and makes tissue cells more vulnerable to deformation and physical stresses; and lactate (a by-product of anaerobic glycolysis) or any other metabolic by-product of malnutrition could cause biochemical stress, and tissue cells can die faster as a result of the increased plasma membrane permeability.7,24-26
Limitations
This study was limited to 1 sample of veterans hospitalized in the 2 acute care facilities of NF/SGVHS and the use of a retrospective chart review. As a result, further research is necessary to establish generalizability to other acute care settings and high-risk populations. In spite of these limitations, this and other studies highlight the need for revision of the Braden scale, specifically the nutritional subscale, to lessen the ambiguity seen between dietitian and nursing assessments while also increasing the accuracy in determining a patient’s nutrition risk of PrU development during hospitalization.
Conclusion
These findings provide evidence that dietitians’ documentation of the VANCS related to nutritional compromise are superior to current nutritional risk assessments using the Braden nutrition subscale in predicting PrU risk.
Acknowledgments
The authors acknowledge that this work was supported by the resources of the North Florida/South Georgia Veterans Health System in Gainesville, Florida, and in part by a Small Project Award from the VA Office of Nursing Services.
1. National Pressure Ulcer Advisory Panel, European Pressure Ulcer Advisory Panel, Pan Pacific Pressure Injury Alliance. Prevention and Treatment of Pressure Ulcers: Clinical Practice Guideline. http://www.npuap.org/resources/educational-and-clinical -resources/prevention-and-treatment-of-pressure -ulcers-clinical-practice-guideline. Updated 2014. Accessed November 7, 2016.
2. National Pressure Ulcer Advisory Panel, European Pressure Ulcer Advisory Panel, Pan Pacific Pressure Injury Alliance. Prevention and treatment of pressure ulcers: quick reference guide. http://www .npuap.org/wp-content/uploads/2014/08/Updated -10-16-14-Quick-Reference-Guide-DIGITAL-NPUAP-EPUAP-PPPIA-16Oct2014.pdf. Updated October 16, 2014. Accessed October 21, 2016.
3. Sullivan N. Preventing in-facility pressure ulcers. In: Agency for Healthcare Research and Quality. Making Health Care Safer II. An Updated Critical Analysis of the Evidence for Patient Safety Practices. Evidence Reports/Technology Assessments. http://www.ahrq.gov/sites/default/files/wysiwyg/research/findings/evidence-based-reports/services/quality/ptsafetyII-full.pdf:212-232. Published March 2013. Accessed October 21, 2016.
4. Russo CA, Steiner C, Spector W. Hospitalizations related to pressure ulcers among adults 18 years and older, 2006. In: Healthcare Cost and Utilization Project (HCUP) Statistical Briefs. http://www.ncbi .nlm.nih.gov/books/NBK54557. Published December 2008. Accessed October 21, 2016.
5. Spetz J, Brown DS, Aydin C, Donaldson N. The value of reducing hospital-acquired pressure ulcer prevalence: an illustrative analysis. J Nurs Adm. 2013;43(4):235-241.
6. Whittington KT, Briones R. National prevalence and incidence study: 6-year sequential acute care data. Adv Skin Wound Care. 2004;17(9):490-494.
7. Dorner B, Posthauer ME, Thomas D; National Pressure Ulcer Advisory Panel. The role of nutrition in pressure ulcer prevention and treatment: National Pressure Ulcer Advisory Panel white paper. http://www.npuap.org/wp-content/uploads/2012/03/Nutrition-White-Paper-Website-Version.pdf. Published 2009. Accessed November 7, 2016.
8. Cowan LJ, Stechmiller JK, Rowe M, Kairalla JA. Enhancing Braden pressure ulcer risk assessment in acutely ill adult veterans. Wound Repair Regen. 2012;20(2):137-148.
9. Correia MI, Hegazi RA, Higashiguchi T, et al. Evidence-based recommendations for addressing malnutrition in health care: an updated strategy from the feedM.E. Global Study Group. J Am Med Dir Assoc. 2014;15(8):544-550.
10. Malafarina V, Úriz-Otano F, Fernández-Catalán C, Tejedo-Flors D. Nutritional status and pressure ulcers. Risk assessment and estimation in older adults. J Am Geriatr Soc. 2014;62(6):1209-1210.
11. Posthauer ME, Banks M, Dorner B, Schols JM. The role of nutrition for pressure ulcer management: national pressure ulcer advisory panel, European pressure ulcer advisory panel, and pan pacific pressure injury alliance white paper. Adv Skin Wound Care. 2015;28(4):175-188.
12. Brito PA, de Vasconcelos Generoso S, Correia MI. Prevalence of pressure ulcers in hospitals in Brazil and association with nutritional status—a multicenter, cross-sectional study. Nutrition. 2013;29(4):646-649.
13. Coleman S, Gorecki C, Nelson EA, et al. Patient risk factors for pressure ulcer development: systematic review. Int J Nurs Stud. 2013;50(7):974-1003.
14. Bergstrom N, Braden BJ, Laguzza A, Holman V. The Braden Scale for predicting pressure sore risk. Nurs Res. 1987;36(4):205-210.
15. Ayello EA, Braden B. How and why to do pressure ulcer risk assessment. Adv Skin Wound Care. 2002;15(3):125-131.
16. Wang LH, Chen HL, Yan HY, et al. Inter-rater reliability of three most commonly used pressure ulcer risk assessment scales in clinical practice. Int Wound J. 2015;12(5):590-594.
17. Wilchesky M, Lungu O. Predictive and concurrent validity of the Braden scale in long-term care: a meta-analysis. Wound Repair Regen. 2015;23(1):44-56.
18. Kottner J, Dassen T. An interrater reliability study of the Braden scale in two nursing homes. Int J Nurs Stud. 2008;45(10):1501-1511.
19. Yatabe MS, Taguchi F, Ishida I, et al. Mini nutritional assessment as a useful method of predicting the development of pressure ulcers in elderly inpatients. J Am Geriatr Soc. 2013;61(10):1698-1704.
20. Hiller L, Lowery JC, Davis JA, Shore CJ, Striplin DT. Nutritional status classification in the Department of Veterans Affairs. J Am Diet Assoc. 2001;101(7):786-792.
21. U.S. Department of Veterans Affairs. VHA Handbook 1109.02. Clinical nutrition management. http://www.va.gov/vhapublications/ViewPublica tion.asp?pub_ID=2493. Published February 2012. Accessed October 21, 2016.
22. Landis JR, Koch GG. The measurement of observer agreement for categorical data. Biometrics. 1977;33(1):159-174.
23. Serpa LF, Santos VL. Validity of the Braden Nutrition Subscale in predicting pressure ulcer development. J Wound Ostomy Continence Nurs. 2014;41(5):436-443.
24. Reddy M, Gill SS, Rochon PA. Preventing pressure ulcers: a systematic review. JAMA. 2006;296(8):974-984.
25. Cooper KL. Evidence-based prevention of pressure ulcers in the intensive care unit. Crit Care Nurse. 2013;33(6):57-66.
26. Leopold E, Gefen A. Changes in permeability of the plasma membrane of myoblasts to fluorescent dyes with different molecular masses under sustained uniaxial stretching. Med Eng Phys. 2013;35(5):601-607.
A pressure ulcer (PrU) is a localized injury to the skin and/or deep tissues that is due to pressure, friction, or shearing forces. Pressure ulcers are strongly associated with serious comorbidities, particularly inadequate nutrition and immobility.1,2 Pressure ulcers increase hospital costs significantly. In the U.S., PrU care is about $11 billion annually and a cost of between $2,000 and $21,410 per individual PrU.3-5
The impact of nosocomial PrUs remains a key health and economic concern of acute care facilities worldwide. In the U.S., about 2.5 million inpatients annually develop some degree of a PrU during their hospital stay. The reported incidence rates range from 0.4% to 38%.3,6 Each year about 60,000 people die of complications of a PrU.3,6,7 Inadequate nutrition is a critical factor that contributes to the incidence of PrUs.8-12 Consequences of inadequate nutrition have included alterations in skin integrity resulting in PrUs, longer hospital stays, increased costs of care, and higher rates of mortality.9 As a patient’s nutritional status becomes compromised, the likelihood of developing a PrU increases, especially if an individual is immobilized.7,9-11,13
Braden Scale History
The Braden Scale for Predicting Pressure Sore Risk was developed by Barbara Braden, PhD, RN, and Nancy Bergstrom, PhD, RN, in 1987.
The scale is composed of 6 factors: sensory perception, moisture, activity, mobility, friction and shear, and nutrition.14 Each factor is scored on a scale of 1 to 4 points (friction and shear are scored on a point scale of only 1 to 3) for a total possible score of 6 to 23 points (the lower the score, the greater the assumed PrU risk).
The Braden nutrition subscale relies heavily on recording observed or patient self-reported eating habits. It is typically documented by nurses who assess the daily intake of meals: recording a score of 4 if the patient’s meal intake is excellent (eats most of every meal), 3 if the patient’s intake is adequate (eats more than half of most meals), 2 if the patient’s intake is probably inadequate (rarely eats a complete meal), and 1 if a patient’s intake is very poor (never eats a complete meal) (Table 1).14
Historically, the Braden scale is reported to have good reliability when used by registered nurses as a risk prediction tool.14,16 A recent review also reported high interrater reliability of the Braden scale total score among nurses, nursing assistants, and graduate assistants.17 However, other studies suggest certain subscales (such as sensory and nutrition) may have very low interrater reliability among nurses and poor PrU predictability.18,19 To date, there are no known studies evaluating the agreement of the Braden nutrition subscale primarily used by nurses and the VA Nutrition Classification Scheme (VANCS) used by dietitians.
The VA standard of care recommends that PrU risk assessments are documented for all hospitalized veterans within 24 hours of admission, daily, with transfers or discharges, and when there is a status change in the patient. In addition, nutritional assessments by dietitians (using the VANCS) are encouraged within 24 hours of acute care hospitalization.20
The VANCS performed by dietitians consists of 4 classifications: no nutritional compromise, mild nutritional compromise, moderate nutritional compromise, and severenutritional compromise. These classifications are based on well-documented “comprehensive approaches to defining nutritional status that uses multiple parameters” including nutrition history, weight (body mass index and weight loss), diagnoses, diet (and diet orders), brief physical assessment, and preliminary laboratory data (serum albumin/pre-albumin and total lymphocyte count).20,21
The predictive ability of a risk assessment tool is critical to its clinical effectiveness in determining a clinical outcome.17 The Braden scale has been used for more than 30 years in various settings without any significant change to the scale or subscales. In a 2012 study, 4 medical factors were found to be more predictive of PrUs than the Braden scale total score in a sample of 213 acutely ill adult veterans.8 By performing a retrospective study using logistic regression predictive models, severe nutritional compromise (as identified by a dietitian), pneumonia, candidiasis, and surgery were identified as stronger predictors of PrU risk than was the Braden total score.8
With malnutrition as one of the most significant predictive factors in PrU risk, it is critical to determine whether discrepancies exist between the Braden nutrition subscale used primarily by nurses and the VANCS used by dietitians. Hence, the overall purpose of this study was to determine the level of agreement between the Braden nutrition subscale scores documented by nurses and the VANCS used by dietitians and examine the relationship of these assessments with PrU development.
Methods
The parent study was approved by the University of Florida Institutional Review Board before data collection. This secondary analysis of the parent study examined data already collected by Cowan and colleagues, which demonstrated the significance of nutritional compromise in PrU risk.
The de-identified data subset consisted of general demographics, hospital length of stay, specific diagnoses, Braden scores, PrU status, and registered dietician nutritional classification data from 213 acutely ill veterans admitted to North Florida/South Georgia Veterans Health System (NF/SGVHS) in Florida for more than 3 days between January and July 2008.8 The sample consisted of 100 veterans with nosocomial PrUs and 113 veterans without PrUs during their admission.
Scoring
Using the de-identified dataset, the variables of interest (VANCS, Braden nutrition subscale score, and the presence/absence of PrU) were coded. The VANCS was given a corresponding score ranging from 1 to 4 (1, severe nutritional compromise; 2, moderate nutritional compromise; 3, mild nutritional compromise; and 4, no nutritional compromise). The Braden nutrition subscale ranged from 1 to 4 (1 very poor nutrition; 2, probably inadequate nutrition; 3, adequate nutrition; and 4, excellent nutrition). PrU development was coded as 0, no PrU development and 1, PrU development. All nutritional assessments had been recorded in the electronic health record before any PrU reported in the parent study.
Statistical Analysis
After coding the variables of interest, the data were transferred into SAS v 9.4 (Cary, NC). The data collected compared VANCS and Braden nutrition subscale results. In addition, the authors examined the agreement between the score assigned to the VANCS and Braden nutrition subscale results with a weighted
Additionally, the authors computed sensitivity and specificity of the Braden nutrition subscale using the VANCS as the gold standard. The severe and moderately compromised categories of the VANCS combined to form the high-risk category, and the mild-to-no compromise categories were combined to form the low-risk category. The Braden nutrition subscale was similarly dichotomized with the very poor and probably inadequate intake forming the high-risk category and the adequate and excellent intake forming the low-risk category. Sensitivity and specificity of the Braden were then calculated.
Results
Nursing assessments using the Braden nutrition subscale were completed on 213 patients whose mean age (SD) was 71.0 (10.6) years. The VANCS documented by dietitians was completed on 205 patients. For 7 patients, a nutrition assessment was documented only by the Braden nutrition subscale and not the VANCS. Most of the patients were male (97%, n = 206), and white (81.4%, n = 171). The weighted
Landis and colleagues suggest that a
Figure 2 shows the percentage of patients who developed a PrU during hospitalization among different measures of Braden nutrition subscale vs VANCS. In Figure 2, nutritional categories 1, 2, and 3 correspond to very poor intake (Braden)/severe compromise (VANCS), probably inadequate intake (Braden)/moderate compromise (VANCS), and adequate intake (Braden)/mild compromise (VANCS), respectively. There were 3 patients who had a no compromise VANCS; none of these had a PrU, so their data are not represented in Figure 2.
Discussion
Findings from this study indicate that the VANCS documented by dietitians is superior in assessing nutritional risk and predicting the development of PrUs in acutely ill hospitalized veterans compared with the Braden nutrition subscale. This study also shows that the Braden nutrition subscale did not accurately predict PrU development in acutely ill veterans. This finding concurs with the Serpa and Santos study in which the Braden nutrition subscale scores were not predictive for PrU development in hospitalized patients.
One possible explanation for the findings in this study is that the nutrition subscale of the Braden tool asks the assessing clinician to evaluate the amount of food intake the patient is currently taking in for their usual meals. This assessment is highly subjective and speculative and does not account for recent intake fluctuations or weight loss. By comparison, the VANCS is more comprehensive in its ability to assess nutritional compromise based on multiple factors, such as recent weight loss, laboratory indices, body habitus, dentition, and swallowing ability.20 The National Pressure Ulcer Advisory Panel suggests that following an acute care admission, a patient receive a consult from a dietitian if the health care provider suspects that the patient may be nutritionally compromised.1 The study findings demonstrate the utility of the VANCS as predictive of PrU risk.
Unfortunately, the authors have learned that the VANCS may be phased out soon, and many VA facilities are no longer using it. Findings from this study and other recent scientific literature suggest that all inpatients may benefit from nutritional assessments by dietitians. When performed, dietitian assessments provide the basis for more accurate nursing assessment of nutritional risk and targeted interventions. Nursing professionals should be encouraged to review the dietitian assessment and consultation notes and to incorporate this information into a more comprehensive PrU prevention and treatment plan.
Interestingly, in spite of those assessed to have severe nutritional compromise by dietitian assessment (n = 39), very few of these patients (n = 4) had an ICD-9 diagnosis related to malnutrition (ICD-9 codes, 262, 273.8, 269.9, 263.9) entered in their chart for that hospitalization. This observation suggests that 88% of patients with severe nutritional compromise were not appropriately coded at discharge. Improper coding has implications for researchers using ICD-9 diagnosis codes at discharge for accurate analysis of risk factors as well as for health care providers who may look at coded diagnoses information in the charts when considering comorbid conditions for health management.
This study highlights the importance of nutritional status as a risk factor for PrU development. Reasons suggested for nutritional status seeming to be the most significant correlate to PrUs in the acute care setting include the following: decreased protein alters oncotic pressure, making tissue prone to edema; decreases in subcutaneous fat reduce protection from pressure effects; nutritional compromise alters cellular transport of nutrients and waste and makes tissue cells more vulnerable to deformation and physical stresses; and lactate (a by-product of anaerobic glycolysis) or any other metabolic by-product of malnutrition could cause biochemical stress, and tissue cells can die faster as a result of the increased plasma membrane permeability.7,24-26
Limitations
This study was limited to 1 sample of veterans hospitalized in the 2 acute care facilities of NF/SGVHS and the use of a retrospective chart review. As a result, further research is necessary to establish generalizability to other acute care settings and high-risk populations. In spite of these limitations, this and other studies highlight the need for revision of the Braden scale, specifically the nutritional subscale, to lessen the ambiguity seen between dietitian and nursing assessments while also increasing the accuracy in determining a patient’s nutrition risk of PrU development during hospitalization.
Conclusion
These findings provide evidence that dietitians’ documentation of the VANCS related to nutritional compromise are superior to current nutritional risk assessments using the Braden nutrition subscale in predicting PrU risk.
Acknowledgments
The authors acknowledge that this work was supported by the resources of the North Florida/South Georgia Veterans Health System in Gainesville, Florida, and in part by a Small Project Award from the VA Office of Nursing Services.
1. National Pressure Ulcer Advisory Panel, European Pressure Ulcer Advisory Panel, Pan Pacific Pressure Injury Alliance. Prevention and Treatment of Pressure Ulcers: Clinical Practice Guideline. http://www.npuap.org/resources/educational-and-clinical -resources/prevention-and-treatment-of-pressure -ulcers-clinical-practice-guideline. Updated 2014. Accessed November 7, 2016.
2. National Pressure Ulcer Advisory Panel, European Pressure Ulcer Advisory Panel, Pan Pacific Pressure Injury Alliance. Prevention and treatment of pressure ulcers: quick reference guide. http://www .npuap.org/wp-content/uploads/2014/08/Updated -10-16-14-Quick-Reference-Guide-DIGITAL-NPUAP-EPUAP-PPPIA-16Oct2014.pdf. Updated October 16, 2014. Accessed October 21, 2016.
3. Sullivan N. Preventing in-facility pressure ulcers. In: Agency for Healthcare Research and Quality. Making Health Care Safer II. An Updated Critical Analysis of the Evidence for Patient Safety Practices. Evidence Reports/Technology Assessments. http://www.ahrq.gov/sites/default/files/wysiwyg/research/findings/evidence-based-reports/services/quality/ptsafetyII-full.pdf:212-232. Published March 2013. Accessed October 21, 2016.
4. Russo CA, Steiner C, Spector W. Hospitalizations related to pressure ulcers among adults 18 years and older, 2006. In: Healthcare Cost and Utilization Project (HCUP) Statistical Briefs. http://www.ncbi .nlm.nih.gov/books/NBK54557. Published December 2008. Accessed October 21, 2016.
5. Spetz J, Brown DS, Aydin C, Donaldson N. The value of reducing hospital-acquired pressure ulcer prevalence: an illustrative analysis. J Nurs Adm. 2013;43(4):235-241.
6. Whittington KT, Briones R. National prevalence and incidence study: 6-year sequential acute care data. Adv Skin Wound Care. 2004;17(9):490-494.
7. Dorner B, Posthauer ME, Thomas D; National Pressure Ulcer Advisory Panel. The role of nutrition in pressure ulcer prevention and treatment: National Pressure Ulcer Advisory Panel white paper. http://www.npuap.org/wp-content/uploads/2012/03/Nutrition-White-Paper-Website-Version.pdf. Published 2009. Accessed November 7, 2016.
8. Cowan LJ, Stechmiller JK, Rowe M, Kairalla JA. Enhancing Braden pressure ulcer risk assessment in acutely ill adult veterans. Wound Repair Regen. 2012;20(2):137-148.
9. Correia MI, Hegazi RA, Higashiguchi T, et al. Evidence-based recommendations for addressing malnutrition in health care: an updated strategy from the feedM.E. Global Study Group. J Am Med Dir Assoc. 2014;15(8):544-550.
10. Malafarina V, Úriz-Otano F, Fernández-Catalán C, Tejedo-Flors D. Nutritional status and pressure ulcers. Risk assessment and estimation in older adults. J Am Geriatr Soc. 2014;62(6):1209-1210.
11. Posthauer ME, Banks M, Dorner B, Schols JM. The role of nutrition for pressure ulcer management: national pressure ulcer advisory panel, European pressure ulcer advisory panel, and pan pacific pressure injury alliance white paper. Adv Skin Wound Care. 2015;28(4):175-188.
12. Brito PA, de Vasconcelos Generoso S, Correia MI. Prevalence of pressure ulcers in hospitals in Brazil and association with nutritional status—a multicenter, cross-sectional study. Nutrition. 2013;29(4):646-649.
13. Coleman S, Gorecki C, Nelson EA, et al. Patient risk factors for pressure ulcer development: systematic review. Int J Nurs Stud. 2013;50(7):974-1003.
14. Bergstrom N, Braden BJ, Laguzza A, Holman V. The Braden Scale for predicting pressure sore risk. Nurs Res. 1987;36(4):205-210.
15. Ayello EA, Braden B. How and why to do pressure ulcer risk assessment. Adv Skin Wound Care. 2002;15(3):125-131.
16. Wang LH, Chen HL, Yan HY, et al. Inter-rater reliability of three most commonly used pressure ulcer risk assessment scales in clinical practice. Int Wound J. 2015;12(5):590-594.
17. Wilchesky M, Lungu O. Predictive and concurrent validity of the Braden scale in long-term care: a meta-analysis. Wound Repair Regen. 2015;23(1):44-56.
18. Kottner J, Dassen T. An interrater reliability study of the Braden scale in two nursing homes. Int J Nurs Stud. 2008;45(10):1501-1511.
19. Yatabe MS, Taguchi F, Ishida I, et al. Mini nutritional assessment as a useful method of predicting the development of pressure ulcers in elderly inpatients. J Am Geriatr Soc. 2013;61(10):1698-1704.
20. Hiller L, Lowery JC, Davis JA, Shore CJ, Striplin DT. Nutritional status classification in the Department of Veterans Affairs. J Am Diet Assoc. 2001;101(7):786-792.
21. U.S. Department of Veterans Affairs. VHA Handbook 1109.02. Clinical nutrition management. http://www.va.gov/vhapublications/ViewPublica tion.asp?pub_ID=2493. Published February 2012. Accessed October 21, 2016.
22. Landis JR, Koch GG. The measurement of observer agreement for categorical data. Biometrics. 1977;33(1):159-174.
23. Serpa LF, Santos VL. Validity of the Braden Nutrition Subscale in predicting pressure ulcer development. J Wound Ostomy Continence Nurs. 2014;41(5):436-443.
24. Reddy M, Gill SS, Rochon PA. Preventing pressure ulcers: a systematic review. JAMA. 2006;296(8):974-984.
25. Cooper KL. Evidence-based prevention of pressure ulcers in the intensive care unit. Crit Care Nurse. 2013;33(6):57-66.
26. Leopold E, Gefen A. Changes in permeability of the plasma membrane of myoblasts to fluorescent dyes with different molecular masses under sustained uniaxial stretching. Med Eng Phys. 2013;35(5):601-607.