User login
How Should the Treatment Costs of Distal Radius Fractures Be Measured?
Take-Home Points
- Physician fees, operating room costs, therapy costs, and missed work account for most (92%) of the costs in distal radius fractures.
- Indirect costs (especially missed work) contribute a significant amount to the total cost of injury.
- Patients continue to accrue costs up to 3-6 months post-injury.
- Implant costs make up only 6% of the total costs of operatively treated distal radius fractures.
Distal radius fractures (DRFs) account for 20% of all fractures seen in the emergency department, and are the most common fractures in all patients under age 75 years.1,2 Apart from causing pain and disability, DRFs have a large associated economic burden.3-6 In addition, over the past decade, the fixation technology used for DRF treatment has expanded rapidly and revolutionized operative management. With this expansion has come a growing body of high-level evidence guiding treatment decisions regarding patient outcomes.7-11 As operative treatment of these injuries has evolved, researchers have begun to critically evaluate both health outcomes and the cost-effectiveness of treatment choices.12,13
Determining the cost-effectiveness of any medical intervention requires an accurate and standardized method for measuring the total cost of a course of treatment. Although several studies have attempted to evaluate the treatment costs of DRFs,14-18 none has rigorously examined exactly what needs to be measured, and for how long, to accurately describe the overall cost. Many studies have examined only direct costs (treatment-related costs incurred in the hospital or clinic itself) and neglected indirect costs (eg, missed work, time in treatment, additional care requirements). As patient-reported disability from these injuries can be high,19-22 it is likely that the additional indirect costs, often borne by the patient, are correspondingly high. This relationship has been suggested by indirect data from large retrospective epidemiologic studies3-6 but has never been evaluated with primary data obtained in a prospective study.
Given these questions, we conducted an in-depth study of the treatment costs of these injuries to identify which factors should be captured, and for how long, to accurately describe the overall cost without missing any of the major cost-drivers. We hypothesized that indirect costs (particularly missed work) would be significant and variable cost-drivers in the overall economic impact of these injuries, and that direct prospective measurement of these costs would be the most reliable method for accurately assessing them. In short, this was a prospective, observational study of all the direct and indirect costs associated with treating DRFs. Its 2 main goals were to determine how much of the overall cost was attributable to indirect costs, and which cost factors should be measured, and for how long, to capture the true economic cost of these injuries.
Patients and Methods
Study Design
This prospective, observational study was approved by our hospital’s Institutional Review Board, and patients gave informed consent to participate. Patients with an isolated DRF that was treated either operatively or nonoperatively and followed at our hospital were eligible for the study. Treatment decisions for each patient were made by the treating surgeon and were based on injury characteristics. Patients with multiple concomitant injuries (polytrauma) were excluded. The AO/OTA (Arbeitsgemeinschaft für Osteosynthesefragen/Orthopaedic Trauma Association) classification system was used to grade all fractures.23
Patients were seen 2 weeks, 1 month, 3 months, 6 months, and 1 year after injury. Each time, clinical data (strength, range of motion, patient-rated outcome forms) and economic data were collected. A patient’s economic data were considered complete if the patient had full follow-up in our clinic up to 1 year after injury or, if applicable, the patient returned to work and had all recurring direct and indirect costs resolved. Costs were measured and calculated from the broadest possible perspective (overall societal costs) rather than from payer-specific perspectives (eg, institution costs, insurance costs).
Treatment and Rehabilitation Protocol
Each patient who underwent nonoperative treatment was placed in a molded sugar-tong splint with hand motion encouraged and followed in clinic. At 4 to 6 weeks, the splint was removed, and the patient was placed in a removable cock-up wrist splint for another 2 to 4 weeks. Throughout this period, the patient worked on elbow and finger motion with an occupational therapist (OT). On discontinuation of the wrist splint, the patient returned to the OT for gentle wrist motion and continuation of elbow and finger motion.
For each patient who underwent operative treatment, implant and approach were based on fracture pattern. Implants used included isolated Kirschner wires (K-wires), volar locked plates, dorsal plates, radial column plates, and ulnar plates. After fixation, the patient was placed in a well-padded volar splint and encouraged to start immediate finger motion. Ten to 14 days after surgery, the splint was removed, and the patient was referred to an OT for gentle wrist, finger, and elbow motion. Therapy was continued until wrist, finger, and elbow motion was full.
Direct Costs
Direct costs were obtained from hospital billing and collections records. Cost items measured included physician fees, imaging fees, inpatient bed fees (when applicable), operating room (OR) facility fees, implant costs, and OT costs. Whenever possible, the final amount collected (vs charged) was used for the cost, as this was thought to be the most reliable indicator of the real cost of an item. Total cost was obtained from ultimate collection/reimbursement for all physician, imaging, and OT fees.
In a few cases, ultimate amount collected was not in our system and instead was calculated by normalizing the charges based on internal departmental cost-to-charge ratios. Cost-to-charge ratios were used for OR/emergency department facility fees, inpatient bed fees, and implant costs.
Indirect Costs
Indirect costs were calculated from questionnaires completed by patients at initial enrollment and at each follow-up visit. The initial enrollment form captured basic demographic information, employment status and work type, and annual income. The follow-up form included questions about current work status, physical/occupational therapy frequency, and extra recurring expenses related to transportation, household chores, and personal care, among other items. Total recurring expenses from transportation, chores, and personal care were calculated by multiplying the weekly expenses listed at a given visit by the time since the previous visit.
Costs for missed work were estimated as a function of preinjury wages multiplied by decreased level of productivity and period of work missed. For a patient who indicated part-time work status, decreased level of productivity was calculated by dividing the patient’s weekly hours by 40 (assumes 40-hour week is full-time), which yielded a percentage of full-time capacity. The patient was also asked to indicate any change in work status, which allowed for an accurate accounting of how long the patient was away from work and how much the patient’s capacity was decreased, ultimately providing an estimate of total amount of work missed. Multiplying that period by annual preinjury wages gave the value used for total cost of missed work.
Results
Of the 82 patients enrolled in the study, 36 were treated operatively and 46 nonoperatively. Table 1 lists additional demographic information about the study population. 
Table 2 provides a full breakdown of costs. OT costs were similar between groups but proportionally made up 27% of the costs for the nonoperative group and 4.9% for the operative group. 
Indirect costs accounted for 28% of the total cost for the operative group and 36% for the nonoperative group. Missed work was the major contributor to overall indirect cost, accounting for 93% of all indirect costs. Additional transportation, household chores, and personal care costs accounted for 4.7%, 1.7%, and 0.8% of total indirect costs, respectively.
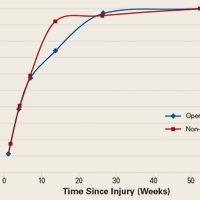
Of the nonoperatively treated patients who had been working before being injured, 25% missed at least some work. Except for 1 patient, all were back working full-time within 3 months after injury. Of the operatively treated patients who had been working before injury, 48% missed at least some work, and 24% were still missing at least some work between 3 and 6 months after injury. All patients in both groups were back working within 1 year after injury.
Indirect costs largely paralleled work status, with 50% of patients still incurring some costs up to 6 months after injury (Figure). 
Discussion
The drive to use evidence-based treatments in medicine has led to increased scrutiny of the benefits of novel treatments and technologies. However, in addition to carefully measuring clinical benefits, we must monitor costs. Implementation of new treatments based on small clinical advantages, without consideration of economic impact, will not be sustainable over the long term.
This study was not intended to report the “true” cost of treating these injuries, or to make direct comparisons between operative and nonoperative groups (regional and institutional costs and practices vary so much that no single-site study can report a meaningful number for cost). Furthermore, the observational (nonrandomized) nature of this study makes direct comparison of operative and nonoperative groups too confounded to draw conclusions. Simply, this study was conducted to help determine what needs to be measured, with the ultimate goal being to obtain a relatively reliable estimate of the total cost to society of a given injury and its treatment.
In this study, physician fees and facility fees were major direct expenses—not surprising given the value of physician time and OR time. In addition, OT was a fairly large direct-cost driver, particularly for nonoperative patients, for whom other costs were relatively low. This finding supports what has been reported in studies of the frequency and duration of therapy as potential targets for cost containment.24 Surprisingly, OT costs were lower for operatively (vs nonoperatively) treated patients. This finding may be attributable to earlier wrist motion in operatively treated patients (10-14 days) relative to nonoperatively treated patients (6-8 weeks), as earlier wrist motion may reduce stiffness and total need for therapy. Alternatively, the finding may be attributable to sampling error caused by difficulty in obtaining accurate OT costs, as some patients received therapy at multiple private offices, with records unavailable.
Although significant attention is often focused on implant costs, these actually comprised a relatively small portion (6%) of the total treatment costs for these injuries. However, implant costs vary significantly between institutions.
Indirect costs were a major factor, accounting for about one-third of total cost. Missed work was the single largest cost item in this study, comprising 93% of the indirect cost and 27% of the total cost. These findings suggest that the cost of missed work is crucial and should be measured in any study that compares the cost-effectiveness of different treatment modalities.
In orthopedic trauma, earlier return to work is often cited as a potential benefit of surgical intervention. However, without defining the exact economic impact of missed work, it is difficult to decide if earlier return to work justifies the added cost of surgery. The situation is further muddled by conflicting priorities, as the entities that bear the cost of missed work (patient, disability insurance) are often different from the entity that bears the cost of surgery (medical insurance). In the light of this complex decision-making with multiple and sometimes conflicting stakeholders, accurate understanding of the economic impact of missed work is paramount. Our data showed return to work took slightly longer for operatively (vs nonoperatively) treated patients, though we think this is more likely a result of higher injury severity than treatment choice.
Patients in both groups were still not back working up to 6 months after injury, indicating that return of function after these injuries is not as rapid as we might hope or expect, and may play a role in setting expectations during initial discussions with patients.
The major strength of this study is that it was the first of its kind to prospectively measure these costs at a single institution in order to make direct comparisons of different cost factors. Whenever possible, rather than relying on cost-to-charge ratio estimates, we analyzed costs obtained directly from collections reports, which improved the validity of the results generated. Missed work was captured by directly asking patients about work capacity, not by retrospectively reviewing disability applications, which for a variety of reasons often inaccurately reflects true work productivity. In addition, our final follow-up rate was relatively high (91%), which helped minimize bias. Although this study focused on DRFs, the hope is that these data can serve as a template for the kinds of factors that need to be measured to accurately describe the cost of many different upper extremity injuries. This idea, however, needs to be formally tested.
This study had several limitations. First, some costs (OR time, facility fees) still had to be estimated with cost-to-charge ratios—a less precise method. Second, measuring the societal cost of missed work is controversial. We calculated this cost by using standard economic techniques, valuing the decreased productivity period according to baseline salary, though the true “loss” to society is less clear. Third, our data represent the costs at one hospital in one city and might be very different at other institutions with different cost structures. Fourth, this study was observational (vs randomized) and subject to the usual bias of such studies, so conclusions between treatment choices and cost or clinical outcomes could not be drawn (which was not our intent in this study). Although these issues limited our ability to calculate the exact “cost” of these injuries, the relative impact of the different cost factors could be measured (which was our intent).
DRFs are common injuries that can have significant associated expenses, many of which were not captured in previous cost analyses. In the present study, we found that measuring physician, OR, therapy, and missed work costs for at least 6 months after injury was generally sufficient for accurate capture of major costs. We hope these data can help in planning studies of the treatment costs of upper extremity injuries. Only through accurate and conscientious data gathering can we evaluate the clinical and economic effects of novel technologies and ensure delivery of high-quality care while containing costs and improving efficiency.
Am J Orthop. 2017;46(1):E54-E59. Copyright Frontline Medical Communications Inc. 2017. All rights reserved.
1. Simic PM, Weiland AJ. Fractures of the distal aspect of the radius: changes in treatment over the past two decades. Instr Course Lect. 2003;52:185-195.
2. Chung KC, Spilson SV. The frequency and epidemiology of hand and forearm fractures in the United States. J Hand Surg Am. 2001;26(5):908-915.
3. Trybus M, Guzik P. The economic impact of hand injury [in Polish]. Chir Narzadow Ruchu Ortop Pol. 2003;68(4):269-273.
4. Dias JJ, Garcia-Elias M. Hand injury costs. Injury. 2006;37(11):1071-1077.
5. Wüthrich P. Epidemiology and socioeconomic significance of hand injuries [in German]. Z Unfallchir Versicherungsmed Berufskr. 1986;79(1):5-14.
6. de Putter CE, Selles RW, Polinder S, Panneman MJ, Hovius SE, van Beeck EF. Economic impact of hand and wrist injuries: health-care costs and productivity costs in a population-based study. J Bone Joint Surg Am. 2012;94(9):e56.
7. Wong TC, Chiu Y, Tsang WL, Leung WY, Yam SK, Yeung SH. Casting versus percutaneous pinning for extra-articular fractures of the distal radius in an elderly Chinese population: a prospective randomised controlled trial. J Hand Surg Eur Vol. 2010;35(3):202-208.
8. Krukhaug Y, Ugland S, Lie SA, Hove LM. External fixation of fractures of the distal radius: a randomized comparison of the Hoffman Compact II non-bridging fixator and the Dynawrist fixator in 75 patients followed for 1 year. Acta Orthop. 2009;80(1):104-108.
9. Xu GG, Chan SP, Puhaindran ME, Chew WY. Prospective randomised study of intra-articular fractures of the distal radius: comparison between external fixation and plate fixation. Ann Acad Med Singapore. 2009;38(7):600-606.
10. Egol K, Walsh M, Tejwani N, McLaurin T, Wynn C, Paksima N. Bridging external fixation and supplementary Kirschner-wire fixation versus volar locked plating for unstable fractures of the distal radius: a randomised, prospective trial. J Bone Joint Surg Br. 2008;90(9):1214-1221.
11. Wei DH, Raizman NM, Bottino CJ, Jobin CM, Strauch RJ, Rosenwasser MP. Unstable distal radial fractures treated with external fixation, a radial column plate, or a volar plate. A prospective randomized trial. J Bone Joint Surg Am. 2009;91(7):1568-1577.
12. Shauver MJ, Clapham PJ, Chung KC. An economic analysis of outcomes and complications of treating distal radius fractures in the elderly. J Hand Surg Am. 2011;36(12):1912-1918.e1-e3.
13. Espinosa Gutiérrez A, Moreno Velázquez A. Cost–benefit of various treatments for patients with distal radius fracture [in Spanish]. Acta Ortop Mex. 2010;24(2):61-65.
14. Shyamalan G, Theokli C, Pearse Y, Tennent D. Volar locking plates versus Kirschner wires for distal radial fractures—a cost analysis study. Injury. 2009;40(12):1279-1281.
15. Kakarlapudi TK, Santini A, Shahane SA, Douglas D. The cost of treatment of distal radial fractures. Injury. 2000;31(4):229-232.
16. Do TT, Strub WM, Foad SL, Mehlman CT, Crawford AH. Reduction versus remodeling in pediatric distal forearm fractures: a preliminary cost analysis. J Pediatr Orthop B. 2003;12(2):109-115.
17. Miller BS, Taylor B, Widmann RF, Bae DS, Snyder BD, Waters PM. Cast immobilization versus percutaneous pin fixation of displaced distal radius fractures in children: a prospective, randomized study. J Pediatr Orthop. 2005;25(4):490-494.
18. Shauver MJ, Yin H, Banerjee M, Chung KC. Current and future national costs to Medicare for the treatment of distal radius fracture in the elderly. J Hand Surg Am. 2011;36(8):1282-1287.
19. Handoll HH, Madhok R, Howe TE. Rehabilitation for distal radial fractures in adults. Cochrane Database Syst Rev. 2006;(3):CD003324.
20. Handoll HH, Huntley JS, Madhok R. External fixation versus conservative treatment for distal radial fractures in adults. Cochrane Database Syst Rev. 2007;(3):CD006194.
21. Handoll HH, Vaghela MV, Madhok R. Percutaneous pinning for treating distal radial fractures in adults. Cochrane Database Syst Rev. 2007;(3):CD006080.
22. Handoll HH, Huntley JS, Madhok R. Different methods of external fixation for treating distal radial fractures in adults. Cochrane Database Syst Rev. 2008;(1):CD006522.
23. Marsh JL, Slongo TF, Agel J, et al. Fracture and dislocation classification compendium—2007: Orthopaedic Trauma Association classification, database and outcomes committee. J Orthop Trauma. 2007;21(10 suppl):S1-S133.
24. Souer JS, Buijze G, Ring D. A prospective randomized controlled trial comparing occupational therapy with independent exercises after volar plate fixation of a fracture of the distal part of the radius. J Bone Joint Surg Am. 2011;93(19):1761-1766.
Take-Home Points
- Physician fees, operating room costs, therapy costs, and missed work account for most (92%) of the costs in distal radius fractures.
- Indirect costs (especially missed work) contribute a significant amount to the total cost of injury.
- Patients continue to accrue costs up to 3-6 months post-injury.
- Implant costs make up only 6% of the total costs of operatively treated distal radius fractures.
Distal radius fractures (DRFs) account for 20% of all fractures seen in the emergency department, and are the most common fractures in all patients under age 75 years.1,2 Apart from causing pain and disability, DRFs have a large associated economic burden.3-6 In addition, over the past decade, the fixation technology used for DRF treatment has expanded rapidly and revolutionized operative management. With this expansion has come a growing body of high-level evidence guiding treatment decisions regarding patient outcomes.7-11 As operative treatment of these injuries has evolved, researchers have begun to critically evaluate both health outcomes and the cost-effectiveness of treatment choices.12,13
Determining the cost-effectiveness of any medical intervention requires an accurate and standardized method for measuring the total cost of a course of treatment. Although several studies have attempted to evaluate the treatment costs of DRFs,14-18 none has rigorously examined exactly what needs to be measured, and for how long, to accurately describe the overall cost. Many studies have examined only direct costs (treatment-related costs incurred in the hospital or clinic itself) and neglected indirect costs (eg, missed work, time in treatment, additional care requirements). As patient-reported disability from these injuries can be high,19-22 it is likely that the additional indirect costs, often borne by the patient, are correspondingly high. This relationship has been suggested by indirect data from large retrospective epidemiologic studies3-6 but has never been evaluated with primary data obtained in a prospective study.
Given these questions, we conducted an in-depth study of the treatment costs of these injuries to identify which factors should be captured, and for how long, to accurately describe the overall cost without missing any of the major cost-drivers. We hypothesized that indirect costs (particularly missed work) would be significant and variable cost-drivers in the overall economic impact of these injuries, and that direct prospective measurement of these costs would be the most reliable method for accurately assessing them. In short, this was a prospective, observational study of all the direct and indirect costs associated with treating DRFs. Its 2 main goals were to determine how much of the overall cost was attributable to indirect costs, and which cost factors should be measured, and for how long, to capture the true economic cost of these injuries.
Patients and Methods
Study Design
This prospective, observational study was approved by our hospital’s Institutional Review Board, and patients gave informed consent to participate. Patients with an isolated DRF that was treated either operatively or nonoperatively and followed at our hospital were eligible for the study. Treatment decisions for each patient were made by the treating surgeon and were based on injury characteristics. Patients with multiple concomitant injuries (polytrauma) were excluded. The AO/OTA (Arbeitsgemeinschaft für Osteosynthesefragen/Orthopaedic Trauma Association) classification system was used to grade all fractures.23
Patients were seen 2 weeks, 1 month, 3 months, 6 months, and 1 year after injury. Each time, clinical data (strength, range of motion, patient-rated outcome forms) and economic data were collected. A patient’s economic data were considered complete if the patient had full follow-up in our clinic up to 1 year after injury or, if applicable, the patient returned to work and had all recurring direct and indirect costs resolved. Costs were measured and calculated from the broadest possible perspective (overall societal costs) rather than from payer-specific perspectives (eg, institution costs, insurance costs).
Treatment and Rehabilitation Protocol
Each patient who underwent nonoperative treatment was placed in a molded sugar-tong splint with hand motion encouraged and followed in clinic. At 4 to 6 weeks, the splint was removed, and the patient was placed in a removable cock-up wrist splint for another 2 to 4 weeks. Throughout this period, the patient worked on elbow and finger motion with an occupational therapist (OT). On discontinuation of the wrist splint, the patient returned to the OT for gentle wrist motion and continuation of elbow and finger motion.
For each patient who underwent operative treatment, implant and approach were based on fracture pattern. Implants used included isolated Kirschner wires (K-wires), volar locked plates, dorsal plates, radial column plates, and ulnar plates. After fixation, the patient was placed in a well-padded volar splint and encouraged to start immediate finger motion. Ten to 14 days after surgery, the splint was removed, and the patient was referred to an OT for gentle wrist, finger, and elbow motion. Therapy was continued until wrist, finger, and elbow motion was full.
Direct Costs
Direct costs were obtained from hospital billing and collections records. Cost items measured included physician fees, imaging fees, inpatient bed fees (when applicable), operating room (OR) facility fees, implant costs, and OT costs. Whenever possible, the final amount collected (vs charged) was used for the cost, as this was thought to be the most reliable indicator of the real cost of an item. Total cost was obtained from ultimate collection/reimbursement for all physician, imaging, and OT fees.
In a few cases, ultimate amount collected was not in our system and instead was calculated by normalizing the charges based on internal departmental cost-to-charge ratios. Cost-to-charge ratios were used for OR/emergency department facility fees, inpatient bed fees, and implant costs.
Indirect Costs
Indirect costs were calculated from questionnaires completed by patients at initial enrollment and at each follow-up visit. The initial enrollment form captured basic demographic information, employment status and work type, and annual income. The follow-up form included questions about current work status, physical/occupational therapy frequency, and extra recurring expenses related to transportation, household chores, and personal care, among other items. Total recurring expenses from transportation, chores, and personal care were calculated by multiplying the weekly expenses listed at a given visit by the time since the previous visit.
Costs for missed work were estimated as a function of preinjury wages multiplied by decreased level of productivity and period of work missed. For a patient who indicated part-time work status, decreased level of productivity was calculated by dividing the patient’s weekly hours by 40 (assumes 40-hour week is full-time), which yielded a percentage of full-time capacity. The patient was also asked to indicate any change in work status, which allowed for an accurate accounting of how long the patient was away from work and how much the patient’s capacity was decreased, ultimately providing an estimate of total amount of work missed. Multiplying that period by annual preinjury wages gave the value used for total cost of missed work.
Results
Of the 82 patients enrolled in the study, 36 were treated operatively and 46 nonoperatively. Table 1 lists additional demographic information about the study population.
Table 2 provides a full breakdown of costs. OT costs were similar between groups but proportionally made up 27% of the costs for the nonoperative group and 4.9% for the operative group.
Indirect costs accounted for 28% of the total cost for the operative group and 36% for the nonoperative group. Missed work was the major contributor to overall indirect cost, accounting for 93% of all indirect costs. Additional transportation, household chores, and personal care costs accounted for 4.7%, 1.7%, and 0.8% of total indirect costs, respectively.
Of the nonoperatively treated patients who had been working before being injured, 25% missed at least some work. Except for 1 patient, all were back working full-time within 3 months after injury. Of the operatively treated patients who had been working before injury, 48% missed at least some work, and 24% were still missing at least some work between 3 and 6 months after injury. All patients in both groups were back working within 1 year after injury.
Indirect costs largely paralleled work status, with 50% of patients still incurring some costs up to 6 months after injury (Figure).
Discussion
The drive to use evidence-based treatments in medicine has led to increased scrutiny of the benefits of novel treatments and technologies. However, in addition to carefully measuring clinical benefits, we must monitor costs. Implementation of new treatments based on small clinical advantages, without consideration of economic impact, will not be sustainable over the long term.
This study was not intended to report the “true” cost of treating these injuries, or to make direct comparisons between operative and nonoperative groups (regional and institutional costs and practices vary so much that no single-site study can report a meaningful number for cost). Furthermore, the observational (nonrandomized) nature of this study makes direct comparison of operative and nonoperative groups too confounded to draw conclusions. Simply, this study was conducted to help determine what needs to be measured, with the ultimate goal being to obtain a relatively reliable estimate of the total cost to society of a given injury and its treatment.
In this study, physician fees and facility fees were major direct expenses—not surprising given the value of physician time and OR time. In addition, OT was a fairly large direct-cost driver, particularly for nonoperative patients, for whom other costs were relatively low. This finding supports what has been reported in studies of the frequency and duration of therapy as potential targets for cost containment.24 Surprisingly, OT costs were lower for operatively (vs nonoperatively) treated patients. This finding may be attributable to earlier wrist motion in operatively treated patients (10-14 days) relative to nonoperatively treated patients (6-8 weeks), as earlier wrist motion may reduce stiffness and total need for therapy. Alternatively, the finding may be attributable to sampling error caused by difficulty in obtaining accurate OT costs, as some patients received therapy at multiple private offices, with records unavailable.
Although significant attention is often focused on implant costs, these actually comprised a relatively small portion (6%) of the total treatment costs for these injuries. However, implant costs vary significantly between institutions.
Indirect costs were a major factor, accounting for about one-third of total cost. Missed work was the single largest cost item in this study, comprising 93% of the indirect cost and 27% of the total cost. These findings suggest that the cost of missed work is crucial and should be measured in any study that compares the cost-effectiveness of different treatment modalities.
In orthopedic trauma, earlier return to work is often cited as a potential benefit of surgical intervention. However, without defining the exact economic impact of missed work, it is difficult to decide if earlier return to work justifies the added cost of surgery. The situation is further muddled by conflicting priorities, as the entities that bear the cost of missed work (patient, disability insurance) are often different from the entity that bears the cost of surgery (medical insurance). In the light of this complex decision-making with multiple and sometimes conflicting stakeholders, accurate understanding of the economic impact of missed work is paramount. Our data showed return to work took slightly longer for operatively (vs nonoperatively) treated patients, though we think this is more likely a result of higher injury severity than treatment choice.
Patients in both groups were still not back working up to 6 months after injury, indicating that return of function after these injuries is not as rapid as we might hope or expect, and may play a role in setting expectations during initial discussions with patients.
The major strength of this study is that it was the first of its kind to prospectively measure these costs at a single institution in order to make direct comparisons of different cost factors. Whenever possible, rather than relying on cost-to-charge ratio estimates, we analyzed costs obtained directly from collections reports, which improved the validity of the results generated. Missed work was captured by directly asking patients about work capacity, not by retrospectively reviewing disability applications, which for a variety of reasons often inaccurately reflects true work productivity. In addition, our final follow-up rate was relatively high (91%), which helped minimize bias. Although this study focused on DRFs, the hope is that these data can serve as a template for the kinds of factors that need to be measured to accurately describe the cost of many different upper extremity injuries. This idea, however, needs to be formally tested.
This study had several limitations. First, some costs (OR time, facility fees) still had to be estimated with cost-to-charge ratios—a less precise method. Second, measuring the societal cost of missed work is controversial. We calculated this cost by using standard economic techniques, valuing the decreased productivity period according to baseline salary, though the true “loss” to society is less clear. Third, our data represent the costs at one hospital in one city and might be very different at other institutions with different cost structures. Fourth, this study was observational (vs randomized) and subject to the usual bias of such studies, so conclusions between treatment choices and cost or clinical outcomes could not be drawn (which was not our intent in this study). Although these issues limited our ability to calculate the exact “cost” of these injuries, the relative impact of the different cost factors could be measured (which was our intent).
DRFs are common injuries that can have significant associated expenses, many of which were not captured in previous cost analyses. In the present study, we found that measuring physician, OR, therapy, and missed work costs for at least 6 months after injury was generally sufficient for accurate capture of major costs. We hope these data can help in planning studies of the treatment costs of upper extremity injuries. Only through accurate and conscientious data gathering can we evaluate the clinical and economic effects of novel technologies and ensure delivery of high-quality care while containing costs and improving efficiency.
Am J Orthop. 2017;46(1):E54-E59. Copyright Frontline Medical Communications Inc. 2017. All rights reserved.
1. Simic PM, Weiland AJ. Fractures of the distal aspect of the radius: changes in treatment over the past two decades. Instr Course Lect. 2003;52:185-195.
2. Chung KC, Spilson SV. The frequency and epidemiology of hand and forearm fractures in the United States. J Hand Surg Am. 2001;26(5):908-915.
3. Trybus M, Guzik P. The economic impact of hand injury [in Polish]. Chir Narzadow Ruchu Ortop Pol. 2003;68(4):269-273.
4. Dias JJ, Garcia-Elias M. Hand injury costs. Injury. 2006;37(11):1071-1077.
5. Wüthrich P. Epidemiology and socioeconomic significance of hand injuries [in German]. Z Unfallchir Versicherungsmed Berufskr. 1986;79(1):5-14.
6. de Putter CE, Selles RW, Polinder S, Panneman MJ, Hovius SE, van Beeck EF. Economic impact of hand and wrist injuries: health-care costs and productivity costs in a population-based study. J Bone Joint Surg Am. 2012;94(9):e56.
7. Wong TC, Chiu Y, Tsang WL, Leung WY, Yam SK, Yeung SH. Casting versus percutaneous pinning for extra-articular fractures of the distal radius in an elderly Chinese population: a prospective randomised controlled trial. J Hand Surg Eur Vol. 2010;35(3):202-208.
8. Krukhaug Y, Ugland S, Lie SA, Hove LM. External fixation of fractures of the distal radius: a randomized comparison of the Hoffman Compact II non-bridging fixator and the Dynawrist fixator in 75 patients followed for 1 year. Acta Orthop. 2009;80(1):104-108.
9. Xu GG, Chan SP, Puhaindran ME, Chew WY. Prospective randomised study of intra-articular fractures of the distal radius: comparison between external fixation and plate fixation. Ann Acad Med Singapore. 2009;38(7):600-606.
10. Egol K, Walsh M, Tejwani N, McLaurin T, Wynn C, Paksima N. Bridging external fixation and supplementary Kirschner-wire fixation versus volar locked plating for unstable fractures of the distal radius: a randomised, prospective trial. J Bone Joint Surg Br. 2008;90(9):1214-1221.
11. Wei DH, Raizman NM, Bottino CJ, Jobin CM, Strauch RJ, Rosenwasser MP. Unstable distal radial fractures treated with external fixation, a radial column plate, or a volar plate. A prospective randomized trial. J Bone Joint Surg Am. 2009;91(7):1568-1577.
12. Shauver MJ, Clapham PJ, Chung KC. An economic analysis of outcomes and complications of treating distal radius fractures in the elderly. J Hand Surg Am. 2011;36(12):1912-1918.e1-e3.
13. Espinosa Gutiérrez A, Moreno Velázquez A. Cost–benefit of various treatments for patients with distal radius fracture [in Spanish]. Acta Ortop Mex. 2010;24(2):61-65.
14. Shyamalan G, Theokli C, Pearse Y, Tennent D. Volar locking plates versus Kirschner wires for distal radial fractures—a cost analysis study. Injury. 2009;40(12):1279-1281.
15. Kakarlapudi TK, Santini A, Shahane SA, Douglas D. The cost of treatment of distal radial fractures. Injury. 2000;31(4):229-232.
16. Do TT, Strub WM, Foad SL, Mehlman CT, Crawford AH. Reduction versus remodeling in pediatric distal forearm fractures: a preliminary cost analysis. J Pediatr Orthop B. 2003;12(2):109-115.
17. Miller BS, Taylor B, Widmann RF, Bae DS, Snyder BD, Waters PM. Cast immobilization versus percutaneous pin fixation of displaced distal radius fractures in children: a prospective, randomized study. J Pediatr Orthop. 2005;25(4):490-494.
18. Shauver MJ, Yin H, Banerjee M, Chung KC. Current and future national costs to Medicare for the treatment of distal radius fracture in the elderly. J Hand Surg Am. 2011;36(8):1282-1287.
19. Handoll HH, Madhok R, Howe TE. Rehabilitation for distal radial fractures in adults. Cochrane Database Syst Rev. 2006;(3):CD003324.
20. Handoll HH, Huntley JS, Madhok R. External fixation versus conservative treatment for distal radial fractures in adults. Cochrane Database Syst Rev. 2007;(3):CD006194.
21. Handoll HH, Vaghela MV, Madhok R. Percutaneous pinning for treating distal radial fractures in adults. Cochrane Database Syst Rev. 2007;(3):CD006080.
22. Handoll HH, Huntley JS, Madhok R. Different methods of external fixation for treating distal radial fractures in adults. Cochrane Database Syst Rev. 2008;(1):CD006522.
23. Marsh JL, Slongo TF, Agel J, et al. Fracture and dislocation classification compendium—2007: Orthopaedic Trauma Association classification, database and outcomes committee. J Orthop Trauma. 2007;21(10 suppl):S1-S133.
24. Souer JS, Buijze G, Ring D. A prospective randomized controlled trial comparing occupational therapy with independent exercises after volar plate fixation of a fracture of the distal part of the radius. J Bone Joint Surg Am. 2011;93(19):1761-1766.