User login
Less is more in PET-negative, advanced HL
MADRID—Patients with advanced Hodgkin lymphoma (HL) who are PET-negative after initial treatment with 2 cycles of eBEACOPP* should only receive 2 additional cycles of the therapy, new research suggests.
In the HD18 trial, PET-2-negative patients who received 4 cycles of eBEACOPP had non-inferior progression-free survival (PFS) and significantly better overall survival (OS) than PET-2-negative patients who received 6 or 8 cycles of the treatment.
Patients who received 4 cycles also had less severe toxicity and fewer second neoplasms than patients who received more cycles of eBEACOPP.
“When balancing efficacy and safety, results compare favorably with any other published treatment strategy so far,” said Peter Borchmann, MD, of University Hospital of Cologne in Germany.
“That’s why we recommend treatment with PET-2-guided eBEACOPP for patients with newly diagnosed, advanced-stage Hodgkin lymphoma.”
Dr Borchmann presented results from HD18 at the 22nd Congress of the European Hematology Association (EHA) as abstract S150.
Patients and treatment
Dr Borchmann and his colleagues set out to determine if they could decrease the number of eBEACOPP cycles in patients with negative PET-2 without compromising treatment efficacy.
From May 2008 to July 2014, the researchers recruited 2101 patients with newly diagnosed, advanced-stage HL.
Patients who were PET-negative after 2 cycles of eBEACOPP (n=1005) were initially randomized to receive 6 additional cycles of eBEACOPP or 2 additional cycles—a total of 8 cycles or 4 cycles, respectively. The protocol was later amended (in June 2011), and the total number of cycles in the standard therapy arm was reduced to 6.
There were 504 patients in the standard therapy arm—288 who received 8 cycles of eBEACOPP and 216 who received 6 cycles. There were 501 patients who received 4 cycles of eBEACOPP.
Sixteen patients in the standard therapy arm and 17 in the 4-cycle arm also received radiotherapy.
The median age was 32 (range, 18-60) in the standard therapy arm and 33 (range, 18-60) in the 4-cycle arm. Sixty-three percent and 62% of patients, respectively, were male.
Eight percent of patients in both arms had Ann Arbor stage IIB disease. Fifty-seven percent in the standard therapy arm and 55% in the 4-cycle arm had stage IIIA/B. And 35% and 36%, respectively, had stage IVA/B disease.
Thirty-five percent of patients in both arms had an IPS stage of 0-1. Fifty-one percent in the standard therapy arm and 52% in the 4-cycle arm had an IPS stage of 2-3. And 14% in both arms had an IPS stage of 4-7.
The median duration of therapy was 173 days (range, 41-266) for patients randomized to receive 8 cycles of eBEACOPP, 129 days (range, 35-178) in patients randomized to receive 6 cycles, and 85 days (range, 42-133) in patients randomized to receive 4 cycles.
One patient in the 6-cycle group received more than 6 cycles, and 6 patients in the 4-cycle arm received more than 4 cycles.
PFS and OS
The median follow-up was 55 months. The estimated 3-year PFS was 92.3% in the standard therapy arm and 94.8% in the 4-cycle arm. The estimated 5-year PFS was 91.2% and 91.8%, respectively. The hazard ratio was 0.88.
“[Based on these data,] we can conclude that 4 cycles are as effective as 6 or 8 cycles,” Dr Borchmann said.
The estimated 3-year OS was 95.9% in the standard therapy arm and 98.7% in the 4-cycle arm. The estimated 5-year OS was 95.4% and 97.6%, respectively. The hazard ratio was 0.36 (P=0.006).
Toxicity and second neoplasms
Grade 3/4 organ toxicity occurred in 22% of patients in the 8-cycle group, 13% in the 6-cycle group, and 8% in the 4-cycle group. Grade 4 anemia, thrombocytopenia, or infection occurred in 59%, 53%, and 38%, respectively.
Treatment-related morbidity occurred in 66% of patients in the 8-cycle group, 61% in the 6-cycle group, and 41% in the 4-cycle group.
Eighteen patients in the standard therapy arm had second neoplasms—8 with acute myeloid leukemia (AML) or myelodysplastic syndromes (MDS), 5 with non-Hodgkin lymphoma (NHL), and 5 with solid tumors.
Thirteen patients in the 4-cycle arm had second neoplasms—2 with AML/MDS, 8 with NHL, and 3 with solid tumors.
Causes of death
The cause of death was HL for 0.6% of patients (n=3) in the standard therapy arm and for 0.8% of patients (n=4) in the 4-cycle arm.
The cause of death was second malignancy for 2.2% of patients (n=11) in the standard therapy arm. Five patients died of AML, 3 of NHL, and 3 of solid tumor malignancies.
One patient (0.2%) in the 4-cycle arm died as a result of a second malignancy, which was AML.
Toxicity related to study treatment was the cause of death for 1.2% (n=6) of patients in the standard therapy arm. Five of the patients died of infection, and the sixth died of ischemic stroke.
None of the patients in the 4-cycle arm died of toxicity related to study treatment.
Other causes of death included toxicity of salvage treatment (0.4%, n=2 in both arms), other disease (0.2%, n=1 in both arms), accident (1 patient [0.2%] in the 4-cycle arm), and unknown cause (2 patients [0.4%] in the standard arm).
“[With 4 cycles of therapy,] we had a significant and very relevant reduction of severe, acute hematological and non-hematological toxicities, and this was accompanied by a relevant reduction of mortality for other reasons than HL,” Dr Borchmann said. “And we’ve almost eliminated HL as a cause of death in this trial.” ![]()
*dose-escalated bleomycin, etoposide, doxorubicin, cyclophosphamide, vincristine, procarbazine, and prednisone
Chemo-free triplet produces ‘favorable’ results in advanced disease

LUGANO, SWITZERLAND—A chemotherapy-free combination regimen has demonstrated “favorable” safety and efficacy in patients with advanced chronic lymphocytic leukemia/small lymphocytic lymphoma (CLL/SLL) and non-Hodgkin lymphoma (NHL), according to researchers.
They found that treatment with ublituximab, umbralisib, and ibrutinib produced responses in patients with CLL/SLL, marginal zone lymphoma (MZL), mantle cell lymphoma (MCL), follicular lymphoma (FL), and diffuse large B-cell lymphoma (DLBCL).
Many of these patients are still receiving the combination, some of them beyond 1 year, said Lorretta Nastoupil, MD, of MD Anderson Cancer Center in Houston, Texas.
She presented results with the treatment at the 14th International Conference on Malignant Lymphoma (ICML).
The research was sponsored by TG Therapeutics, the company developing ublituximab (TG-1101) and umbralisib (TGR-1202).
Patients and treatment
Dr Nastoupil presented data on 38 patients—20 with CLL/SLL, and 18 with NHL. Three of the CLL/SLL patients were treatment-naïve. The rest had relapsed/refractory disease.
All NHL patients had relapsed/refractory disease—6 with DLBCL, 6 with FL, 4 with MCL, and 2 with MZL.
For the entire cohort, the median age was 65 (range, 32-85), and most patients (n=29) were male. They had received a median of 3 prior treatment regimens (range, 0-6).
In this trial, the patients received:
- Ublituximab at 900 mg
- Ibrutinib at 420 mg (CLL/SLL) or 560 mg (NHL)
- Umbralisib at 400 mg, 600 mg, or 800 mg.
Eighty-one percent of patients have been on study for more than 6 months. The median time on study is 11.1 months (range, 0.4 to 30+ months).
Safety
There was 1 dose-limiting toxicity in the CLL cohort (umbralisib at 400 mg)—reactivated varicella zoster. And 2 patients discontinued treatment due to an adverse event (AE)—1 due to sepsis and 1 due to pneumonia.
Neutropenia (18%) and pneumonia (11%) were the only grade 3/4 AEs that occurred in more than 10% of patients. Other grade 3/4 AEs included thrombocytopenia (8%), diarrhea (3%), dizziness (3%), pyrexia (3%), rash (3%), anemia (3%), dyspnea (3%), and stomatitis (3%).
The most common AEs of any grade were diarrhea (47%), fatigue (47%), dizziness (37%), insomnia (34%), nausea (34%), neutropenia (32%), cough (32%), and infusion-related reactions (32%).
Efficacy
Thirty-six patients were evaluable for efficacy—19 with CLL/SLL and 17 with NHL patients. Two patients discontinued treatment before the first efficacy assessment—1 due to pneumonia and 1 at investigator discretion.
For the entire cohort, the overall response rate (ORR) was 83%.
In the CLL/SLL cohort, the ORR was 100% (19/19), and the complete response (CR) rate was 32% (n=6). However, 4 of the 6 CRs are pending bone marrow confirmation.
Dr Nastoupil noted that 8 of the CLL patients had a 17p and/or 11q deletion, and 3 had previously received treatment with a BTK and/or PI3Kδ inhibitor.
One patient who was refractory to both idelalisib and ibrutinib achieved a CR with the triplet regimen, and this response has been ongoing for more than 1.5 years.
Among patients with NHL, the ORR was 100% in patients with MZL (2/2) and MCL (4/4). The ORR was 80% (4/5) in FL patients, and 17% (1/6) in DLBCL patients.
The CR rate was 50% in patients with MZL (1/2) and MCL (2/4) and 20% in patients with FL (1/5).
Dr Nastoupil pointed out that the FL patients were heavily pretreated. Two of them had received an autologous stem cell transplant, 1 was refractory to prior ibrutinib treatment, and 1 had received 5 prior lines of rituximab-based therapy.
She also noted that the DLBCL patients had a median of 4 prior therapies, and 4 of these patients had non-GCB DLBCL, including the only patient who responded to the triplet.
“[T]he combination of ublituximab, umbralisib, and ibrutinib in advanced CLL and NHL demonstrated a favorable toxicity profile as well as favorable efficacy,” Dr Nastoupil said in closing.
“[This] suggests umbralisib may be safely combined with other targeted agents to overcome mechanisms of resistance.” ![]()
Inhibitor elicits responses in heavily pretreated FL, DLBCL
LUGANO, SWITZERLAND—Interim results of a phase 2 trial suggest tazemetostat can be effective in patients with heavily pretreated, relapsed or refractory non-Hodgkin lymphoma.
The EZH2 inhibitor produced the highest overall response rate in patients with EZH2-mutated follicular lymphoma (FL), followed by EZH2-mutated diffuse large B-cell lymphoma (DLBCL).
However, the drug also produced complete responses in FL and DLBCL patients with wild-type EZH2.
“If we had focused [only] on patients with EZH2 mutations, we would have missed those other complete responders in the wild-type setting,” said study investigator Franck Morschhauser, MD, PhD, of Centre Hospitalier Régional Universitaire de Lille in France.
He presented results of the trial* during the plenary session of the 14th International Conference on Malignant Lymphoma (ICML). The research was sponsored by Epizyme, the company developing tazemetostat.
The trial enrolled patients with relapsed or refractory DLBCL or FL who had received at least 2 prior therapies. The patients received tazemetostat at 800 mg twice daily until disease progression or study withdrawal.
Efficacy in FL
Dr Morschhauser presented efficacy data on 67 patients with FL. Thirteen had EZH2 mutations, and 54 had wild-type EZH2. The median age was 62 in the mutated group and 61 in the wild-type group.
Both groups had a median of 4 prior lines of therapy. Fifty-four percent of EZH2-mutated patients were refractory to their last treatment, as were 48% of wild-type patients.
The median time from diagnosis was 7.4 years in mutated patients and 4.9 years in wild-type patients. The median time from last therapy was 13 weeks and 41.3 weeks, respectively.
The overall response rate was 92% (12/13) in EZH2-mutated patients and 26% (14/54) in wild-type patients. The complete response rates were 8% (n=1) and 6% (n=3), respectively.
The median time to first response was 11.9 weeks and 15.2 weeks, respectively.
None of the EZH2-mutated patients have progressed, but 13 (24%) wild-type patients have.
Forty-eight percent of all FL patients remain on study. One EZH2-mutated patient with stable disease is still on study, as are 23 wild-type patients with stable disease.
Efficacy in DLBCL
Dr Morschhauser presented data on 137 patients with DLBCL, 17 with EZH2 mutations and 120 with wild-type EZH2. The median age was 61 in the mutated group and 69 in the wild-type group.
Both groups had a median of 3 prior lines of therapy. Eighty-two percent of EZH2-mutated patients were refractory to their last treatment, as were 63% of wild-type patients.
The median time from diagnosis was 1 year in mutated patients and 2 years in wild-type patients. The median time from last therapy was 8.6 weeks and 11.6 weeks, respectively.
The overall response rate was 29% (5/17) in EZH2-mutated patients and 15% (18/119) in wild-type patients. The complete response rates were 0% (n=0) and 8% (n=10), respectively.
The median time to first response was 8.3 weeks and 8.5 weeks, respectively.
Six (35%) of the EZH2-mutated patients have progressed, as have 60 (50%) wild-type patients.
Twelve percent of all DLBCL patients remain on study. One EZH2-mutated patient with stable disease is still on therapy, as are 4 wild-type patients with stable disease.
Predictors of response
Dr Morschhauser and his colleagues performed next-generation sequencing of samples from 92 patients in an attempt to identify predictors of response to tazemetostat.
The data suggested that EZH2 and MYD88 activating mutations are positive predictors of response, and negative predictors include MYC, TP53, and HIST1H1E.
Safety
Safety data were available for 210 patients. The overall rate of treatment-related adverse events (AEs) was 59%, the rate of grade 3 or higher treatment-related AEs was 18%, and the rate of serious treatment-related AEs was 10%.
There were treatment-related AEs leading to dose interruption (15%), dose reduction (3%), and discontinuation of tazemetostat (2%).
The most common treatment-related AEs were nausea (14%), thrombocytopenia (13%), anemia (10%), neutropenia (9%), diarrhea (8%), asthenia (8%), and fatigue (7%).
Dr Morschhauser said these results “confirm that tazemetostat is quite safe” in this patient population, and enrollment in this trial is ongoing. ![]()
*Data in the abstract differ from the presentation.
MRD predicts outcome of HSCT in ALL, study suggests

ORLANDO, FL—Minimal residual disease (MRD) measurements before and after hematopoietic stem cell transplant (HSCT) can help predict outcomes in patients with childhood acute lymphoblastic leukemia (ALL), according to researchers.
Their work also suggests several other factors can be used to predict event-free survival (EFS) in this patient population, and the team developed risk scores incorporating these factors.
Michael A. Pulsipher, MD, of Children’s Hospital Los Angeles in California, presented this work as one of the “Best Abstracts” at the 2017 BMT Tandem Meetings (abstract 4*).
“The new risk scores that we were able to develop very nicely predict outcomes post-transplant and can guide study planning,” Dr Pulsipher said.
“MRD pre-transplant was a very powerful predictor of outcome, and MRD post-transplant highlights individual patients at risk.”
For this study, Dr Pulsipher and his colleagues retrospectively analyzed 747 patients treated in Europe, North America, and Australia. The patients received transplants between September 1999 and May 2015.
Most patients had pre-B ALL (78%, n=586), 19% (n=145) had T-cell ALL, 2% had “other” ALLs (n=8) or no data on ALL type (n=8). Sixty-two percent (n=466) were male.
Nearly half of patients were between the ages of 2 and 10 (49%, n=365), 47% (n=351) were older than 10, and 4% (n=31) were younger than 2.
Transplant details
Patients received grafts from matched unrelated donors (42%, n=314), matched sibling donors (30%, n=227), mismatched donors (10%, n=75), and cord blood from unrelated donors (17%, n=128). There was no data on donor type for 3 patients.
Most patients received bone marrow transplants (61%, n=458), 20% (n=147) received cord blood, and 18% (n=131) received peripheral blood stem cells. Eight patients received “other” types of transplants, and 3 patients had no data on stem cell source.
More than half of the patients (55%, n=410) were in their second complete remission (CR) at transplant. Thirty-seven percent were in their first CR (n=275), 7% were in their third or greater CR (n=53), and 1% were not in remission (n=7). Two patients had no data on remission status.
MRD
MRD was assessed before HSCT as well as after—on or near days 30, 60, 90, 180, 365, and beyond.
There were 4 MRD categories:
- MRD negative: No signal
- MRD low: >0 to <10-4 (<0.01%)
- MRD high: ≥10-4 to <10-3 (0.01 to 0.1%)
- MRD very high: ≥10-3 to <10-2 (>0.1%).
Dr Pulsipher noted that, when analyzing MRD pre-HSCT or at 30 days after HSCT, the estimated 5-year EFS was similar for patients in the MRD-negative and MRD-low groups. However, as time went on (at days 90, 180, and 365), any detectable level of MRD was associated with a poor prognosis.
“And patients arriving at day 365 with no detectable MRD had an exceptional prognosis, with survival approaching 90%,” Dr Pulsipher said.
He also pointed out an interaction between acute graft-vs-host disease (aGVHD) and MRD post-HSCT. He and his colleagues observed better survival for MRD-positive patients with aGVHD (grade 1-2) than for MRD-positive patients without aGVHD.
Pre-HSCT risk score
Via an adjusted Cox regression analysis, the researchers identified several pre-transplant factors that predicted EFS at 18 months.
These included remission status, donor type, immunophenotype, and MRD. The researchers assigned points to each of these factors to create a risk score.
Compared to patients in first CR, the hazard ratio (HR) for patients in early second CR was 2.53, and the score was 3. For patients in third CR or greater, the HR was 1.95, and the score was 2.
Compared to patients with a matched sibling donor, the HR for patients with a mismatched donor was 1.41, and the score was 1. For patients who received cord blood from an unrelated donor, the HR was 1.48, and the score was 1.
Compared to patients with T-cell ALL, the HR for patients with pre-B ALL was 1.35, and the score was 1.
Compared to patients with MRD <10-4, the HR for patients with MRD ≥10-4 was 2.32, and the score was 2.
The probability of EFS at 18 months was 78% ± 2% for patients with 0 to 1 points, 54% ± 3% for those with 2 to 3 points, and 46% ± 5% for patients with 4 or more points.
Day 30 post-HSCT risk score
When considering patients at day 30 post-HSCT, factors that predicted 18-month EFS included remission status, donor type, immunophenotype, aGVHD status, and MRD.
The HR for patients in early second CR was 2.51, and the score was 3. For patients in third CR or greater, the HR was 2.09, and the score was 2.
The HR for patients with a mismatched donor was 1.75, and the score was 2. The HR for patients with pre-B ALL was 1.40, and the score was 1.
Compared to patients with grade 1-2 aGVHD, the HR was 2.02 for patients with grade 0 aGVHD, and the score was 2. For patients with grade 3 aGVHD, the HR was 1.44, and the score was 1. For patients with grade 4 aGVHD, the HR was 7.12, and the score was 7.
The researchers evaluated MRD prior to HSCT and MRD at day 30, using a reference of MRD <10-4 at both time points. For patients with MRD <10-4 pre-HSCT and ≥10-4 at day 30, the HR was 2.29, and the score was 2.
For patients with MRD ≥10-4 pre-HSCT and <10-4 at day 30, the HR was 3.17, and the score was 3. For patients with MRD ≥10-4 pre-HSCT and at day 30, the HR was 3.63, and the score was 4.
The probability of EFS at 18 months was 80% ± 2% for patients with 0 to 3 points, 54% ± 4% for those with 4 to 6 points, and 25% ± 6% for those with 7 or more points.
Day 90 post-HSCT risk score
When considering patients at day 90 post-HSCT, factors that predicted 18-month EFS included remission status, aGVHD status, and MRD.
For patients in early second CR, the HR was 2.81, and the score was 3. For those in third CR or greater, the HR was 1.85, and the score was 2.
Compared to patients with grade 1-2 aGVHD, the HR was 1.60 for patients with grade 0 aGVHD, and the score was 2. For patients with grade 4 aGVHD, the HR was 2.49, and the score was 2.
The researchers assessed MRD prior to HSCT and MRD at day 90, using a reference of MRD <10-4 at both time points. For patients with MRD <10-4 pre-HSCT and ≥10-4 at day 90, the HR was 6.03, and the score was 6.
For patients with MRD ≥10-4 pre-HSCT and <10-4 at day 90, the HR was 3.11, and the score was 3. For patients with MRD ≥10-4 pre-HSCT and at day 90, the HR was 4.59, and the score was 5.
The probability of EFS at 18 months was 83% ± 2% for patients with 0 to 2 points, 60% ± 4% for those with 3 to 5 points, and 17% ± 11 for those with 6 or more points. ![]()
*Information in the abstract differs from the presentation.
Combo prevents GVHD, prolongs survival in monkeys

ORLANDO, FL—A 2-drug combination is “an exceptional candidate for clinical translation” as prophylaxis for graft-vs-host disease (GVHD), according to a presenter at the 2017 BMT Tandem Meetings.
The combination consists of sirolimus and KY1005, a monoclonal antibody that binds to OX40L and stops it from activating OX40, a protein that induces prolonged responses in T cells.
Experiments in rhesus macaques showed that KY1005 alone can have a modest effect on GVHD, but the combination of KY1005 and sirolimus can provide long-term, GVHD-free survival.
Victor Tkachev, PhD, of Seattle Children’s Research Institute in Washington, presented these results as one of the “Best Abstracts” at the recent BMT Tandem Meetings (abstract 3). This research was supported by Kymab, the company developing KY1005.
Dr Tkachev and his colleagues tested KY1005 alone and in combination with sirolimus in a previously described model of GVHD. In this model, rhesus macaques that do not receive prophylaxis develop severe GVHD after haploidentical hematopoietic stem cell transplant (HSCT).
For the current study, the animals received no prophylaxis, KY1005 alone, sirolimus alone, or KY1005 plus sirolimus.
When compared to no prophylaxis, KY1005 delayed the progression of acute GVHD and significantly prolonged the survival of HSCT recipients. However, all KY1005-treated animals eventually developed lethal GVHD.
Dr Tkachev noted that KY1005 provided partial control of T-cell activation, decreasing CD4 T-cell proliferation but having no significant effect on CD8 T-cell expansion.
As with KY1005 alone, sirolimus alone delayed GVHD progression and prolonged survival when compared to no GVHD prophylaxis.
However, all animals treated with sirolimus monotherapy eventually developed GVHD and died, and sirolimus alone wasn’t able to control T-cell proliferation.
On the other hand, the combination of KY1005 and sirolimus provided long-term, GVHD-free survival. All of the animals that received this combination survived, without developing GVHD, through day 100 after HSCT.
Dr Tkachev noted that, when given together, KY1005 and sirolimus synergistically controlled both CD4 and CD8 T-cell proliferation. However, this effect did not result in a lack of engraftment. In fact, animals that received the combination “displayed robust hematopoietic reconstitution” and maintained a high number of donor T cells.
Further investigation revealed that combination treatment with KY1005 and sirolimus preserves the reconstitution of regulatory T cells after HSCT and prevents both Th1- and Th17-driven alloimmunity.
Dr Tkachev and his colleagues also found that KY1005 plus sirolimus demonstrates an “unprecedented capacity” to protect against acute GVHD. Results with this combination were superior to those observed with tacrolimus and methotrexate in combination as well as abatacept and sirolimus in combination.
“Taken together, these data suggest that combined prophylaxis with KY1005 plus sirolimus represents an exceptional candidate for clinical translation,” Dr Tkachev concluded.
Kymab has said it will begin testing KY1005 in clinical trials this year. ![]()
Drug produces high response rates in AITL
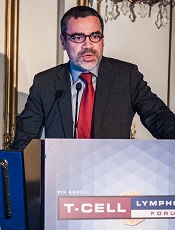
Photo by Larry Young
SAN FRANCISCO—Treatment with 5-azacitidine (5-AZA) can produce a high response rate in patients with relapsed/refractory angioimmunoblastic T-cell lymphoma (AITL), according to a small study.
The overall response rate (ORR) among AITL patients was 75%, and the complete response (CR) rate was 42%.
However, this study also included patients with other types of peripheral T-cell lymphoma (PTCL), and most of these patients did not respond to 5-AZA.
Richard Delarue, MD, of Necker University Hospital in Paris, France, presented these results at the 9th Annual T-cell Lymphoma Forum.
Results were also presented at the 2016 ASH Annual Meeting (abstract 4164). Dr Delarue reported receiving honoraria from Celgene.
Patients
The study included 19 patients with relapsed/refractory PTCL. Twelve patients had AITL, 3 had adult T-cell leukemia/lymphoma (ATLL), 2 had PTCL not otherwise specified, 1 had enteropathy-associated T-cell lymphoma, and 1 had transformed mycosis fungoides.
At diagnosis, the median age was 71 (range, 39-85) for AITL patients and 59 (range, 32-83) for the other PTCL patients. Seventy-five percent of AITL patients had an IPI score of 3 to 5 and a PIT score of 3 to 4. Eighty-six percent of the other PTCL patients had an IPI score of 3 to 5, and 57% had a PIT score of 3 to 4.
At the time of 5-AZA treatment, all patients had stage III/IV disease. The AITL patients had received a median of 2 (range, 0-6) prior lines of therapy, and the other PTCL patients had received a median of 3 (range, 0-7).
Two patients did not receive chemotherapy before 5-AZA because of the presence of associated chronic myelomonocytic leukemia (CMML) that required treatment first.
Ninety-two percent of AITL patients had TET2 mutations (n=11), 33% had DNMT3A mutations (n=4), and 0% had IDH2 mutations. One of the non-AITL patients had a TET2 mutation.
Treatment
Patients received a subcutaneous injection of 5-AZA at 75 mg/m² for 7 consecutive days every 28 days until progression or unacceptable toxicity. Six patients also received 4 to 8 infusions of rituximab because of EBV-DNA positivity.
The patients received a median of 3 cycles of 5-AZA. At the time of analysis, 4 patients were still receiving therapy.
The median follow-up was 84 days (range, 19 to 1236).
Toxicity
“Hematological toxicity was as expected with 5-azacitidine,” Dr Delarue said.
However, 2 patients had “unusual” adverse reactions. One patient had grade 2 polyneuropathy, which was considered related to a paraneoplastic syndrome.
The other patient had grade 3 diarrhea related to colitis of unknown origin, and this led to treatment interruption.
There were no treatment-related deaths.
Efficacy
Dr Delarue noted that the ORR was significantly higher in AITL patients than in patients with the other PTCL subtypes (P=0.0198).
The ORR was 53% in the entire cohort (10/19), 75% (9/12) among AITL patients, and 14% among patients with other PTCLs (1/7).
“The only patient with a response in the ‘other PTCL’ group was a patient with HTLV1-associated ATLL . . . , but he relapsed a couple of weeks after the second cycle,” Dr Delarue explained.
Among the AITL patients, the CR rate was 42% (5/12), the partial response rate was 33% (4/12), and the rate of stable disease was 25% (3/12).
Six AITL patients eventually progressed—after 2, 2, 3, 4, 4, and 20 cycles of therapy, respectively.
Two AITL patients are off therapy but remain in CR after 9 and 10 months (5 and 6 cycles of treatment), respectively.
The median progression-free survival for AITL patients was 16 months, and the median overall survival was 17 months.
Dr DeLarue noted that 4 of the AITL patients had CMML, 1 had non-CMML myelodysplastic syndrome, 3 had monocytosis without CMML, and 4 had normal monocyte counts.
He also said that, at present, it’s not possible to correlate the results observed in the AITL patients with their mutational status.
However, he and his colleagues are planning a prospective study of 5-AZA in patients with relapsed/refractory AITL and T follicular helper cell PTCL not otherwise specified. 5-AZA will be compared to investigator’s choice in this study.
Dr DeLarue said this trial will provide an opportunity to use the new oral formulation of 5-AZA (CC-486). And he and his colleagues welcome collaborators. ![]()
OS is worse with refractory vs relapsed PTCL
Photo by Larry Young
SAN FRANCISCO—Patients with refractory peripheral T-cell lymphoma (PTCL) have significantly worse overall survival (OS) than patients with relapsed PTCL, according to data from the COMPLETE registry.
The data also showed that patients treated with a curative intent had significantly better OS than patients who received palliative care.
However, there was no significant difference in OS according to disease subtype or between patients who received conventional chemotherapy and those who received novel agents.
Frederick Lansigan, MD, of Dartmouth-Hitchcock Medical Center in Lebanon, New Hampshire, presented these data at the 9th Annual T-cell Lymphoma Forum. Data were also presented at the 2016 ASH Annual Meeting (abstract 4150).
Dr Lansigan and his colleagues analyzed COMPLETE data on patients with mature T-cell lymphomas, focusing on patients in first relapse and those with primary refractory disease.
Refractory disease was defined as no response to initial treatment or disease progression during or within 1 month of completing front-line therapy.
Relapsed disease was defined as progression more than 1 month after completing induction therapy in patients who initially achieved a complete response (CR) or partial response (PR).
Patients
There were 138 patients in the analysis—58 with relapsed disease and 80 with refractory disease.
The median time from informed consent to diagnosis of relapsed disease was 11.4 months, and the time to diagnosis of refractory disease was 2.2 months.
Disease subtypes included:
- PTCL not otherwise specified (NOS)—35% of relapsed and 28% of refractory patients
- Angioimmunoblastic T-cell lymphoma—22% and 16%
- ALK- anaplastic large-cell lymphoma (ALCL)—10% and 14%
- ALK+ ALCL—3% and 4%
- Natural killer/T-cell lymphoma, nasal type—9% and 8%
- Enteropathy-associated T-cell lymphoma—5% and 3%
- Hepatosplenic T-cell lymphoma—3% and 5%
- Adult T-cell leukemia/lymphoma—2% and 5%
- Transformed mycosis fungoides—0% and 10%
- “Other”—10% and 9%.
Treatment
Most patients received combination regimens as front-line therapy—81% in the relapsed group and 68% in the refractory group. Nineteen and 32%, respectively, received single-agent treatment.
A majority of patients in both groups received chemotherapy or novel agents as second-line therapy—65% in the relapsed group and 71% in the refractory group. (Novel agents include histone deacetylase inhibitors, monoclonal antibodies, immunoconjugates, pralatrexate, bendamustine, denileukin diftitox, alisertib, and lenalidomide.)
Fifteen percent of relapsed patients and 16% of refractory patients received palliative care/best supportive care/observation as second-line therapy. Fifteen percent and 7%, respectively, had a transplant. Four percent and 6%, respectively, received chemotherapy and radiotherapy.
Of the patients who received systemic therapy second-line, 53% of relapsed patients received novel therapies, and 47% received conventional chemotherapy. Twenty-five percent of the refractory patients received novel therapies, and 75% received chemotherapy (P=0.005 for relapsed/refractory comparison of novel vs traditional therapy).
Most patients with relapsed disease received single agents (74%) rather than multi-agent regimens (26%) as second-line therapy. However, single-agent treatment was about as common as multi-agent regimens for refractory patients—53% and 47%, respectively (P=0.03 for relapsed/refractory comparison).
The objective response rates to second-line therapy were 61% for relapsed patients and 37% for refractory patients (P=0.02). The CR rates were 37% and 12%, respectively (P=0.003).
Survival
The median OS was significantly better for patients with relapsed PTCL—15.7 months, compared to 6.1 months for refractory patients (P=0.0237).
OS was also significantly better for patients who achieved a CR. The median OS was not reached for patients with a CR, 14.6 months for those with a PR, 13.7 months for those with stable disease, and 3.2 months for those who progressed (P<0.0001).
There was no significant difference in median OS for patients who received novel agents and those who received traditional chemotherapy—14.6 months and 11.1 months, respectively (P=0.2362).
Disease subtype
There was no significant difference in OS between patients who had PTCL-NOS, ALCL, or another PTCL subtype.
For relapsed patients, the median OS was 26 months for those with ALCL, 34 months for those with PTCL-NOS, and 35 months for those with other subtypes (P=0.82).
For refractory patients, the median OS was 31 months for those with ALCL, 7 months for those with PTCL-NOS, and 11 months for those with other subtypes (P=0.36).
Treatment intent
There was a significant difference in OS according to the intent of treatment.
Among relapsed patients, the median OS was not reached for those treated with curative intent and was 17 months for those who received palliative care (P=0.001).
Among refractory patients, the median OS was 15 months for those treated with curative intent and 5 months for those who received palliative care (P=0.005).
Dr Lansigan noted that the better outcomes in patients treated with curative intent may reflect a host of things, such as performance status, fitness for treatment, and transplant eligibility.
Treatment type
In relapsed patients, there was no significant difference in median OS between patients who underwent a transplant (not reached), those who received chemotherapy (24.4 months), and those who received best supportive care (20.9 months).
In refractory patients, the differences were significant. The median OS was not reached in patients who underwent a transplant, 11.6 months in those who received chemotherapy, and 3.5 months in those who received best supportive care (P=0.001).
In closing, Dr Lansigan noted that, in addition to showing a difference in OS between patients with relapsed and refractory PTCL, the COMPLETE registry highlights differences in practice patterns.
“The refractory group was treated more aggressively with traditional combination salvage regimens, but this does not appear to be better than single-agent chemo,” he said. “Of course, selection bias does play a role here, but this is hypothesis-generating.”
“In the relapsed PTCL group, novel, single-agent chemo was used more often, with good effect, with high response rates and long-term survival outcomes. So novel single agents can be considered as salvage therapy for both relapsed and refractory PTCL. Clinical trials are needed to improve outcomes in this poor-risk subgroup.” ![]()
Regimens seem similarly effective in ENKTL
Photo by Larry Young
SAN FRANCISCO—Interim results of a phase 3 trial suggest 2 treatment regimens may provide comparable efficacy in patients with extranodal natural killer/T-cell lymphoma (ENKTL), though 1 regimen appears more toxic than the other.
In this ongoing trial, investigators are comparing pegaspargase, gemcitabine, oxaliplatin, and thalidomide (P-Gemox+Thal) to pegaspargase, methotrexate, calcium folinate, and dexamethasone (AspaMetDex).
In some patients, either regimen may be followed by extensive involved-field radiotherapy (EIFRT) or autologous hematopoietic stem cell transplant (ASCT).
Thus far, P-Gemox+Thal and AspaMetDex have proven similarly effective for patients with newly diagnosed, stage I/II ENKTL.
And both regimens have produced unsatisfying survival outcomes in patients with advanced or relapsed/refractory ENKTL, according to investigator Huiqiang Huang, MD, of Sun Yat-sen Institute of Hematology in Guangzhou, China.
In addition, P-Gemox+Thal seems to be less toxic, overall, than AspaMetDex.
However, Dr Huang said it is still too early to draw any firm conclusions about these regimens.
He presented results from this trial at the 9th Annual T-cell Lymphoma Forum. Results were previously presented at the 2016 ASH Annual Meeting (abstract 1819).
Dr Huang noted that AspaMetDex and SMILE (dexamethasone, methotrexate, ifosfamide, lL-asparaginase, and etoposide) are frequently administered to patients with ENKTL. And P-Gemox is recommended in the 2016 NCCN guidelines.
“But optimal regimens still have not been fully defined,” he said.
Therefore, he and his colleagues decided to compare AspaMetDex to P-Gemox+Thal in this non-inferiority trial, which has enrolled 110 patients from 12 centers in China.
Treatment
Fifty-six patients have been randomized to receive P-Gemox+Thal. Every 3 weeks, they received pegaspargase at 2000 U/m2 on day 1, gemcitabine at 1000 mg/m2 on days 1 and 8, and oxaliplatin at 130 mg/m2 on days 1 and 8. They also received thalidomide at 100 mg every day for 1 year.
Fifty-four patients have been randomized to receive AspaMetDex. Every 3 weeks, they received pegaspargase at 2000 U/m2 on day 1, methotrexate at 3000 mg/m2 on day 1, calcium folinate at 30 mg every 6 hours until a safe serum methotrexate concentration was reached, and dexamethasone at 40 mg every day on days 1 to 4.
Newly diagnosed patients with stage I/II disease received either regimen as induction for a maximum of 4 cycles. Responders went on to receive EIFRT at 56 Gy in 28 fractions over 4 weeks.
Patients with newly diagnosed, stage III/IV ENKTL or relapsed/refractory ENKTL received either chemotherapy regimen for a maximum of 6 cycles. If they achieved a complete response (CR), these patients could proceed to ASCT.
Stage I/II ENKTL
Of the 63 stage I/II patients, 33 were randomized to P-Gemox+Thal, and 30 received AspaMetDex. In both arms, most patients were male (69.7% and 70%, respectively) and younger than 60 (78.8% and 90%, respectively).
Ninety-seven percent of patients in the P-Gemox+Thal arm had an ECOG status of 0-1, as did 100% of patients in the AspaMetDex arm.
The overall response rate (ORR) was 85.2% in the P-Gemox+Thal arm and 81.5% in the AspaMetDex arm. The CR rate was 59.3% in both arms. The rate of stable disease was 3.7% in the P-Gemox+Thal arm and 11.1% in the AspaMetDex arm.
After EIFRT, the ORR increased to 92.6% in the P-Gemox+Thal arm, and the CR rate increased to 88.8%. In the AspaMetDex arm, the ORR increased to 88.8%, and the CR rate increased to 85.1%.
At a median follow-up of 13.5 months, the 2-year progression-free survival rate was 82.9% in the P-Gemox+Thal arm and 84.5% in the AspaMetDex arm (P=0.791).
The 2-year overall survival rates were 95.0% in the P-Gemox+Thal arm and 75.8% in the AspaMetDex arm (P=0.089).
Advanced, rel/ref ENKTL
Of the 47 patients with stage III/IV or relapsed/refractory ENKTL, 24 were randomized to P-Gemox+Thal, and 23 to AspaMetDex. In both arms, most patients were male (75% and 87%, respectively) and younger than 60 (95.8% and 91.3%, respectively).
ECOG status was 0 for 62.5% of patients in the P-Gemox+Thal arm and 73.9% of those in the AspaMetDex arm. ECOG status was 1 for 33.3% and 17.4%, respectively.
The ORR was 86.3% in the P-Gemox+Thal arm and 70% in the AspaMetDex arm. The CR rate was 50% in both arms.
The partial response rate was 36.3% in the P-Gemox+Thal arm and 20% in the AspaMetDex arm. And the rate of stable disease was 13.6% and 15%, respectively.
Three patients in each treatment arm went on to ASCT after CR. A total of 3 patients relapsed within 6 months of ASCT—2 in the P-Gemox+Thal arm and 1 in the AspaMetDex arm. Two patients died of disease progression.
At a median follow-up of 14.5 months, the 2-year progression-free survival was 12.2 months in the P-Gemox+Thal arm and 7.6 months in the AspaMetDex arm (P=0.365).
The 2-year overall survival was 52.5% in the P-Gemox+Thal arm and 48.9% in the AspaMetDex arm (P=0.935).
Overall safety
Rates of leukopenia, thrombocytopenia, and ALT/AST increase were all significantly higher with P-Gemox+Thal than with AspaMetDex—100% vs 66.7% (P<0.001), 64.2% vs 35.2% (P=0.005), and 69.6% vs 64.8% (P=0.004), respectively.
Rates of anemia and edema were significantly higher with AspaMetDex than with P-Gemox+Thal—51.8% vs 77.8% (P=0.005) and 37.5% vs 66.7% (P=0.003), respectively.
There were 3 treatment-related deaths in the AspaMetDex arm but none in the P-Gemox+Thal arm. Two of the treatment-related deaths—from severe acute renal failure and sepsis—occurred in the first cycle, and 1 death—due to severe sepsis—occurred in the third cycle.
The median hospitalization time was significantly shorter in the P-Gemox+Thal arm than the AspaMetDex arm—1.9 days and 4.9 days, respectively (P<0.01).
Based on these results, Dr Huang said P-Gemox+Thal may be more tolerable and provide more convenient administration than AspaMetDex. ![]()
Group proposes new prognostic model for PTCL-NOS
T-cell Lymphoma Forum
Photo by Larry Young
SAN FRANCISCO—Researchers have used data from the T-Cell Project (TCP) to create a prognostic model for peripheral T-cell lymphoma not otherwise specified (PTCL-NOS).
Analyses have suggested the TCP model is more accurate for PTCL-NOS than 4 other prognostic models—the International Prognostic Index (IPI), the Prognostic Index for T-cell Lymphoma (PIT), the International Peripheral T-cell Lymphoma Project score (IPTCLP), and the modified PIT (mPIT).
Massimo Federico, MD, of the University of Modena and Reggio Emilia in Italy, described the TCP model at the 9th Annual T-cell Lymphoma Forum.
Creating the model
TCP is a prospective registry that includes data from T-cell lymphoma patients in 15 countries located in 5 different regions of the world. As of December 31, 2016, 1523 cases of T-cell lymphoma have been registered with TCP.
Dr Federico and his colleagues used these data to create their prognostic model. There were 311 patients with PTCL-NOS who had adequate data for analysis. The 5-year overall survival (OS) for these patients was 36%.
The researchers chose 13 variables from the literature that have been reported to have a prognostic impact on survival in PTCL-NOS:
- Age > 60
- Lactate dehydrogenase > upper limit of normal
- Albumin < 3.5 g/dL
- Hemoglobin < 12 g/dL
- Platelets < 150/mm3
- Lymphocyte to monocyte ratio ≤ 2.1
- Neutrophil to lymphocyte ratio > 6.5
- Absolute neutrophil count (ANC) > 6.5/mm3
- ECOG performance status > 1
- Stage III-IV disease
- B symptoms
- Extra nodal sites > 1
- Male gender.
In univariate analysis, nearly all of these factors were significantly associated with OS in the cohort of TCP patients. (The 2 exceptions were age older than 60 and having more than 1 extranodal site.)
However, Dr Federico and his colleagues said the factors with the greatest prognostic impact were:
- ECOG performance status > 1, with a hazard ratio (HR) of 2.12 (P<0.001)
- Albumin < 3.5 g/dL, with an HR of 2.03 (P<0.001)
- ANC > 6.5/mm3, with an HR of 1.85 (P<0.001)
- Stage III-IV disease, with an HR of 1.74 (P=0.010).
So the researchers used these factors in their model, which has 3 risk categories.
Risk categories
Patients were considered low-risk if they had 0 of the 4 risk factors. These patients had a 3-year OS of 76% and a 5-year OS of 69%.
Patients were considered intermediate-risk if they had 1 to 2 risk factors. These patients had a 3-year OS of 43% and a 5-year OS of 31%. Compared to low-risk patients, the HR was 3.08 (P<0.001).
Patients were considered high-risk if they had 3 to 4 risk factors. The 3-year OS was 11% for these patients, and the 5-year OS was 8%.
The HR was 8.88 (P<0.001) for high-risk compared to low-risk patients and 2.88 (P<0.001) for high-risk compared to intermediate-risk patients.
Validation
The researchers tested the TCP model in a validation cohort of 98 patients from the COMPLETE registry. As with the training cohort of TCP patients, the model revealed 3 different risk groups (in terms of OS) in the validation cohort.
Dr Federico noted that there were no significant differences between the training and validation cohorts, except when it came to follow-up. The median follow-up was 46 months in the TCP group and 18 months in the COMPLETE group.
The researchers also found the TCP could classify patients into 3 different risk groups according to progression-free survival.
Comparison
Finally, Dr Federico and his colleagues compared the TCP model to the IPI, PIT, IPTCLP, and mPIT models using 208 patients.
“The discriminant power of the proposed model is superior to the others in terms of all of the statistical tests we adopted,” Dr Federico said.
| Model | c-Harrell*
(95% CI) |
D-Royston
(SE) |
R2 | AIC (95% CI) | AUC,
3-year OS |
| TCP | 0.666 (0.618-0.713) | 1.152 (0.191) | 0.31 (0.14-0.46) | 983 | 0.714 |
| PIT | 0.614 (0.563-0.664) | 0.750 (0.195) | 0.15 (0.06-0.31) | 1004 | 0.696 |
| IPI | 0.645 (0.594-0.696) | 0.883 (0.191) | 0.22 (0.08-0.38) | 987 | 0.704 |
| IPITCLP | 0.606 (0.549-0.663) | 0.631 (0.188) | 0.12 (0.03-0.28) | 1006 | 0.704 |
| mPIT | 0.640 (0.586-0.694) | 0.762 (0.170) | 0.16 (0.05-0.33) | 999 | 0.681 |
In closing, Dr Federico said the TCP model clearly defines risk groups in PTCL-NOS and identifies patients with relatively good prognosis.
However, there is a need for emerging biologic variables to be tested for prognostic value and included in prognostic tools to allow for better risk stratification. ![]()
*c-Harrel: Harrell’s concordance index, 95% CI: confidence interval, D-Royston: Royston/Sauerbrei’s D statistic (Stat Med 2004 Mar 15, 23[5]:723-48), SE: standard error, R2: explained randomness, AIC: Akaike information criterion, AUC: area under the curve (according to Heagerty et al, Biometrics, 2000 Jun, 56[2]:337-44).
Project provides insight into T-cell lymphoma
Photo by Larry Young
SAN FRANCISCO—The T-Cell Project has provided information that can enhance our understanding of T-cell lymphomas, according to a presentation at the 9th Annual T-cell Lymphoma Forum.
The project is a prospective registry that includes data from T-cell lymphoma patients in 15 countries located in 5 different regions of the world.
The data showed that peripheral T-cell lymphoma not otherwise specified (PTCL-NOS) is the most common subtype of T-cell lymphoma in all 5 regions, although the distribution of other subtypes varies.
A majority of patients in the registry received chemotherapy as induction, and anthracycline-containing regimens were the most popular treatment choice.
Although 60% of patients in the registry had low-risk or low/intermediate-risk disease, progression-free survival (PFS) and overall survival (OS) rates were low. The 5-year PFS was 32%, and the 5-year OS was 42%.
Massimo Federico, MD, of the University of Modena and Reggio Emilia in Italy, presented these data at the meeting.
About the project
Dr Federico said the goals of the T-Cell Project are to determine if prospective data collection provides more accurate information to better define prognosis of the most frequent subtypes of T-cell lymphoma and to improve our knowledge of clinical and biological characteristics, as well as outcomes, of the more uncommon subtypes.
“Why did we choose to propose a prospective registry for the collection of information in T-cell lymphoma?” Dr Federico asked. “Because it is, by far, less expensive than a clinical trial, but also because it can offer excellent data for generating new research programs and is a great opportunity for academic cooperation.”
As of December 31, 2016, the registry included 1523 patients. There were 75 sites (with at least 1 patient) active in the registry.
Fifteen countries in 5 geographic regions were represented. Europe was the greatest contributor (44%), followed by North America (US only, 25%), South America (20%), the Far East (9%), the Middle East (2%), and Oceania (<1%).
Subtypes
Overall, the distribution of the different T-cell lymphoma subtypes is as follows:
PTCL-NOS—36%
Angioimmunoblastic T-cell lymphoma (AITL)—17%
ALK- anaplastic large-cell lymphoma (ALCL)—16%
NK/T-cell lymphoma (NKTCL)—11%
ALK+ ALCL—8%
Enteropathy-associated T-cell lymphoma—4%
Unclassifiable T-cell lymphoma—3%
Hepatosplenic T-cell lymphoma—2%
Subcutaneous panniculitis-like T-cell lymphoma—2%
Peripheral gamma delta T-cell lymphoma—1%
Geographic distribution
The most common T-cell lymphoma subtypes in Europe were PTCL-NOS (37%), AITL (21%), and ALK- ALCL (14%). Likewise, the most common subtypes in the US were PTCL-NOS (35%), AITL (21%), and ALK- ALCL (13%).
In the Middle East, the most common subtypes were PTCL-NOS (40%), AITL (16%), and ALK+ ALCL (13%). In South America, they were PTCL-NOS (41%), ALK- ALCL (26%), and NKTCL (10%). And in Asia, they were PTCL-NOS (29%), NKTCL (29%), and AITL (17%).
Patient characteristics
Dr Federico presented data on patient characteristics for 1391 individuals, validated as of April 30, 2016.
The patients’ median age was 56 (range, 18-89). Forty-four percent were 60 or older, and 60% were male. Twenty-six percent had ECOG performance status > 1, 50% had B symptoms, and 72% had disease-related discomfort.
Sixty percent had low-risk or low/intermediate-risk disease according to the International Prognostic Index (IPI) and the Prognostic Index for T-cell Lymphoma (PIT).
Treatment
Treatment details are available for 1022 patients. Ninety-two percent received therapy with curative intent.
For induction, 76% of patients received chemotherapy alone, 14% received chemotherapy and radiotherapy, 8% received best supportive care, and 2% received radiotherapy alone.
Seventy-one percent of patients who received chemotherapy had an anthracycline-containing regimen, 13% received etoposide-containing chemotherapy, 9% received chemotherapy containing an anthracycline and etoposide, and 7% of patients received other therapy.
Thirteen percent of patients received a transplant as salvage treatment, and 7% received a transplant as consolidation.
Outcomes
Data on patient responses to initial treatment were available for 888 individuals. The 84 patients who received best supportive care were not included, and 50 patients were not evaluable for response.
The complete response/unconfirmed complete response rate was 53%, and the partial response rate was 19%. Twenty-eight percent of patients had no response or progressed.
The median PFS was 16 months. The 5-year PFS rate was 32% overall, 23% for PTCL-NOS, 28% for AITL, 39% for ALK- ALCL, and 57% for ALK+ ALCL.
The median OS was 36 months. The 5-year OS was 42% overall, 34% for PTCL-NOS, 42% for AITL, 46% for ALK- ALCL, and 76% for ALK+ ALCL.
Dr Federico and his colleagues have used these data to develop a prognostic model for PTCL-NOS that, they say, is more accurate than current models. ![]()
Photo by Larry Young
SAN FRANCISCO—The T-Cell Project has provided information that can enhance our understanding of T-cell lymphomas, according to a presentation at the 9th Annual T-cell Lymphoma Forum.
The project is a prospective registry that includes data from T-cell lymphoma patients in 15 countries located in 5 different regions of the world.
The data showed that peripheral T-cell lymphoma not otherwise specified (PTCL-NOS) is the most common subtype of T-cell lymphoma in all 5 regions, although the distribution of other subtypes varies.
A majority of patients in the registry received chemotherapy as induction, and anthracycline-containing regimens were the most popular treatment choice.
Although 60% of patients in the registry had low-risk or low/intermediate-risk disease, progression-free survival (PFS) and overall survival (OS) rates were low. The 5-year PFS was 32%, and the 5-year OS was 42%.
Massimo Federico, MD, of the University of Modena and Reggio Emilia in Italy, presented these data at the meeting.
About the project
Dr Federico said the goals of the T-Cell Project are to determine if prospective data collection provides more accurate information to better define prognosis of the most frequent subtypes of T-cell lymphoma and to improve our knowledge of clinical and biological characteristics, as well as outcomes, of the more uncommon subtypes.
“Why did we choose to propose a prospective registry for the collection of information in T-cell lymphoma?” Dr Federico asked. “Because it is, by far, less expensive than a clinical trial, but also because it can offer excellent data for generating new research programs and is a great opportunity for academic cooperation.”
As of December 31, 2016, the registry included 1523 patients. There were 75 sites (with at least 1 patient) active in the registry.
Fifteen countries in 5 geographic regions were represented. Europe was the greatest contributor (44%), followed by North America (US only, 25%), South America (20%), the Far East (9%), the Middle East (2%), and Oceania (<1%).
Subtypes
Overall, the distribution of the different T-cell lymphoma subtypes is as follows:
PTCL-NOS—36%
Angioimmunoblastic T-cell lymphoma (AITL)—17%
ALK- anaplastic large-cell lymphoma (ALCL)—16%
NK/T-cell lymphoma (NKTCL)—11%
ALK+ ALCL—8%
Enteropathy-associated T-cell lymphoma—4%
Unclassifiable T-cell lymphoma—3%
Hepatosplenic T-cell lymphoma—2%
Subcutaneous panniculitis-like T-cell lymphoma—2%
Peripheral gamma delta T-cell lymphoma—1%
Geographic distribution
The most common T-cell lymphoma subtypes in Europe were PTCL-NOS (37%), AITL (21%), and ALK- ALCL (14%). Likewise, the most common subtypes in the US were PTCL-NOS (35%), AITL (21%), and ALK- ALCL (13%).
In the Middle East, the most common subtypes were PTCL-NOS (40%), AITL (16%), and ALK+ ALCL (13%). In South America, they were PTCL-NOS (41%), ALK- ALCL (26%), and NKTCL (10%). And in Asia, they were PTCL-NOS (29%), NKTCL (29%), and AITL (17%).
Patient characteristics
Dr Federico presented data on patient characteristics for 1391 individuals, validated as of April 30, 2016.
The patients’ median age was 56 (range, 18-89). Forty-four percent were 60 or older, and 60% were male. Twenty-six percent had ECOG performance status > 1, 50% had B symptoms, and 72% had disease-related discomfort.
Sixty percent had low-risk or low/intermediate-risk disease according to the International Prognostic Index (IPI) and the Prognostic Index for T-cell Lymphoma (PIT).
Treatment
Treatment details are available for 1022 patients. Ninety-two percent received therapy with curative intent.
For induction, 76% of patients received chemotherapy alone, 14% received chemotherapy and radiotherapy, 8% received best supportive care, and 2% received radiotherapy alone.
Seventy-one percent of patients who received chemotherapy had an anthracycline-containing regimen, 13% received etoposide-containing chemotherapy, 9% received chemotherapy containing an anthracycline and etoposide, and 7% of patients received other therapy.
Thirteen percent of patients received a transplant as salvage treatment, and 7% received a transplant as consolidation.
Outcomes
Data on patient responses to initial treatment were available for 888 individuals. The 84 patients who received best supportive care were not included, and 50 patients were not evaluable for response.
The complete response/unconfirmed complete response rate was 53%, and the partial response rate was 19%. Twenty-eight percent of patients had no response or progressed.
The median PFS was 16 months. The 5-year PFS rate was 32% overall, 23% for PTCL-NOS, 28% for AITL, 39% for ALK- ALCL, and 57% for ALK+ ALCL.
The median OS was 36 months. The 5-year OS was 42% overall, 34% for PTCL-NOS, 42% for AITL, 46% for ALK- ALCL, and 76% for ALK+ ALCL.
Dr Federico and his colleagues have used these data to develop a prognostic model for PTCL-NOS that, they say, is more accurate than current models.