User login
Which smoking cessation interventions work best?
NICOTINE REPLACEMENT THERAPY (NRT), bupropion, nortriptyline, clonidine, and varenicline are all effective, although insufficient evidence exists to recommend one intervention over another (SOR: A, systematic reviews).
Effective nonpharmacologic interventions include brief physician advice and more intensive counseling, such as proactive telephone counseling, group and individual counseling, and use of quit lines (SOR: A, systematic reviews).
Evidence summary
NRT. A Cochrane review of 111 randomized controlled trials (RCTs) with a total of >40,000 subjects evaluated abstinence rates after 6 months of NRT and placebo or no treatment.1 All forms of NRT increased abstinence vs placebo or no treatment, independent of setting, duration of treatment, and intensity of nonpharmacologic therapies. Overlapping confidence intervals suggested that no one form of NRT was superior. (The TABLE summarizes all the studies discussed here.)
Bupropion. A Cochrane review of 36 RCTs (N=11,140) showed higher abstinence rates with bupropion than placebo after ≥6 months of follow-up (average quit rate 17% vs 9%). Duration (6 vs 12 months) and intensity (150 vs 300 mg) of therapy didn’t influence the results.2 Six separate RCTs comparing bupropion plus NRT with NRT alone showed significant heterogeneity, but found no significant differences using a mixed-effects model.2
Nortriptyline. A Cochrane review that pooled results from 6 RCTs (N=975) showed superior 6-month abstinence rates for nortriptyline compared with placebo.2 Adding nicotine patches in other RCTs (N=1219) didn’t change abstinence rates.2 No long-term studies have examined other tricyclic antidepressants.
Clonidine. A pooled analysis of 6 RCTs found clonidine superior to placebo after ≥12 weeks of follow-up.3 Results were heavily influenced by one trial limited to heavy smokers and poor tolerability due to adverse effects of therapy, especially sedation and dry mouth.
Nicotine receptor partial agonists and antagonists. Standard dose varenicline was more than twice as likely as placebo to produce abstinence at 6 months in a Cochrane review of 10 RCTs.4 Lower doses were slightly less effective, but had fewer side effects. Adverse effects included mild to moderate nausea and sleep disorders; causation has not been established between varenicline and rare postmarketing reports of severe psychiatric disturbances.4,5
The pooled results of 3 RCTs suggested that varenicline was superior to bupropion, but different abstinence rates for bupropion users in other placebo-controlled trials necessitate caution in interpreting these results.4 Varenicline was not superior to NRT.4
One RCT (N=48) comparing nicotine patches plus the nicotine antagonist mecamylamine with patches plus placebo found improved abstinence rates at 6 and 12 months; a larger RCT didn’t support these findings.6
Table
How effective are smoking cessation interventions?
| Intervention | No. of studies | Effect size* (95% confidence interval) | Total N |
|---|---|---|---|
| NRT vs placebo or no treatment1 | 111 | 1.58 (1.50-1.66) | >40,000 |
| Bupropion vs placebo2 | 36 | 1.69 (1.53-1.85) | 11,140 |
| Bupropion 300 mg/d vs 150 mg/d2 | 3 | 1.08 (0.93-1.26) | 2042 |
| Bupropion + NRT vs NRT2 | 6 | 1.23 (0.67-2.26) | 1106 |
| Nortriptyline vs placebo2 | 6 | 2.03 (1.48-2.78) | 975 |
| Nortriptyline + NRT vs NRT2 | 4 | 1.29 (0.97-1.72) | 1219 |
| Clonidine vs placebo3 | 6 | 1.63 (1.22-2.18) | 776 |
| Varenicline vs placebo, standard dose4 Varenicline vs placebo, low dose4 Varenicline vs bupropion4 Varenicline vs NRT4 | 10 4 3 2 | 2.31 (2.01-2.66) 2.09 (1.56-2.78) 1.52 (1.22-1.88) 1.13 (0.94-1.35) | 4443 1272 1622 778 |
| Mecamylamine + NRT vs NRT+ placebo6 | 1 | 37.5% vs 12.5% | 48 |
| Simple advice vs usual care10-13 | 17 | 1.66 (1.42-1.94) | 15,930 |
| Patient-initiated telephone quit line vs usual care14 | 9 | 1.37 (1.26-1.50) | 24,000 |
| NRT, nicotine replacement therapy. *An effect size >1.0 means that patients using this intervention are more likely not to smoke at 6 to 12 months; larger numbers correlate with greater effectiveness | |||
These interventions are not supported
A review of placebo-controlled RCTs found no evidence of improved abstinence at 6 to 12 months with fluoxetine, paroxetine, sertraline, venlafaxine, citalopram, or monoamine oxidase inhibitors, alone or as adjuncts to NRT.2
No good evidence supports using anxiolytics, silver acetate, Nicobrevin (a nicotine-free smoking cessation aid), lobeline, or naltrexone for smoking cessation.7-9
Simple advice and quit lines help
A Cochrane review of 17 RCTs found that simple advice improved quit rates and maintenance of abstinence at 12 months.10-13
A review of 9 RCTs (N>24,000). found that telephone quit lines increased abstinence, particularly after more than 2 sessions.14
No high-quality studies demonstrate the effectiveness of acupuncture, hypnotherapy, or acupressure for smoking cessation.15,16
Recommendations
The Agency for Health Care Research and Quality recommends counseling (including individual, group, and telephone sessions and brief physician advice) in addition to sustained-release bupropion, NRT, and varenicline as first-line agents. It considers clonidine and nortriptyline second-line therapies.17
1. Silagy C, et al. Nicotine replacement therapy for smoking cessation. Cochrane Database Syst Rev. 2008;(3):CD000146.-
2. Hughes JR, Stead LF, Lancaster T. Antidepressants for smoking cessation. Cochrane Database Syst Rev. 2010;(4):CD000031.-
3. Gourlay SG, Stead LF, Benowitz NL. Clonidine for smoking cessation. Cochrane Database Syst Rev. 2008;(3):CD000058.-
4. Cahill K, Stead LF, Lancaster T. Nicotine receptor partial agonists for smoking cessation. Cochrane Database Syst Rev. 2011;(2):CD006103.-
5. Product Information for Chantix. New York, NY: Pfizer; 2006.
6. Lancaster T, Stead LF. Mecamylamine for smoking cessation. Cochrane Database Syst Rev. 2009;(1):CD001009.-
7. Hughes JR, Stead LF, Lancaster T. Anxiolytics for smoking cessation. Cochrane Database Syst Rev. 2010;(1):CD002849.-
8. Lancaster T, Stead LF. Silver acetate for smoking cessation. Cochrane Database Syst Rev. 2009;(2):CD000191.-
9. David S, Lancaster T, Stead LF, et al. Opioid antagonists for smoking cessation. Cochrane Database Syst Rev. 2009;(4):CD003086.-
10. Lancaster T, Stead LF. Self-help interventions for smoking cessation. Cochrane Database Syst Rev. 2009;(2):CD001118.-
11. Lancaster T, Stead LF. Physician advice for smoking cessation. Cochrane Database Syst Rev 2008;(2):CD000165.-
12. Lancaster T, Stead LF. Individual behavioral counseling for smoking cessation. Cochrane Database Syst Rev. 2008;(4):CD001292.-
13. Stead LF, Lancaster T. Group behavior therapy programs for smoking cessation. Cochrane Database Syst Rev. 2009;(2):CD001007.-
14. Stead LF, Perera R, Lancaster T. Telephone counseling for smoking cessation. Cochrane Database Syst Rev. 2009;(3):CD002850.-
15. White AR, Rampes H, Campbell JL. Acupuncture and related interventions for smoking cessation. Cochrane Database Syst Rev. 2008;(4):CD000009.-
16. Abbot NC, Stead LF, White AR, et al. Hypnotherapy for smoking cessation. Cochrane Database Syst Rev. 2010;(10):CD001008.-
17. Fiore MC, Jaén CR, Baker TB, et al. Treating Tobacco Use and Dependence: 2008 Update. Rockville, MD: US Department of Health and Human Services, Public Health Service; May 2008.
NICOTINE REPLACEMENT THERAPY (NRT), bupropion, nortriptyline, clonidine, and varenicline are all effective, although insufficient evidence exists to recommend one intervention over another (SOR: A, systematic reviews).
Effective nonpharmacologic interventions include brief physician advice and more intensive counseling, such as proactive telephone counseling, group and individual counseling, and use of quit lines (SOR: A, systematic reviews).
Evidence summary
NRT. A Cochrane review of 111 randomized controlled trials (RCTs) with a total of >40,000 subjects evaluated abstinence rates after 6 months of NRT and placebo or no treatment.1 All forms of NRT increased abstinence vs placebo or no treatment, independent of setting, duration of treatment, and intensity of nonpharmacologic therapies. Overlapping confidence intervals suggested that no one form of NRT was superior. (The TABLE summarizes all the studies discussed here.)
Bupropion. A Cochrane review of 36 RCTs (N=11,140) showed higher abstinence rates with bupropion than placebo after ≥6 months of follow-up (average quit rate 17% vs 9%). Duration (6 vs 12 months) and intensity (150 vs 300 mg) of therapy didn’t influence the results.2 Six separate RCTs comparing bupropion plus NRT with NRT alone showed significant heterogeneity, but found no significant differences using a mixed-effects model.2
Nortriptyline. A Cochrane review that pooled results from 6 RCTs (N=975) showed superior 6-month abstinence rates for nortriptyline compared with placebo.2 Adding nicotine patches in other RCTs (N=1219) didn’t change abstinence rates.2 No long-term studies have examined other tricyclic antidepressants.
Clonidine. A pooled analysis of 6 RCTs found clonidine superior to placebo after ≥12 weeks of follow-up.3 Results were heavily influenced by one trial limited to heavy smokers and poor tolerability due to adverse effects of therapy, especially sedation and dry mouth.
Nicotine receptor partial agonists and antagonists. Standard dose varenicline was more than twice as likely as placebo to produce abstinence at 6 months in a Cochrane review of 10 RCTs.4 Lower doses were slightly less effective, but had fewer side effects. Adverse effects included mild to moderate nausea and sleep disorders; causation has not been established between varenicline and rare postmarketing reports of severe psychiatric disturbances.4,5
The pooled results of 3 RCTs suggested that varenicline was superior to bupropion, but different abstinence rates for bupropion users in other placebo-controlled trials necessitate caution in interpreting these results.4 Varenicline was not superior to NRT.4
One RCT (N=48) comparing nicotine patches plus the nicotine antagonist mecamylamine with patches plus placebo found improved abstinence rates at 6 and 12 months; a larger RCT didn’t support these findings.6
Table
How effective are smoking cessation interventions?
| Intervention | No. of studies | Effect size* (95% confidence interval) | Total N |
|---|---|---|---|
| NRT vs placebo or no treatment1 | 111 | 1.58 (1.50-1.66) | >40,000 |
| Bupropion vs placebo2 | 36 | 1.69 (1.53-1.85) | 11,140 |
| Bupropion 300 mg/d vs 150 mg/d2 | 3 | 1.08 (0.93-1.26) | 2042 |
| Bupropion + NRT vs NRT2 | 6 | 1.23 (0.67-2.26) | 1106 |
| Nortriptyline vs placebo2 | 6 | 2.03 (1.48-2.78) | 975 |
| Nortriptyline + NRT vs NRT2 | 4 | 1.29 (0.97-1.72) | 1219 |
| Clonidine vs placebo3 | 6 | 1.63 (1.22-2.18) | 776 |
| Varenicline vs placebo, standard dose4 Varenicline vs placebo, low dose4 Varenicline vs bupropion4 Varenicline vs NRT4 | 10 4 3 2 | 2.31 (2.01-2.66) 2.09 (1.56-2.78) 1.52 (1.22-1.88) 1.13 (0.94-1.35) | 4443 1272 1622 778 |
| Mecamylamine + NRT vs NRT+ placebo6 | 1 | 37.5% vs 12.5% | 48 |
| Simple advice vs usual care10-13 | 17 | 1.66 (1.42-1.94) | 15,930 |
| Patient-initiated telephone quit line vs usual care14 | 9 | 1.37 (1.26-1.50) | 24,000 |
| NRT, nicotine replacement therapy. *An effect size >1.0 means that patients using this intervention are more likely not to smoke at 6 to 12 months; larger numbers correlate with greater effectiveness | |||
These interventions are not supported
A review of placebo-controlled RCTs found no evidence of improved abstinence at 6 to 12 months with fluoxetine, paroxetine, sertraline, venlafaxine, citalopram, or monoamine oxidase inhibitors, alone or as adjuncts to NRT.2
No good evidence supports using anxiolytics, silver acetate, Nicobrevin (a nicotine-free smoking cessation aid), lobeline, or naltrexone for smoking cessation.7-9
Simple advice and quit lines help
A Cochrane review of 17 RCTs found that simple advice improved quit rates and maintenance of abstinence at 12 months.10-13
A review of 9 RCTs (N>24,000). found that telephone quit lines increased abstinence, particularly after more than 2 sessions.14
No high-quality studies demonstrate the effectiveness of acupuncture, hypnotherapy, or acupressure for smoking cessation.15,16
Recommendations
The Agency for Health Care Research and Quality recommends counseling (including individual, group, and telephone sessions and brief physician advice) in addition to sustained-release bupropion, NRT, and varenicline as first-line agents. It considers clonidine and nortriptyline second-line therapies.17
1. Silagy C, et al. Nicotine replacement therapy for smoking cessation. Cochrane Database Syst Rev. 2008;(3):CD000146.-
2. Hughes JR, Stead LF, Lancaster T. Antidepressants for smoking cessation. Cochrane Database Syst Rev. 2010;(4):CD000031.-
3. Gourlay SG, Stead LF, Benowitz NL. Clonidine for smoking cessation. Cochrane Database Syst Rev. 2008;(3):CD000058.-
4. Cahill K, Stead LF, Lancaster T. Nicotine receptor partial agonists for smoking cessation. Cochrane Database Syst Rev. 2011;(2):CD006103.-
5. Product Information for Chantix. New York, NY: Pfizer; 2006.
6. Lancaster T, Stead LF. Mecamylamine for smoking cessation. Cochrane Database Syst Rev. 2009;(1):CD001009.-
7. Hughes JR, Stead LF, Lancaster T. Anxiolytics for smoking cessation. Cochrane Database Syst Rev. 2010;(1):CD002849.-
8. Lancaster T, Stead LF. Silver acetate for smoking cessation. Cochrane Database Syst Rev. 2009;(2):CD000191.-
9. David S, Lancaster T, Stead LF, et al. Opioid antagonists for smoking cessation. Cochrane Database Syst Rev. 2009;(4):CD003086.-
10. Lancaster T, Stead LF. Self-help interventions for smoking cessation. Cochrane Database Syst Rev. 2009;(2):CD001118.-
11. Lancaster T, Stead LF. Physician advice for smoking cessation. Cochrane Database Syst Rev 2008;(2):CD000165.-
12. Lancaster T, Stead LF. Individual behavioral counseling for smoking cessation. Cochrane Database Syst Rev. 2008;(4):CD001292.-
13. Stead LF, Lancaster T. Group behavior therapy programs for smoking cessation. Cochrane Database Syst Rev. 2009;(2):CD001007.-
14. Stead LF, Perera R, Lancaster T. Telephone counseling for smoking cessation. Cochrane Database Syst Rev. 2009;(3):CD002850.-
15. White AR, Rampes H, Campbell JL. Acupuncture and related interventions for smoking cessation. Cochrane Database Syst Rev. 2008;(4):CD000009.-
16. Abbot NC, Stead LF, White AR, et al. Hypnotherapy for smoking cessation. Cochrane Database Syst Rev. 2010;(10):CD001008.-
17. Fiore MC, Jaén CR, Baker TB, et al. Treating Tobacco Use and Dependence: 2008 Update. Rockville, MD: US Department of Health and Human Services, Public Health Service; May 2008.
Evidence-based answers from the Family Physicians Inquiries Network
When should we treat isolated high triglycerides?
No evidence exists that treating isolated high triglyceride levels in the absence of other risk factors prevents coronary events. Although elevated triglycerides in some studies correlates with coronary events, the association weakens when controlled for factors such as diabetes, high-density lipoprotein (HDL) and low-density lipoprotein (LDL) cholesterol, body mass index, and other cardiac risk factors.
Coincident lowering of triglycerides, while treating other dyslipidemias (such as high LDL and low HDL), can contribute to decreasing coronary events (strength of recommendation [SOR]: A, based randomized controlled trials). Treating triglyceride levels over 500 to 1000 mg/dL may reduce the risk of pancreatitis (SOR: C, expert opinion).
Evidence summary
Truly isolated hypertriglyceridemia is rare. To date, no good trials directly address the effect of reducing truly isolated hypertriglyceridemia on cardiovascular morbidity or mortality. High triglycerides are usually accompanied by other features of the “metabolic syndrome” (low HDL, high LDL, insulin resistance, diabetes, hypertension, and obesity), making it almost impossible to look at these in isolation or attribute risk to a specific component.1
Whether high triglyceride levels pose risk in the true absence of these other metabolic factors is controversial. One meta-analysis of 17 population-based prospective studies of triglycerides and cardiovascular disease (including 57,000 patients) showed high triglyceride levels to be predictive of cardiac events, even when adjusted for HDL and other risk factors (age, total and LDL cholesterol, smoking, body mass index, and blood pressure).2 After adjusting for these other risk factors, the authors found an increased risk for all cardiac endpoints (myocardial infarction, death, etc) of 14% for men and 32% for women (Men: relative risk [RR]=1.14; 95% confidence interval [CI], 1.05–1.28; Women: RR=1.37; 95% CI, 1.13–1.66).
Another meta-analysis of 3 prospective intervention trials with 15,880 enrolled subjects found that triglyceride levels did not provide any clinically meaningful information about risk beyond that provided by other cholesterol subfractions.3
In treatment trials, the most impressive risk reductions come from the groups who fit the lipid triad of low HDL, high LDL, and high triglycerides. Low levels of HDL appear to interact with hypertriglyceridemia to increase coronary risk, and all studies showing improved outcomes have simultaneously increased HDL while lowering triglycerides.4-6 In 3 large-scale prospective, placebo-controlled trials (the Helsinki Heart Study, a primary prevention study, and the VA-HIT and Bezafibrate Infarction Prevention trials, both secondary prevention studies), lowering triglycerides and raising HDL concurrently improved outcomes.5 Successful dietary and medical interventions, especially with statins and fibrates, improved overall lipid profiles—not just triglyceride levels.
Accordingly, elevated triglycerides should prompt providers to rigorously identify these other risk factors for cardiovascular morbidity and mortality, which may not be immediately obvious. In the absence of such other factors, no evidence exists to guide therapy. Expert opinion7,8 supported by epidemiologic evidence9 suggests that patients with triglyceride levels of 500 to 1000 mg/dL may have an increased risk of pancreatitis. Accordingly, providers should consider therapy to lower triglycerides to less than 500 in these patients, regardless of accompanying risk factors.
Recommendations from others
The American College of Physicians, the European Society of Cardiology, and the US Preventive Services Task Force do not recommend screening for hypertriglyceridemia. Clinical guidelines of the National Cholesterol Education Program/Adult Treatment Panel III (NCEP/ATP III), American Heart Association/American College of Cardiology, and the American Diabetes Association all support LDL lowering as the primary target of therapy based on the patients risk profile.10 NCEP/ATP III has identified triglyceride levels of <150 as normal, 150–199 as borderline high, 200–499 as high, and 500 as very high.7
A patient with high triglycerides should prompt a search for components of the “meta-bolic syndrome” and secondary causes, including high dietary fat, high alcohol intake, drugs (steroids, beta-blockers, high-estrogen oral contraceptives), medical conditions (hypothyroidism, nephrosis, renal failure, liver disease, Cushing disease, and lupus), and rare familial dyslipidemias.7,10,11
Elevated triglyceride level? First look at the big picture
Donald C. Spencer, MD, MBA
University of North Carolina at Chapel Hill
Observing the pendulum swings of medical knowledge over time is one of the hallmarks of the experienced family physician. As a student, I was warned of the evils of high triglycerides, only to enter a period in the 1970s and 1980s of therapeutic nihilism when triglycerides were not thought to be an independent coronary risk factor.
As outlined here, the pendulum is moving toward a more complex consideration of the effect of triglycerides on heart disease—and what we should do about it. Our patients are better served when we focus on total coronary risk rather than a specific level of triglycerides. An elevated triglyceride level leads me first to look at the glucose. I have found several poorly controlled or even new diabetic patients this way. By then following the adage to “major on the majors and minor on the minors,” I have focused on glucose and LDL control to the benefit of my patients.
1. Forrester JS. Triglycerides: risk factor or fellow traveler? Curr Opin Cardiol 2001;16:261-264.
2. Austin MA, Hokanson JE, Edwards KL. Hypertriglyceridemia as a cardiovascular risk factor. Am J Cardiol 1998;81(4A):7B-12B.
3. Avins AL, Neuhaus JM. Do triglycerides provide meaningful information about heart disease risk? Arch Intern Med 2000;160:1937-1944.
4. Rubins HB, Robins SJ, Collins D, et al. Gemfibrozil for the secondary prevention of coronary heart disease in men with low levels of high-density lipoprotein cholesterol. Veterans Affairs High-Density Lipoprotein Cholesterol Intervention Trial Study Group. N Engl J Med 1999;341:410-418.
5. Secondary prevention by raising HDL cholesterol and reducing triglyceride in patients with coronary disease: the Bezafibrate Infarction Prevention (BIP) Study. Circulation 2000;102:21-27.
6. Effect of fenofibrate on progression of coronary-artery disease in type 2 diabetes: the Diabetes Atherosclerosis Intervention Study a randomised study. Lancet 2001;357:905-910.
7. Expert Panel on Detection. Evaluation and. Treatment of High Blood Cholesterol in Adults. Executive Summary of the Third Report of the National Cholesterol Education Program (NCEP). Expert Panel on Detection, Evaluation, and Treatment of High Blood Cholesterol in Adults (Adult Treatment Panel III). JAMA 2001;285:2486-2497.
8. Chait A, Brunzell JD. Chylomicronemia syndrome. Adv Intern Med 1992;37:249-273.
9. Athyros VG, Giouleme OI, Nikolaidis NL, et al. Long-term follow-up of patients with acute hypertriglyceridemia-induced pancreatitis. J Clin Gastroenterol 2002;34:472-475.
10. Breuer HW. Hypertriglyceridemia: a review of clinical relevance and treatment options: focus on cerivastatin. Curr Med Res Opin 2001;17:60-73.
11. Malloy MJ, Kane JP. A risk factor for atherosclerosis: triglyceride-rich lipoproteins. Adv Intern Med 2001;47:111-136.
No evidence exists that treating isolated high triglyceride levels in the absence of other risk factors prevents coronary events. Although elevated triglycerides in some studies correlates with coronary events, the association weakens when controlled for factors such as diabetes, high-density lipoprotein (HDL) and low-density lipoprotein (LDL) cholesterol, body mass index, and other cardiac risk factors.
Coincident lowering of triglycerides, while treating other dyslipidemias (such as high LDL and low HDL), can contribute to decreasing coronary events (strength of recommendation [SOR]: A, based randomized controlled trials). Treating triglyceride levels over 500 to 1000 mg/dL may reduce the risk of pancreatitis (SOR: C, expert opinion).
Evidence summary
Truly isolated hypertriglyceridemia is rare. To date, no good trials directly address the effect of reducing truly isolated hypertriglyceridemia on cardiovascular morbidity or mortality. High triglycerides are usually accompanied by other features of the “metabolic syndrome” (low HDL, high LDL, insulin resistance, diabetes, hypertension, and obesity), making it almost impossible to look at these in isolation or attribute risk to a specific component.1
Whether high triglyceride levels pose risk in the true absence of these other metabolic factors is controversial. One meta-analysis of 17 population-based prospective studies of triglycerides and cardiovascular disease (including 57,000 patients) showed high triglyceride levels to be predictive of cardiac events, even when adjusted for HDL and other risk factors (age, total and LDL cholesterol, smoking, body mass index, and blood pressure).2 After adjusting for these other risk factors, the authors found an increased risk for all cardiac endpoints (myocardial infarction, death, etc) of 14% for men and 32% for women (Men: relative risk [RR]=1.14; 95% confidence interval [CI], 1.05–1.28; Women: RR=1.37; 95% CI, 1.13–1.66).
Another meta-analysis of 3 prospective intervention trials with 15,880 enrolled subjects found that triglyceride levels did not provide any clinically meaningful information about risk beyond that provided by other cholesterol subfractions.3
In treatment trials, the most impressive risk reductions come from the groups who fit the lipid triad of low HDL, high LDL, and high triglycerides. Low levels of HDL appear to interact with hypertriglyceridemia to increase coronary risk, and all studies showing improved outcomes have simultaneously increased HDL while lowering triglycerides.4-6 In 3 large-scale prospective, placebo-controlled trials (the Helsinki Heart Study, a primary prevention study, and the VA-HIT and Bezafibrate Infarction Prevention trials, both secondary prevention studies), lowering triglycerides and raising HDL concurrently improved outcomes.5 Successful dietary and medical interventions, especially with statins and fibrates, improved overall lipid profiles—not just triglyceride levels.
Accordingly, elevated triglycerides should prompt providers to rigorously identify these other risk factors for cardiovascular morbidity and mortality, which may not be immediately obvious. In the absence of such other factors, no evidence exists to guide therapy. Expert opinion7,8 supported by epidemiologic evidence9 suggests that patients with triglyceride levels of 500 to 1000 mg/dL may have an increased risk of pancreatitis. Accordingly, providers should consider therapy to lower triglycerides to less than 500 in these patients, regardless of accompanying risk factors.
Recommendations from others
The American College of Physicians, the European Society of Cardiology, and the US Preventive Services Task Force do not recommend screening for hypertriglyceridemia. Clinical guidelines of the National Cholesterol Education Program/Adult Treatment Panel III (NCEP/ATP III), American Heart Association/American College of Cardiology, and the American Diabetes Association all support LDL lowering as the primary target of therapy based on the patients risk profile.10 NCEP/ATP III has identified triglyceride levels of <150 as normal, 150–199 as borderline high, 200–499 as high, and 500 as very high.7
A patient with high triglycerides should prompt a search for components of the “meta-bolic syndrome” and secondary causes, including high dietary fat, high alcohol intake, drugs (steroids, beta-blockers, high-estrogen oral contraceptives), medical conditions (hypothyroidism, nephrosis, renal failure, liver disease, Cushing disease, and lupus), and rare familial dyslipidemias.7,10,11
Elevated triglyceride level? First look at the big picture
Donald C. Spencer, MD, MBA
University of North Carolina at Chapel Hill
Observing the pendulum swings of medical knowledge over time is one of the hallmarks of the experienced family physician. As a student, I was warned of the evils of high triglycerides, only to enter a period in the 1970s and 1980s of therapeutic nihilism when triglycerides were not thought to be an independent coronary risk factor.
As outlined here, the pendulum is moving toward a more complex consideration of the effect of triglycerides on heart disease—and what we should do about it. Our patients are better served when we focus on total coronary risk rather than a specific level of triglycerides. An elevated triglyceride level leads me first to look at the glucose. I have found several poorly controlled or even new diabetic patients this way. By then following the adage to “major on the majors and minor on the minors,” I have focused on glucose and LDL control to the benefit of my patients.
1. Forrester JS. Triglycerides: risk factor or fellow traveler? Curr Opin Cardiol 2001;16:261-264.
2. Austin MA, Hokanson JE, Edwards KL. Hypertriglyceridemia as a cardiovascular risk factor. Am J Cardiol 1998;81(4A):7B-12B.
3. Avins AL, Neuhaus JM. Do triglycerides provide meaningful information about heart disease risk? Arch Intern Med 2000;160:1937-1944.
4. Rubins HB, Robins SJ, Collins D, et al. Gemfibrozil for the secondary prevention of coronary heart disease in men with low levels of high-density lipoprotein cholesterol. Veterans Affairs High-Density Lipoprotein Cholesterol Intervention Trial Study Group. N Engl J Med 1999;341:410-418.
5. Secondary prevention by raising HDL cholesterol and reducing triglyceride in patients with coronary disease: the Bezafibrate Infarction Prevention (BIP) Study. Circulation 2000;102:21-27.
6. Effect of fenofibrate on progression of coronary-artery disease in type 2 diabetes: the Diabetes Atherosclerosis Intervention Study a randomised study. Lancet 2001;357:905-910.
7. Expert Panel on Detection. Evaluation and. Treatment of High Blood Cholesterol in Adults. Executive Summary of the Third Report of the National Cholesterol Education Program (NCEP). Expert Panel on Detection, Evaluation, and Treatment of High Blood Cholesterol in Adults (Adult Treatment Panel III). JAMA 2001;285:2486-2497.
8. Chait A, Brunzell JD. Chylomicronemia syndrome. Adv Intern Med 1992;37:249-273.
9. Athyros VG, Giouleme OI, Nikolaidis NL, et al. Long-term follow-up of patients with acute hypertriglyceridemia-induced pancreatitis. J Clin Gastroenterol 2002;34:472-475.
10. Breuer HW. Hypertriglyceridemia: a review of clinical relevance and treatment options: focus on cerivastatin. Curr Med Res Opin 2001;17:60-73.
11. Malloy MJ, Kane JP. A risk factor for atherosclerosis: triglyceride-rich lipoproteins. Adv Intern Med 2001;47:111-136.
Evidence-based answers from the Family Physicians Inquiries Network
Primary care family physicians and 2 hospitalist models: Comparison of outcomes, processes, and costs
- Family practice primary care physicians, rotating family practice faculty hospitalists, and full-time specialist hospitalists provide comparable care for inpatients with pneumonia.
- Subspecialist hospitalists have higher hospital charges and longer lengths of stay and use more resources.
- The use of hospitalists by hospital systems or insurers should be not be mandated.
- Hospitalists and primary care physicians can better counsel inpatients about lifestyle modification and end-of-life issues.
- OBJECTIVES: To compare the care provided by family practice primary care physicians with that provided by 2 hospitalist models: critical care hospitalists and rotating residency faculty family physician hospitalists.
- STUDY DESIGN: Retrospective chart review. A health maintenance organization mandated that all patients be admitted to a critical care hospitalist team. The family physician hospitalists admitted all other residency patients and patients of some community family physicians. The primary care physicians admitted all their other patients. We adjusted for disease severity by using the Pneumonia Severity Index, age, sex, and comorbidities.
- POPULATION: Adults admitted with pneumonia to our private urban community hospital. Exclusions included patients with nosocomial pneumonia, human immunodeficiency virus, and acquired immunodeficiency syndrome.
- OUTCOMES MEASURED: Primary (adjusted for age, sex, comorbidities, and disease severity): hospital charges, length of stay, in-hospital mortality, readmissions, and returns to the emergency room. Secondary: chest radiographs, intensive care use, blood and sputum cultures, compliance with American Thoracic Society guidelines, lifestyle and end-of-life counseling.
- RESULTS: Of 97 patients, 21 were admitted to the critical care hospitalists, 53 to the family physician hospitalists, and 23 to primary care physicians. The mean charge ($5680) by the primary care physicians was significantly lower than that of the critical care hospitalists ($10,231; P = .005) and trended toward being lower than that of the family physician hospitalists ($7699; P = .08). The patients of critical care and family physician hospitalists had longer mean lengths of stay (critical care hospitalists, 3.8 days; family physician hospitalists, 3.9 days) than did those of the primary care physicians (2.6 days; P = .04 and .01, respectively). Compared with the primary care physicians, the critical care hospitalists were more likely to obtain at least 2 chest x-rays (odds ratio, 4.1; 95% confidence interval, 1.1–15.5) and trended toward increased odds of lengthy stay in the intensive care unit (odd ratio, 2.9; 95% confidence interval, 0.6–14.6). We found no other significant differences in primary or secondary outcomes.
- CONCLUSIONS: Claims of better and cheaper care by hospitalists need further investigation. Meanwhile, the use of hospitalists should not be mandated, and the use of family physicians as hospitalists should be considered a good alternative to the use of subspecialists.
The hospitalist movement has promised to improve the quality of inpatient care, increase patient satisfaction, and decrease costs.1 Many hospitals, practices, and managed care corporations have adopted this model of care,2 but whether this model has fulfilled its promises is unknown. Those who favor hospitalists have argued that hospitalists offer more efficient care by increasing quality and decreasing costs. Detractors are concerned about potential substandard quality through aggressive discharge policies and loss of continuity of care. Unfortunately, both positions are based largely on untested assumptions. We identified 6 peer-reviewed articles directly comparing hospitalists and primary care physicians.3-8 Another 314 were descriptive studies, editorials, letters, and news pieces arguing about the potential risks and benefits of the hospitalist movement.
Hospitalists have been described as physicians who spend over one fourth of their time exclusively in the hospital caring for other physicians’ patients only during that admission.9 Others believe the hospitalist movement more accurately encompasses a broad spectrum of how inpatient care is organized,10 including primary care physicians managing their own inpatients and seeing clinic patients, primary care physicians sharing week- or month-long periods of exclusive hospital care with partners, or excluding the primary care physician from inpatient care by using dedicated inpatient-only physicians who may be family physicians, internists, or specialists.
The scant literature comparing care provided by hospitalists and primary care physicians has several methodologic constraints including before and after designs that may have time-effect bias,11-15 inappropriately assigning subspecialists to the primary care group,3 restricting efficiency tools such as nurse managers and discharge planners to the intervention group,4-6 failing to account for differential involvement of house staff,7,11 using possibly unreliable outcomes,8 and relying exclusively on claims data.11,14 Two recent studies avoided many of these pitfalls and found no differences between different types of hospitalists, but did not compare them with primary care physicians.16,17 We designed our study to address multiple methodologic concerns and determine whether differences in outcomes, processes of care, and costs exist between these multiple models of inpatient care.
Methods
Setting
In 1997 a large regional health maintenance organization in Colorado mandated that all its inpatients be admitted by a pulmonology or critical care hospitalist team to the exclusion of their primary care physicians. Rose Medical Center, a 420-bed private community hospital in Denver, Colorado, serves as a family practice residency training site in which residents care for patients under the guidance of resident faculty and community primary care physicians. We recognized the health maintenance orgaization’s program as a natural experiment and an opportunity to address some of the design limitations of prior studies by comparing the care delivered simultaneously by these 3 inpatient models.
Subjects and study design
We conducted a retrospective cohort study of all patients admitted between April 1997 and March 1998 with a primary diagnosis of pneumonia as identified by codes from the International Classification of Diseases, Ninth Revision. We studied pneumonia care because of the high incidence of pneumonia in our institution and the existence of a valid, population-based measure of disease severity, the Pneumonia Severity Index (PSI; see Statistical Methods). In addition, focusing on 1 diagnosis allowed for a direct and detailed analysis of the process of care. To eliminate potential biases produced by different outpatient physician specialties, we excluded patients who did not have a family physician as a primary care provider. Patients also were excluded if they were younger than 18 years, had human immunodeficiency virus or acquired immunodeficiency syndrome, had exclusively nosocomial pneumonia, or had the diagnosis of pneumonia subsequently ruled out. Ninety-seven patients were included. Data were collected by standardized chart abstraction and entered into a Microsoft Access database. The chart abstraction was performed by research assistants who had no knowledge of whether the attending physician was a primary care physician or a hospitalist.
Patients were grouped based on the status of their inpatient attending physicians of record. The critical care hospitalists represented a group of subspecialty critical care pulmonologists contracted by a large health maintenance organization to care for all its inpatients. The family physician hospitalists represented rotating family medicine faculty who worked exclusively in the hospital for 8 weeks each year. Some patients under the care of family physician hospitalists originated from the residency’s continuity clinic, and others came from the practices of approximately 30 community family physicians for whom the family physician hospitalist acts as a hospitalist service. Community family medicine primary care physicians cared for their own patients and continued their outpatient practices. Family medicine house staff was involved in the care of inpatients from all groups.
Patients’ insurance plans rather than physician referral or self-referral determined whether they were assigned to the critical care hospitalist, family physician hospitalist, or primary care physician group. Accordingly, there were instances when a primary care physician had some patients admitted to the critical care hospitalist because the patient was a member of this particular health maintenance organization and also because the physician cared directly for his other patients in the hospital.
Outcome measures
We looked at 5 primary patient- and policy-oriented outcomes that have been validated as indicators of quality of inpatient care: in-hospital mortality, length of stay, hospital charges, 7-day readmissions, and 7- and 30-day returns to the emergency department.18,19 We included Colorado data from the Healthcare Cost and Utilization Project, when available, to serve as a reference standard.20 In addition, we chose 7 validated secondary “process of care”outcomes21 to further describe the practice behaviors of the 3 groups: documentation of lifestyle modification counseling (tobacco cessation, exercise, etc), documentation of end-of-life counseling, compliance with contemporary guidelines from the American Thoracic Society for treating community-acquired pneumonia,21 length of stay in intensive care, and the use of chest radiographs and blood and sputum cultures.
Statistical methods
All statistical analyses were performed with SAS version 6.12. Patient demographic and clinical characteristics were analyzed with chi-square test and analysis of variance, when appropriate. We controlled for disease severity with the PSI, a well-validated, population-based severity of illness score for inpatients with pneumonia.22,23
Multiple and logistic regressions were used to control for disease severity and potential confounders. Our models included the PSI class and those characteristics that were statistically significantly different (ie, diagnosis of hypertension) or showed a trend toward difference and were felt to be potentially clinically significant (diagnosis of diabetes, effusion on chest x-ray, mental status at admission), in addition to sex and age. Logarithmic transformations of non-normal data were conducted, when appropriate. We eliminated as extreme outliers 3 cases (2 under the care of critical care hospitalists and 1 under the care of family physician hospitalists) whose outcomes were 2 standard deviations or more beyond the mean. For example, 1 patient had a rare clotting disorder, stayed in intensive care for 30 days, required an orphan drug at $6000 per dose, and had charges well in excess of $1 million. This study was approved by the Rose Medical Center and Health One Institutional Review Board.
Results
Demographic and clinical characteristics
Table 1 provides the demographic and clinical descriptions of patients admitted by the different admitting physician models. Patients in the different groups were similar, with 2 exceptions: hypertension was significantly more common in the critical care hospitalist group than in the other groups (P < .05), and there was a trend toward more diabetes in the critical care hospitalist group that did not quite reach statistical significance. Nonsignificant trends also existed for PSI, effusion on chest x-ray, and mental status, with more effusions and acute mental status changes occurring in the critical care hospitalist group, more chronic altered mental status in the family physician hospitalist group, and greater severity of illness in the critical care hospitalist group. Otherwise, demographics, disease severity, and comorbidities were comparable.
TABLE 1
Demographic and clinical characteristics
| Admission group | |||
|---|---|---|---|
| Variable | Critical care hospitalists | Family physician hospitalists | Primary care physicians |
| Total† | 22 (21) | 54 (53) | 23 (23) |
| Demographics | |||
| Age, y‡ | 70 (4) | 66 (3) | 67 (4) |
| Male† | 57 (12) | 62 (33) | 48 (11) |
| Female† | 43 (9) | 38 (20) | 52 (12) |
| Comorbidities† | |||
| Hypertension* | 29 (6) | 23 (12) | 54 (12) |
| Diabetes§ | 0 (0) | 9 (5) | 22 (5) |
| Mental status | |||
| Acute changes | 14 (3) | 6 (3) | 0 (0) |
| Chronic changes | 14 (3) | 26 (14) | 17 (4) |
| Effusion on chest x-ray | 33 (7) | 24 (13) | 17 (4) |
| Renal disease | 10 (2) | 6 (3) | 4 (1) |
| Liver disease | 5 (1) | 2 (1) | 4 (1) |
| Cerebrovascular disease | 14 (3) | 11 (6) | 13 (3) |
| Coronary artery disease | 24 (5) | 27 (14) | 22 (5) |
| Heart failure | 24 (5) | 23 (12) | 18 (4) |
| Cancer | 0 (0) | 2 (1) | 4 (1) |
| Nursing home resident | 9 (2) | 4 (2) | 13 (3) |
| Smokers | 19 (4) | 37 (20) | 26 (6) |
| Vital signs/laboratory values‡ | |||
| Heart rate | 92 (5) | 94 (3) | 92 (5) |
| Respiratory rate | 24 (2) | 24 (1) | 23 (2) |
| Systolic blood pressure | 124 (6) | 127 (4) | 136 (6) |
| Temperature (°F) | 99 (0) | 99 (0) | 99 (0) |
| Pulse oximetry | 86 (2) | 88 (1) | 89 (2) |
| Blood urea nitrogen | 20 (3) | 20 (2) | 22 (3) |
| Glucose | 123 (16) | 130 (10) | 154 (16) |
| Hematocrit | 40 (1) | 41 (1) | 39 (1) |
| Sodium | 136 (1) | 136 (1) | 137 (1) |
| Disease severity | |||
| PSI, raw data‡ | 103 (10) | 85 (6) | 99 (9) |
| PSI risk† | |||
| Low | 10 (2) | 24 (13) | 22 (5) |
| Moderate | 29 (6) | 19 (10) | 26 (6) |
| High | 62 (13) | 55 (30) | 52 (12) |
| *P = .024. | |||
| †Percentage (number of patients). | |||
| ‡Mean (± standard deviation). | |||
| §P = .058; otherwise, P > .05 (chi-square for ordinal and categorical variables, analysis of variance for continuous variables). | |||
| PSI, Pneumonia Severity Index. | |||
Primary outcomes
After controlling for severity of illness and intergroup differences, we found that the critical care hospitalist team had the highest mean hospital charge ($10,231), followed by the family physician hospitalist ($7699) and the primary care physician ($5680) groups (Figure 1). The difference in charges between the primary care physician and the critical care hospitalist groups was statistically significant (P = .005) and approached significance between the primary care physician and family physician hospitalist groups (P = .08). The critical care hospitalist and family physician hospitalist groups had longer mean lengths of stay than did the primary care physician group (P = .04 and .01, respectively; Figure 2). The other primary outcomes were rare: 1 primary care physician patient died (4.5%), 2 critical care hospitalist patients died (9.5%) and no family physician hospitalist patients died; no primary care physician patients were readmitted, 1 critical care hospitalist patient was readmitted (4.8%), and 2 family physician hospitalist patients were readmitted (3.8%). There was 1 return to the emergency room in the cohort, in the family physician hospitalist group (1.9%). No intergroup comparisons between these unadjusted rates were statistically significant (P > .05).
FIGURE 1
Hospital charges (in US dollars; with 95% confidence intervals)*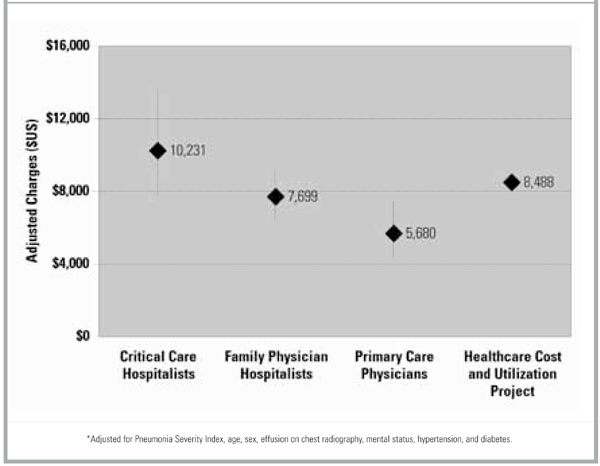
FIGURE 2
Length of stay (in days; with 95% confidence intervals)*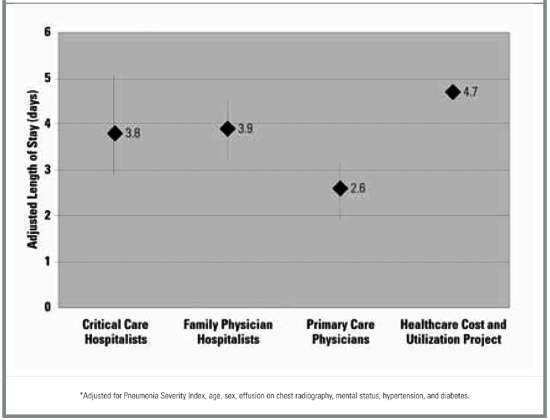
Secondary outcomes
After controlling for severity of illness and intergroup differences, we found that the critical care hospitalists were more likely to obtain 2 or more chest x-rays than the primary care physicians. There were nonsignificant trends toward longer stays in intensive care, greater likelihood of obtaining sputum cultures, and documenting end-of-life counseling by the critical care hospitalists compared with the primary care physicians. For the family physician hospitalists, there were nonsignificant trends toward better compliance with American Thoracic Society antibiotic guidelines and greater likelihood of documenting end-of-life and lifestyle modification counseling compared with the primary care physicians (Table 2).
TABLE 2
Secondary “process of care” outcomes*
| Outcome | Primary care physicians† | Critical care hospitalists | Family physician hospitalists |
|---|---|---|---|
| Chest x-ray (≥2) | 1 | 4.1 (1.1–15.5) | 0.9 (0.3–2.6) |
| ICU stay (≥1 d) | 1 | 2.9 (0.6–14.6) | 0.5 (0.1–3) |
| ATS guideline adherence | 1 | 1.4 (0.4–5.0) | 2.3 (0.8–7.0) |
| Sputum culture obtained | 1 | 2.3 (0.7–8.0) | 0.6 (0.2–1.7) |
| Blood culture obtained | 1 | 1.3 (0.4–4.8) | 1.2 (0.4–3.5) |
| End-of-life counseling documented | 1 | 3.0 (0.6–14.3) | 3.1 (0.7–12.9) |
| Lifestyle modification documented | 1 | 1.1 (0.3–4.5) | 2.7 (0.8–8.7) |
| *Data are presented as odds ratio (95% confidence interval). Odds ratios were adjusted for Pneumonia Severity Index, age, sex, effusion on chest radiography, mental status, hypertension, and diabetes. | |||
| †Reference group. | |||
| ATS, American Thoracic Society; ICU, intensive care unit. | |||
Discussion
Our study provided a unique perspective on the impact of different models of caring for inpatients on the quality, processes, and cost of care. We believe this is the first study to successfully address several methodologic limitations of previous studies: potential time-effect bias, inappropriate controls, differential assignment of house staff and case management resources, unvalidated outcomes, and lack of clinical data.
In addition, we reduced the potential biases inherent in comparing different hospitals and different outpatient physician specialties and used a standardized chart abstraction instrument to avoid the problems inherent in using claims data. As a result, we were able to examine processes of care and use the PSI, an extensively validated tool, to control for disease severity. This study represents an effectiveness study of a real-life intervention by a health maintenance organization to mandate the use of hospitalists. Although the retrospective design of this study may create the potential for bias, there was inadequate advanced notice of the implementation of this hospitalist plan to allow for prospective analysis. Despite not being randomly assigned to 1 of the 3 groups, patients were quite similar with the exceptions of hypertension and possibly diabetes and PSI, which we controlled for in the statistical analysis.
Unfortunately, this was a small study that lacked sufficient power to detect modest differences between groups because the health maintenance organization sponsoring the critical care hospitalist group abandoned the program after 1 year. In addition, the differences in disease severity might have been significant in a larger sample. However, even after controlling for these differences statistically, we found no large differences for mortality, readmission, or returns to the emergency room.
Despite insufficient power to observe statistically significant differences in these relatively rare but important pneumonia outcomes, we did detect a substantial difference in adjusted hospital charges and a modest difference in length of stay. Subspecialist hospitalists had significantly higher adjusted charges than did primary care family physicians. Although the comparison across groups failed to show statistically significant differences, we did see a trend of increasing charges as the degree of hospitalization increased. These higher costs may be explained in part by primary care physicians advising shorter lengths of stay and the subspecialists’ increased use of multiple chest x-rays and trends toward greater use of other resources (eg, intensive care and blood and sputum cultures). Alternatively, some of the difference in charges may reflect differing levels of continuity; the critical care hospitalists had no outpatient continuity with their inpatients, whereas the family physician hospitalists had continuity relationships with some inpatients and the primary care physicians had relationships with all their inpatients. Thus the primary care physicians and, to a lesser extent, the family physician hospitalists may have had information about prior care. Hence, knowledge of previous antibiotic use might argue for the low yield of blood and sputum cultures, and having obtained an outpatient x-ray might obviate the need for another in the hospital. The critical care hospitalists’ increased length of stay and x-ray use, in conjunction with the trend toward greater use of cultures and intensive care, may in turn reflect different degrees of comfort with uncertainty between family physicians and subspecialists. Also, we examined only hospital charges rather than total costs to the system.
Interestingly, we found a trend showing that family physician hospitalists were more likely to document lifestyle modification counseling than were primary care physicians. This result should be interpreted with some caution. Our findings may indicate a true lack of performance by primary care physicians, or they may show a failure to document advice on the hospital chart, reflecting some aspect of the continuity relationship in which such discussions are relegated to the outpatient setting.We also were surprised to see the trend toward decreased end-of-life counseling by the primary care physicians. This could reflect some adverse effect of continuity, the time constraints imposed on nonhospitalists, or not documenting outpatient counseling on the inpatient record.
There were other potential sources of confounding in this study. All patients in the critical care hospitalist group were members of the same health maintenance organization, which may have introduced unmeasured bias despite our attempts to control for differences between groups. Even though we purposefully avoided differential use of house staff, its involvement in each case may have decreased any potential differences across practices.
We draw 2 important conclusions from our results. First, our findings of increased costs and length of stay for mandated hospitalists without significantly different outcomes support the assertion of the American Academy of Family Physicians, the American College of Physicians–American Society of Internal Medicine, the American Medical Association, and the National Association of Inpatient Physicians: the practice of mandating the use of hospitalists should be abandoned pending larger, more comprehensive contemporaneous trials. Second, if hospitalists are to be employed on a voluntary basis, the use of subspecialists rather than generalists may result in more costly care.
Acknowledgments
The authors thank Ralph B. D’Agonstino, Jr., PhD, of the Bowman Gray School of Medicine for his invaluable assistance in statistical methods and Cary Foster, MD, and Promoda Mahupatra, MD, for their collection of the data.
1. Wachter RM. An introduction to the hospitalist model. Ann Intern Med 1999;130:338-42.
2. Auerbach AD, Nelson EA, Lindenauer PK, et al. Physician attitudes toward and prevalence of the hospitalist model of care: results of a national survey. Am J Med 2000;109:648-53.
3. Stein MD, Hanson S, Tammaro D, Hanna L, Most AS. Economic effects of community vs hospital-based pneumonia care. J Gen Intern Med 1998;13:774-7.
4. Wachter RM, Katz P, Showstack J, Bindman AB, Goldman L. Reorganizing an academic medical service: impact on cost, quality, patient satisfaction, and education. JAMA 1998;279:1560-5.
5. Palmer HC, Armistead NS, Elnicki D, et al. The effect of a hospitalist service with nurse discharge planner on patient care in an academic teaching hospital. Am J Med 2001;111:627-32.
6. Davis KM, Koch KE, Harvey JK, et al. Effects of hospitalists on cost, outcomes, and patient satisfaction in a rural health system. Am J Med 2000;108:621-6.
7. Hackner D, Tu G, Braunstein GD, et al. The value of a hospitalist service: efficient care for the aging population? Chest 2001;119:580-9.
8. Molinari C, Short R. The effects of an HMO-hospitalist program on inpatient utilization. Am J Manag Care 2001;7:1051-17.
9. Wachter RM. An introduction to the hospitalist model. Ann Intern Med 1999;130:338-42.
10. Boschert S. “Hospitalists” may be an emerging specialty. Am Med News July 15, 1997;67.
11. Diamond HS, Goldberg E, Janosky JE. The effect of full-time faculty hospitalists on the efficiency of care at a community teaching hospital. Ann Intern Med 1998;129:197-203.
12. Bellet PS, Whitaker RC. Evaluation of a pediatric hospitalist service: impact on length of stay and hospital charges. Pediatrics 2000;105:478-84.
13. Freese RB. Clinical, logistical, and political issues in creating a hospitalist system. Ann Intern Med 1999;130:350-4.
14. Craig D, Hartka L, Likosky WH, et al. Implementation of a hospitalist system in a large health maintenance organization: the Kaiser Permanente experience. Ann Intern Med 1999;130:355-9.
15. Halpert AP, Pearson SD, LeWine HE, Mckean SC. The impact of an inpatient physician program on quality, utilization, and satisfaction. J Manag Care 2000;6:549-55.
16. Tingle LE, Lambert CT. Comparison of a family practice teaching service and a hospitalist model: costs, charges, length of stay, and mortality. Fam Med 2001;33:511-5.
17. Kearns PJ, Wang CC, Morris WJ, et al. Hospital care by hospitalbased and clinic-based faculty: a prospective, controlled trial. Arch Intern Med 2001;161:235-41.
18. Ashton CM, Del Junco DJ, Souchek J, Wray NP, Mansyur CL. The association between the quality of inpatient care and early readmission: a meta-analysis of the evidence. Med Care 1997;35:1044-59.
19. Rhew DC, Goetz MB, Shekelle PG. Evaluating quality indicators for patients with community-acquired pneumonia. Jt Comm J Qual Improv 2001;27:575-90.
20. HCUPnet Halthcare cost and utilization project. Agency for Healthcare Research and Quality, Rockville, MD. June 2002. Available at: http://www.ahrq.gov/data/hcup/hcupnet.htm. Accessed October 8, 2002.
21. Niederman MS, Bass JB, Campbell GD, et al. American Thoracic Society guidelines for the initial management of adults with community-acquired pneumonia: diagnosis, assessment of severity, and initial antimicrobial therapy. Am Rev Respir Dis 1993;148:1418-26.
22. Fine MJ, Auble TE, Yealy DM, et al. A prediction rule to identify lowrisk patients with community-acquired pneumonia. N Engl J Med 1997;336:243-50.
23. Ewig S, Kleinfeld T, Bauer T, Seifert K, Schafer H, Goke N. Comparative validation of prognostic rules for community-acquired pneumonia in an elderly population. Eur Respir J 1999;14:370-5.
- Family practice primary care physicians, rotating family practice faculty hospitalists, and full-time specialist hospitalists provide comparable care for inpatients with pneumonia.
- Subspecialist hospitalists have higher hospital charges and longer lengths of stay and use more resources.
- The use of hospitalists by hospital systems or insurers should be not be mandated.
- Hospitalists and primary care physicians can better counsel inpatients about lifestyle modification and end-of-life issues.
- OBJECTIVES: To compare the care provided by family practice primary care physicians with that provided by 2 hospitalist models: critical care hospitalists and rotating residency faculty family physician hospitalists.
- STUDY DESIGN: Retrospective chart review. A health maintenance organization mandated that all patients be admitted to a critical care hospitalist team. The family physician hospitalists admitted all other residency patients and patients of some community family physicians. The primary care physicians admitted all their other patients. We adjusted for disease severity by using the Pneumonia Severity Index, age, sex, and comorbidities.
- POPULATION: Adults admitted with pneumonia to our private urban community hospital. Exclusions included patients with nosocomial pneumonia, human immunodeficiency virus, and acquired immunodeficiency syndrome.
- OUTCOMES MEASURED: Primary (adjusted for age, sex, comorbidities, and disease severity): hospital charges, length of stay, in-hospital mortality, readmissions, and returns to the emergency room. Secondary: chest radiographs, intensive care use, blood and sputum cultures, compliance with American Thoracic Society guidelines, lifestyle and end-of-life counseling.
- RESULTS: Of 97 patients, 21 were admitted to the critical care hospitalists, 53 to the family physician hospitalists, and 23 to primary care physicians. The mean charge ($5680) by the primary care physicians was significantly lower than that of the critical care hospitalists ($10,231; P = .005) and trended toward being lower than that of the family physician hospitalists ($7699; P = .08). The patients of critical care and family physician hospitalists had longer mean lengths of stay (critical care hospitalists, 3.8 days; family physician hospitalists, 3.9 days) than did those of the primary care physicians (2.6 days; P = .04 and .01, respectively). Compared with the primary care physicians, the critical care hospitalists were more likely to obtain at least 2 chest x-rays (odds ratio, 4.1; 95% confidence interval, 1.1–15.5) and trended toward increased odds of lengthy stay in the intensive care unit (odd ratio, 2.9; 95% confidence interval, 0.6–14.6). We found no other significant differences in primary or secondary outcomes.
- CONCLUSIONS: Claims of better and cheaper care by hospitalists need further investigation. Meanwhile, the use of hospitalists should not be mandated, and the use of family physicians as hospitalists should be considered a good alternative to the use of subspecialists.
The hospitalist movement has promised to improve the quality of inpatient care, increase patient satisfaction, and decrease costs.1 Many hospitals, practices, and managed care corporations have adopted this model of care,2 but whether this model has fulfilled its promises is unknown. Those who favor hospitalists have argued that hospitalists offer more efficient care by increasing quality and decreasing costs. Detractors are concerned about potential substandard quality through aggressive discharge policies and loss of continuity of care. Unfortunately, both positions are based largely on untested assumptions. We identified 6 peer-reviewed articles directly comparing hospitalists and primary care physicians.3-8 Another 314 were descriptive studies, editorials, letters, and news pieces arguing about the potential risks and benefits of the hospitalist movement.
Hospitalists have been described as physicians who spend over one fourth of their time exclusively in the hospital caring for other physicians’ patients only during that admission.9 Others believe the hospitalist movement more accurately encompasses a broad spectrum of how inpatient care is organized,10 including primary care physicians managing their own inpatients and seeing clinic patients, primary care physicians sharing week- or month-long periods of exclusive hospital care with partners, or excluding the primary care physician from inpatient care by using dedicated inpatient-only physicians who may be family physicians, internists, or specialists.
The scant literature comparing care provided by hospitalists and primary care physicians has several methodologic constraints including before and after designs that may have time-effect bias,11-15 inappropriately assigning subspecialists to the primary care group,3 restricting efficiency tools such as nurse managers and discharge planners to the intervention group,4-6 failing to account for differential involvement of house staff,7,11 using possibly unreliable outcomes,8 and relying exclusively on claims data.11,14 Two recent studies avoided many of these pitfalls and found no differences between different types of hospitalists, but did not compare them with primary care physicians.16,17 We designed our study to address multiple methodologic concerns and determine whether differences in outcomes, processes of care, and costs exist between these multiple models of inpatient care.
Methods
Setting
In 1997 a large regional health maintenance organization in Colorado mandated that all its inpatients be admitted by a pulmonology or critical care hospitalist team to the exclusion of their primary care physicians. Rose Medical Center, a 420-bed private community hospital in Denver, Colorado, serves as a family practice residency training site in which residents care for patients under the guidance of resident faculty and community primary care physicians. We recognized the health maintenance orgaization’s program as a natural experiment and an opportunity to address some of the design limitations of prior studies by comparing the care delivered simultaneously by these 3 inpatient models.
Subjects and study design
We conducted a retrospective cohort study of all patients admitted between April 1997 and March 1998 with a primary diagnosis of pneumonia as identified by codes from the International Classification of Diseases, Ninth Revision. We studied pneumonia care because of the high incidence of pneumonia in our institution and the existence of a valid, population-based measure of disease severity, the Pneumonia Severity Index (PSI; see Statistical Methods). In addition, focusing on 1 diagnosis allowed for a direct and detailed analysis of the process of care. To eliminate potential biases produced by different outpatient physician specialties, we excluded patients who did not have a family physician as a primary care provider. Patients also were excluded if they were younger than 18 years, had human immunodeficiency virus or acquired immunodeficiency syndrome, had exclusively nosocomial pneumonia, or had the diagnosis of pneumonia subsequently ruled out. Ninety-seven patients were included. Data were collected by standardized chart abstraction and entered into a Microsoft Access database. The chart abstraction was performed by research assistants who had no knowledge of whether the attending physician was a primary care physician or a hospitalist.
Patients were grouped based on the status of their inpatient attending physicians of record. The critical care hospitalists represented a group of subspecialty critical care pulmonologists contracted by a large health maintenance organization to care for all its inpatients. The family physician hospitalists represented rotating family medicine faculty who worked exclusively in the hospital for 8 weeks each year. Some patients under the care of family physician hospitalists originated from the residency’s continuity clinic, and others came from the practices of approximately 30 community family physicians for whom the family physician hospitalist acts as a hospitalist service. Community family medicine primary care physicians cared for their own patients and continued their outpatient practices. Family medicine house staff was involved in the care of inpatients from all groups.
Patients’ insurance plans rather than physician referral or self-referral determined whether they were assigned to the critical care hospitalist, family physician hospitalist, or primary care physician group. Accordingly, there were instances when a primary care physician had some patients admitted to the critical care hospitalist because the patient was a member of this particular health maintenance organization and also because the physician cared directly for his other patients in the hospital.
Outcome measures
We looked at 5 primary patient- and policy-oriented outcomes that have been validated as indicators of quality of inpatient care: in-hospital mortality, length of stay, hospital charges, 7-day readmissions, and 7- and 30-day returns to the emergency department.18,19 We included Colorado data from the Healthcare Cost and Utilization Project, when available, to serve as a reference standard.20 In addition, we chose 7 validated secondary “process of care”outcomes21 to further describe the practice behaviors of the 3 groups: documentation of lifestyle modification counseling (tobacco cessation, exercise, etc), documentation of end-of-life counseling, compliance with contemporary guidelines from the American Thoracic Society for treating community-acquired pneumonia,21 length of stay in intensive care, and the use of chest radiographs and blood and sputum cultures.
Statistical methods
All statistical analyses were performed with SAS version 6.12. Patient demographic and clinical characteristics were analyzed with chi-square test and analysis of variance, when appropriate. We controlled for disease severity with the PSI, a well-validated, population-based severity of illness score for inpatients with pneumonia.22,23
Multiple and logistic regressions were used to control for disease severity and potential confounders. Our models included the PSI class and those characteristics that were statistically significantly different (ie, diagnosis of hypertension) or showed a trend toward difference and were felt to be potentially clinically significant (diagnosis of diabetes, effusion on chest x-ray, mental status at admission), in addition to sex and age. Logarithmic transformations of non-normal data were conducted, when appropriate. We eliminated as extreme outliers 3 cases (2 under the care of critical care hospitalists and 1 under the care of family physician hospitalists) whose outcomes were 2 standard deviations or more beyond the mean. For example, 1 patient had a rare clotting disorder, stayed in intensive care for 30 days, required an orphan drug at $6000 per dose, and had charges well in excess of $1 million. This study was approved by the Rose Medical Center and Health One Institutional Review Board.
Results
Demographic and clinical characteristics
Table 1 provides the demographic and clinical descriptions of patients admitted by the different admitting physician models. Patients in the different groups were similar, with 2 exceptions: hypertension was significantly more common in the critical care hospitalist group than in the other groups (P < .05), and there was a trend toward more diabetes in the critical care hospitalist group that did not quite reach statistical significance. Nonsignificant trends also existed for PSI, effusion on chest x-ray, and mental status, with more effusions and acute mental status changes occurring in the critical care hospitalist group, more chronic altered mental status in the family physician hospitalist group, and greater severity of illness in the critical care hospitalist group. Otherwise, demographics, disease severity, and comorbidities were comparable.
TABLE 1
Demographic and clinical characteristics
| Admission group | |||
|---|---|---|---|
| Variable | Critical care hospitalists | Family physician hospitalists | Primary care physicians |
| Total† | 22 (21) | 54 (53) | 23 (23) |
| Demographics | |||
| Age, y‡ | 70 (4) | 66 (3) | 67 (4) |
| Male† | 57 (12) | 62 (33) | 48 (11) |
| Female† | 43 (9) | 38 (20) | 52 (12) |
| Comorbidities† | |||
| Hypertension* | 29 (6) | 23 (12) | 54 (12) |
| Diabetes§ | 0 (0) | 9 (5) | 22 (5) |
| Mental status | |||
| Acute changes | 14 (3) | 6 (3) | 0 (0) |
| Chronic changes | 14 (3) | 26 (14) | 17 (4) |
| Effusion on chest x-ray | 33 (7) | 24 (13) | 17 (4) |
| Renal disease | 10 (2) | 6 (3) | 4 (1) |
| Liver disease | 5 (1) | 2 (1) | 4 (1) |
| Cerebrovascular disease | 14 (3) | 11 (6) | 13 (3) |
| Coronary artery disease | 24 (5) | 27 (14) | 22 (5) |
| Heart failure | 24 (5) | 23 (12) | 18 (4) |
| Cancer | 0 (0) | 2 (1) | 4 (1) |
| Nursing home resident | 9 (2) | 4 (2) | 13 (3) |
| Smokers | 19 (4) | 37 (20) | 26 (6) |
| Vital signs/laboratory values‡ | |||
| Heart rate | 92 (5) | 94 (3) | 92 (5) |
| Respiratory rate | 24 (2) | 24 (1) | 23 (2) |
| Systolic blood pressure | 124 (6) | 127 (4) | 136 (6) |
| Temperature (°F) | 99 (0) | 99 (0) | 99 (0) |
| Pulse oximetry | 86 (2) | 88 (1) | 89 (2) |
| Blood urea nitrogen | 20 (3) | 20 (2) | 22 (3) |
| Glucose | 123 (16) | 130 (10) | 154 (16) |
| Hematocrit | 40 (1) | 41 (1) | 39 (1) |
| Sodium | 136 (1) | 136 (1) | 137 (1) |
| Disease severity | |||
| PSI, raw data‡ | 103 (10) | 85 (6) | 99 (9) |
| PSI risk† | |||
| Low | 10 (2) | 24 (13) | 22 (5) |
| Moderate | 29 (6) | 19 (10) | 26 (6) |
| High | 62 (13) | 55 (30) | 52 (12) |
| *P = .024. | |||
| †Percentage (number of patients). | |||
| ‡Mean (± standard deviation). | |||
| §P = .058; otherwise, P > .05 (chi-square for ordinal and categorical variables, analysis of variance for continuous variables). | |||
| PSI, Pneumonia Severity Index. | |||
Primary outcomes
After controlling for severity of illness and intergroup differences, we found that the critical care hospitalist team had the highest mean hospital charge ($10,231), followed by the family physician hospitalist ($7699) and the primary care physician ($5680) groups (Figure 1). The difference in charges between the primary care physician and the critical care hospitalist groups was statistically significant (P = .005) and approached significance between the primary care physician and family physician hospitalist groups (P = .08). The critical care hospitalist and family physician hospitalist groups had longer mean lengths of stay than did the primary care physician group (P = .04 and .01, respectively; Figure 2). The other primary outcomes were rare: 1 primary care physician patient died (4.5%), 2 critical care hospitalist patients died (9.5%) and no family physician hospitalist patients died; no primary care physician patients were readmitted, 1 critical care hospitalist patient was readmitted (4.8%), and 2 family physician hospitalist patients were readmitted (3.8%). There was 1 return to the emergency room in the cohort, in the family physician hospitalist group (1.9%). No intergroup comparisons between these unadjusted rates were statistically significant (P > .05).
FIGURE 1
Hospital charges (in US dollars; with 95% confidence intervals)*
FIGURE 2
Length of stay (in days; with 95% confidence intervals)*
Secondary outcomes
After controlling for severity of illness and intergroup differences, we found that the critical care hospitalists were more likely to obtain 2 or more chest x-rays than the primary care physicians. There were nonsignificant trends toward longer stays in intensive care, greater likelihood of obtaining sputum cultures, and documenting end-of-life counseling by the critical care hospitalists compared with the primary care physicians. For the family physician hospitalists, there were nonsignificant trends toward better compliance with American Thoracic Society antibiotic guidelines and greater likelihood of documenting end-of-life and lifestyle modification counseling compared with the primary care physicians (Table 2).
TABLE 2
Secondary “process of care” outcomes*
| Outcome | Primary care physicians† | Critical care hospitalists | Family physician hospitalists |
|---|---|---|---|
| Chest x-ray (≥2) | 1 | 4.1 (1.1–15.5) | 0.9 (0.3–2.6) |
| ICU stay (≥1 d) | 1 | 2.9 (0.6–14.6) | 0.5 (0.1–3) |
| ATS guideline adherence | 1 | 1.4 (0.4–5.0) | 2.3 (0.8–7.0) |
| Sputum culture obtained | 1 | 2.3 (0.7–8.0) | 0.6 (0.2–1.7) |
| Blood culture obtained | 1 | 1.3 (0.4–4.8) | 1.2 (0.4–3.5) |
| End-of-life counseling documented | 1 | 3.0 (0.6–14.3) | 3.1 (0.7–12.9) |
| Lifestyle modification documented | 1 | 1.1 (0.3–4.5) | 2.7 (0.8–8.7) |
| *Data are presented as odds ratio (95% confidence interval). Odds ratios were adjusted for Pneumonia Severity Index, age, sex, effusion on chest radiography, mental status, hypertension, and diabetes. | |||
| †Reference group. | |||
| ATS, American Thoracic Society; ICU, intensive care unit. | |||
Discussion
Our study provided a unique perspective on the impact of different models of caring for inpatients on the quality, processes, and cost of care. We believe this is the first study to successfully address several methodologic limitations of previous studies: potential time-effect bias, inappropriate controls, differential assignment of house staff and case management resources, unvalidated outcomes, and lack of clinical data.
In addition, we reduced the potential biases inherent in comparing different hospitals and different outpatient physician specialties and used a standardized chart abstraction instrument to avoid the problems inherent in using claims data. As a result, we were able to examine processes of care and use the PSI, an extensively validated tool, to control for disease severity. This study represents an effectiveness study of a real-life intervention by a health maintenance organization to mandate the use of hospitalists. Although the retrospective design of this study may create the potential for bias, there was inadequate advanced notice of the implementation of this hospitalist plan to allow for prospective analysis. Despite not being randomly assigned to 1 of the 3 groups, patients were quite similar with the exceptions of hypertension and possibly diabetes and PSI, which we controlled for in the statistical analysis.
Unfortunately, this was a small study that lacked sufficient power to detect modest differences between groups because the health maintenance organization sponsoring the critical care hospitalist group abandoned the program after 1 year. In addition, the differences in disease severity might have been significant in a larger sample. However, even after controlling for these differences statistically, we found no large differences for mortality, readmission, or returns to the emergency room.
Despite insufficient power to observe statistically significant differences in these relatively rare but important pneumonia outcomes, we did detect a substantial difference in adjusted hospital charges and a modest difference in length of stay. Subspecialist hospitalists had significantly higher adjusted charges than did primary care family physicians. Although the comparison across groups failed to show statistically significant differences, we did see a trend of increasing charges as the degree of hospitalization increased. These higher costs may be explained in part by primary care physicians advising shorter lengths of stay and the subspecialists’ increased use of multiple chest x-rays and trends toward greater use of other resources (eg, intensive care and blood and sputum cultures). Alternatively, some of the difference in charges may reflect differing levels of continuity; the critical care hospitalists had no outpatient continuity with their inpatients, whereas the family physician hospitalists had continuity relationships with some inpatients and the primary care physicians had relationships with all their inpatients. Thus the primary care physicians and, to a lesser extent, the family physician hospitalists may have had information about prior care. Hence, knowledge of previous antibiotic use might argue for the low yield of blood and sputum cultures, and having obtained an outpatient x-ray might obviate the need for another in the hospital. The critical care hospitalists’ increased length of stay and x-ray use, in conjunction with the trend toward greater use of cultures and intensive care, may in turn reflect different degrees of comfort with uncertainty between family physicians and subspecialists. Also, we examined only hospital charges rather than total costs to the system.
Interestingly, we found a trend showing that family physician hospitalists were more likely to document lifestyle modification counseling than were primary care physicians. This result should be interpreted with some caution. Our findings may indicate a true lack of performance by primary care physicians, or they may show a failure to document advice on the hospital chart, reflecting some aspect of the continuity relationship in which such discussions are relegated to the outpatient setting.We also were surprised to see the trend toward decreased end-of-life counseling by the primary care physicians. This could reflect some adverse effect of continuity, the time constraints imposed on nonhospitalists, or not documenting outpatient counseling on the inpatient record.
There were other potential sources of confounding in this study. All patients in the critical care hospitalist group were members of the same health maintenance organization, which may have introduced unmeasured bias despite our attempts to control for differences between groups. Even though we purposefully avoided differential use of house staff, its involvement in each case may have decreased any potential differences across practices.
We draw 2 important conclusions from our results. First, our findings of increased costs and length of stay for mandated hospitalists without significantly different outcomes support the assertion of the American Academy of Family Physicians, the American College of Physicians–American Society of Internal Medicine, the American Medical Association, and the National Association of Inpatient Physicians: the practice of mandating the use of hospitalists should be abandoned pending larger, more comprehensive contemporaneous trials. Second, if hospitalists are to be employed on a voluntary basis, the use of subspecialists rather than generalists may result in more costly care.
Acknowledgments
The authors thank Ralph B. D’Agonstino, Jr., PhD, of the Bowman Gray School of Medicine for his invaluable assistance in statistical methods and Cary Foster, MD, and Promoda Mahupatra, MD, for their collection of the data.
1. Wachter RM. An introduction to the hospitalist model. Ann Intern Med 1999;130:338-42.
2. Auerbach AD, Nelson EA, Lindenauer PK, et al. Physician attitudes toward and prevalence of the hospitalist model of care: results of a national survey. Am J Med 2000;109:648-53.
3. Stein MD, Hanson S, Tammaro D, Hanna L, Most AS. Economic effects of community vs hospital-based pneumonia care. J Gen Intern Med 1998;13:774-7.
4. Wachter RM, Katz P, Showstack J, Bindman AB, Goldman L. Reorganizing an academic medical service: impact on cost, quality, patient satisfaction, and education. JAMA 1998;279:1560-5.
5. Palmer HC, Armistead NS, Elnicki D, et al. The effect of a hospitalist service with nurse discharge planner on patient care in an academic teaching hospital. Am J Med 2001;111:627-32.
6. Davis KM, Koch KE, Harvey JK, et al. Effects of hospitalists on cost, outcomes, and patient satisfaction in a rural health system. Am J Med 2000;108:621-6.
7. Hackner D, Tu G, Braunstein GD, et al. The value of a hospitalist service: efficient care for the aging population? Chest 2001;119:580-9.
8. Molinari C, Short R. The effects of an HMO-hospitalist program on inpatient utilization. Am J Manag Care 2001;7:1051-17.
9. Wachter RM. An introduction to the hospitalist model. Ann Intern Med 1999;130:338-42.
10. Boschert S. “Hospitalists” may be an emerging specialty. Am Med News July 15, 1997;67.
11. Diamond HS, Goldberg E, Janosky JE. The effect of full-time faculty hospitalists on the efficiency of care at a community teaching hospital. Ann Intern Med 1998;129:197-203.
12. Bellet PS, Whitaker RC. Evaluation of a pediatric hospitalist service: impact on length of stay and hospital charges. Pediatrics 2000;105:478-84.
13. Freese RB. Clinical, logistical, and political issues in creating a hospitalist system. Ann Intern Med 1999;130:350-4.
14. Craig D, Hartka L, Likosky WH, et al. Implementation of a hospitalist system in a large health maintenance organization: the Kaiser Permanente experience. Ann Intern Med 1999;130:355-9.
15. Halpert AP, Pearson SD, LeWine HE, Mckean SC. The impact of an inpatient physician program on quality, utilization, and satisfaction. J Manag Care 2000;6:549-55.
16. Tingle LE, Lambert CT. Comparison of a family practice teaching service and a hospitalist model: costs, charges, length of stay, and mortality. Fam Med 2001;33:511-5.
17. Kearns PJ, Wang CC, Morris WJ, et al. Hospital care by hospitalbased and clinic-based faculty: a prospective, controlled trial. Arch Intern Med 2001;161:235-41.
18. Ashton CM, Del Junco DJ, Souchek J, Wray NP, Mansyur CL. The association between the quality of inpatient care and early readmission: a meta-analysis of the evidence. Med Care 1997;35:1044-59.
19. Rhew DC, Goetz MB, Shekelle PG. Evaluating quality indicators for patients with community-acquired pneumonia. Jt Comm J Qual Improv 2001;27:575-90.
20. HCUPnet Halthcare cost and utilization project. Agency for Healthcare Research and Quality, Rockville, MD. June 2002. Available at: http://www.ahrq.gov/data/hcup/hcupnet.htm. Accessed October 8, 2002.
21. Niederman MS, Bass JB, Campbell GD, et al. American Thoracic Society guidelines for the initial management of adults with community-acquired pneumonia: diagnosis, assessment of severity, and initial antimicrobial therapy. Am Rev Respir Dis 1993;148:1418-26.
22. Fine MJ, Auble TE, Yealy DM, et al. A prediction rule to identify lowrisk patients with community-acquired pneumonia. N Engl J Med 1997;336:243-50.
23. Ewig S, Kleinfeld T, Bauer T, Seifert K, Schafer H, Goke N. Comparative validation of prognostic rules for community-acquired pneumonia in an elderly population. Eur Respir J 1999;14:370-5.
What are the most effective interventions to reduce childhood obesity?
EVIDENCE-BASED ANSWER
Efforts to increase physical activity or decrease sedentary activities have shown some short-term benefit, and adding dietary changes may be more effective. Aiming interventions at parents, intensive family therapy, comprehensive school-based programs, and selecting motivated children for subspecialty care may improve success. (Grade of recommendation: B, based on poor-quality randomized controlled trials [RCTs] and heterogeneous systematic reviews.) Other potentially effective short-term strategies include screening with body mass index (BMI) for age (grade of recommendation: C, extrapolation from cohort studies and ecological research) or dietary counseling (grade of recommendation: D, conflicting poor-quality RCTs). No drugs are currently approved for pediatric obesity therapy in the United States.
Evidence summary
Pediatric obesity increases the risk of adverse outcomes in adulthood, independent of adult BMI.1 Trials aiming to reduce childhood obesity suffer from serious methodological constraints. No long-term (> 2 years) evidence is available. Many apparently efficacious interventions are beyond the scope of primary care physicians. A detailed summary is available online at http://www.FPIN.org.
Several studies have examined the value of isolated changes in either diet or activity level. Randomized controlled trials and retrospective cohort studies of dietary advice alone show short-term efficacy (weeks to months).1 Most involve intensive subspecialty care for extremely obese children who are 120% to 140% over their ideal body weight. Trials without careful selection of motivated children had dropout rates up to 87%. One Italian RCT showed a 12% reduction in the number of obese children in schools receiving multimedia dietary advice compared with a 5% to 6% increase in those schools receiving only written or no advice.2 Several RCTs reduced obesity by introducing or improving school-based physical activity.1 Two RCTs that discouraged sedentary activity through counseling or school-based programs also reduced obesity.3,4
Two larger trials integrated diet and exercise advice into school curricula. One study emphasized improving school menus, but no difference was observed because children compensated by overeating at home.5 The other emphasized reducing sedentary activities and found lower obesity rates in the intervention schools, but only for girls.6 A third trial provided family-based dietary and behavior counseling, but emphasized either increasing physical activity or decreasing sedentary activity.7 Both strategies resulted in reduced obesity compared with controls. A systematic review supported the combined approach of these trials, finding diet and exercise interventions superior to diet interventions alone.8
Some evidence supports focusing on the family rather than just the child. A systematic review found that family therapy prevented pediatric obesity.9 An RCT found that focusing on parents as the sole change agent was superior to targeting the child.10
Recommendations from others
Expert consensus promotes screening because of obesity’s increasing incidence and associated morbidity and mortality.11 The Maternal and Child Health Bureau recommends a primary goal of healthy eating and activity. They recommend treating when the body mass index is >95th percentile, and assessing the child and family’s willingness to change. Primary strategies are to begin early, involve the family, promote parenting skills, and increase activity and reduce high-calorie food intake. They also recommend ongoing support to maintain weight loss.9
Clinical Commentary by Tess Bobo, MD, at http://www.fpin.org.
1. Campbell K, Waters E, O’Meara S, et al. In: The Cochrane Library, Issue 4, 2001. Oxford, England: Update Software.
2. Simonetti D’Arca A, Tarsitani G, Cairella M, et al. Public Health 1986;100:166-73.
3. Robinson TN. JAMA 1999;282:1561-7.
4. Faith MS, Berman N, Heo M, et al. Pediatrics 2001;107:1043-8.
5. Donnelly JE, Jacobsen DJ, Whatley JE, et al. Obes Res 1996;4:229-43.
6. Gortmaker SL, Peterson K, Wiecha J, et al. Arch Pediatr Adolesc Med 1999;153:409-18.
7. Epstein LH, Paluch RA, Gordy CC, Dorn J. Arch Pediatr Adolesc Med 2000;154:220-6.
8. Epstein LH, Goldfield GS. Med Sci Sports Exerc 1999;31(suppl):S553-9.
9. Glenny AM, O’Meara S. CRD Report 1997;10:1-149.
10. Golan M, Weizman A, Apter A, Fainaru M. Am J Clin Nutr 1998;67:1130-5.
11. Barlow SE, Dietz WH. Pediatrics 1998;102:E29.-
EVIDENCE-BASED ANSWER
Efforts to increase physical activity or decrease sedentary activities have shown some short-term benefit, and adding dietary changes may be more effective. Aiming interventions at parents, intensive family therapy, comprehensive school-based programs, and selecting motivated children for subspecialty care may improve success. (Grade of recommendation: B, based on poor-quality randomized controlled trials [RCTs] and heterogeneous systematic reviews.) Other potentially effective short-term strategies include screening with body mass index (BMI) for age (grade of recommendation: C, extrapolation from cohort studies and ecological research) or dietary counseling (grade of recommendation: D, conflicting poor-quality RCTs). No drugs are currently approved for pediatric obesity therapy in the United States.
Evidence summary
Pediatric obesity increases the risk of adverse outcomes in adulthood, independent of adult BMI.1 Trials aiming to reduce childhood obesity suffer from serious methodological constraints. No long-term (> 2 years) evidence is available. Many apparently efficacious interventions are beyond the scope of primary care physicians. A detailed summary is available online at http://www.FPIN.org.
Several studies have examined the value of isolated changes in either diet or activity level. Randomized controlled trials and retrospective cohort studies of dietary advice alone show short-term efficacy (weeks to months).1 Most involve intensive subspecialty care for extremely obese children who are 120% to 140% over their ideal body weight. Trials without careful selection of motivated children had dropout rates up to 87%. One Italian RCT showed a 12% reduction in the number of obese children in schools receiving multimedia dietary advice compared with a 5% to 6% increase in those schools receiving only written or no advice.2 Several RCTs reduced obesity by introducing or improving school-based physical activity.1 Two RCTs that discouraged sedentary activity through counseling or school-based programs also reduced obesity.3,4
Two larger trials integrated diet and exercise advice into school curricula. One study emphasized improving school menus, but no difference was observed because children compensated by overeating at home.5 The other emphasized reducing sedentary activities and found lower obesity rates in the intervention schools, but only for girls.6 A third trial provided family-based dietary and behavior counseling, but emphasized either increasing physical activity or decreasing sedentary activity.7 Both strategies resulted in reduced obesity compared with controls. A systematic review supported the combined approach of these trials, finding diet and exercise interventions superior to diet interventions alone.8
Some evidence supports focusing on the family rather than just the child. A systematic review found that family therapy prevented pediatric obesity.9 An RCT found that focusing on parents as the sole change agent was superior to targeting the child.10
Recommendations from others
Expert consensus promotes screening because of obesity’s increasing incidence and associated morbidity and mortality.11 The Maternal and Child Health Bureau recommends a primary goal of healthy eating and activity. They recommend treating when the body mass index is >95th percentile, and assessing the child and family’s willingness to change. Primary strategies are to begin early, involve the family, promote parenting skills, and increase activity and reduce high-calorie food intake. They also recommend ongoing support to maintain weight loss.9
Clinical Commentary by Tess Bobo, MD, at http://www.fpin.org.
1. Campbell K, Waters E, O’Meara S, et al. In: The Cochrane Library, Issue 4, 2001. Oxford, England: Update Software.
2. Simonetti D’Arca A, Tarsitani G, Cairella M, et al. Public Health 1986;100:166-73.
3. Robinson TN. JAMA 1999;282:1561-7.
4. Faith MS, Berman N, Heo M, et al. Pediatrics 2001;107:1043-8.
5. Donnelly JE, Jacobsen DJ, Whatley JE, et al. Obes Res 1996;4:229-43.
6. Gortmaker SL, Peterson K, Wiecha J, et al. Arch Pediatr Adolesc Med 1999;153:409-18.
7. Epstein LH, Paluch RA, Gordy CC, Dorn J. Arch Pediatr Adolesc Med 2000;154:220-6.
8. Epstein LH, Goldfield GS. Med Sci Sports Exerc 1999;31(suppl):S553-9.
9. Glenny AM, O’Meara S. CRD Report 1997;10:1-149.
10. Golan M, Weizman A, Apter A, Fainaru M. Am J Clin Nutr 1998;67:1130-5.
11. Barlow SE, Dietz WH. Pediatrics 1998;102:E29.-
Evidence-based answers from the Family Physicians Inquiries Network
When should we stop mammography screening for breast cancer in elderly women?
There is insufficient evidence to recommend for or against routine screening mammography beyond the age of 69 years. The best candidates to stop screening are elderly women who have significant comorbidities, poor functional status, low bone mineral density (BMD), little interest in preventive care, or an unwillingness to accept the potential harm of screening. (Grade of Recommendation: C, based on retrospective cohort studies.)
Recommendations from others
Guidelines from other groups regarding mammographic screening of older women are not consistent Table. Neither the American Academy of Family Physicians and the American College of Radiology make specific recommendations.
Evidence-based answer
Screening mammography for women aged up to 70 years is widely recommended. However, its role in older women is unclear, even the though average life expectancy of elderly women is lengthy (eg, 9 years at age 80). Patients with 3 or more major comorbidities (ie, hypertension, diabetes, arthritis, myocardial infarction, stroke, respiratory disease, or other cancers) are 20 times more likely to die of a cause other than breast cancer within 3 years.5 Although half of all cancers are diagnosed in women older than 65 years, screening these women poses some risks. For every 1000 women older than 70 years who are screened, 81 mammograms will show an abnormal result, requiring 79 follow-up tests and 26 biopsies to detect 11 cancers.6 The picture is further complicated by the possibility that these cancers may be less aggressive. Cancers may grow more slowly with age,7 and 25% of all tumors in elderly women are ductal carcinoma in situ, which are unlikely to cause morbidity or death within their life spans.8
Unfortunately, the randomized trials of screening mammography have enrolled few women aged 70 to 74 years and none older than 74. Two studies retrospectively compared cohorts of elderly women who did and did not have screening. Smith-Bindman and colleagues9 studied 690,000 Medicare beneficiaries in California and found a 43% reduction in the risk of metastatic breast cancer in the screened group. A 13-year Dutch study found a 20% breast cancer mortality reduction that first appeared 7 years after initiating screening. The cohorts were not randomly assigned in either study, leading to possible differences in baseline risk.
In a cost-effectiveness analysis, Kerlikowske and coworkers10 included BMD in the model, which is positively associated with breast cancer risk. They found a small benefit to screening for women with the highest quartile BMD (highest cancer risk) and virtually no benefit in screening the lowest quartile BMD. Mandeblatt and colleagues 11 incorporated comorbidities in another model and found a small benefit for women older than 69 years that gradually diminished as they approached the age of 85. This benefit was halved in the presence of a major comorbidity. Both of these models assumed that the efficacy of screening in younger women applies to older women.
Since there are no randomized trials in this age group, the true efficacy of screening is unknown. Therefore, other factors must be considered, including the patient’s age, comorbidities, and preferences. The evidence suggests that the best candidates to stop screening mammography are elderly women who have significant comorbidities, poor functional status, low BMD, little interest in preventive care, or an unwillingness to accept the potential harm of screening.
Henry Domke, MD
Family Care Associates Jefferson City, Missouri
The evidence reviewed and the recommendations presented fit my clinical experience. I focus particularly on the issue of patient preference, because many of my elderly patients would be insulted if I recommended not getting a screening mammogram. After a woman reaches 75 years of age I address mammography screening only if the patient initiates the topic.
1. National Guideline Clearinghouse Web site. Available at www.guideline.gov. Accessed December 6, 2000.
2. American College of Preventive Medicine (ACPM). Screening mammography for breast cancer: American College of Preventive Medicine practice policy statement. Am J Prev Med 1996;12:340-41.
3. American Geriatrics Society Clinical Practice Committee. Breast cancer screening in older women. JAGS 2000;48:842-44.
4. US Preventive Services Task Force (USPSTF). Screening for breast cancer. In: Guide to clinical preventive services. 2nd ed. Baltimore, Md: Williams & Wilkins; 1996;89-103
5. Satariano WA, Ragland DR. The effect of comorbidity on 3 year survival of women with primary breast cancer. Ann Intern Med 1994;120:104-10.
6. Welch HG. Diagnostic testing following screening mammography in the elderly. JNCI 1998;90:1389-92.
7. Peer PG, van Dijck JA, Hendriks JH, Holland R, Verbeek AL. Age-dependent growth rate of primary breast cancer. Cancer 1993;71:3547-51.
8. Kerlikowske KM, Grady D, Barclay J, Sickles EA, Eaton A, Ernster V. Positive predictive value of screening mammography by age and family history of breast cancer. JAMA 1993;270:2444-50.
9. Smith-Bindman R, Kerlikowski K, Gebretsadik T, Newman J. Is screening mammography effective in elderly women? AJM 2000;108:112-19.
10. Kerlikowske K, Salzmann P, Phillips KA, Cauley JA, Cummings SR. Continuing screening mammography in women aged 70 to 79 years: impact on life expectancy and cost-effectiveness. JAMA 1999;282:2156-63.
11. Mandelblatt JS, Wheat ME, Monane M, Moshief RD, Hollenberg JP, Tang J. Breast cancer screening for elderly women with and without comorbid conditions. Ann Intern Med 1992;116:722-30.
There is insufficient evidence to recommend for or against routine screening mammography beyond the age of 69 years. The best candidates to stop screening are elderly women who have significant comorbidities, poor functional status, low bone mineral density (BMD), little interest in preventive care, or an unwillingness to accept the potential harm of screening. (Grade of Recommendation: C, based on retrospective cohort studies.)
Recommendations from others
Guidelines from other groups regarding mammographic screening of older women are not consistent Table. Neither the American Academy of Family Physicians and the American College of Radiology make specific recommendations.
Evidence-based answer
Screening mammography for women aged up to 70 years is widely recommended. However, its role in older women is unclear, even the though average life expectancy of elderly women is lengthy (eg, 9 years at age 80). Patients with 3 or more major comorbidities (ie, hypertension, diabetes, arthritis, myocardial infarction, stroke, respiratory disease, or other cancers) are 20 times more likely to die of a cause other than breast cancer within 3 years.5 Although half of all cancers are diagnosed in women older than 65 years, screening these women poses some risks. For every 1000 women older than 70 years who are screened, 81 mammograms will show an abnormal result, requiring 79 follow-up tests and 26 biopsies to detect 11 cancers.6 The picture is further complicated by the possibility that these cancers may be less aggressive. Cancers may grow more slowly with age,7 and 25% of all tumors in elderly women are ductal carcinoma in situ, which are unlikely to cause morbidity or death within their life spans.8
Unfortunately, the randomized trials of screening mammography have enrolled few women aged 70 to 74 years and none older than 74. Two studies retrospectively compared cohorts of elderly women who did and did not have screening. Smith-Bindman and colleagues9 studied 690,000 Medicare beneficiaries in California and found a 43% reduction in the risk of metastatic breast cancer in the screened group. A 13-year Dutch study found a 20% breast cancer mortality reduction that first appeared 7 years after initiating screening. The cohorts were not randomly assigned in either study, leading to possible differences in baseline risk.
In a cost-effectiveness analysis, Kerlikowske and coworkers10 included BMD in the model, which is positively associated with breast cancer risk. They found a small benefit to screening for women with the highest quartile BMD (highest cancer risk) and virtually no benefit in screening the lowest quartile BMD. Mandeblatt and colleagues 11 incorporated comorbidities in another model and found a small benefit for women older than 69 years that gradually diminished as they approached the age of 85. This benefit was halved in the presence of a major comorbidity. Both of these models assumed that the efficacy of screening in younger women applies to older women.
Since there are no randomized trials in this age group, the true efficacy of screening is unknown. Therefore, other factors must be considered, including the patient’s age, comorbidities, and preferences. The evidence suggests that the best candidates to stop screening mammography are elderly women who have significant comorbidities, poor functional status, low BMD, little interest in preventive care, or an unwillingness to accept the potential harm of screening.
Henry Domke, MD
Family Care Associates Jefferson City, Missouri
The evidence reviewed and the recommendations presented fit my clinical experience. I focus particularly on the issue of patient preference, because many of my elderly patients would be insulted if I recommended not getting a screening mammogram. After a woman reaches 75 years of age I address mammography screening only if the patient initiates the topic.
1. National Guideline Clearinghouse Web site. Available at www.guideline.gov. Accessed December 6, 2000.
2. American College of Preventive Medicine (ACPM). Screening mammography for breast cancer: American College of Preventive Medicine practice policy statement. Am J Prev Med 1996;12:340-41.
3. American Geriatrics Society Clinical Practice Committee. Breast cancer screening in older women. JAGS 2000;48:842-44.
4. US Preventive Services Task Force (USPSTF). Screening for breast cancer. In: Guide to clinical preventive services. 2nd ed. Baltimore, Md: Williams & Wilkins; 1996;89-103
5. Satariano WA, Ragland DR. The effect of comorbidity on 3 year survival of women with primary breast cancer. Ann Intern Med 1994;120:104-10.
6. Welch HG. Diagnostic testing following screening mammography in the elderly. JNCI 1998;90:1389-92.
7. Peer PG, van Dijck JA, Hendriks JH, Holland R, Verbeek AL. Age-dependent growth rate of primary breast cancer. Cancer 1993;71:3547-51.
8. Kerlikowske KM, Grady D, Barclay J, Sickles EA, Eaton A, Ernster V. Positive predictive value of screening mammography by age and family history of breast cancer. JAMA 1993;270:2444-50.
9. Smith-Bindman R, Kerlikowski K, Gebretsadik T, Newman J. Is screening mammography effective in elderly women? AJM 2000;108:112-19.
10. Kerlikowske K, Salzmann P, Phillips KA, Cauley JA, Cummings SR. Continuing screening mammography in women aged 70 to 79 years: impact on life expectancy and cost-effectiveness. JAMA 1999;282:2156-63.
11. Mandelblatt JS, Wheat ME, Monane M, Moshief RD, Hollenberg JP, Tang J. Breast cancer screening for elderly women with and without comorbid conditions. Ann Intern Med 1992;116:722-30.
Evidence-based answers from the Family Physicians Inquiries Network
Is surgery effective for reducing symptoms in adults with obstructive sleep apnea?
Current evidence is insufficient to recommend surgery for symptom relief for patients with obstructive sleep apnea. More convincing evidence exists supporting the use of Continuous Positive Airway Pressure (CPAP) or dental appliances for reducing symptoms of sleep apnea.
Grade of recommendation: C, based on case series and poor quality cohort and case-control studies
Recommendations from others
The Cochrane Database of Systematic Reviews reports, “In light of the current lack of good trial-based evidence, clinicians should consider restricting surgery for obstructive sleep apnoea to that carried out as part of clinical trials. Where practice is continued, patients should be informed of the experimental nature of the operations. Patients should be told that there is a lack of good trial-based evidence of the efficacy of surgery for obstructive sleep apnoea, a course of action that may restrict the use of these operations.”1
The American Sleep Disorders Association states, “The presence and severity of obstructive sleep apnea must be determined before initiating surgical therapy… because of the complexity of airway narrowing or collapse during sleep, any one surgical procedure may not eradicate a patient’s sleep apnea. A stepwise approach to surgical management is acceptable if the patient is advised at the onset of treatment about the likelihood of the success of each procedure and that multiple operations may be necessary. After the surgical site has healed, a follow-up evaluation, including an objective measure of respiration and quality of sleep, must be performed to ensure that the abnormalities noted in the original study are corrected.”2
Search strategy
The Cochrane Database of Systematic Reviews, the National Guideline Clearinghouse Database, the Turning Research Into Practice (TRIP) database, British National Health Service Health Technology Assessment Database (HTA), and DARE (Database of Abstracts and Reviews of Effectiveness) were searched, using the keywords “sleep” and “sleep apnea.”
MEDLINE search strategy: {(Sleep Apnea, Obstructive/su [Surgery], OR sleep apnea syndromes/su) AND (clinical trial.pt. OR exp treatment outcome/OR meta-analysis.pt)}
Evidence summary
Obstructive sleep apnea is a common and potentially serious condition. Good evidence now exists supporting the efficacy of CPAP in improving patient-oriented outcomes (eg, daytime sleepiness) and disease-oriented outcomes (eg, nocturnal hypoxia).3,4,5 However, CPAP is not tolerated by 20% to 30% of patients, not universally effective, and ineffective if not used regularly.5 Surgery has held promise as a potentially curative therapy, a promise not yet demonstrated in well-designed randomized controlled trials.
The Cochrane Airways Group performed an extensive review of this topic in October 1999 and found that none of the 594 potentially relevant articles reviewed were methodologically adequate.1 Our search found 2 randomized controlled trials: 1 apparently missed by the Cochrane review and 1 subsequent to it.
Lojander et al6 compared uvulopharyngopalatoplasty (UPPP) to conservative management (weight loss, smoking cessation, and alcohol avoidance advice) in 32 patients. Patients were excluded if they had asthma, obesity (body mass index >40), restless leg syndrome, hypothyroidism, chronic obstructive pulmonary disease, or intolerance of missed work because of somnolence. Remaining patients were selected as possible surgical candidates by a team of hospital-based experts then randomized to surgery or conservative therapy. At 1 year of follow-up, they found no change in nocturnal oxygen desaturation but some improvement in the mean score of a visual analog scale of daytime sleepiness and in the mean self-report of out-of-bed sleeping episodes. Unfortunately these subjective outcome measures have not been validated and are subject to bias. This, in addition to lack of intention-to-treat analysis, renders these results uninterpretable.
The other trial compared UPPP with dental appliances in late 1999 and found dental appliances superior to surgery for improving apnea scores.7
Current recommendations in favor of surgical therapy are based solely on case series, poorly designed trials, expert opinion or pathophysiologic reasoning.1 Although such literature is voluminous, the most optimistic review estimates that less than 50% of patients with obstructive sleep apnea will benefit from surgery.8 The nonrandomized design of such trials may overestimate treatment effects by more than 40%.9
Given how little is known about its effectiveness, compounded by potential iatrogenesis, surgery should be considered the last resort for patients with obstructive sleep apnea. Doctors should discuss CPAP (the most effective therapy) and condition-specific dental appliances (the best tolerated therapy) with their patients until more is known about the efficacy of surgery. All patients should be counseled regarding healthy lifestyle modification.
Alan R. Gill, MD
Tacoma Family Medicine Family Practice Residency Program
Sleep apnea is a difficult problem for the primary care physician. Uncertainty extends well beyond the efficacy of surgery. The literature associating sleep apnea and its proposed clinical consequences (such as pulmonary hypertension) is weak, and evidence that any current treatment alters long-term outcomes is even weaker. Clinicians can offer relief from daytime somnolence by recommending nightly CPAP, but they can promise little else. Our patients should understand the limits of our knowledge as we help them make lifestyle changes and choose appropriate therapy. Surgery remains an experimental approach for markedly symptomatic patients who do not respond to noninvasive therapies.
1. Bridgeman SA. Dunn KM and the Cochrane Airways Group. Surgery for obstructive sleep apnea. The Cochrane Database of Systematic Reviews, The Cochrane Library. Issue 3 1999.
2. Standards of Practice Committee of the American Sleep Disorders Association. Practice parameters for the treatment of obstructive sleep apnea in adults: The efficacy of surgical modifications of the upper airway. Sleep 1996;19:1996.-
3. Jenkinson C, Davies RJ, Mullins R, Strandling JR. Comparison of therapeutic and non-therapeutic nasal continuous positive airway pressure for obstructive sleep apnea: a randomised prospective parallel trial. Lancet. 1999;353:2100-5.
4. Engleman HM, Kingshott RN, Wraith PK, et al. Randomized placebo-controlled crossover trial of continuous positive airway pressure for mild sleep apnea/hypopnea syndrome. Am J Respir Crit Care Med. 1999;159:461-7.
5. Wright J. White J and the Cochrane Airways Group. Continuous positive airways pressure for obstructive sleep apnoea. The Cochrane Database of Systematic Reviews, The Cochrane Library Issue 3 2000.
6. Lojander J, Maasilta P, Partinen M, Brander PE, Salmi T, Lehtonen H. Nasal-CPAP, surgery, and conservative management for treatment of obstructive sleep apnea syndrome. Chest 1996;110:114-119.
7. Wilhelmsson B, Tegelberg A, Walker-Engstrom ML, et al. A prospective randomized trial of dental appliance compared with uvulopalatopharyngoplasty in the treatment of obstructive sleep apnea. Acta Oto-laryngologica 1999;119:503-9.
8. Sher AE, Schechtman KB, Piccirillo JF. The efficacy of surgical modifications of the upper airway in adults with obstructive sleep apnea syndrome. Sleep 1996;19:156-77.
9. Bias. Bandolier 2000;80:2.-http://www.jr2.ox.ac.uk/bandolier/band80/b80-2.html
Current evidence is insufficient to recommend surgery for symptom relief for patients with obstructive sleep apnea. More convincing evidence exists supporting the use of Continuous Positive Airway Pressure (CPAP) or dental appliances for reducing symptoms of sleep apnea.
Grade of recommendation: C, based on case series and poor quality cohort and case-control studies
Recommendations from others
The Cochrane Database of Systematic Reviews reports, “In light of the current lack of good trial-based evidence, clinicians should consider restricting surgery for obstructive sleep apnoea to that carried out as part of clinical trials. Where practice is continued, patients should be informed of the experimental nature of the operations. Patients should be told that there is a lack of good trial-based evidence of the efficacy of surgery for obstructive sleep apnoea, a course of action that may restrict the use of these operations.”1
The American Sleep Disorders Association states, “The presence and severity of obstructive sleep apnea must be determined before initiating surgical therapy… because of the complexity of airway narrowing or collapse during sleep, any one surgical procedure may not eradicate a patient’s sleep apnea. A stepwise approach to surgical management is acceptable if the patient is advised at the onset of treatment about the likelihood of the success of each procedure and that multiple operations may be necessary. After the surgical site has healed, a follow-up evaluation, including an objective measure of respiration and quality of sleep, must be performed to ensure that the abnormalities noted in the original study are corrected.”2
Search strategy
The Cochrane Database of Systematic Reviews, the National Guideline Clearinghouse Database, the Turning Research Into Practice (TRIP) database, British National Health Service Health Technology Assessment Database (HTA), and DARE (Database of Abstracts and Reviews of Effectiveness) were searched, using the keywords “sleep” and “sleep apnea.”
MEDLINE search strategy: {(Sleep Apnea, Obstructive/su [Surgery], OR sleep apnea syndromes/su) AND (clinical trial.pt. OR exp treatment outcome/OR meta-analysis.pt)}
Evidence summary
Obstructive sleep apnea is a common and potentially serious condition. Good evidence now exists supporting the efficacy of CPAP in improving patient-oriented outcomes (eg, daytime sleepiness) and disease-oriented outcomes (eg, nocturnal hypoxia).3,4,5 However, CPAP is not tolerated by 20% to 30% of patients, not universally effective, and ineffective if not used regularly.5 Surgery has held promise as a potentially curative therapy, a promise not yet demonstrated in well-designed randomized controlled trials.
The Cochrane Airways Group performed an extensive review of this topic in October 1999 and found that none of the 594 potentially relevant articles reviewed were methodologically adequate.1 Our search found 2 randomized controlled trials: 1 apparently missed by the Cochrane review and 1 subsequent to it.
Lojander et al6 compared uvulopharyngopalatoplasty (UPPP) to conservative management (weight loss, smoking cessation, and alcohol avoidance advice) in 32 patients. Patients were excluded if they had asthma, obesity (body mass index >40), restless leg syndrome, hypothyroidism, chronic obstructive pulmonary disease, or intolerance of missed work because of somnolence. Remaining patients were selected as possible surgical candidates by a team of hospital-based experts then randomized to surgery or conservative therapy. At 1 year of follow-up, they found no change in nocturnal oxygen desaturation but some improvement in the mean score of a visual analog scale of daytime sleepiness and in the mean self-report of out-of-bed sleeping episodes. Unfortunately these subjective outcome measures have not been validated and are subject to bias. This, in addition to lack of intention-to-treat analysis, renders these results uninterpretable.
The other trial compared UPPP with dental appliances in late 1999 and found dental appliances superior to surgery for improving apnea scores.7
Current recommendations in favor of surgical therapy are based solely on case series, poorly designed trials, expert opinion or pathophysiologic reasoning.1 Although such literature is voluminous, the most optimistic review estimates that less than 50% of patients with obstructive sleep apnea will benefit from surgery.8 The nonrandomized design of such trials may overestimate treatment effects by more than 40%.9
Given how little is known about its effectiveness, compounded by potential iatrogenesis, surgery should be considered the last resort for patients with obstructive sleep apnea. Doctors should discuss CPAP (the most effective therapy) and condition-specific dental appliances (the best tolerated therapy) with their patients until more is known about the efficacy of surgery. All patients should be counseled regarding healthy lifestyle modification.
Alan R. Gill, MD
Tacoma Family Medicine Family Practice Residency Program
Sleep apnea is a difficult problem for the primary care physician. Uncertainty extends well beyond the efficacy of surgery. The literature associating sleep apnea and its proposed clinical consequences (such as pulmonary hypertension) is weak, and evidence that any current treatment alters long-term outcomes is even weaker. Clinicians can offer relief from daytime somnolence by recommending nightly CPAP, but they can promise little else. Our patients should understand the limits of our knowledge as we help them make lifestyle changes and choose appropriate therapy. Surgery remains an experimental approach for markedly symptomatic patients who do not respond to noninvasive therapies.
1. Bridgeman SA. Dunn KM and the Cochrane Airways Group. Surgery for obstructive sleep apnea. The Cochrane Database of Systematic Reviews, The Cochrane Library. Issue 3 1999.
2. Standards of Practice Committee of the American Sleep Disorders Association. Practice parameters for the treatment of obstructive sleep apnea in adults: The efficacy of surgical modifications of the upper airway. Sleep 1996;19:1996.-
3. Jenkinson C, Davies RJ, Mullins R, Strandling JR. Comparison of therapeutic and non-therapeutic nasal continuous positive airway pressure for obstructive sleep apnea: a randomised prospective parallel trial. Lancet. 1999;353:2100-5.
4. Engleman HM, Kingshott RN, Wraith PK, et al. Randomized placebo-controlled crossover trial of continuous positive airway pressure for mild sleep apnea/hypopnea syndrome. Am J Respir Crit Care Med. 1999;159:461-7.
5. Wright J. White J and the Cochrane Airways Group. Continuous positive airways pressure for obstructive sleep apnoea. The Cochrane Database of Systematic Reviews, The Cochrane Library Issue 3 2000.
6. Lojander J, Maasilta P, Partinen M, Brander PE, Salmi T, Lehtonen H. Nasal-CPAP, surgery, and conservative management for treatment of obstructive sleep apnea syndrome. Chest 1996;110:114-119.
7. Wilhelmsson B, Tegelberg A, Walker-Engstrom ML, et al. A prospective randomized trial of dental appliance compared with uvulopalatopharyngoplasty in the treatment of obstructive sleep apnea. Acta Oto-laryngologica 1999;119:503-9.
8. Sher AE, Schechtman KB, Piccirillo JF. The efficacy of surgical modifications of the upper airway in adults with obstructive sleep apnea syndrome. Sleep 1996;19:156-77.
9. Bias. Bandolier 2000;80:2.-http://www.jr2.ox.ac.uk/bandolier/band80/b80-2.html
Evidence-based answers from the Family Physicians Inquiries Network