User login
Patient Preferences in Office-Based Orthopedic Care: A Prospective Evaluation
ABSTRACT
Patient satisfaction has become a topic of interest within orthopedics as the landscape of provider reimbursement continues to evolve to reward value of care. Online internet physician rating sites are becoming increasingly popular ways for patients to subjectively express their provider experience. Understanding what patients value during their episode of care is important in the modern healthcare environment. The purpose of this study is to determine what preferences, if any, patients have when selecting their physician and how they experience care in an outpatient orthopedic setting. A prospective survey was electronically administered to 212 patients in an adult reconstruction clinic. One hundred ninety-six patients (92.5%) completed the survey. Demographic questions regarding age, sex, ethnicity, and prior adult reconstruction surgical history were obtained. When patients were asked how much time they would like the doctor to spend with them on a routine visit, the most common answer was 10 to 15 minutes (41.3%), with only 10.2% patients desiring >20 minutes. The majority of patients (83.1%) believe ≥30 minutes is too long to wait to see their surgeon. Less than half of patients (41.8%) stated that they would feel as though they were receiving below average care if seen only by a nurse practitioner or physician’s assistant at a postoperative visit. Patients reported no significant age, gender, or ethnicity preferences for their physician. Recommendations from friends or other physicians was the most common (66.4%) way for patients to find their physicians, while 12.2% utilized online rating sites during their search. Optimizing patient experiences in the office may include keeping wait times to <30 minutes and educating patients on the roles of physician extenders. More work needs to be done to further elucidate variables influencing the subjective patient experience with their orthopedic care.
Continue to: Patient satisfaction...
Patient satisfaction has become an important focus in the rapidly changing healthcare environment due to the significant impact it has on healthcare delivery, healthcare economics, assessment of the quality of care, development of patient-care models, and quality improvement initiatives.1-4 Historically, the quality of care was measured by objective metrics such as complication rates, range-of-motion, and the provider’s expert opinion on the outcome. While those metrics are still impactful variables when defining a successful outcome, the medical community is now increasingly recognizing the importance of patients’ perspectives when defining successful treatments. Patient satisfaction is now highly regarded by clinicians and the government when considering outcomes and is even being incorporated into determining the value of care. Under the Affordable Care Act, patients assumed a more active role in clinical decision-making as well as in creating quality and efficiency initiatives.5,6 By 2017, 2% of the United States government’s Medicare payments will be redistributed among hospitals and physicians based on their quality and efficiency metrics, which are largely determined by patients’ evaluations of care.7 As a result, there has been significant interest in identifying variables influencing patient satisfaction and subjective outcomes.8,9
Patient satisfaction is related to both the outcomes of care and the process of care. As first described by Donabedian,10patients may be satisfied with the successful outcome of their care, but dissatisfied with how they received their care. The process of care is complex and considers many aspects of healthcare delivery, including time, cost, healthcare provider interactions, and burdens faced. While patient satisfaction with outcomes and process of care are heavily related, they should be regarded separately. It is essential that providers understand what variables are important to patients with regards to how they experience healthcare and choose their provider, especially surrounding elective procedures such as hip and knee arthroplasty.11,12
Within orthopedic surgery, patient satisfaction scores are beginning to be incorporated as part of the standard-of-care quality metrics obtained along with patient-reported outcome measures (PROMs) at defined time points postoperatively. Furthermore, PROMs and patient satisfaction data are becoming an increasingly important component of medical decision-making.13-16 Several authors have reported that increased patient satisfaction is correlated with increased compliance, improved treatment outcomes across numerous medical settings, including orthopedics, decreased risk of litigation, and higher patient ratings of the quality of care.17,18 Various factors, including meeting of expectations, staff politeness, the communication skills of the surgeon, and waiting times, have been suggested to influence eventual patient satisfaction within the surgical literature.19-21 However, within orthopedic surgery there is a paucity of investigations evaluating how patients determine preferences and satisfaction with the process of care.
The purpose of this study is to determine what preferences, if any, patients have when selecting their physician and how they experience care in an outpatient orthopedic setting. The authors hypothesize that the majority of patients find their physicians through online rating sites or recommendations from family and friends. The authors believe that patients expect to be seen in <30 minutes and will be unsatisfied overall with the amount of time that they spend with their physician.
Continue to: METHODS...
METHODS
The senior author (BRL) and a research team created a 15-question survey to evaluate patient preferences regarding the demographic characteristics (eg, age, gender, ethnicity) of their physician, wait times in a waiting room, time spent with the physician, care received from physician extenders (eg, nurse practitioners, physician assistants), and how they learned of their physician (Appendix). An a priori power analysis was conducted to determine that approximately 200 patients were needed for inclusion.11,22 Following Institutional Review Board approval (ORA 15051104), the survey was administered to 212 patients in a single-surgeon, adult reconstruction clinic. The survey was digitally administered on a touch-screen tablet using an electronic independent third party survey center (SurveyMonkey Inc) devoid of any identifying data. The survey was offered to all patients >21 years of age who were English-speaking and in the common area as patients waiting to be seen, from June 2015 to March 2016. A research assistant approached patients in the waiting room and asked if they would like to participate in a short survey regarding what factors influence the patient-physician relationship from the patient’s perspective.
Appendix 1
- Do you wish to partake in this 3-minute survey?
- Have you had a prior knee or hip replacement?
- What is your age?
- 30-40 years
- 40-50 years
- 50-60 years
- 60-70 years
- 70-80 years
- 80+ years
- What is your gender?
- Which of the following best represents your racial or ethnic heritage?
- African American
- How much time would you like the doctor to spend talking to you on a routine visit?
- 0-5 minutes
- 5-10 minutes
- 10-15 minutes
- 15-20 minutes
- 20-30 minutes
- >30 minutes
- How long is too long to wait to see the doctor?
- 10 minutes
- 20 minutes
- 30 minutes
- 40 minutes
- 50 minutes
- An hour or more
- If you were to only see a physician’s assistant or nurse practitioner at your follow-up visit and not the doctor, would you feel like you were getting below average care?
- Overall I am satisfied with the time the doctor spends with me.
- If you were to need a major surgery, would you want the physician to tell you what he or she would do if they were in your shoes?
- Would you prefer your doctor to be the same race/ethnicity as you?
- No
- No Preference
- Would you feel more comfortable with a male as opposed to a female orthopedic surgeon?
- Would you feel more comfortable with a female as opposed to a male orthopedic surgeon?
- What age would you like your physician to be?
- 25-35 years old
- 35-45 years old
- 45-55 years old
- 55-65 years old
- 65 years and older
- No preference
- How do you usually find your physician?
- Friends’ recommendations
- Healthcare provider’s recommendations
- Insurance plans
- Online research/ratings
- Other
Descriptive statistics were used to analyze subject demographics and survey responses. Chi-square analyses and multinomial logistic regressions were utilized to compare responses. All statistical analyses were conducted using SPSS version 24.0 software (SPSS Inc). Statistical significance was set at P < 0.05.
RESULTS
Of the 212 patients who were invited to participate, 196 patients (92.4%) agreed and completed the survey. Demographic and surgical history information can be found in Table 1. The majority of patients were female (62%) and above the age of 50 years (92.4%). Almost half (48.5%) of patients had a prior hip or knee replacement.
Table 1. Survey Respondent Demographics
| Number | Percent |
Age Range | ||
30-40 years | 4 | 2.0% |
40-50 years | 11 | 5.6% |
50-60 years | 47 | 24.0% |
60-70 years | 84 | 42.9% |
70-80 years | 41 | 20.9% |
>80 years | 9 | 4.6% |
Gender | ||
Male | 74 | 37.8% |
Female | 122 | 62.2% |
Ethnicity | ||
African American | 39 | 19.9% |
Asian | 3 | 1.5% |
Caucasian | 140 | 71.4% |
Hispanic | 10 | 5.1% |
Other | 4 | 2.0% |
Prior knee or hip replacement | ||
Yes | 95 | 48.5% |
No | 55 | 28.1% |
No Response | 46 | 23.5% |
When asked how long is too long to wait to see the doctor, 30 minutes (39.8%) was most commonly selected, followed by 40 minutes (24.5%) (Figure 1). When asked how much time patients would like the doctor to spend with them during an office visit, the majority (68.9%) selected either 10 to 15 minutes (41.3%) or 15 to 20 minutes (27.6%) (Figure 2). The majority of patients (92.3%) were satisfied with the amount of time the doctor spent with them. In addition, 94.9% of respondents would want their doctor to tell them what they would do if they were in the patient’s shoes when making decisions regarding their medical care (Table 2). Less than half of respondents (41.8%) believe that seeing a physician extender (eg, nurse practitioner or physician assistant) at a postoperative visit would result in a lower quality of care (Table 2).
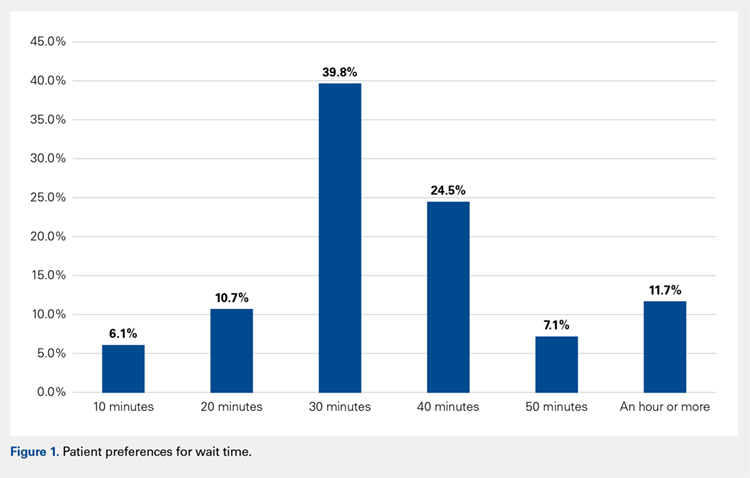
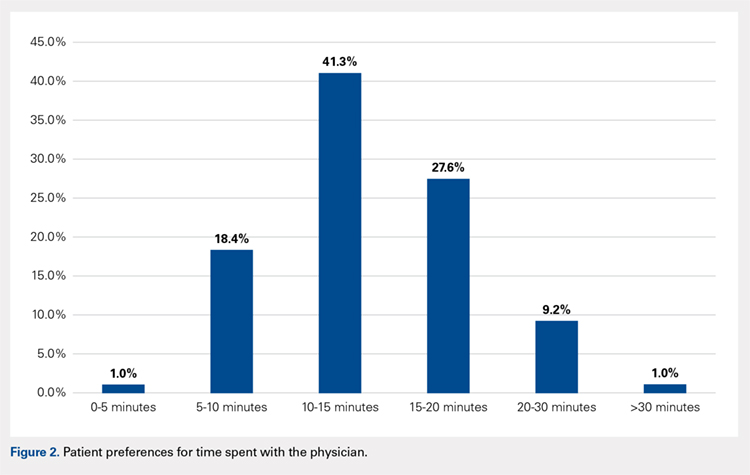
Table 2. Responses to Survey Questions
If you were to only see a physician's assistant or nurse practitioner at your follow-up visit and not the doctor, would you feel like you were getting below average care? | ||
Answer choices | Number | Percent |
No | 114 | 58.2% |
Yes | 82 | 41.8% |
If you were to need a major surgery would you want the physician to tell you what he or she would do if they were in your shoes? | ||
Answer choices | Number | Percent |
No | 10 | 5.1% |
Yes | 186 | 94.9% |
Would you prefer your doctor to be the same race/ethnicity as you? | ||
Answer choices | Number | Percent |
No | 29 | 14.8% |
Yes | 3 | 1.5% |
No Preference | 164 | 83.7% |
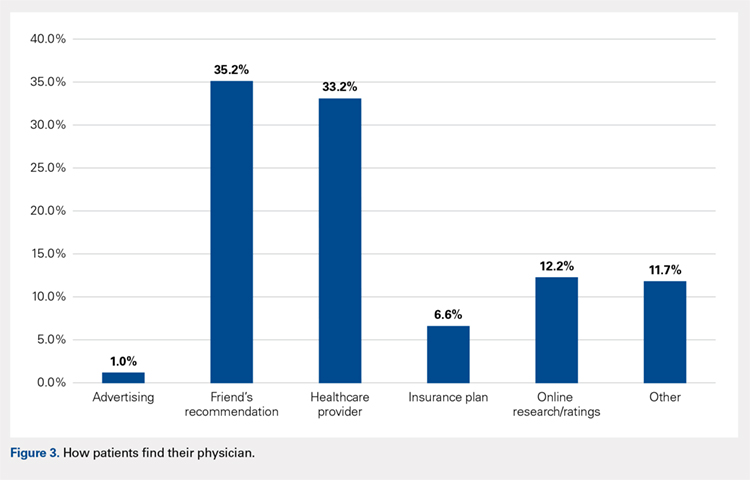
When asked if patients preferred a doctor of the same race/ethnicity, the vast majority (83.7%) had no preference (Table 2). There was no significant difference found between male and female respondents when asked if they would feel more comfortable with a male as opposed to a female orthopedic surgeon (P = .118) and vice versa (P = .604) (Table 3). Most patients preferred a physician between the ages of 45 and 55 years (39.3%), followed by 35 and 45 years (23.0%); however, this preference was not statistically significant (Table 4). Older patients were more likely to prefer younger physicians (odds ratio, 4.612 for 25-35 years of age; odds ratio, 1.328 for 35-45 years of age). Only 12.2% of patients reported online research/rating sites as the main resource utilized when selecting their physician (Figure 3). The majority (68.4%) reported that recommendations from either friends (35.2%) or healthcare providers (33.2%) were the main avenues through which they found their physicians.
Table 3. Overall Responses to Questions Regarding Male and Female Orthopedic Surgeonsa
Would you feel more comfortable with a male as opposed to a female orthopedic surgeon? | |||||
Answer choices | Number | Percent | Female responses | Male responses | P value |
No | 164 | 83.7% | 106 (86.9%) | 58 (78.4%) | 0.118 |
Yes | 32 | 16.3% | 16 (13.1%) | 16 (21.6%) |
|
Would you feel more comfortable with a female as opposed to a male orthopedic surgeon? | |||||
Answer choices | Number | Percent | Female responses | Male responses | P value |
No | 186 | 94.9% | 115 (94.3%) | 71 (95.9%) | 0.604 |
Yes | 10 | 5.1% | 7 (5.7%) | 3 (4.1%) |
|
aResponses were broken down by gender and compared utilizing a 2 x 2 chi-square analysis to test for significant differences in respondents’ gender preferences for their orthopedic surgeon.
Table 4. Patient Preferences Regarding Physician Age
What age would you like your physician to be? |
| 95% Confidence Interval | ||||
Answer Choices | Number or Responses | Percent | P value | Exp(β) | Lower Bound | Upper Bound |
25-35 years | 1 | 0.5% | 0.217 | 4.612 | 0.407 | 52.283 |
35-45 years | 45 | 23.0% | 0.161 | 1.328 | 0.893 | 1.975 |
45-55 years | 77 | 39.3% | 0.159 | 1.276 | 0.909 | 1.791 |
55-65 years | 9 | 4.6% | 0.483 | 1.302 | 0.624 | 2.717 |
≥65 years | 2 | 1.0% | 0.272 | 0.491 | 0.138 | 1.748 |
No preferencea | 62 | 31.6% | Reference | |||
aNo preference was used as the reference category for the answer choices, while the age bracket “>80 years” was used as the reference for the age of respondent variable.
Continue to: DISCUSSION...
DISCUSSION
The results of this study demonstrate that patients have several expectations and preferences with regards to the care they receive from physicians in the office. Patients prefer to wait <30 minutes before seeing their provider and desire only 10 to 20 minutes with their doctor. Patients do not have specific preferences with regards to the gender or ethnicity of their physician but would prefer a physician in the middle of their career, aged 45 to 55 years. Ultimately, patients do believe that seeing a physician at a postoperative visit is important, as just under half of patients thought that seeing a physician extender alone at a postoperative visit resulted in a lower quality of care.
While these results were obtained in a population specifically seeking the care of an orthopedic adult reconstruction surgeon, the results demonstrate that patients do not necessarily desire an unreasonable amount of time with their doctor. Patients simply want to be seen in a timely fashion and receive the full undivided attention of their doctor for approximately 20 minutes. Similarly, Patterson and colleagues22 found, in their series of 182 patients who presented to an orthopedic surgeon, that there was a significant correlation between time spent with the surgeon and overall patient satisfaction. Interestingly, the authors reported that patient satisfaction was not correlated with education level, sex, marital status, whether the patients were evaluated by a resident physician before seeing the attending surgeon, self-reported mental status, tobacco usage, the type of clinic visit, or the waiting time to see the surgeon (average, about 40 minutes for this cohort).22 Similarly, Teunis and colleagues23 reported an average 32-minute wait time in 81 patients presenting for care at an orthopedic hand clinic and demonstrated that a longer wait time was associated with decreased patient satisfaction. These results corroborate the findings of this study that a short wait time is important to patients when evaluating the process of care. Additionally, patients do not have unreasonable expectations with regards to the amount of time they would like to spend with the physician. A physician who has a clinic for 9 hours a day would thus be able to see 54 patients and still spend at least 10 minutes with each patient. The quality of the physician-patient interaction is likely more important than the actual amount of time spent; however, based on this study, patients do have certain expectations about how much time physicians should spend with them.
There were no significant sex, age, or ethnicity preferences in our specific patient cohort. However, a sizable percentage of respondents, 41.8%, believed that they were receiving inferior care if they only saw a physician extender at a routine follow-up visit. Many orthopedic surgeons rely on the care provided by physician extenders to enable them to see additional patients. Physician extenders are well trained to provide high-quality care, including at routine postoperative visits. The results of this study, that many patients believe physician extenders provide lower-quality care, may be a result of inadequate patient education regarding the extensive training and education physician extenders undergo. Physician extenders are qualified, licensed healthcare professionals who are playing increasingly important roles within orthopedics and medicine as a whole. As the demand for orthopedic surgeons to see more patients increases, so does the role of physician extenders. Future research is warranted into educating the public regarding the importance of these healthcare providers and the adequacy of their training.
While many practices now routinely obtain patient satisfaction scores, another modality through which patients can express their satisfaction and experiences with healthcare providers is through online internet physician rating sites (IPRS). These sites have exploded in number and popularity in recent years and, according to some studies, have a very real effect on provider selection.24 Interestingly, a low percentage of patients in this study utilized IPRS reviews to find their doctors. In a recent prospective survey study of 1000 consecutive patients presenting for care at the Mayo Clinic, Burkle and Keegan24 reported that 27% of patients would choose not to see a physician based on a negative IPRS review. Interestingly, only 1.0% of patients reported finding their doctor through advertising. Numerous authors have recently addressed advertising in orthopedic surgery, specifically direct-to-consumer marking, including the influence of physician self-promotion on patients.25,26 Specifically, Halawi and Barsoum26 discussed how direct-to-consumer marketing is commonly disseminated to the public through television and print advertisements, which are modalities more commonly utilized by older generations. However, many advertising agencies are moving toward internet-based advertising, especially through orthopedic group and individual surgeon websites for self-promoting advertisement, as approximately 75% of Americans use the internet for health-related information.25,27 The fact that many patients in this study did not utilize IPRS reviews or advertising (much of which is electronic) may be a result of the older, less internet-centric demographic that is often seen in an adult reconstruction clinic. Future research is warranted to determine what demographic of patients value IPRS reviews and how those reviews influence physician selection and the patient experience.
There are several limitations to this study. First, the majority of the surveyed population was Caucasian, and our results may not be equally reflective of diverse ethnic backgrounds. Second, the cohort size, while based on previous studies conducted in a similar fashion, may be underpowered to detect significant differences for 1 or more of these questions. In addition, having a question regarding the patient’s medical background or experiences may have provided further insight as to why patients selected the answers that they did. Furthermore, questions regarding the patient’s education level, religious background, and income brackets may have provided further context in which to evaluate their responses. These questions were omitted in an effort to keep the questionnaire at a length that would maximize enrollment and prevent survey fatigue. Future research is warranted to determine what patient-specific, injury/symptom-specific, and treatment-specific variables influence the subjective patient experience.
CONCLUSION
The vast majority of patients desire only 10 to 20 minutes with their doctor and are highly satisfied with the amount of time their surgeon spends with them. Patients reported no significant gender- or ethnicity-based preferences for their doctor. The majority of patients believe that a wait time exceeding 30 minutes is too long. A greater effort needs to be made to educate patients and the public about the significant and effective roles nurse practitioners and physician assistants can play within the healthcare system. While this cohort did not report notable utilization of IPRS reviews, it remains essential to understand what factors influence patients’ subjective experiences with their providers to ensure that patients achieve their desired outcomes, and report as such on these websites as they continue to gain popularity. Diminishing clinic wait times and understanding patient preferences may lead to a greater percentage of “satisfied” patients. While the majority of focus has been and will likely continue to be on improving patients’ satisfaction with their outcomes, more work needs to be done focusing specifically on the process through which outcomes are achieved.
1. Kocher MS, Steadman JR, Briggs K, Zurakowski D, Sterett WI, Hawkins RJ. Determinants of patient satisfaction with outcome after anterior cruciate ligament reconstruction. J Bone Joint Surg Am. 2002;84–A(9):1560-1572.
2. Carr-Hill RA. The measurement of patient satisfaction. J Public Health Med. 1992;14(3):236-249.
3. Ross CK, Steward CA, Sinacore JM. A comparative study of seven measures of patient satisfaction. Med Care. 1995;33(4):392-406. doi:10.1097/00005650-199504000-00006.
4. Strasser S, Aharony L, Greenberger D. The patient satisfaction process: moving toward a comprehensive model. Med Care Rev. 1993;50(2):219-248. doi:10.1177/107755879305000205.
5. Bozic KJ. Orthopaedic healthcare worldwide: shared medical decision making in orthopaedics. Clin Orthop Relat Res. 2013;471(5):1412-1414. doi:10.1007/s11999-013-2838-5.
6. Youm J, Chenok KE, Belkora J, Chiu V, Bozic KJ. The emerging case for shared decision making in orthopaedics. Instr Course Lect. 2013;62:587-594. doi:10.2106/00004623-201210170-00011.
7. Blumenthal D, Abrams M, Nuzum R. The affordable CARE Act at 5 years. N Engl J Med. 2015;373(16):1580. doi:10.1056/NEJMc1510015.
8. Shirley ED, Sanders JO. Patient satisfaction: implications and predictors of success. J Bone Joint Surg Am. 2013;95(10):e69. doi:10.2106/JBJS.L.01048.
9. Morris BJ, Jahangir AA, Sethi MK. Patient satisfaction: an emerging health policy issue. AAOS Now Web site. http://www.aaos.org/AAOSNow/2013/Jun/advocacy/advocacy5/?ssopc=1. Published June 2013. Accessed November 19, 2016.
10. Donabedian A. The quality of care. How can it be assessed? JAMA. 1988;260(12):1743-1748. doi:10.1001/jama.260.12.1743.
11. Bozic KJ, Kaufman D, Chan VC, Caminiti S, Lewis C. Factors that influence provider selection for elective total joint arthroplasty. Clin Orthop Relat Res. 2013;471(6):1865-1872. doi:10.1007/s11999-012-2640-9.
12. Davies AR, Ware JE Jr. Involving consumers in quality of care assessment. Health Aff (Millwood). 1988;7(1):33-48.
13. Black N, Burke L, Forrest CB, et al. Patient-reported outcomes: pathways to better health, better services, and better societies. Qual Life Res. 2016;25(5):1103-1112. doi:10.1007/s11136-015-1168-3.
14. Gilbert A, Sebag-Montefiore D, Davidson S, Velikova G. Use of patient-reported outcomes to measure symptoms and health related quality of life in the clinic. Gynecol Oncol. 2015;136(3):429-439. doi:10.1016/j.ygyno.2014.11.071.
15. Van Der Wees PJ, Nijhuis-Van Der Sanden MW, Ayanian JZ, Black N, Westert GP, Schneider EC. Integrating the use of patient-reported outcomes for both clinical practice and performance measurement: views of experts from 3 countries. Milbank Q. 2014;92(4):754-775. doi:10.1111/1468-0009.12091.
16. Franklin PD, Lewallen D, Bozic K, Hallstrom B, Jiranek W, Ayers DC. Implementation of patient-reported outcome measures in U.S. Total joint replacement registries: rationale, status, and plans. J Bone Joint Surg Am. 2014;96(Suppl 1):104-109. doi:10.2106/JBJS.N.00328.
17. Williams B. Patient satisfaction: a valid concept? Soc Sci Med. 1994;38(4):509-516. doi:10.1016/0277-9536(94)90247-X.
18. Hickson GB, Clayton EW, Entman SS, et al. Obstetricians' prior malpractice experience and patients' satisfaction with care. JAMA. 1994;272(20):1583-1587. doi:10.1001/jama.1994.03520200039032.
19. Larsson BW, Larsson G, Chantereau MW, von Holstein KS. International comparisons of patients' views on quality of care. Int J Health Care Qual Assur Inc Leadersh Health Serv. 2005;18(1):62-73. doi:10.1108/09526860510576974.
20. McLafferty RB, Williams RG, Lambert AD, Dunnington GL. Surgeon communication behaviors that lead patients to not recommend the surgeon to family members or friends: analysis and impact. Surgery. 2006;140(4):616-624. doi:https://doi.org/10.1016/j.surg.2006.06.021.
21. Mira JJ, Tomás O, Virtudes-Pérez M, Nebot C, Rodríguez-Marín J. Predictors of patient satisfaction in surgery. Surgery. 2009;145(5):536-541. doi:10.1016/j.surg.2009.01.012.
22. Patterson BM, Eskildsen SM, Clement RC, et al. Patient satisfaction is associated with time with provider but not clinic wait time among orthopedic patients. Orthopedics. 2017;40(1):43-48. doi:10.3928/01477447-20161013-05.
23. Teunis T, Thornton ER, Jayakumar P, Ring D. Time seeing a hand surgeon is not associated With patient satisfaction. Clin Orthop Relat Res. 2015;473(7):2362-2368. doi:10.1007/s11999-014-4090-z.
24. Burkle CM, Keegan MT. Popularity of internet physician rating sites and their apparent influence on patients' choices of physicians. BMC Health Serv Res. 2015;15:416. doi:10.1186/s12913-015-1099-2.
25. Mohney S, Lee DJ, Elfar JC. The effect of orthopedic advertising and self-promotion on a naive population. Am J Orthop. 2016;45(4):E227-E232.
26. Halawi MJ, Barsoum WK. Direct-to-consumer marketing: implications for patient care and orthopedic education. Am J Orthop. 2016;45(6):E335-E336.
27. Mostaghimi A, Crotty BH, Landon BE. The availability and nature of physician information on the internet. J Gen Intern Med. 2010;25(11):1152-1156. doi:10.1007/s11606-010-1425-7.
ABSTRACT
Patient satisfaction has become a topic of interest within orthopedics as the landscape of provider reimbursement continues to evolve to reward value of care. Online internet physician rating sites are becoming increasingly popular ways for patients to subjectively express their provider experience. Understanding what patients value during their episode of care is important in the modern healthcare environment. The purpose of this study is to determine what preferences, if any, patients have when selecting their physician and how they experience care in an outpatient orthopedic setting. A prospective survey was electronically administered to 212 patients in an adult reconstruction clinic. One hundred ninety-six patients (92.5%) completed the survey. Demographic questions regarding age, sex, ethnicity, and prior adult reconstruction surgical history were obtained. When patients were asked how much time they would like the doctor to spend with them on a routine visit, the most common answer was 10 to 15 minutes (41.3%), with only 10.2% patients desiring >20 minutes. The majority of patients (83.1%) believe ≥30 minutes is too long to wait to see their surgeon. Less than half of patients (41.8%) stated that they would feel as though they were receiving below average care if seen only by a nurse practitioner or physician’s assistant at a postoperative visit. Patients reported no significant age, gender, or ethnicity preferences for their physician. Recommendations from friends or other physicians was the most common (66.4%) way for patients to find their physicians, while 12.2% utilized online rating sites during their search. Optimizing patient experiences in the office may include keeping wait times to <30 minutes and educating patients on the roles of physician extenders. More work needs to be done to further elucidate variables influencing the subjective patient experience with their orthopedic care.
Continue to: Patient satisfaction...
Patient satisfaction has become an important focus in the rapidly changing healthcare environment due to the significant impact it has on healthcare delivery, healthcare economics, assessment of the quality of care, development of patient-care models, and quality improvement initiatives.1-4 Historically, the quality of care was measured by objective metrics such as complication rates, range-of-motion, and the provider’s expert opinion on the outcome. While those metrics are still impactful variables when defining a successful outcome, the medical community is now increasingly recognizing the importance of patients’ perspectives when defining successful treatments. Patient satisfaction is now highly regarded by clinicians and the government when considering outcomes and is even being incorporated into determining the value of care. Under the Affordable Care Act, patients assumed a more active role in clinical decision-making as well as in creating quality and efficiency initiatives.5,6 By 2017, 2% of the United States government’s Medicare payments will be redistributed among hospitals and physicians based on their quality and efficiency metrics, which are largely determined by patients’ evaluations of care.7 As a result, there has been significant interest in identifying variables influencing patient satisfaction and subjective outcomes.8,9
Patient satisfaction is related to both the outcomes of care and the process of care. As first described by Donabedian,10patients may be satisfied with the successful outcome of their care, but dissatisfied with how they received their care. The process of care is complex and considers many aspects of healthcare delivery, including time, cost, healthcare provider interactions, and burdens faced. While patient satisfaction with outcomes and process of care are heavily related, they should be regarded separately. It is essential that providers understand what variables are important to patients with regards to how they experience healthcare and choose their provider, especially surrounding elective procedures such as hip and knee arthroplasty.11,12
Within orthopedic surgery, patient satisfaction scores are beginning to be incorporated as part of the standard-of-care quality metrics obtained along with patient-reported outcome measures (PROMs) at defined time points postoperatively. Furthermore, PROMs and patient satisfaction data are becoming an increasingly important component of medical decision-making.13-16 Several authors have reported that increased patient satisfaction is correlated with increased compliance, improved treatment outcomes across numerous medical settings, including orthopedics, decreased risk of litigation, and higher patient ratings of the quality of care.17,18 Various factors, including meeting of expectations, staff politeness, the communication skills of the surgeon, and waiting times, have been suggested to influence eventual patient satisfaction within the surgical literature.19-21 However, within orthopedic surgery there is a paucity of investigations evaluating how patients determine preferences and satisfaction with the process of care.
The purpose of this study is to determine what preferences, if any, patients have when selecting their physician and how they experience care in an outpatient orthopedic setting. The authors hypothesize that the majority of patients find their physicians through online rating sites or recommendations from family and friends. The authors believe that patients expect to be seen in <30 minutes and will be unsatisfied overall with the amount of time that they spend with their physician.
Continue to: METHODS...
METHODS
The senior author (BRL) and a research team created a 15-question survey to evaluate patient preferences regarding the demographic characteristics (eg, age, gender, ethnicity) of their physician, wait times in a waiting room, time spent with the physician, care received from physician extenders (eg, nurse practitioners, physician assistants), and how they learned of their physician (Appendix). An a priori power analysis was conducted to determine that approximately 200 patients were needed for inclusion.11,22 Following Institutional Review Board approval (ORA 15051104), the survey was administered to 212 patients in a single-surgeon, adult reconstruction clinic. The survey was digitally administered on a touch-screen tablet using an electronic independent third party survey center (SurveyMonkey Inc) devoid of any identifying data. The survey was offered to all patients >21 years of age who were English-speaking and in the common area as patients waiting to be seen, from June 2015 to March 2016. A research assistant approached patients in the waiting room and asked if they would like to participate in a short survey regarding what factors influence the patient-physician relationship from the patient’s perspective.
Appendix 1
- Do you wish to partake in this 3-minute survey?
- Have you had a prior knee or hip replacement?
- What is your age?
- 30-40 years
- 40-50 years
- 50-60 years
- 60-70 years
- 70-80 years
- 80+ years
- What is your gender?
- Which of the following best represents your racial or ethnic heritage?
- African American
- How much time would you like the doctor to spend talking to you on a routine visit?
- 0-5 minutes
- 5-10 minutes
- 10-15 minutes
- 15-20 minutes
- 20-30 minutes
- >30 minutes
- How long is too long to wait to see the doctor?
- 10 minutes
- 20 minutes
- 30 minutes
- 40 minutes
- 50 minutes
- An hour or more
- If you were to only see a physician’s assistant or nurse practitioner at your follow-up visit and not the doctor, would you feel like you were getting below average care?
- Overall I am satisfied with the time the doctor spends with me.
- If you were to need a major surgery, would you want the physician to tell you what he or she would do if they were in your shoes?
- Would you prefer your doctor to be the same race/ethnicity as you?
- No
- No Preference
- Would you feel more comfortable with a male as opposed to a female orthopedic surgeon?
- Would you feel more comfortable with a female as opposed to a male orthopedic surgeon?
- What age would you like your physician to be?
- 25-35 years old
- 35-45 years old
- 45-55 years old
- 55-65 years old
- 65 years and older
- No preference
- How do you usually find your physician?
- Friends’ recommendations
- Healthcare provider’s recommendations
- Insurance plans
- Online research/ratings
- Other
Descriptive statistics were used to analyze subject demographics and survey responses. Chi-square analyses and multinomial logistic regressions were utilized to compare responses. All statistical analyses were conducted using SPSS version 24.0 software (SPSS Inc). Statistical significance was set at P < 0.05.
RESULTS
Of the 212 patients who were invited to participate, 196 patients (92.4%) agreed and completed the survey. Demographic and surgical history information can be found in Table 1. The majority of patients were female (62%) and above the age of 50 years (92.4%). Almost half (48.5%) of patients had a prior hip or knee replacement.
Table 1. Survey Respondent Demographics
| Number | Percent |
Age Range | ||
30-40 years | 4 | 2.0% |
40-50 years | 11 | 5.6% |
50-60 years | 47 | 24.0% |
60-70 years | 84 | 42.9% |
70-80 years | 41 | 20.9% |
>80 years | 9 | 4.6% |
Gender | ||
Male | 74 | 37.8% |
Female | 122 | 62.2% |
Ethnicity | ||
African American | 39 | 19.9% |
Asian | 3 | 1.5% |
Caucasian | 140 | 71.4% |
Hispanic | 10 | 5.1% |
Other | 4 | 2.0% |
Prior knee or hip replacement | ||
Yes | 95 | 48.5% |
No | 55 | 28.1% |
No Response | 46 | 23.5% |
When asked how long is too long to wait to see the doctor, 30 minutes (39.8%) was most commonly selected, followed by 40 minutes (24.5%) (Figure 1). When asked how much time patients would like the doctor to spend with them during an office visit, the majority (68.9%) selected either 10 to 15 minutes (41.3%) or 15 to 20 minutes (27.6%) (Figure 2). The majority of patients (92.3%) were satisfied with the amount of time the doctor spent with them. In addition, 94.9% of respondents would want their doctor to tell them what they would do if they were in the patient’s shoes when making decisions regarding their medical care (Table 2). Less than half of respondents (41.8%) believe that seeing a physician extender (eg, nurse practitioner or physician assistant) at a postoperative visit would result in a lower quality of care (Table 2).
Table 2. Responses to Survey Questions
If you were to only see a physician's assistant or nurse practitioner at your follow-up visit and not the doctor, would you feel like you were getting below average care? | ||
Answer choices | Number | Percent |
No | 114 | 58.2% |
Yes | 82 | 41.8% |
If you were to need a major surgery would you want the physician to tell you what he or she would do if they were in your shoes? | ||
Answer choices | Number | Percent |
No | 10 | 5.1% |
Yes | 186 | 94.9% |
Would you prefer your doctor to be the same race/ethnicity as you? | ||
Answer choices | Number | Percent |
No | 29 | 14.8% |
Yes | 3 | 1.5% |
No Preference | 164 | 83.7% |
When asked if patients preferred a doctor of the same race/ethnicity, the vast majority (83.7%) had no preference (Table 2). There was no significant difference found between male and female respondents when asked if they would feel more comfortable with a male as opposed to a female orthopedic surgeon (P = .118) and vice versa (P = .604) (Table 3). Most patients preferred a physician between the ages of 45 and 55 years (39.3%), followed by 35 and 45 years (23.0%); however, this preference was not statistically significant (Table 4). Older patients were more likely to prefer younger physicians (odds ratio, 4.612 for 25-35 years of age; odds ratio, 1.328 for 35-45 years of age). Only 12.2% of patients reported online research/rating sites as the main resource utilized when selecting their physician (Figure 3). The majority (68.4%) reported that recommendations from either friends (35.2%) or healthcare providers (33.2%) were the main avenues through which they found their physicians.
Table 3. Overall Responses to Questions Regarding Male and Female Orthopedic Surgeonsa
Would you feel more comfortable with a male as opposed to a female orthopedic surgeon? | |||||
Answer choices | Number | Percent | Female responses | Male responses | P value |
No | 164 | 83.7% | 106 (86.9%) | 58 (78.4%) | 0.118 |
Yes | 32 | 16.3% | 16 (13.1%) | 16 (21.6%) |
|
Would you feel more comfortable with a female as opposed to a male orthopedic surgeon? | |||||
Answer choices | Number | Percent | Female responses | Male responses | P value |
No | 186 | 94.9% | 115 (94.3%) | 71 (95.9%) | 0.604 |
Yes | 10 | 5.1% | 7 (5.7%) | 3 (4.1%) |
|
aResponses were broken down by gender and compared utilizing a 2 x 2 chi-square analysis to test for significant differences in respondents’ gender preferences for their orthopedic surgeon.
Table 4. Patient Preferences Regarding Physician Age
What age would you like your physician to be? |
| 95% Confidence Interval | ||||
Answer Choices | Number or Responses | Percent | P value | Exp(β) | Lower Bound | Upper Bound |
25-35 years | 1 | 0.5% | 0.217 | 4.612 | 0.407 | 52.283 |
35-45 years | 45 | 23.0% | 0.161 | 1.328 | 0.893 | 1.975 |
45-55 years | 77 | 39.3% | 0.159 | 1.276 | 0.909 | 1.791 |
55-65 years | 9 | 4.6% | 0.483 | 1.302 | 0.624 | 2.717 |
≥65 years | 2 | 1.0% | 0.272 | 0.491 | 0.138 | 1.748 |
No preferencea | 62 | 31.6% | Reference | |||
aNo preference was used as the reference category for the answer choices, while the age bracket “>80 years” was used as the reference for the age of respondent variable.
Continue to: DISCUSSION...
DISCUSSION
The results of this study demonstrate that patients have several expectations and preferences with regards to the care they receive from physicians in the office. Patients prefer to wait <30 minutes before seeing their provider and desire only 10 to 20 minutes with their doctor. Patients do not have specific preferences with regards to the gender or ethnicity of their physician but would prefer a physician in the middle of their career, aged 45 to 55 years. Ultimately, patients do believe that seeing a physician at a postoperative visit is important, as just under half of patients thought that seeing a physician extender alone at a postoperative visit resulted in a lower quality of care.
While these results were obtained in a population specifically seeking the care of an orthopedic adult reconstruction surgeon, the results demonstrate that patients do not necessarily desire an unreasonable amount of time with their doctor. Patients simply want to be seen in a timely fashion and receive the full undivided attention of their doctor for approximately 20 minutes. Similarly, Patterson and colleagues22 found, in their series of 182 patients who presented to an orthopedic surgeon, that there was a significant correlation between time spent with the surgeon and overall patient satisfaction. Interestingly, the authors reported that patient satisfaction was not correlated with education level, sex, marital status, whether the patients were evaluated by a resident physician before seeing the attending surgeon, self-reported mental status, tobacco usage, the type of clinic visit, or the waiting time to see the surgeon (average, about 40 minutes for this cohort).22 Similarly, Teunis and colleagues23 reported an average 32-minute wait time in 81 patients presenting for care at an orthopedic hand clinic and demonstrated that a longer wait time was associated with decreased patient satisfaction. These results corroborate the findings of this study that a short wait time is important to patients when evaluating the process of care. Additionally, patients do not have unreasonable expectations with regards to the amount of time they would like to spend with the physician. A physician who has a clinic for 9 hours a day would thus be able to see 54 patients and still spend at least 10 minutes with each patient. The quality of the physician-patient interaction is likely more important than the actual amount of time spent; however, based on this study, patients do have certain expectations about how much time physicians should spend with them.
There were no significant sex, age, or ethnicity preferences in our specific patient cohort. However, a sizable percentage of respondents, 41.8%, believed that they were receiving inferior care if they only saw a physician extender at a routine follow-up visit. Many orthopedic surgeons rely on the care provided by physician extenders to enable them to see additional patients. Physician extenders are well trained to provide high-quality care, including at routine postoperative visits. The results of this study, that many patients believe physician extenders provide lower-quality care, may be a result of inadequate patient education regarding the extensive training and education physician extenders undergo. Physician extenders are qualified, licensed healthcare professionals who are playing increasingly important roles within orthopedics and medicine as a whole. As the demand for orthopedic surgeons to see more patients increases, so does the role of physician extenders. Future research is warranted into educating the public regarding the importance of these healthcare providers and the adequacy of their training.
While many practices now routinely obtain patient satisfaction scores, another modality through which patients can express their satisfaction and experiences with healthcare providers is through online internet physician rating sites (IPRS). These sites have exploded in number and popularity in recent years and, according to some studies, have a very real effect on provider selection.24 Interestingly, a low percentage of patients in this study utilized IPRS reviews to find their doctors. In a recent prospective survey study of 1000 consecutive patients presenting for care at the Mayo Clinic, Burkle and Keegan24 reported that 27% of patients would choose not to see a physician based on a negative IPRS review. Interestingly, only 1.0% of patients reported finding their doctor through advertising. Numerous authors have recently addressed advertising in orthopedic surgery, specifically direct-to-consumer marking, including the influence of physician self-promotion on patients.25,26 Specifically, Halawi and Barsoum26 discussed how direct-to-consumer marketing is commonly disseminated to the public through television and print advertisements, which are modalities more commonly utilized by older generations. However, many advertising agencies are moving toward internet-based advertising, especially through orthopedic group and individual surgeon websites for self-promoting advertisement, as approximately 75% of Americans use the internet for health-related information.25,27 The fact that many patients in this study did not utilize IPRS reviews or advertising (much of which is electronic) may be a result of the older, less internet-centric demographic that is often seen in an adult reconstruction clinic. Future research is warranted to determine what demographic of patients value IPRS reviews and how those reviews influence physician selection and the patient experience.
There are several limitations to this study. First, the majority of the surveyed population was Caucasian, and our results may not be equally reflective of diverse ethnic backgrounds. Second, the cohort size, while based on previous studies conducted in a similar fashion, may be underpowered to detect significant differences for 1 or more of these questions. In addition, having a question regarding the patient’s medical background or experiences may have provided further insight as to why patients selected the answers that they did. Furthermore, questions regarding the patient’s education level, religious background, and income brackets may have provided further context in which to evaluate their responses. These questions were omitted in an effort to keep the questionnaire at a length that would maximize enrollment and prevent survey fatigue. Future research is warranted to determine what patient-specific, injury/symptom-specific, and treatment-specific variables influence the subjective patient experience.
CONCLUSION
The vast majority of patients desire only 10 to 20 minutes with their doctor and are highly satisfied with the amount of time their surgeon spends with them. Patients reported no significant gender- or ethnicity-based preferences for their doctor. The majority of patients believe that a wait time exceeding 30 minutes is too long. A greater effort needs to be made to educate patients and the public about the significant and effective roles nurse practitioners and physician assistants can play within the healthcare system. While this cohort did not report notable utilization of IPRS reviews, it remains essential to understand what factors influence patients’ subjective experiences with their providers to ensure that patients achieve their desired outcomes, and report as such on these websites as they continue to gain popularity. Diminishing clinic wait times and understanding patient preferences may lead to a greater percentage of “satisfied” patients. While the majority of focus has been and will likely continue to be on improving patients’ satisfaction with their outcomes, more work needs to be done focusing specifically on the process through which outcomes are achieved.
1. Kocher MS, Steadman JR, Briggs K, Zurakowski D, Sterett WI, Hawkins RJ. Determinants of patient satisfaction with outcome after anterior cruciate ligament reconstruction. J Bone Joint Surg Am. 2002;84–A(9):1560-1572.
2. Carr-Hill RA. The measurement of patient satisfaction. J Public Health Med. 1992;14(3):236-249.
3. Ross CK, Steward CA, Sinacore JM. A comparative study of seven measures of patient satisfaction. Med Care. 1995;33(4):392-406. doi:10.1097/00005650-199504000-00006.
4. Strasser S, Aharony L, Greenberger D. The patient satisfaction process: moving toward a comprehensive model. Med Care Rev. 1993;50(2):219-248. doi:10.1177/107755879305000205.
5. Bozic KJ. Orthopaedic healthcare worldwide: shared medical decision making in orthopaedics. Clin Orthop Relat Res. 2013;471(5):1412-1414. doi:10.1007/s11999-013-2838-5.
6. Youm J, Chenok KE, Belkora J, Chiu V, Bozic KJ. The emerging case for shared decision making in orthopaedics. Instr Course Lect. 2013;62:587-594. doi:10.2106/00004623-201210170-00011.
7. Blumenthal D, Abrams M, Nuzum R. The affordable CARE Act at 5 years. N Engl J Med. 2015;373(16):1580. doi:10.1056/NEJMc1510015.
8. Shirley ED, Sanders JO. Patient satisfaction: implications and predictors of success. J Bone Joint Surg Am. 2013;95(10):e69. doi:10.2106/JBJS.L.01048.
9. Morris BJ, Jahangir AA, Sethi MK. Patient satisfaction: an emerging health policy issue. AAOS Now Web site. http://www.aaos.org/AAOSNow/2013/Jun/advocacy/advocacy5/?ssopc=1. Published June 2013. Accessed November 19, 2016.
10. Donabedian A. The quality of care. How can it be assessed? JAMA. 1988;260(12):1743-1748. doi:10.1001/jama.260.12.1743.
11. Bozic KJ, Kaufman D, Chan VC, Caminiti S, Lewis C. Factors that influence provider selection for elective total joint arthroplasty. Clin Orthop Relat Res. 2013;471(6):1865-1872. doi:10.1007/s11999-012-2640-9.
12. Davies AR, Ware JE Jr. Involving consumers in quality of care assessment. Health Aff (Millwood). 1988;7(1):33-48.
13. Black N, Burke L, Forrest CB, et al. Patient-reported outcomes: pathways to better health, better services, and better societies. Qual Life Res. 2016;25(5):1103-1112. doi:10.1007/s11136-015-1168-3.
14. Gilbert A, Sebag-Montefiore D, Davidson S, Velikova G. Use of patient-reported outcomes to measure symptoms and health related quality of life in the clinic. Gynecol Oncol. 2015;136(3):429-439. doi:10.1016/j.ygyno.2014.11.071.
15. Van Der Wees PJ, Nijhuis-Van Der Sanden MW, Ayanian JZ, Black N, Westert GP, Schneider EC. Integrating the use of patient-reported outcomes for both clinical practice and performance measurement: views of experts from 3 countries. Milbank Q. 2014;92(4):754-775. doi:10.1111/1468-0009.12091.
16. Franklin PD, Lewallen D, Bozic K, Hallstrom B, Jiranek W, Ayers DC. Implementation of patient-reported outcome measures in U.S. Total joint replacement registries: rationale, status, and plans. J Bone Joint Surg Am. 2014;96(Suppl 1):104-109. doi:10.2106/JBJS.N.00328.
17. Williams B. Patient satisfaction: a valid concept? Soc Sci Med. 1994;38(4):509-516. doi:10.1016/0277-9536(94)90247-X.
18. Hickson GB, Clayton EW, Entman SS, et al. Obstetricians' prior malpractice experience and patients' satisfaction with care. JAMA. 1994;272(20):1583-1587. doi:10.1001/jama.1994.03520200039032.
19. Larsson BW, Larsson G, Chantereau MW, von Holstein KS. International comparisons of patients' views on quality of care. Int J Health Care Qual Assur Inc Leadersh Health Serv. 2005;18(1):62-73. doi:10.1108/09526860510576974.
20. McLafferty RB, Williams RG, Lambert AD, Dunnington GL. Surgeon communication behaviors that lead patients to not recommend the surgeon to family members or friends: analysis and impact. Surgery. 2006;140(4):616-624. doi:https://doi.org/10.1016/j.surg.2006.06.021.
21. Mira JJ, Tomás O, Virtudes-Pérez M, Nebot C, Rodríguez-Marín J. Predictors of patient satisfaction in surgery. Surgery. 2009;145(5):536-541. doi:10.1016/j.surg.2009.01.012.
22. Patterson BM, Eskildsen SM, Clement RC, et al. Patient satisfaction is associated with time with provider but not clinic wait time among orthopedic patients. Orthopedics. 2017;40(1):43-48. doi:10.3928/01477447-20161013-05.
23. Teunis T, Thornton ER, Jayakumar P, Ring D. Time seeing a hand surgeon is not associated With patient satisfaction. Clin Orthop Relat Res. 2015;473(7):2362-2368. doi:10.1007/s11999-014-4090-z.
24. Burkle CM, Keegan MT. Popularity of internet physician rating sites and their apparent influence on patients' choices of physicians. BMC Health Serv Res. 2015;15:416. doi:10.1186/s12913-015-1099-2.
25. Mohney S, Lee DJ, Elfar JC. The effect of orthopedic advertising and self-promotion on a naive population. Am J Orthop. 2016;45(4):E227-E232.
26. Halawi MJ, Barsoum WK. Direct-to-consumer marketing: implications for patient care and orthopedic education. Am J Orthop. 2016;45(6):E335-E336.
27. Mostaghimi A, Crotty BH, Landon BE. The availability and nature of physician information on the internet. J Gen Intern Med. 2010;25(11):1152-1156. doi:10.1007/s11606-010-1425-7.
TAKE-HOME POINTS
- The vast majority of patients desire only 10 to 20 minutes with their doctor and are highly satisfied with the amount of time their surgeon spends with them.
- Patients reported no significant gender- or ethnicity-based preferences for their doctor.
- The majority of patients believe that a wait time exceeding 30 minutes is too long.
- Nearly 42% of respondents felt they would be receiving below average medical care if seen only by a nurse practitioner or physician’s assistant at a postoperative appointment.
- Recommendations from friends is the most common way patients find their physicians.
Perceived Leg-Length Discrepancy After Primary Total Knee Arthroplasty: Does Knee Alignment Play a Role?
Leg-length discrepancy (LLD) is common in the general population1 and particularly in patients with degenerative joint diseases of the hip and knee.2 Common complications of LLD include femoral, sciatic, and peroneal nerve palsy; lower back pain; gait abnormalities3; and general dissatisfaction. LLD is a concern for orthopedic surgeons who perform total knee arthroplasty (TKA) because limb lengthening is common after this procedure.4,5 Surgeons are aware of the limb lengthening that occurs during TKA,4,5 and studies have confirmed that LLD usually decreases after TKA.4,5
Despite surgeons’ best efforts, some patients still perceive LLD after surgery, though the incidence of perceived LLD in patients who have had TKA has not been well documented. Aside from actual, objectively measured LLD, there may be other factors that lead patients to perceive LLD. Study results have suggested that preoperative varus–valgus alignment of the knee joint may correlate with how much an operative leg is lengthened after TKA4,5; however, the outcome investigated was objective LLD measurements, not perceived LLD. Understanding the factors that may influence patients’ ability to perceive LLD would allow surgeons to preoperatively identify patients who are at higher risk for postoperative perceived LLD. This information, along with expected time to resolution of postoperative perceived LLD, would allow surgeons to educate their patients accordingly.
We conducted a study to determine the incidence of perceived LLD before and after primary TKA in patients with unilateral osteoarthritis and to determine the correlation between mechanical axis of the knee and perceived LLD before and after surgery. Given that surgery may correct mechanical axis misalignment, we investigated the correlation between this correction and its ability to change patients’ preoperative and postoperative perceived LLD. We hypothesized that a large correction of mechanical axis would lead patients to perceive LLD after surgery. The relationship of body mass index (BMI) and age to patients’ perceived LLD was also assessed. The incidence and time frame of resolution of postoperative perceived LLD were determined.
Methods
Approval for this study was received from the Institutional Review Board at our institution, Rush University Medical Center in Chicago, Illinois. Seventy-three patients undergoing primary TKA performed by 3 surgeons at 2 institutions between February 2010 and January 2013 were prospectively enrolled. Inclusion criteria were age 18 years to 90 years and primary TKA for unilateral osteoarthritis; exclusion criteria were allergy or intolerance to the study materials, operative treatment of affected joint or its underlying etiology within prior month, previous surgeries (other than arthroscopy) on affected joint, previous surgeries (on unaffected lower extremity) that may influence preoperative and postoperative leg lengths, and any substance abuse or dependence within the past 6 months. Patients provided written informed consent for total knee arthroplasty.
All surgeries were performed by Dr. Levine, Dr. Della Valle, and Dr. Sporer using the medial parapatellar or midvastus approach with tourniquet. Similar standard postoperative rehabilitation protocols with early mobilization were used in all cases.
During clinical evaluation, patient demographic data were collected and LLD surveys administered. Patients were asked, before surgery and 3 to 6 weeks, 3 months, 6 months, and 1 year after surgery, if they perceived LLD. A patient who no longer perceived LLD after surgery was no longer followed for this study.
At the preoperative clinic visit and at the 3-month or 6-week postoperative visit, standing mechanical axis radiographs were viewed by 2 of the authors (not the primary surgeons) using PACS (picture archiving and communication system software). The mechanical axis of the operative leg was measured with ImageJ software by taking the angle from the center of the femur to the middle of the ankle joint, with the vertex assigned to the middle of the knee joint.
We used a 2-tailed unpaired t test to determine the relationship of preoperative mechanical axis to perceived LLD (or lack thereof) before surgery. The data were analyzed for separate varus and valgus deformities. Then we determined the relationship of postoperative mechanical axis to perceived LLD (or lack thereof) after surgery. The McNemar test was used to determine the effect of surgery on patients’ LLD perceptions.
To determine the relationship between preoperative-to-postoperative change in mechanical axis and change in LLD perceptions, we divided patients into 4 groups. Group 1 had both preoperative and postoperative perceived LLD, group 2 had no preoperative or postoperative perceived LLD, group 3 had preoperative perceived LLD but no postoperative perceived LLD, and group 4 had postoperative perceived LLD but no preoperative perceived LLD. The absolute value of the difference between preoperative and postoperative mechanical axis was then determined, relative to 180°, to account for changes in varus to valgus deformity before and after surgery and vice versa. Analysis of variance (ANOVA) was used to detect differences between groups. This analysis was then stratified based on BMI and age.
Results
Of the 73 enrolled patients, 2 were excluded from results analysis because of inadequate data—one did not complete the postoperative LLD survey, and the other did not have postoperative standing mechanical axis radiographs—leaving 71 patients (27 men, 44 women) with adequate data. Mean (SD) age of all patients was 65 (8.4) years (range, 47-89 years). Mean (SD) BMI was 35.1 (9.9; range, 20.2-74.8).
Of the 71 patients with adequate data, 18 had preoperative perceived LLD and 53 did not; in addition, 7 had postoperative perceived LLD and 64 did not. All 7 patients with postoperative perceived LLD noted resolution of LLD, at a mean of 8.5 weeks (range, 3 weeks-3 months). There was a significant difference between the 18 patients with preoperative perceived LLD and the 7 with postoperative perceived LLD (P = .035, analyzed with the McNemar test).
Table 1 lists the mean preoperative mechanical axis measurements for patients with and without preoperative perceived LLD. 
Table 2 lists the mean postoperative mechanical axis measurements for patients with and without postoperative perceived LLD. 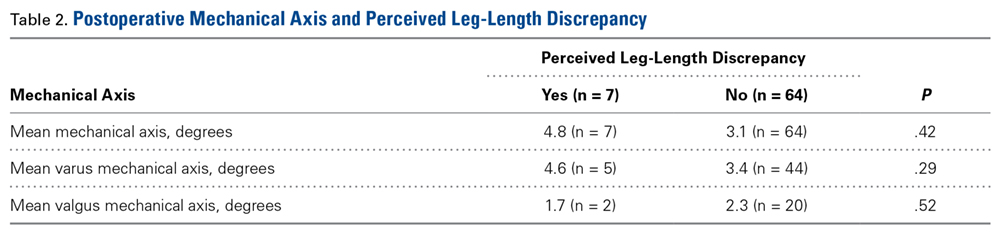
Table 3 lists the mean absolute values of mechanical axis correction (preoperative to postoperative) for the 4 patient groups described in the Methods section. 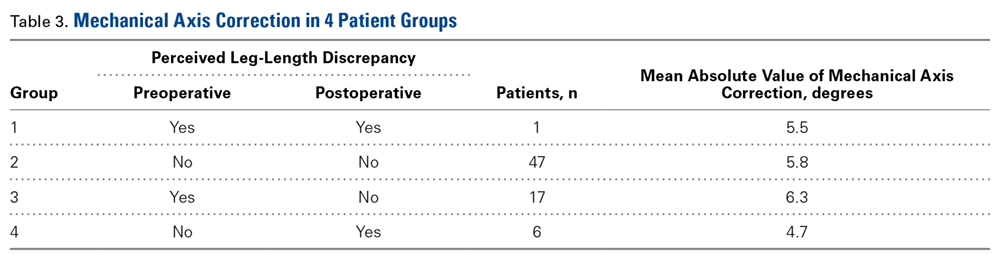
Discussion
In this study, 18 patients (25%) had preoperative perceived LLD, proving that perceived LLD is common in patients who undergo TKA for unilateral osteoarthritis. Surgeons should give their patients a preoperative survey on perceived LLD, as survey responses may inform and influence surgical decisions and strategies.
Of the 18 patients with preoperative perceived LLD, only 1 had postoperative perceived LLD. That perceived LLD decreased after surgery makes sense given the widely accepted notion that actual LLD is common before primary TKA but in most cases is corrected during surgery.4,5 As LLD correction during surgery is so successful, surgeons should tell their patients with preoperative perceived LLD that in most cases it will be fixed after TKA.
Although the incidence of perceived LLD decreased after TKA (as mentioned earlier), the decrease seemed to be restricted mostly to patients with preoperative perceived LLD, and the underlying LLD was most probably corrected by the surgery. However, surgery introduced perceived LLD in 6 cases, supporting the notion that it is crucial to understand which patients are at higher risk for postoperative perceived LLD and what if any time frame can be expected for resolution in these cases. In our study, all cases of perceived LLD had resolved by a mean follow-up of 8.5 weeks (range, 3 weeks-3 months). This phenomenon of resolution may be attributed to some of the physical, objective LLD corrections that naturally occur throughout the postoperative course,4 though psychological factors may also be involved. Our study results suggest patients should be counseled that, though about 10% of patients perceive LLD after primary TKA, the vast majority of perceived LLD cases resolve within 3 months.
One study goal was to determine the relationship between the mechanical axis of the knee and perceived LLD both before and after surgery. There were no significant relationships. This was also true when cases of varus and valgus deformity were analyzed separately.
Another study goal was to determine if a surgical change in the mechanical alignment of the knee would influence preoperative-to-postoperative LLD perceptions. In our analysis, patients were divided into 4 groups based on their preoperative and postoperative LLD perceptions (see Methods section). ANOVA revealed no significant differences in absolute values of mechanical axis correction among the 4 groups. Likewise, there were no correlations between BMI and age and mechanical axis correction among the groups, suggesting LLD perception is unrelated to any of these variables. Ideally, if a relationship between a threshold knee alignment value and perceived LLD existed, surgeons would be able to counsel patients at higher risk for perceived LLD about how their knee alignment may contribute to their perception. Unfortunately, our study results did not show any significant statistical relationships in this regard.
The problem of LLD in patients undergoing TKA is not new, and much research is needed to determine the correlation between perceived versus actual discrepancies, and why they occur. Our study results confirmed that TKA corrects most cases of preoperative perceived LLD but introduces perceived LLD in other cases. Whether preoperative or postoperative LLD is merely perceived or is in fact an actual discrepancy remains to be seen.
One limitation of this study was its lack of leg-length measurements. Although we studied knee alignment specifically, it would have been useful to compare perceived LLD with measured leg lengths, either clinically or radiographically, especially since leg lengths obviously play a role in any perceived LLD. We used mechanical alignment as a surrogate for actual LLD because we hypothesized that alignment may contribute to patients’ perceived discrepancies.
Another limitation was the relatively small sample. Only 24 cases of perceived LLD were analyzed. Given our low rates of perceived LLD (25% before surgery, 10% after surgery), it is difficult to study a large enough TKA group to establish a statistically significant number of cases. Nevertheless, investigators may use larger groups to establish more meaningful relationships.
A third limitation was that alignment was measured on the operative side but not the contralateral side. As we were focusing on perceived discrepancy, contralateral knee alignment may play an important role. Our study involved patients with unilateral osteoarthritis, so it would be reasonable to assume the nonoperative knee was almost neutral in alignment in most cases. However, given that varus/valgus misalignment is a known risk factor for osteoarthritis,6 many of our patients with unilateral disease may very well have had preexisting misalignment of both knees. The undetermined alignment of the nonoperative side may be a confounding variable in the relationship between operative knee alignment and perceived LLD.
Fourth, not all patients were surveyed 3 weeks after surgery. Some were first surveyed at 6 weeks, and it is possible there were cases of transient postoperative LLD that resolved before that point. Therefore, our reported incidence of postoperative LLD could have missed some cases. In addition, our mean 8.5-week period for LLD resolution may not have accounted for these resolved cases of transient perceived LLD.
Am J Orthop. 2016;45(7):E429-E433. Copyright Frontline Medical Communications Inc. 2016. All rights reserved.
1. O’Brien S, Kernohan G, Fitzpatrick C, Hill J, Beverland D. Perception of imposed leg length inequality in normal subjects. Hip Int. 2010;20(4):505-511.
2. Noll DR. Leg length discrepancy and osteoarthritic knee pain in the elderly: an observational study. J Am Osteopath Assoc. 2013;113(9):670-678.
3. Clark CR, Huddleston HD, Schoch EP 3rd, Thomas BJ. Leg-length discrepancy after total hip arthroplasty. J Am Acad Orthop Surg. 2006;14(1):38-45.
4. Chang MJ, Kang YG, Chang CB, Seong SC, Kim TK. The patterns of limb length, height, weight and body mass index changes after total knee arthroplasty. J Arthroplasty. 2013;28(10):1856-1861.
5. Lang JE, Scott RD, Lonner JH, Bono JV, Hunter DJ, Li L. Magnitude of limb lengthening after primary total knee arthroplasty. J Arthroplasty. 2012;27(3):341-346.
6. Sharma L, Song J, Dunlop D, et al. Varus and valgus alignment and incident and progressive knee osteoarthritis. Ann Rheum Dis. 2010;69(11):1940-1945.
Leg-length discrepancy (LLD) is common in the general population1 and particularly in patients with degenerative joint diseases of the hip and knee.2 Common complications of LLD include femoral, sciatic, and peroneal nerve palsy; lower back pain; gait abnormalities3; and general dissatisfaction. LLD is a concern for orthopedic surgeons who perform total knee arthroplasty (TKA) because limb lengthening is common after this procedure.4,5 Surgeons are aware of the limb lengthening that occurs during TKA,4,5 and studies have confirmed that LLD usually decreases after TKA.4,5
Despite surgeons’ best efforts, some patients still perceive LLD after surgery, though the incidence of perceived LLD in patients who have had TKA has not been well documented. Aside from actual, objectively measured LLD, there may be other factors that lead patients to perceive LLD. Study results have suggested that preoperative varus–valgus alignment of the knee joint may correlate with how much an operative leg is lengthened after TKA4,5; however, the outcome investigated was objective LLD measurements, not perceived LLD. Understanding the factors that may influence patients’ ability to perceive LLD would allow surgeons to preoperatively identify patients who are at higher risk for postoperative perceived LLD. This information, along with expected time to resolution of postoperative perceived LLD, would allow surgeons to educate their patients accordingly.
We conducted a study to determine the incidence of perceived LLD before and after primary TKA in patients with unilateral osteoarthritis and to determine the correlation between mechanical axis of the knee and perceived LLD before and after surgery. Given that surgery may correct mechanical axis misalignment, we investigated the correlation between this correction and its ability to change patients’ preoperative and postoperative perceived LLD. We hypothesized that a large correction of mechanical axis would lead patients to perceive LLD after surgery. The relationship of body mass index (BMI) and age to patients’ perceived LLD was also assessed. The incidence and time frame of resolution of postoperative perceived LLD were determined.
Methods
Approval for this study was received from the Institutional Review Board at our institution, Rush University Medical Center in Chicago, Illinois. Seventy-three patients undergoing primary TKA performed by 3 surgeons at 2 institutions between February 2010 and January 2013 were prospectively enrolled. Inclusion criteria were age 18 years to 90 years and primary TKA for unilateral osteoarthritis; exclusion criteria were allergy or intolerance to the study materials, operative treatment of affected joint or its underlying etiology within prior month, previous surgeries (other than arthroscopy) on affected joint, previous surgeries (on unaffected lower extremity) that may influence preoperative and postoperative leg lengths, and any substance abuse or dependence within the past 6 months. Patients provided written informed consent for total knee arthroplasty.
All surgeries were performed by Dr. Levine, Dr. Della Valle, and Dr. Sporer using the medial parapatellar or midvastus approach with tourniquet. Similar standard postoperative rehabilitation protocols with early mobilization were used in all cases.
During clinical evaluation, patient demographic data were collected and LLD surveys administered. Patients were asked, before surgery and 3 to 6 weeks, 3 months, 6 months, and 1 year after surgery, if they perceived LLD. A patient who no longer perceived LLD after surgery was no longer followed for this study.
At the preoperative clinic visit and at the 3-month or 6-week postoperative visit, standing mechanical axis radiographs were viewed by 2 of the authors (not the primary surgeons) using PACS (picture archiving and communication system software). The mechanical axis of the operative leg was measured with ImageJ software by taking the angle from the center of the femur to the middle of the ankle joint, with the vertex assigned to the middle of the knee joint.
We used a 2-tailed unpaired t test to determine the relationship of preoperative mechanical axis to perceived LLD (or lack thereof) before surgery. The data were analyzed for separate varus and valgus deformities. Then we determined the relationship of postoperative mechanical axis to perceived LLD (or lack thereof) after surgery. The McNemar test was used to determine the effect of surgery on patients’ LLD perceptions.
To determine the relationship between preoperative-to-postoperative change in mechanical axis and change in LLD perceptions, we divided patients into 4 groups. Group 1 had both preoperative and postoperative perceived LLD, group 2 had no preoperative or postoperative perceived LLD, group 3 had preoperative perceived LLD but no postoperative perceived LLD, and group 4 had postoperative perceived LLD but no preoperative perceived LLD. The absolute value of the difference between preoperative and postoperative mechanical axis was then determined, relative to 180°, to account for changes in varus to valgus deformity before and after surgery and vice versa. Analysis of variance (ANOVA) was used to detect differences between groups. This analysis was then stratified based on BMI and age.
Results
Of the 73 enrolled patients, 2 were excluded from results analysis because of inadequate data—one did not complete the postoperative LLD survey, and the other did not have postoperative standing mechanical axis radiographs—leaving 71 patients (27 men, 44 women) with adequate data. Mean (SD) age of all patients was 65 (8.4) years (range, 47-89 years). Mean (SD) BMI was 35.1 (9.9; range, 20.2-74.8).
Of the 71 patients with adequate data, 18 had preoperative perceived LLD and 53 did not; in addition, 7 had postoperative perceived LLD and 64 did not. All 7 patients with postoperative perceived LLD noted resolution of LLD, at a mean of 8.5 weeks (range, 3 weeks-3 months). There was a significant difference between the 18 patients with preoperative perceived LLD and the 7 with postoperative perceived LLD (P = .035, analyzed with the McNemar test).
Table 1 lists the mean preoperative mechanical axis measurements for patients with and without preoperative perceived LLD.
Table 2 lists the mean postoperative mechanical axis measurements for patients with and without postoperative perceived LLD.
Table 3 lists the mean absolute values of mechanical axis correction (preoperative to postoperative) for the 4 patient groups described in the Methods section.
Discussion
In this study, 18 patients (25%) had preoperative perceived LLD, proving that perceived LLD is common in patients who undergo TKA for unilateral osteoarthritis. Surgeons should give their patients a preoperative survey on perceived LLD, as survey responses may inform and influence surgical decisions and strategies.
Of the 18 patients with preoperative perceived LLD, only 1 had postoperative perceived LLD. That perceived LLD decreased after surgery makes sense given the widely accepted notion that actual LLD is common before primary TKA but in most cases is corrected during surgery.4,5 As LLD correction during surgery is so successful, surgeons should tell their patients with preoperative perceived LLD that in most cases it will be fixed after TKA.
Although the incidence of perceived LLD decreased after TKA (as mentioned earlier), the decrease seemed to be restricted mostly to patients with preoperative perceived LLD, and the underlying LLD was most probably corrected by the surgery. However, surgery introduced perceived LLD in 6 cases, supporting the notion that it is crucial to understand which patients are at higher risk for postoperative perceived LLD and what if any time frame can be expected for resolution in these cases. In our study, all cases of perceived LLD had resolved by a mean follow-up of 8.5 weeks (range, 3 weeks-3 months). This phenomenon of resolution may be attributed to some of the physical, objective LLD corrections that naturally occur throughout the postoperative course,4 though psychological factors may also be involved. Our study results suggest patients should be counseled that, though about 10% of patients perceive LLD after primary TKA, the vast majority of perceived LLD cases resolve within 3 months.
One study goal was to determine the relationship between the mechanical axis of the knee and perceived LLD both before and after surgery. There were no significant relationships. This was also true when cases of varus and valgus deformity were analyzed separately.
Another study goal was to determine if a surgical change in the mechanical alignment of the knee would influence preoperative-to-postoperative LLD perceptions. In our analysis, patients were divided into 4 groups based on their preoperative and postoperative LLD perceptions (see Methods section). ANOVA revealed no significant differences in absolute values of mechanical axis correction among the 4 groups. Likewise, there were no correlations between BMI and age and mechanical axis correction among the groups, suggesting LLD perception is unrelated to any of these variables. Ideally, if a relationship between a threshold knee alignment value and perceived LLD existed, surgeons would be able to counsel patients at higher risk for perceived LLD about how their knee alignment may contribute to their perception. Unfortunately, our study results did not show any significant statistical relationships in this regard.
The problem of LLD in patients undergoing TKA is not new, and much research is needed to determine the correlation between perceived versus actual discrepancies, and why they occur. Our study results confirmed that TKA corrects most cases of preoperative perceived LLD but introduces perceived LLD in other cases. Whether preoperative or postoperative LLD is merely perceived or is in fact an actual discrepancy remains to be seen.
One limitation of this study was its lack of leg-length measurements. Although we studied knee alignment specifically, it would have been useful to compare perceived LLD with measured leg lengths, either clinically or radiographically, especially since leg lengths obviously play a role in any perceived LLD. We used mechanical alignment as a surrogate for actual LLD because we hypothesized that alignment may contribute to patients’ perceived discrepancies.
Another limitation was the relatively small sample. Only 24 cases of perceived LLD were analyzed. Given our low rates of perceived LLD (25% before surgery, 10% after surgery), it is difficult to study a large enough TKA group to establish a statistically significant number of cases. Nevertheless, investigators may use larger groups to establish more meaningful relationships.
A third limitation was that alignment was measured on the operative side but not the contralateral side. As we were focusing on perceived discrepancy, contralateral knee alignment may play an important role. Our study involved patients with unilateral osteoarthritis, so it would be reasonable to assume the nonoperative knee was almost neutral in alignment in most cases. However, given that varus/valgus misalignment is a known risk factor for osteoarthritis,6 many of our patients with unilateral disease may very well have had preexisting misalignment of both knees. The undetermined alignment of the nonoperative side may be a confounding variable in the relationship between operative knee alignment and perceived LLD.
Fourth, not all patients were surveyed 3 weeks after surgery. Some were first surveyed at 6 weeks, and it is possible there were cases of transient postoperative LLD that resolved before that point. Therefore, our reported incidence of postoperative LLD could have missed some cases. In addition, our mean 8.5-week period for LLD resolution may not have accounted for these resolved cases of transient perceived LLD.
Am J Orthop. 2016;45(7):E429-E433. Copyright Frontline Medical Communications Inc. 2016. All rights reserved.
1. O’Brien S, Kernohan G, Fitzpatrick C, Hill J, Beverland D. Perception of imposed leg length inequality in normal subjects. Hip Int. 2010;20(4):505-511.
2. Noll DR. Leg length discrepancy and osteoarthritic knee pain in the elderly: an observational study. J Am Osteopath Assoc. 2013;113(9):670-678.
3. Clark CR, Huddleston HD, Schoch EP 3rd, Thomas BJ. Leg-length discrepancy after total hip arthroplasty. J Am Acad Orthop Surg. 2006;14(1):38-45.
4. Chang MJ, Kang YG, Chang CB, Seong SC, Kim TK. The patterns of limb length, height, weight and body mass index changes after total knee arthroplasty. J Arthroplasty. 2013;28(10):1856-1861.
5. Lang JE, Scott RD, Lonner JH, Bono JV, Hunter DJ, Li L. Magnitude of limb lengthening after primary total knee arthroplasty. J Arthroplasty. 2012;27(3):341-346.
6. Sharma L, Song J, Dunlop D, et al. Varus and valgus alignment and incident and progressive knee osteoarthritis. Ann Rheum Dis. 2010;69(11):1940-1945.