User login
BALTIMORE – Researchers have developed an algorithm to calculate circulation time during sleep that may provide another tool to identify the risk of underlying cardiac vascular disease in patients with sleep apnea, one of the study’s lead investigators reported at the annual meeting of the Associated Professional Sleep Societies.
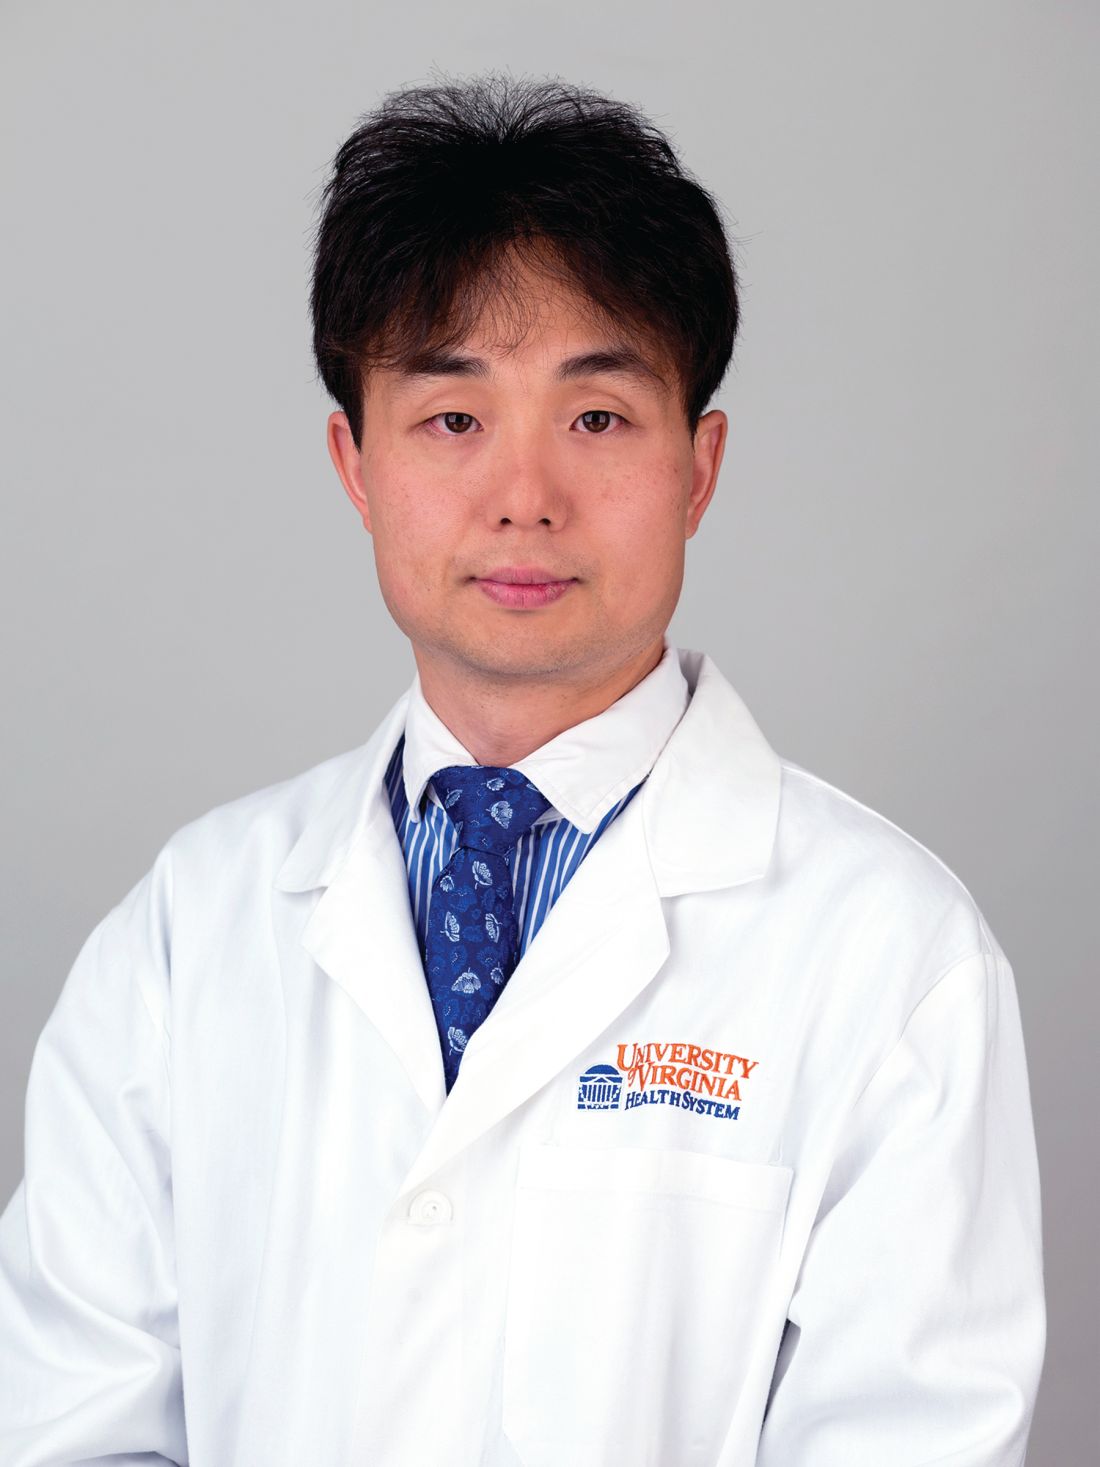
“There’s always been a question that there could be some global or untapped physiological indices that might give us some glimpse into future cardiovascular events or instantaneous cardiovascular vulnerability during sleep apnea events,” said Younghoon Kwon, MD, assistant professor of cardiovascular medicine at the University of Virginia, Charlottesville. “Circulation time that can be derived from a sleep study may be one of these novel indices. Although it has been examined in patients with heart failure with Cheyne-Stokes respiration, it has rarely been studied in patients with obstructive sleep apnea without heart failure.”
He noted that in this study, which utilized a cohort of 686 patients from the Multi-Ethnic Study of Atherosclerosis (MESA), all with an apnea-hypopnea index greater than 15, the automated algorithm the researchers developed to calculate lung-to-finger circulation was correlated highly with visual measurement.
The algorithm used randomly selected polysomnograms from the MESA cohort. It employed the airflow/nasal signal and the oxygen saturation signal, using the visually scored start and endpoint of apnea/hypopnea as a starting point. For each event, the calculation identified two key points: the endpoint of apnea/hypopnea and the endpoint of desaturation to arrive at a calculation of lung-to-finger circulation, Dr. Kwon explained.
The significance of the findings was the correlation between the visual and automated methods of calculating lung-to-finder circulation time. In a matched subgroup of 25 subjects, the correlation was around 95% (P less than .0001); in all cases, the correlation was around 69% (P less than .001). In matched cases, the average lung-to-finger circulation times were identical with visual and automated techniques: 19.5 seconds (P = .92), whereas in all cases the averages differed: 19.6 seconds for visual versus 18.6 seconds for automated (P = .42). “The results showed that the visual against the automated circulatory time measurement was very good,” Dr. Kwon said.
With this algorithm, multiple circulation time measures were automatically derived for each sleep study. Subsequently, average circulation time was derived for each study participant. The average circulation time was 19.4 seconds in the entire cohort, versus 21.0 seconds in those with apnea and 17.6 seconds in patients with hypopnea.
“Older age, male gender, and higher obstructive sleep apnea severity appeared to be independently associated with higher than average lung-to-finger circulation times,” Dr. Kwon said. “However, there was no apparent association between the obstructive event length or the severity of oxygen desaturation and the respective circulation time within subjects. Similarly, sleep positions and sleep stages do not seem to bear any association.”
One of the limitations of the study, he noted, was its assumption of the automated algorithm as the threshold and somewhat limited candidate variables. Future studies should involve more diverse cohorts with prevalent cardiovascular disease to determine the utility of the algorithm in predicting cardiovascular events, he said.
Dr. Kwon reported having no financial relationships, and the American Academy of Sleep Medicine Foundation provided study funding.
SOURCE: Kwon Y et al. SLEEP 2018, Abstract #0450.
REPORTING FROM SLEEP 2018
Key clinical point: An automated algorithm to calculate sleep-study circulation times correlated with visual review.
Major finding: The correlation between visual and automated methods for calculating lung-to-finger circulation times was around 95% (P less than .0001).
Study details: A cohort of 686 participants in the Multi-Ethnic Study of Atherosclerosis.
Disclosures: Dr. Kwon reported no financial disclosures, and the American Academy of Sleep Medicine Foundation provided study funding.
Source: Kwon Y et al. SLEEP 2018, Abstract #0450.

