User login
Americans are buying less packaged food and beverages these days, and they’re getting less salt in the food that they do buy, but very few are getting the optimal sodium density in their purchases, according to a study involving more than 170,000 households.
First, salt content: In 2014, the households taking part in the Nielsen Homescan Consumer Panel were getting 361 mg of salt per 100 g of packaged food purchased, which is 12% less than the 411 mg per 100 g of food purchased in 2000. Overall sodium content, which includes beverages, dropped from 192 mg/100 g to 186 mg/100 g, said Jennifer M. Poti, PhD, of the University of North Carolina at Chapel Hill, and her associates.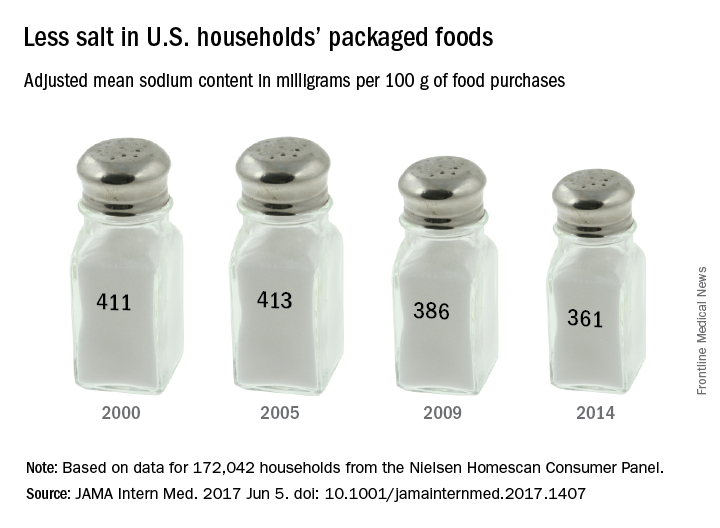
Total food and beverage purchases also were down from 1,328 g/day in 2000 to 1,134 in 2014, and the total sodium content of those purchases followed suit, dropping from 2,363 mg/day in 2000 to 1,967 mg/day in 2014. The decline in total purchases, however, was driven largely by beverages, which fell 21% from 2000 to 2014, while packaged food purchases fell by only 2%, the investigators reported (JAMA Intern Med. 2017 June 5. doi: 10.1001/jamainternmed.2017.1407).
Median sodium density was down significantly from 1,712 to 1,628 mg of sodium per 1,000 kcal, but by 2014, only 1.2% of the 172,042 households included in the study were purchasing the optimal level of 1,100 mg per 1,000 kcal, based on the DASH-Sodium trial and the Health Eating Index-2010, Dr. Poti and her associates said.
“Additional studies are needed to examine whether decreases in sodium from packaged foods were offset by increases in sodium from away-from-home sources,” they said, and since “there were no major shifts in the amount purchased for key food groups … sodium declines may relate mainly to reformulation.”
The study was funded by the Robert Wood Johnson Foundation, the National Institutes of Health, and the Carolina Population Center at the University of North Carolina. One of the investigators is supported by a National Health and Medical Research Council of Australia Early Career Fellowship. The investigators did not report any conflicts of interest.
FROM JAMA INTERNAL MEDICINE