User login
COVID-19, caused by SARS-CoV-2, is more severe in individuals with underlying illnesses. Because complete social distancing might be more difficult in nursing homes and community living centers (CLCs), public health leaders and clinicians have been concerned about the epidemiology and disease course in nursing homes even before the COVID-19 pandemic.1-7 A report of a COVID-19 outbreak in a nursing home facility in King County, Washington, documented a 33.7% overall fatality rate for residents and 52.4% among the most critically ill.4,5 The experience at King County, Washington, shows that proactive steps to identify, monitor, and apply preventive control measures is important for future outbreaks.5
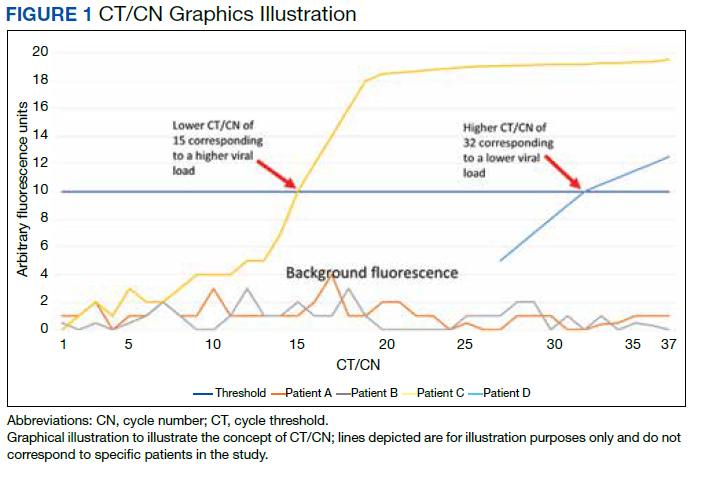
Reverse transcriptase polymerase chain reaction (RT-PCR) testing produces a cycle threshold (CT) or cycle number (CN) that correlates with viral load and infectiousness. 8-14 CT/CN represents the number of RT-PCR cycles required for the fluorescent signal to cross the detection threshold (exceed background level) and is inversely proportional to the viral load. Effectively, the higher the viral load, the lower the CT/ CN value (Figure 1). Tracking CT/CN values was not documented in the Washington nursing home outbreak. Reports of COVID- 19 testing in CLCs during outbreaks are sparse, and CT/CN values and demographic distribution of these veterans has not been reported.15 The CLC veteran population, with known higher vulnerability to infection and chronic diseases, is epidemiologically different from the general nursing home population.15-18 To address these literature gaps, we present the first report of COVID- 19 testing with CT/CN value correlations in the high-risk veteran CLC population.
Methods
A retrospective review of all COVID-19 CT/CN testing at the Corporal Michael J. Crescenz Veterans Affairs Medical Center (VAMC) CLC in Philadelphia, Pennsylvania, from March 28, 2020, to April 24, 2020, was performed with a US Department of Veterans Affairs (VA) Veterans Health Information System Architecture VistA/FileMan search. Only veteran residents were included in this review. Data collected included initial and serial test results, CT/CN on positive test results, test dates, testing platform used, demographic information (age, self-reported ethnicity, and sex), and clinical follow-up information. Health records were reviewed retrospectively to identify death, the first day after diagnosis with no documented symptoms, or hospitalization status.
RT-PCR testing was performed with the Abbott RealTime SARS-CoV-2 assay on the Abbott m2000 platform and the Xpert Xpress SARS-CoV-2 assay on the Cepheid Infinity platform. The Xpert Xpress assay gave 2 CT values for the E and N2 targets on positive samples.19 For this assay to indicate a positive specimen, amplification by RT-PCR of the N2 target or both the N2 and E target is required. The Xpert Xpress assay results as presumptive positive if only the E target amplified. This assay counts a maximum of 45 cycles. The Abbott RealTime SARS-CoV-2 assay gave 1 CN derived from the RNA-dependent RNA polymerase and N targets on positive samples.20 The Abbott assay on the m2000 counts a maximum of 37 cycles. The CT/CN value is the number of cycles required by RT-PCR for the fluorescence signal to cross a threshold value exceeding background level.19,20
Samples that are negative for COVID-19 by RT-PCR do not produce a CT/CN value. Although both instruments were used for RT-PCR, the precise CT/CN values are not interchangeable and CT/CN observations over time between the 2 instruments during the disease course would be based on CT/CN value movement (general upward or downward trend) rather than absolute CT/CN differences. Both assays have been approved by emergency use authorization as qualitative tests for the presence/absence of COVID-19. Although the CT/CN value is available to laboratory staff after test completion, the CT/CN value is not reported routinely in the patient health record. All veteran patients identified on the initial review from March 28, 2020, to April 24, 2020, had all serial COVID-19 testing recorded until November 10, 2020. The CN values at the limit of detection (LOD) for the Abbott m2000 platform from the initial validation study were reviewed for reference.21
Results
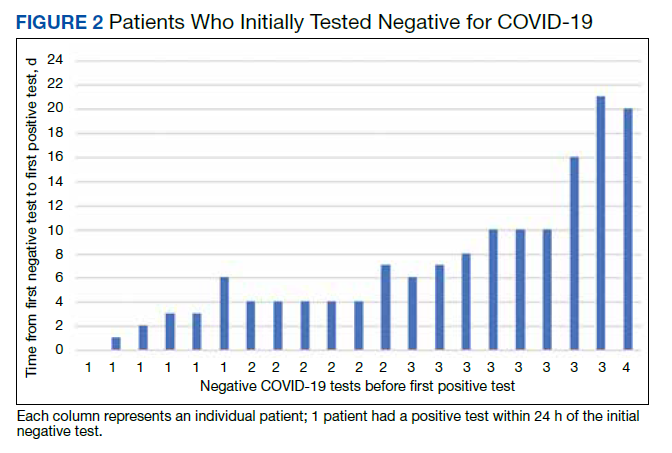
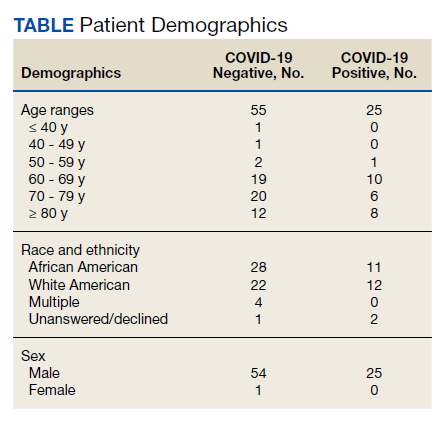
Of 80 patients, 25 (31%) were COVID-19 positive over the course of testing. The study population had a mean age of 73.5 years; 92% were aged > 60 years. The group was predominantly male (79 male vs 1 female). Among the 77 patients with a stated ethnicity, 39 (51%) were African American. In comparison, 43% of residents in Philadelphia County are African American (Table).22,23 Additionally, a previously published total COVID-19 tested population by ethnicity at the same regional VAMC revealed 46.8% of tested veteran patients were African American. 24 Three patients had no stated ethnicity. Among those who tested positive, 11 were African American patients, 12 were White patients, and 2 had no stated ethnicity. Four patients tested positive on their first test. The other 21 patients were positive on repeat testing. Interestingly, 6 patients had 1 initial negative test before a positive test, 6 patients had 2, 8 patients had 3, and 1 patient had 4 initial negative tests before a positive test result. Among the 25 positive patients, 22 were either positive within 10 days of the initial negative test result or initially positive (Figure 2). Three patients who tested positive after 10 days did so at 16, 20, and 21 days after the initial negative test result. Among the 25 positive patients, 23 had initial and serial testing from both the Abbott and Xpert Xpress assays. The remaining 2 positive patients had initial and serial testing from the Abbott assay exclusively.
Only positive COVID-19 results by RTPCR produced a CT/CN value. After disease resolution with a negative test, no CT/CN value was produced with the negative test result on either testing platform. Because repeat testing after the initial positive result took place no sooner than 10 days, we observed that the CT/CN value increased after the initial positive result until the disease resolved, and a negative result was obtained (eAppendix 1, available online at doi:10.12788/fp.0276). A t test comparing the initial CT/CN value to the value more than 10 days after the initial positive showed the CT/CN was statistically significantly higher (P < .05).
Prompt repeat testing after the initial test can show a decrease in the CT/CN value because of increasing viral load before the expected increase until disease resolution if the initial test caught the infection early. Twelve patients had a negative test result between 2 serial positive results. These negative test results occurred later, near the end of the disease course. Among the 12 patients with this positive-negativepositive CT/CN pattern, 7 were symptomatic and no longer had documented symptoms or hospitalization around the time of this positive-negative-positive pattern. Four of these individuals were asymptomatic during the entire infection course. One of the 12 patients with this pattern expired with the negative result occurring on day 27 of the disease in the context of rising CT/CN. One of these 12 patients only had a presumptive positive test result on the Cepheid because it detected only the E target with a CT value of 38.7. In 1 of the 12 patients, the negative test result occurred between 2 positive test results with CT/CN values < 20 (12.05 and 19.05 for the positive tests before and after the negative result, respectively). When the initial CT/CN values was separated based on ethnicity, the average CT/CN value for African Americans (23.3) was higher than for other ethnicities (19.9), although it did not reach statistical significance (P = .35).
Ten of the 25 patients testing positive were admitted to the hospital, including 1 admitted 15 days before diagnosis (patient 20) and 1 admitted 80 days after diagnosis (patient 7). Among these 10 patients, 6 were admitted to the intensive care unit, including patient 7. None of the patients were intubated. Three of the 10 admitted patients died (patients 7, 20, and 24). Patient 7 was a 79-year-old male with a history of dementia, cerebrovascular accident, hypertension, hyperlipidemia, and chronic kidney disease with symptoms of lethargy and refusal of oral intake when he was diagnosed with COVID-19. He was admitted 80 days after diagnosis for hyponatremia and acute renal failure, with death on day 87 recorded as complications from the earlier COVID-19 infection. Patient 20, an 89-year-old male with a history of dementia, chronic kidney disease, and hyperlipidemia, had been admitted with fever, cough, and leukocytosis 17 days before COVID-19 diagnosis. He continued to be symptomatic after diagnosis with development of hypotension, dehydration, and refusal of oral intake while on comfort measures/endof- life care and died 15 days after COVID- 19 infection diagnosis. Patient 24 was a 96-year-old male with history of heart failure, hypertension, coronary artery disease, prostate carcinoma, and dementia who developed a cough at the time of diagnosis; because of his underlying condition, he remained in the CLC on comfort care. His symptoms, including hypoxia, worsened until he died 7 days after diagnosis.
Among the 25 patients, 17 were symptomatic at the time of diagnosis; the 14 initially symptomatic patients who survived improved clinically and returned to baseline. Eight of the 25 patients were asymptomatic initially and 3 developed symptoms 2 to 5 days after diagnosis. Only 1 patient who remained asymptomatic was admitted for inability to adhere to quarantine at the CLC. Review of the health records of all surviving symptomatic patients showed symptom resolution with return to baseline that corresponds to an increasing CT/CN value. A 1-tailed t test comparing the initial CT/ CN at the time of diagnosis to the last CT/CN value for symptomatic patients who recovered revealed a statistically significant increase (P < .05). For the symptomatic, symptom resolution and hospital discharge took (if required) a mean 20 days (range, 7-46). Among those who were not hospitalized, symptoms resolved in 7 to 36 days (18 days). Among those requiring hospitalization at any time (excluding patients who died or were asymptomatic), symptom and hospitalization resolution took a mean 22 days (range, 10-46). Asymptomatic patients (patients 8, 10, 15, 16, and 25) also showed increasing CT/CN value during the infection course, although there was no correlation with the continued lack of symptoms.
During the initial validation of the Abbott m2000 instrument, an LOD study included concentrations of 1000, 500, 250, 100, 70, 60, and 50 virus copies/mL (eAppendix 2, available online at doi:10.12788/fp.0276).21 The average CN at 100 virus copies/mL—the manufacturer provided LOD in the instructions for use—was 25.74.20 At a concentration of one-half that (50 virus copies/mL), the average CN was 28.39.
Discussion
This is the first study in the English literature to track CT/CN values as part of serial testing of a veteran CLC. Widescale testing and repeat screening in the absence of symptoms of nursing home residents would identify those who are infected and allow providers to track viral load clearance.9-14 CT/CN values, when serially tracked during the infection course, appear to increase with illness resolution, consistent with earlier reports that CT/CN correlates with viral load.8-14 Serial CT/CN values that are high (> 25) and continue to increase with each test suggest progression toward disease resolution or viral RNA clearance.8-14 After symptom resolution, patients can have a persistent low level of viral shedding (corresponding to a high CT/CN value).10-14,25 Near the end of disease resolution, a negative serial RT-PCR sample test before a subsequent positive might be a promising clinical sign of near disease recovery. Once the viral load is low with a CT/CN significantly higher than 25, some specimens might result as negative but turn up positive on subsequent sampling with a high CT/CN value. This pattern, with attendant high CT/CN values for the positive results, are consistent with the known effect of viral load (ie, a low viral load correlates to a high CT/CN) and adequacy of specimen collection on CT/CN values.25 If the patient’s viral load is low, the sample collected might have a viral load at or near the testing platform’s LOD.
For Abbott m2000, the manufacturer provided LOD is 100 virus copies/mL, although the instrument was able to detect virus concentrations below that level during the initial validation.20 The actual LOD of the instrument at our institution is < 100 virus copies/mL. For the Cepheid Xpert Xpress SARS-CoV-2 assay, the manufacturer-provided LOD is 250 virus copies/mL.19 An LOD study including samples below the manufacturer-provided LOD was not part of the initial validation study for the Xpert Xpress assay. Nonetheless, the virus concentration of samples with very high CT values at or near the maximum CT value of 45 is expected to be at or near the platform’s actual LOD.
If the samples collected near the end of the patient’s disease course have viral loads near these low concentrations, the encouraging positive-negative-positive pattern with high CT/CN values might be a promising sign for viral clearance. On the other hand, a positive-negative-positive pattern in the setting of low CT/CN values before and after the negative test might indicate poor sampling for the negative specimen. The back-and-forth or positive-negative-positive pattern generally appears to indicate near resolution of the infection course, although clinical correlation is necessary to rule out inadequate sampling earlier in the disease course or prolonged viral RNA shedding.9-14 In all of the surviving symptomatic patients who showed the positive-negative-positive pattern, this sign occurred around or after symptom resolution. It also is important to consider that in some patients, SARS-CoV-2 RNA might remain detectable with increasing CT/CN after symptom resolution, and samples from these patients might not result positive. Therefore, CT/CN values cannot be interpreted without considering the clinical picture.25
Studies on infectiousness and virus culture from COVID-19 samples with CT/ CN correlation have shown that patients with high CT/CN at the end of their disease course might not be as infectious.9-14,25 Because 1 patient had a presumptive positive result after the negative result, this study shows that this positive-negative-positive pattern could include presumptive positive results. Also, in the setting of a recent positive result on the same testing platform, a patient with this pattern is presumed to be positive for COVID-19 RNA because of scant viral material.
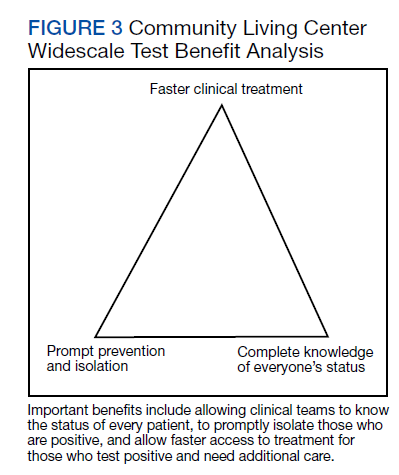
Taiwan’s public health response to the outbreak illustrates the ability to mitigate an outbreak throughout a society.26 These actions could help blunt an outbreak within a civilian nursing home population.5 Mitigation within a veteran CLC population has been documented, but the study, which focused on mitigation, did not consider CT/CN values, demographic distribution, testing access of the studied population, or laboratory findings related to disease pathophysiology.15 A key ingredient in widescale, serial testing is the availability of a rapid turnaround from testing in-house that allowed identification within 24 hours instead of several days at a reference laboratory. 15 Rapid widescale testing would allow clinical teams to optimize the Triangle of Benefit of Widescale Timely Tests for CLC (Figure 3).15 Timely laboratory testing remains pivotal for CLC veteran residents to aid successful clinical triage and management. Reporting serial CT/CN values can provide additional information to clinicians about the disease course because CT/ CN correlates with viral load, which varies based on where the patient is in the disease course.9-14 CT/CN values carry significant prognostic value, particularly with respect to intubation and mortality.8
Limitations
Important limitations to our study include the use of 2 separate RT-PCR platforms. Using different RT-PCR platforms is common in clinical laboratories trying to take advantage of the unique characteristics of different platforms—for example, turnaround time vs high throughput— to manage COVID-19 testing workflow.25 However, the exact CT/CN values obtained from each platform might not translate to the other, and the general trend (CT/CN values are rising or falling across serial tests) rather than a single value could be useful for clinical correlation. Even when the same platform is used for the serial testing, CT/CN values can be affected by adequacy of specimen collection; therefore, clinical correlation and considering the trend in CT/CN values is necessary for interpretation.10-14,25 Because of the known trend in viral dynamics, a positive specimen collected with a high CT/CN followed by a subsequent (within 2 days) positive specimen collected with a low CT/CN might be compatible with early detection of COVID- 19 infection in the appropriate clinical context. 10-14 However, detection late in the infection course or even after the symptomatic disease resolved with prolonged viral shedding might show serial positive samples with increasing CT/CN values.10-14
Patients with prolonged viral shedding might not be infectious.27 Because of the clinical correlation required for interpretation and the other factors that might affect CT/CN values, recommendations advise against using CT/CN values in clinical practice at this time, although these recommendations could change with future research.25 Serial CT/CN values have the potential, if appropriately correlated with the clinical picture, to provide useful information, such as whether the viral load of the sample is relatively high or low and increasing or decreasing.
Veterans, as a population, are more susceptible to poor health outcomes and morbidity compared with similar civilian counterparts.2,14-16 Veteran CLC patients likely would experience worse outcomes with COVID-19, including more infections, expiration, and morbidity compared with similar general population nursing homes. Similar to what had been reported for the civilian population, a trend (high CT/CN values early in the disease course with repeat testing needed to detect all positives followed by lower CT/CN value to correlate with increased viral load and then increased CT/CN value as the infection resolved) also was observed in this veteran population.
It has been extensively documented that minority groups experience decreased health care access and worse health outcomes. 28-30 Considering the critical medical supply shortages, including personal protective equipment, ventilators, and even testing supplies, there is the potential for a resource access disparity by ethnicity.28-31 Because the VA does not depend on measures of wealth and privilege such as health insurance, there was no disparity noted in access to testing by race or ethnicity at the VAMC CLC. When considering the health outcome of viral load from the measured CT/CN value, the viral loads of African American patients and those of other ethnicities was not significantly different in this study.
Conclusions
This is the first study to bring up critical points including serial CT/CN value correlation in RT-PCR tests, demographic distributions demonstrating easy and equal access in a veteran nursing home to COVID-19 testing, and clinical laboratory signs related to disease pathophysiology. Unlike other populations who have undergone serial CT/CN monitoring, nursing homes represent a particularly vulnerable population who require measures to prevent the spread and mitigate outbreaks of COVID-19.2,4,5 Test measurements obtained such as the CT/CN value during routine clinical care can provide useful information for public health, epidemiologic, or clinical purposes with appropriate correlation to clinical and other laboratory parameters. This study demonstrates early intervention of serial testing of an outbreak in a veterans nursing home with CT/CN value correlation.
1. Chen T, Wu D, Chen H, et al. Clinical characteristics of 113 deceased patients with coronavirus disease 2019: retrospective study. BMJ. 2020;368:m1091. doi:10.1136/bmj.m1091
2. Tsan L, Davis C, Langberg R, et al. Prevalence of nursing home-associated infections in the Department of Veterans Affairs nursing home care units. Am J Infect Control. 2008;36(3):173-179. doi:10.1016/j.ajic.2007.06.008
3. Zhou F, Yu T, Du R, et al. Clinical course and risk factors for mortality of adult inpatients with COVID-19 in Wuhan, China: a retrospective cohort study. Lancet. 2020;395(10229):1054-1062. doi:10.1016/S0140-6736(20)30566-3
4. Arentz M, Yim E, Klaff L, et al. Characteristics and outcomes of 21 critically ill patients with COVID-19 in Washington State. JAMA. 2020;323(16):1612-1614. doi:10.1001/jama.2020.4326
5. McMichael TM, Currie DW, Clark S, et al. Public Health–Seattle and King County, EvergreenHealth, and CDC COVID-19 Investigation Team. Epidemiology of Covid-19 in a long-term care facility in King County, Washington. N Engl J Med. 2020;382(21):2005-2011. doi:10.1056/NEJMoa2005412
6. Childs A, Zullo AR, Joyce NR, et al. The burden of respiratory infections among older adults in long-term care: a systematic review. BMC Geriatr. 2019;19(1):210. doi:10.1186/s12877-019-1236-6
7. Eriksen HM, Iversen BG, Aavitsland PJ. Prevalence of nosocomial infections and use of antibiotics in long-term care facilities in Norway, 2002 and 2003. Hosp Infect. 2004;57(4):316-320. doi:10.1016/j.jhin.2004.03.028
8. Magleby R, Westblade LF, Trzebucki A, et al. Impact Severe acute respiratory syndrome coronavirus 2 viral load on risk of intubation and mortality among hospitalized patients with coronavirus disease 2019. Clin Infect Dis. 2021;73(11):e4197-e4205. doi:10.1093/cid/ciaa851
9. Buchan B, Hoff J, Gmehlin C, et al. Distribution of SARSCoV- 2 PCR cycle threshold values provide practical insight into overall and target-specific sensitivity among symptomatic patients. Am Clin Pathol. 2020;154:479-485. doi:10.1093/ajcp/aqaa133
10. He X, Lau EHY, Wu P, et al. Temporal dynamics in viral shedding and transmissibility of COVID-19. Nat Med. 2020;26(5):672-675. doi:10.1038/s41591-020-0869-5
11. Zou L, Ruan F, Huang M, et al. SARS-CoV-2 Viral load in upper respiratory specimens of infected patients. N Engl J Med. 2020;382(12):1177-1179. doi:10.1056/NEJMc2001737
12. Singanayagam A, Patel M, Charlett A, et al. Duration of infectiousness and correlation with RT-PCR cycle threshold values in cases of COVID-19, England, January to May 2020. Euro Surveill. 2020;25(32):2001483. doi:10.2807/1560-7917.ES.2020.25.32.2001483
13. Salvatore P, Dawson P, Wadhwa A, et al. Epidemiological correlates of PCR cycles threshold values in the detection of SARS-CoV-2. Clin Infect Dis. 2021;72(11):e761-e767. doi:10.1093/cid/ciaa1469
14. Kissler S, Fauver J, Mack C, et al. Viral dynamics of SARS-CoV-2 infection and the predictive value of repeat testing. medRxiv. 2020;10.21.20217042. doi:10.1101/2020.10.21.20217042 1
5. Escobar DJ, Lanzi M, Saberi P, et al. Mitigation of a COVID-19 outbreak in a nursing home through serial testing of residents and staff. Clin Infect Dis. 2021;72(9):e394- e396. doi:10.1093/cid/ciaa1021
16. Eibner C, Krull H, Brown KM, et al. Current and projected characteristics and unique health care needs of the patient population served by the Department of Veterans Affairs. Rand Health Q. 2016;5(4):13.
17. Agha Z, Lofgren RP, VanRuiswyk JV, Layde PM. Are patients at Veterans Affairs medical centers sicker? A comparative analysis of health status and medical resource use. Arch Intern Med. 2000;160(21):3252-3257. doi:10.1001/archinte.160.21.3252
18. Morgan RO, Teal CR, Reddy SG, Ford ME, Ashton CM. Measurement in Veterans Affairs Health Services Research: veterans as a special population. Health Serv Res. 2005;40(5 Pt 2):1573-1583. doi:10.1111/j.1475-6773.2005.00448.x 1
9. Xpert Xpress SARS-CoV-2. Instructions for use. Cepheid. 302-2562, Rev. C April 2020. Accessed January 7, 2021. https://www.fda.gov/media/136314/download
20. Abbott RealTime SARS-CoV-2. Instructions for use Abbott. 09N77-95. July 2020. Accessed January 7, 2021. https:// www.fda.gov/media/136258/download
21. Petersen JM, Dalal S, Jhala D. Successful implementation of SARS-CoV-2 testing in midst of pandemic with emphasis on all phases of testing. J Clin Pathol. 2021;74:273- 278. doi:10.1136/jclinpath-2020-207175
22. United States Census Bureau. Quick Facts: Philadelphia County, Pennsylvania. Accessed April 16, 2020. https://www .census.gov/quickfacts/philadelphiacountypennsylvania
23. Centers for Disease Control and Prevention. United States COVID-19 cases, deaths, and laboratory testing (NAATS) by state, territory, and jurisdiction. Accessed April 26, 2020. https://www.cdc.gov/coronavirus/2019-ncov/cases -updates/cases-in-us.html 2
4. Petersen J, Jhala D. Ethnicity, comorbid medical conditions, and SARS-CoV-2 test cycle thresholds in the veteran population [published online ahead of print, 2021 Jul 28]. J Racial Ethn Health Disparities. 2021;1-8. doi:10.1007/s40615-021-01114-4
25. Infectious Diseases Society of America, Association for Molecular Pathology. IDSA and AMP joint statement on the use of SARS-CoV-2 PCR cycle threshold (Ct) values for clinical decision-making. Accessed August 28, 2021. https://www.idsociety.org/globalassets/idsa/public-health /covid-19/idsa-amp-statement.pdf
26. Wang J, Ng CY, Brook RH. Response to COVID-19 in Taiwan: big data analysis, new technology, and proactive testing. JAMA. 2020;323(14):1341-1342. doi:10.1001/jama.2020.3151
27. Centers for Disease Control and Prevention. Overview of testing for SARS-CoV-2, the virus that causes COVID- 19. Accessed July 28, 2021. https://www.cdc.gov /coronavirus/2019-ncov/hcp/testing-overview.html
28. Zuvekas SH, Taliaferro GS. Pathways to access: health insurance, the health care delivery system, and racial/ethnic disparities, 1996-1999. Health Aff. 2003;22(2):139-153. doi:10.1377/hlthaff.22.2.139
29. Egede LE. Race, ethnicity, culture, and disparities in health care. J Gen Intern Med. 2006;21(6):667-669. doi:10.1111/j.1525-1497.2006.0512.x
30. Institute of Medicine (US) Committee on Understanding and Eliminating Racial and Ethnic Disparities in Health Care. Smedley BD, Stith AY, Nelson AR, eds. Unequal treatment: confronting racial and ethnic disparities in health care. National Academies Press; 2003. doi:10.17226/12875
31. Ranney ML, Griffeth V, Jha AK. Critical supply shortages – the need for ventilators and personal protective equipment during the Covid-19 Pandemic. N Engl J Med. 2020;382(18):e41. doi:10.1056/NEJMp2006141
COVID-19, caused by SARS-CoV-2, is more severe in individuals with underlying illnesses. Because complete social distancing might be more difficult in nursing homes and community living centers (CLCs), public health leaders and clinicians have been concerned about the epidemiology and disease course in nursing homes even before the COVID-19 pandemic.1-7 A report of a COVID-19 outbreak in a nursing home facility in King County, Washington, documented a 33.7% overall fatality rate for residents and 52.4% among the most critically ill.4,5 The experience at King County, Washington, shows that proactive steps to identify, monitor, and apply preventive control measures is important for future outbreaks.5
Reverse transcriptase polymerase chain reaction (RT-PCR) testing produces a cycle threshold (CT) or cycle number (CN) that correlates with viral load and infectiousness. 8-14 CT/CN represents the number of RT-PCR cycles required for the fluorescent signal to cross the detection threshold (exceed background level) and is inversely proportional to the viral load. Effectively, the higher the viral load, the lower the CT/ CN value (Figure 1). Tracking CT/CN values was not documented in the Washington nursing home outbreak. Reports of COVID- 19 testing in CLCs during outbreaks are sparse, and CT/CN values and demographic distribution of these veterans has not been reported.15 The CLC veteran population, with known higher vulnerability to infection and chronic diseases, is epidemiologically different from the general nursing home population.15-18 To address these literature gaps, we present the first report of COVID- 19 testing with CT/CN value correlations in the high-risk veteran CLC population.
Methods
A retrospective review of all COVID-19 CT/CN testing at the Corporal Michael J. Crescenz Veterans Affairs Medical Center (VAMC) CLC in Philadelphia, Pennsylvania, from March 28, 2020, to April 24, 2020, was performed with a US Department of Veterans Affairs (VA) Veterans Health Information System Architecture VistA/FileMan search. Only veteran residents were included in this review. Data collected included initial and serial test results, CT/CN on positive test results, test dates, testing platform used, demographic information (age, self-reported ethnicity, and sex), and clinical follow-up information. Health records were reviewed retrospectively to identify death, the first day after diagnosis with no documented symptoms, or hospitalization status.
RT-PCR testing was performed with the Abbott RealTime SARS-CoV-2 assay on the Abbott m2000 platform and the Xpert Xpress SARS-CoV-2 assay on the Cepheid Infinity platform. The Xpert Xpress assay gave 2 CT values for the E and N2 targets on positive samples.19 For this assay to indicate a positive specimen, amplification by RT-PCR of the N2 target or both the N2 and E target is required. The Xpert Xpress assay results as presumptive positive if only the E target amplified. This assay counts a maximum of 45 cycles. The Abbott RealTime SARS-CoV-2 assay gave 1 CN derived from the RNA-dependent RNA polymerase and N targets on positive samples.20 The Abbott assay on the m2000 counts a maximum of 37 cycles. The CT/CN value is the number of cycles required by RT-PCR for the fluorescence signal to cross a threshold value exceeding background level.19,20
Samples that are negative for COVID-19 by RT-PCR do not produce a CT/CN value. Although both instruments were used for RT-PCR, the precise CT/CN values are not interchangeable and CT/CN observations over time between the 2 instruments during the disease course would be based on CT/CN value movement (general upward or downward trend) rather than absolute CT/CN differences. Both assays have been approved by emergency use authorization as qualitative tests for the presence/absence of COVID-19. Although the CT/CN value is available to laboratory staff after test completion, the CT/CN value is not reported routinely in the patient health record. All veteran patients identified on the initial review from March 28, 2020, to April 24, 2020, had all serial COVID-19 testing recorded until November 10, 2020. The CN values at the limit of detection (LOD) for the Abbott m2000 platform from the initial validation study were reviewed for reference.21
Results
Of 80 patients, 25 (31%) were COVID-19 positive over the course of testing. The study population had a mean age of 73.5 years; 92% were aged > 60 years. The group was predominantly male (79 male vs 1 female). Among the 77 patients with a stated ethnicity, 39 (51%) were African American. In comparison, 43% of residents in Philadelphia County are African American (Table).22,23 Additionally, a previously published total COVID-19 tested population by ethnicity at the same regional VAMC revealed 46.8% of tested veteran patients were African American. 24 Three patients had no stated ethnicity. Among those who tested positive, 11 were African American patients, 12 were White patients, and 2 had no stated ethnicity. Four patients tested positive on their first test. The other 21 patients were positive on repeat testing. Interestingly, 6 patients had 1 initial negative test before a positive test, 6 patients had 2, 8 patients had 3, and 1 patient had 4 initial negative tests before a positive test result. Among the 25 positive patients, 22 were either positive within 10 days of the initial negative test result or initially positive (Figure 2). Three patients who tested positive after 10 days did so at 16, 20, and 21 days after the initial negative test result. Among the 25 positive patients, 23 had initial and serial testing from both the Abbott and Xpert Xpress assays. The remaining 2 positive patients had initial and serial testing from the Abbott assay exclusively.
Only positive COVID-19 results by RTPCR produced a CT/CN value. After disease resolution with a negative test, no CT/CN value was produced with the negative test result on either testing platform. Because repeat testing after the initial positive result took place no sooner than 10 days, we observed that the CT/CN value increased after the initial positive result until the disease resolved, and a negative result was obtained (eAppendix 1, available online at doi:10.12788/fp.0276). A t test comparing the initial CT/CN value to the value more than 10 days after the initial positive showed the CT/CN was statistically significantly higher (P < .05).
Prompt repeat testing after the initial test can show a decrease in the CT/CN value because of increasing viral load before the expected increase until disease resolution if the initial test caught the infection early. Twelve patients had a negative test result between 2 serial positive results. These negative test results occurred later, near the end of the disease course. Among the 12 patients with this positive-negativepositive CT/CN pattern, 7 were symptomatic and no longer had documented symptoms or hospitalization around the time of this positive-negative-positive pattern. Four of these individuals were asymptomatic during the entire infection course. One of the 12 patients with this pattern expired with the negative result occurring on day 27 of the disease in the context of rising CT/CN. One of these 12 patients only had a presumptive positive test result on the Cepheid because it detected only the E target with a CT value of 38.7. In 1 of the 12 patients, the negative test result occurred between 2 positive test results with CT/CN values < 20 (12.05 and 19.05 for the positive tests before and after the negative result, respectively). When the initial CT/CN values was separated based on ethnicity, the average CT/CN value for African Americans (23.3) was higher than for other ethnicities (19.9), although it did not reach statistical significance (P = .35).
Ten of the 25 patients testing positive were admitted to the hospital, including 1 admitted 15 days before diagnosis (patient 20) and 1 admitted 80 days after diagnosis (patient 7). Among these 10 patients, 6 were admitted to the intensive care unit, including patient 7. None of the patients were intubated. Three of the 10 admitted patients died (patients 7, 20, and 24). Patient 7 was a 79-year-old male with a history of dementia, cerebrovascular accident, hypertension, hyperlipidemia, and chronic kidney disease with symptoms of lethargy and refusal of oral intake when he was diagnosed with COVID-19. He was admitted 80 days after diagnosis for hyponatremia and acute renal failure, with death on day 87 recorded as complications from the earlier COVID-19 infection. Patient 20, an 89-year-old male with a history of dementia, chronic kidney disease, and hyperlipidemia, had been admitted with fever, cough, and leukocytosis 17 days before COVID-19 diagnosis. He continued to be symptomatic after diagnosis with development of hypotension, dehydration, and refusal of oral intake while on comfort measures/endof- life care and died 15 days after COVID- 19 infection diagnosis. Patient 24 was a 96-year-old male with history of heart failure, hypertension, coronary artery disease, prostate carcinoma, and dementia who developed a cough at the time of diagnosis; because of his underlying condition, he remained in the CLC on comfort care. His symptoms, including hypoxia, worsened until he died 7 days after diagnosis.
Among the 25 patients, 17 were symptomatic at the time of diagnosis; the 14 initially symptomatic patients who survived improved clinically and returned to baseline. Eight of the 25 patients were asymptomatic initially and 3 developed symptoms 2 to 5 days after diagnosis. Only 1 patient who remained asymptomatic was admitted for inability to adhere to quarantine at the CLC. Review of the health records of all surviving symptomatic patients showed symptom resolution with return to baseline that corresponds to an increasing CT/CN value. A 1-tailed t test comparing the initial CT/ CN at the time of diagnosis to the last CT/CN value for symptomatic patients who recovered revealed a statistically significant increase (P < .05). For the symptomatic, symptom resolution and hospital discharge took (if required) a mean 20 days (range, 7-46). Among those who were not hospitalized, symptoms resolved in 7 to 36 days (18 days). Among those requiring hospitalization at any time (excluding patients who died or were asymptomatic), symptom and hospitalization resolution took a mean 22 days (range, 10-46). Asymptomatic patients (patients 8, 10, 15, 16, and 25) also showed increasing CT/CN value during the infection course, although there was no correlation with the continued lack of symptoms.
During the initial validation of the Abbott m2000 instrument, an LOD study included concentrations of 1000, 500, 250, 100, 70, 60, and 50 virus copies/mL (eAppendix 2, available online at doi:10.12788/fp.0276).21 The average CN at 100 virus copies/mL—the manufacturer provided LOD in the instructions for use—was 25.74.20 At a concentration of one-half that (50 virus copies/mL), the average CN was 28.39.
Discussion
This is the first study in the English literature to track CT/CN values as part of serial testing of a veteran CLC. Widescale testing and repeat screening in the absence of symptoms of nursing home residents would identify those who are infected and allow providers to track viral load clearance.9-14 CT/CN values, when serially tracked during the infection course, appear to increase with illness resolution, consistent with earlier reports that CT/CN correlates with viral load.8-14 Serial CT/CN values that are high (> 25) and continue to increase with each test suggest progression toward disease resolution or viral RNA clearance.8-14 After symptom resolution, patients can have a persistent low level of viral shedding (corresponding to a high CT/CN value).10-14,25 Near the end of disease resolution, a negative serial RT-PCR sample test before a subsequent positive might be a promising clinical sign of near disease recovery. Once the viral load is low with a CT/CN significantly higher than 25, some specimens might result as negative but turn up positive on subsequent sampling with a high CT/CN value. This pattern, with attendant high CT/CN values for the positive results, are consistent with the known effect of viral load (ie, a low viral load correlates to a high CT/CN) and adequacy of specimen collection on CT/CN values.25 If the patient’s viral load is low, the sample collected might have a viral load at or near the testing platform’s LOD.
For Abbott m2000, the manufacturer provided LOD is 100 virus copies/mL, although the instrument was able to detect virus concentrations below that level during the initial validation.20 The actual LOD of the instrument at our institution is < 100 virus copies/mL. For the Cepheid Xpert Xpress SARS-CoV-2 assay, the manufacturer-provided LOD is 250 virus copies/mL.19 An LOD study including samples below the manufacturer-provided LOD was not part of the initial validation study for the Xpert Xpress assay. Nonetheless, the virus concentration of samples with very high CT values at or near the maximum CT value of 45 is expected to be at or near the platform’s actual LOD.
If the samples collected near the end of the patient’s disease course have viral loads near these low concentrations, the encouraging positive-negative-positive pattern with high CT/CN values might be a promising sign for viral clearance. On the other hand, a positive-negative-positive pattern in the setting of low CT/CN values before and after the negative test might indicate poor sampling for the negative specimen. The back-and-forth or positive-negative-positive pattern generally appears to indicate near resolution of the infection course, although clinical correlation is necessary to rule out inadequate sampling earlier in the disease course or prolonged viral RNA shedding.9-14 In all of the surviving symptomatic patients who showed the positive-negative-positive pattern, this sign occurred around or after symptom resolution. It also is important to consider that in some patients, SARS-CoV-2 RNA might remain detectable with increasing CT/CN after symptom resolution, and samples from these patients might not result positive. Therefore, CT/CN values cannot be interpreted without considering the clinical picture.25
Studies on infectiousness and virus culture from COVID-19 samples with CT/ CN correlation have shown that patients with high CT/CN at the end of their disease course might not be as infectious.9-14,25 Because 1 patient had a presumptive positive result after the negative result, this study shows that this positive-negative-positive pattern could include presumptive positive results. Also, in the setting of a recent positive result on the same testing platform, a patient with this pattern is presumed to be positive for COVID-19 RNA because of scant viral material.
Taiwan’s public health response to the outbreak illustrates the ability to mitigate an outbreak throughout a society.26 These actions could help blunt an outbreak within a civilian nursing home population.5 Mitigation within a veteran CLC population has been documented, but the study, which focused on mitigation, did not consider CT/CN values, demographic distribution, testing access of the studied population, or laboratory findings related to disease pathophysiology.15 A key ingredient in widescale, serial testing is the availability of a rapid turnaround from testing in-house that allowed identification within 24 hours instead of several days at a reference laboratory. 15 Rapid widescale testing would allow clinical teams to optimize the Triangle of Benefit of Widescale Timely Tests for CLC (Figure 3).15 Timely laboratory testing remains pivotal for CLC veteran residents to aid successful clinical triage and management. Reporting serial CT/CN values can provide additional information to clinicians about the disease course because CT/ CN correlates with viral load, which varies based on where the patient is in the disease course.9-14 CT/CN values carry significant prognostic value, particularly with respect to intubation and mortality.8
Limitations
Important limitations to our study include the use of 2 separate RT-PCR platforms. Using different RT-PCR platforms is common in clinical laboratories trying to take advantage of the unique characteristics of different platforms—for example, turnaround time vs high throughput— to manage COVID-19 testing workflow.25 However, the exact CT/CN values obtained from each platform might not translate to the other, and the general trend (CT/CN values are rising or falling across serial tests) rather than a single value could be useful for clinical correlation. Even when the same platform is used for the serial testing, CT/CN values can be affected by adequacy of specimen collection; therefore, clinical correlation and considering the trend in CT/CN values is necessary for interpretation.10-14,25 Because of the known trend in viral dynamics, a positive specimen collected with a high CT/CN followed by a subsequent (within 2 days) positive specimen collected with a low CT/CN might be compatible with early detection of COVID- 19 infection in the appropriate clinical context. 10-14 However, detection late in the infection course or even after the symptomatic disease resolved with prolonged viral shedding might show serial positive samples with increasing CT/CN values.10-14
Patients with prolonged viral shedding might not be infectious.27 Because of the clinical correlation required for interpretation and the other factors that might affect CT/CN values, recommendations advise against using CT/CN values in clinical practice at this time, although these recommendations could change with future research.25 Serial CT/CN values have the potential, if appropriately correlated with the clinical picture, to provide useful information, such as whether the viral load of the sample is relatively high or low and increasing or decreasing.
Veterans, as a population, are more susceptible to poor health outcomes and morbidity compared with similar civilian counterparts.2,14-16 Veteran CLC patients likely would experience worse outcomes with COVID-19, including more infections, expiration, and morbidity compared with similar general population nursing homes. Similar to what had been reported for the civilian population, a trend (high CT/CN values early in the disease course with repeat testing needed to detect all positives followed by lower CT/CN value to correlate with increased viral load and then increased CT/CN value as the infection resolved) also was observed in this veteran population.
It has been extensively documented that minority groups experience decreased health care access and worse health outcomes. 28-30 Considering the critical medical supply shortages, including personal protective equipment, ventilators, and even testing supplies, there is the potential for a resource access disparity by ethnicity.28-31 Because the VA does not depend on measures of wealth and privilege such as health insurance, there was no disparity noted in access to testing by race or ethnicity at the VAMC CLC. When considering the health outcome of viral load from the measured CT/CN value, the viral loads of African American patients and those of other ethnicities was not significantly different in this study.
Conclusions
This is the first study to bring up critical points including serial CT/CN value correlation in RT-PCR tests, demographic distributions demonstrating easy and equal access in a veteran nursing home to COVID-19 testing, and clinical laboratory signs related to disease pathophysiology. Unlike other populations who have undergone serial CT/CN monitoring, nursing homes represent a particularly vulnerable population who require measures to prevent the spread and mitigate outbreaks of COVID-19.2,4,5 Test measurements obtained such as the CT/CN value during routine clinical care can provide useful information for public health, epidemiologic, or clinical purposes with appropriate correlation to clinical and other laboratory parameters. This study demonstrates early intervention of serial testing of an outbreak in a veterans nursing home with CT/CN value correlation.
1. Chen T, Wu D, Chen H, et al. Clinical characteristics of 113 deceased patients with coronavirus disease 2019: retrospective study. BMJ. 2020;368:m1091. doi:10.1136/bmj.m1091
2. Tsan L, Davis C, Langberg R, et al. Prevalence of nursing home-associated infections in the Department of Veterans Affairs nursing home care units. Am J Infect Control. 2008;36(3):173-179. doi:10.1016/j.ajic.2007.06.008
3. Zhou F, Yu T, Du R, et al. Clinical course and risk factors for mortality of adult inpatients with COVID-19 in Wuhan, China: a retrospective cohort study. Lancet. 2020;395(10229):1054-1062. doi:10.1016/S0140-6736(20)30566-3
4. Arentz M, Yim E, Klaff L, et al. Characteristics and outcomes of 21 critically ill patients with COVID-19 in Washington State. JAMA. 2020;323(16):1612-1614. doi:10.1001/jama.2020.4326
5. McMichael TM, Currie DW, Clark S, et al. Public Health–Seattle and King County, EvergreenHealth, and CDC COVID-19 Investigation Team. Epidemiology of Covid-19 in a long-term care facility in King County, Washington. N Engl J Med. 2020;382(21):2005-2011. doi:10.1056/NEJMoa2005412
6. Childs A, Zullo AR, Joyce NR, et al. The burden of respiratory infections among older adults in long-term care: a systematic review. BMC Geriatr. 2019;19(1):210. doi:10.1186/s12877-019-1236-6
7. Eriksen HM, Iversen BG, Aavitsland PJ. Prevalence of nosocomial infections and use of antibiotics in long-term care facilities in Norway, 2002 and 2003. Hosp Infect. 2004;57(4):316-320. doi:10.1016/j.jhin.2004.03.028
8. Magleby R, Westblade LF, Trzebucki A, et al. Impact Severe acute respiratory syndrome coronavirus 2 viral load on risk of intubation and mortality among hospitalized patients with coronavirus disease 2019. Clin Infect Dis. 2021;73(11):e4197-e4205. doi:10.1093/cid/ciaa851
9. Buchan B, Hoff J, Gmehlin C, et al. Distribution of SARSCoV- 2 PCR cycle threshold values provide practical insight into overall and target-specific sensitivity among symptomatic patients. Am Clin Pathol. 2020;154:479-485. doi:10.1093/ajcp/aqaa133
10. He X, Lau EHY, Wu P, et al. Temporal dynamics in viral shedding and transmissibility of COVID-19. Nat Med. 2020;26(5):672-675. doi:10.1038/s41591-020-0869-5
11. Zou L, Ruan F, Huang M, et al. SARS-CoV-2 Viral load in upper respiratory specimens of infected patients. N Engl J Med. 2020;382(12):1177-1179. doi:10.1056/NEJMc2001737
12. Singanayagam A, Patel M, Charlett A, et al. Duration of infectiousness and correlation with RT-PCR cycle threshold values in cases of COVID-19, England, January to May 2020. Euro Surveill. 2020;25(32):2001483. doi:10.2807/1560-7917.ES.2020.25.32.2001483
13. Salvatore P, Dawson P, Wadhwa A, et al. Epidemiological correlates of PCR cycles threshold values in the detection of SARS-CoV-2. Clin Infect Dis. 2021;72(11):e761-e767. doi:10.1093/cid/ciaa1469
14. Kissler S, Fauver J, Mack C, et al. Viral dynamics of SARS-CoV-2 infection and the predictive value of repeat testing. medRxiv. 2020;10.21.20217042. doi:10.1101/2020.10.21.20217042 1
5. Escobar DJ, Lanzi M, Saberi P, et al. Mitigation of a COVID-19 outbreak in a nursing home through serial testing of residents and staff. Clin Infect Dis. 2021;72(9):e394- e396. doi:10.1093/cid/ciaa1021
16. Eibner C, Krull H, Brown KM, et al. Current and projected characteristics and unique health care needs of the patient population served by the Department of Veterans Affairs. Rand Health Q. 2016;5(4):13.
17. Agha Z, Lofgren RP, VanRuiswyk JV, Layde PM. Are patients at Veterans Affairs medical centers sicker? A comparative analysis of health status and medical resource use. Arch Intern Med. 2000;160(21):3252-3257. doi:10.1001/archinte.160.21.3252
18. Morgan RO, Teal CR, Reddy SG, Ford ME, Ashton CM. Measurement in Veterans Affairs Health Services Research: veterans as a special population. Health Serv Res. 2005;40(5 Pt 2):1573-1583. doi:10.1111/j.1475-6773.2005.00448.x 1
9. Xpert Xpress SARS-CoV-2. Instructions for use. Cepheid. 302-2562, Rev. C April 2020. Accessed January 7, 2021. https://www.fda.gov/media/136314/download
20. Abbott RealTime SARS-CoV-2. Instructions for use Abbott. 09N77-95. July 2020. Accessed January 7, 2021. https:// www.fda.gov/media/136258/download
21. Petersen JM, Dalal S, Jhala D. Successful implementation of SARS-CoV-2 testing in midst of pandemic with emphasis on all phases of testing. J Clin Pathol. 2021;74:273- 278. doi:10.1136/jclinpath-2020-207175
22. United States Census Bureau. Quick Facts: Philadelphia County, Pennsylvania. Accessed April 16, 2020. https://www .census.gov/quickfacts/philadelphiacountypennsylvania
23. Centers for Disease Control and Prevention. United States COVID-19 cases, deaths, and laboratory testing (NAATS) by state, territory, and jurisdiction. Accessed April 26, 2020. https://www.cdc.gov/coronavirus/2019-ncov/cases -updates/cases-in-us.html 2
4. Petersen J, Jhala D. Ethnicity, comorbid medical conditions, and SARS-CoV-2 test cycle thresholds in the veteran population [published online ahead of print, 2021 Jul 28]. J Racial Ethn Health Disparities. 2021;1-8. doi:10.1007/s40615-021-01114-4
25. Infectious Diseases Society of America, Association for Molecular Pathology. IDSA and AMP joint statement on the use of SARS-CoV-2 PCR cycle threshold (Ct) values for clinical decision-making. Accessed August 28, 2021. https://www.idsociety.org/globalassets/idsa/public-health /covid-19/idsa-amp-statement.pdf
26. Wang J, Ng CY, Brook RH. Response to COVID-19 in Taiwan: big data analysis, new technology, and proactive testing. JAMA. 2020;323(14):1341-1342. doi:10.1001/jama.2020.3151
27. Centers for Disease Control and Prevention. Overview of testing for SARS-CoV-2, the virus that causes COVID- 19. Accessed July 28, 2021. https://www.cdc.gov /coronavirus/2019-ncov/hcp/testing-overview.html
28. Zuvekas SH, Taliaferro GS. Pathways to access: health insurance, the health care delivery system, and racial/ethnic disparities, 1996-1999. Health Aff. 2003;22(2):139-153. doi:10.1377/hlthaff.22.2.139
29. Egede LE. Race, ethnicity, culture, and disparities in health care. J Gen Intern Med. 2006;21(6):667-669. doi:10.1111/j.1525-1497.2006.0512.x
30. Institute of Medicine (US) Committee on Understanding and Eliminating Racial and Ethnic Disparities in Health Care. Smedley BD, Stith AY, Nelson AR, eds. Unequal treatment: confronting racial and ethnic disparities in health care. National Academies Press; 2003. doi:10.17226/12875
31. Ranney ML, Griffeth V, Jha AK. Critical supply shortages – the need for ventilators and personal protective equipment during the Covid-19 Pandemic. N Engl J Med. 2020;382(18):e41. doi:10.1056/NEJMp2006141