User login
In 2017 there will be nearly 1.7 million new cancer cases diagnosed, and over 600,000 cancer deaths in the Unites States.1 A 2013 Institute of Medicine report highlighted problems with the current quality of cancer care, including high costs and fragmentation of care.2 Other national reports have called for improvements in the overall quality of care and for reducing costly and possibly avoidable use of health services such as emergency department (ED) visits.3-6 Reduction of avoidable ED visits is often cited as a pathway to reduce costs by avoiding unnecessary tests and treatments that occur in the ED and subsequent hospital admissions.7,8
ED crowding, long waits, and unpredictable treatment environments can also make an ED visit an unpleasant experience for the patient. ED visits during cancer treatment can be particularly troubling and present health concerns for patients who are immunocompromised. In particular, cancer patients in the ED have been found to experience delays in the administration of analgesics, antiemetics, or antibiotics.9
Few studies have examined ED use or its associated predictors among cancer patients. Reports to date that have described ED use have focused on different cancers, which makes comparisons across studies difficult.10 Moreover, the time frames of interest and the type of event after which ED use is evaluated (ie, diagnosis or treatment) are inconsistent in the existing literature.10 Some studies quantifying ED use excluded patients admitted to the hospital after an ED visit.11,12 Taken together, these studies do not provide a clear overview of the extent of ED use by cancer patients or the amount of cancer-related care provided by EDs.
Patterns of ED use among cancer patients derived from large and generalizable samples may help inform providers about true risk factors for ED use. In addition, prioritizing new interventions and focusing future research on groups of patients who are at higher risk for preventable ED use could also improve overall care. To address these issues, accurate estimates of ED use among cancer patients are required.
To our knowledge, this is the first study to describe ED use across a range of cancers in a large population-based sample and to consider the timing of ED visits in relation to initial diagnosis. The findings could provide benchmark comparison data to inform future efforts to identify the subset of possibly preventable ED visits and to design interventions to address preventable ED use.
Material and methods
Data source
California’s Office of Statewide Health Planning and Development (OSHPD) manages the patient discharge dataset (PDD) and the emergency department use (EDU) dataset, providing a high-quality source of information on inpatient and ED use in the state.13 A principal diagnosis and up to 24 secondary diagnoses are recorded in OSHPD datasets. The EDU dataset was used to identify treat-and-release ED visits, and the PDD was used to identify hospitalizations initiated in the ED. The California Cancer Registry (CCR) obtains demographic and diagnosis information for every new invasive cancer diagnosed in California, and data collected by the registry are considered to be complete.14 CCR-OSPHD-linked data provide high-quality health care use information for cancer patients in California.15,16 Using an encrypted version of the social security number called the record linkage number (RLN), we linked the CCR records to the corresponding OSHPD files from 2009-2010.
Institutional review board approval for this study was obtained from the University of California, Davis, Human Subjects Committee and the State of California Committee for the Protection of Human Subjects.
Analysis
ED visits. Visits were included if they occurred on or up to 365 days after the date of cancer diagnosis recorded in the CCR. The visits were coded in mutually exclusive groups as occurring within 30, 31-180, and 181-365 days of diagnosis. Subsequently, we flagged each person as having any ED visit (Yes/No) within 180 days and within 365 days of diagnosis, and we tallied the total number of visits occurring within these time frames for each person.
Cancer type. We used relevant site and histology codes to classify cancer type into 24 mutually exclusive categories using the Surveillance Epidemiology and End Result‘s International Classification of Diseases for Oncology, 3rd Edition (ICD-O-3) Recode Definitions17-19 (Suppl Figure 1).
Individual-level variables. Sociodemographic information for each person was collected from the CCR including gender, age, race/ethnicity, marital status, health insurance status, rural residence, survival time in months, neighborhood socio-economic (SES) status based on the Yang index, and the American Joint Committee on Cancer (AJCC) stage.20,21
Data analysis
Demographic information was analyzed for the cohort using descriptive statistics (frequencies, proportions, means, standard deviations, and ranges) and evaluated for correlations. Fewer than 20 observations had missing data and we removed those observations from our analyses on an item-specific basis.
We tabulated ED visits by cancer type and time from diagnosis and then collapsed visit-level data by RLN to determine the number of ED visits for each person in the sample. The number of days from diagnosis to first ED visit was also tabulated. The cohort was stratified by cancer type and cumulative rates of ED visits were tabulated for individuals with ED visits within 0-180 and 0-365 days from diagnosis. To test the robustness of the findings adjusting for confounding factors known to impact ED use, we used logistic regression to model any ED use (Yes/No) as a function of age, gender, race/ethnicity, cancer stage, insurance status, marital status, urban residence, and Yang SES. After model estimation, we used the method of recycled predictions controlling for the confounding variables to compute the marginal probabilities of ED use by cancer type.22 To adjust for the possible impact of survival on ED use, we performed sensitivity analyses and estimated predicted probabilities adjusting for survival. Separate analyses were performed first adjusting for whether the patient died during the course of each month after diagnosis and then adjusting for whether or not the patient died within 180 days of diagnosis. All analyses were conducted using Stata 13.1.23
Results
The CCR identified 222,087 adults with a new primary cancer diagnosis in 2009-2010. After excluding those with Stage 0 cancer (n = 21,154) and nonmelanoma skin cancer (n = 1,031), for whom data are inconsistently collected by CCR, a total of 199,872 individuals were included in the analytic sample. Of those patients (Table 1), most were white non-Hispanic (62%), women (51%), holders of private insurance (53%), married (56%), and urban residents (86%). Most were older than 50 years and had either Stage I or Stage II cancer. The most common cancer types were breast (17%), prostate (16%), lung (11%), and colon (9%; results not shown). In unadjusted comparisons, the incidence of ED use was significantly higher among those who were older, of non-Hispanic black race/ethnicity, uninsured, in the lowest SES group, widowed, or diagnosed with Stage IV cancer (Table 1).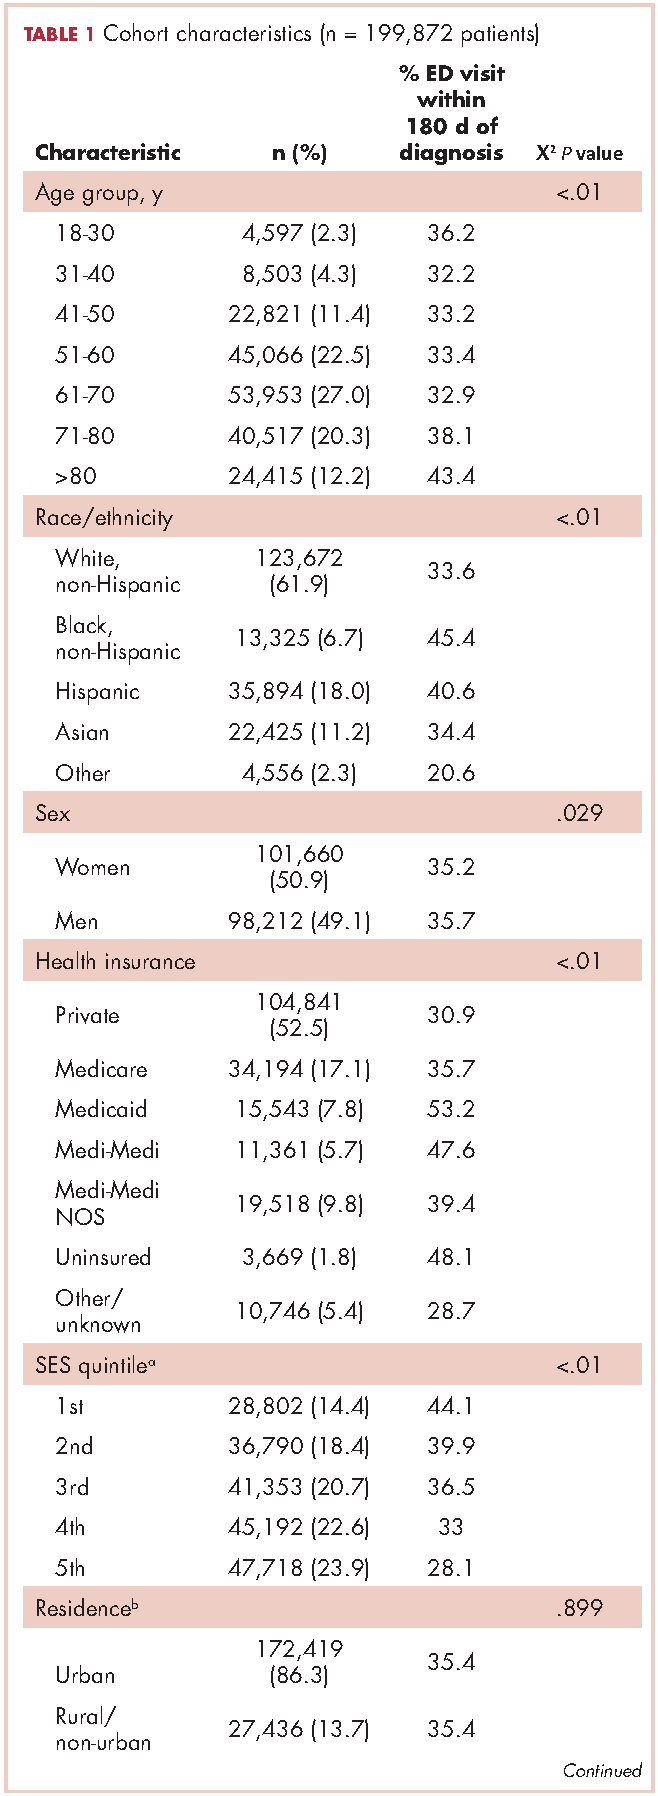
ED visits
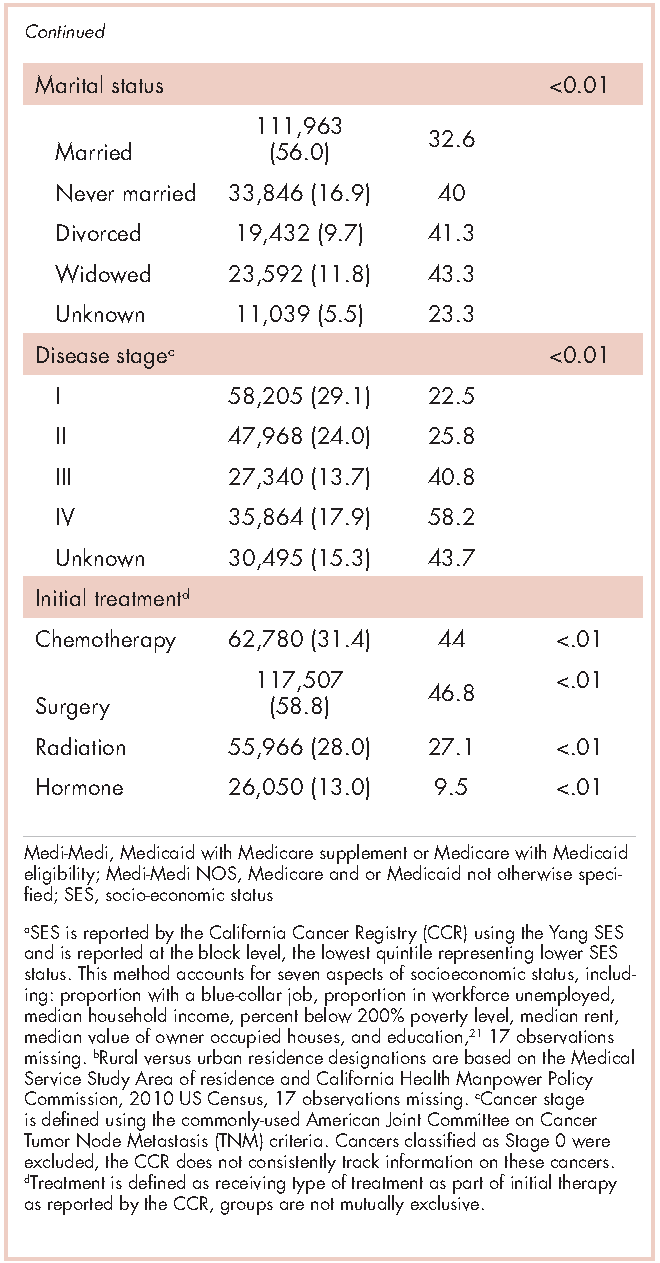
Within 365 days after initial cancer diagnosis, 87,025 cancer patients made a total of 197,886 ED visits (not shown in tables). Of those visits, 68% (n = 134,556) occurred within 180 days of diagnosis, with 22% (n = 43,535) occurring within the first 30 days and 46% (n = 91,027) occurring within 31-180 days after diagnosis (Figure). Given that most of the visits occurred within 180 days of diagnosis, we used that time frame in subsequent analyses. Among all ED visits within 180 days of diagnosis (Table 2), the largest proportions of visits were made by those with lung cancer (16%), breast cancer (11%), and colon cancer (10%).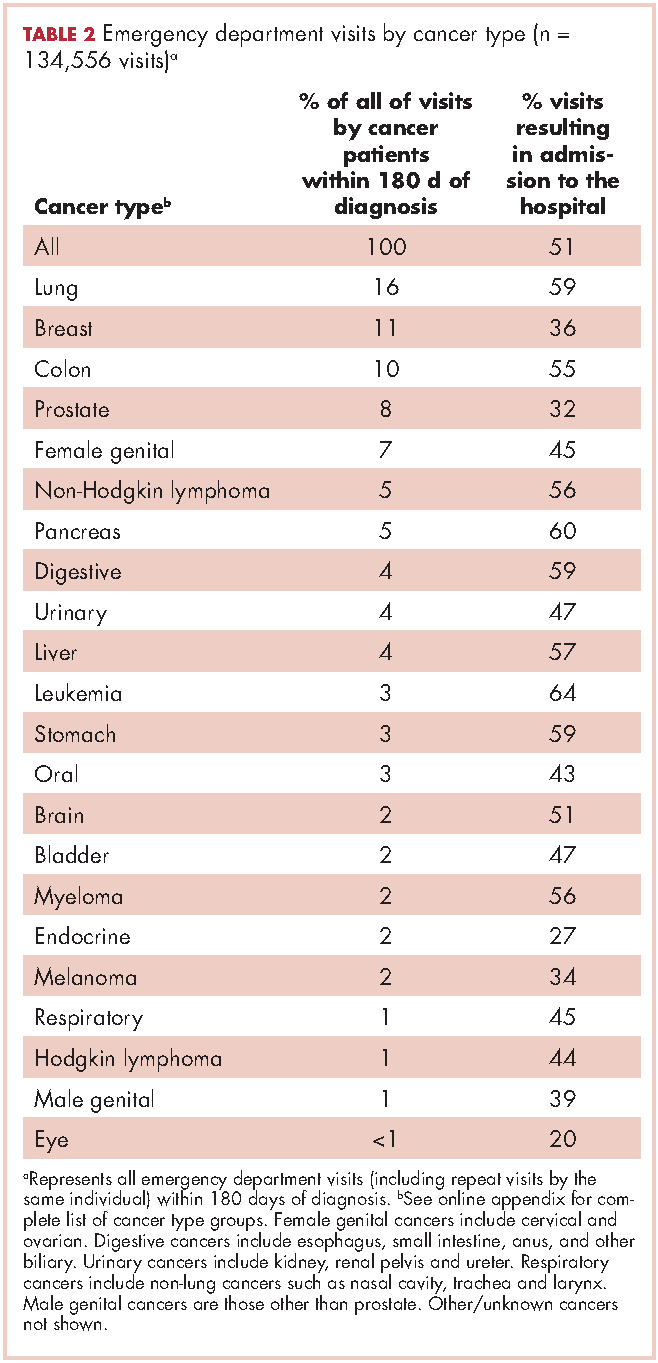
About 51% of visits resulted in admission to the hospital and 45% in discharge (Table 2). For some cancers (lung, colon, non-Hodgkin lymphoma, pancreatic, digestive, liver, stomach, leukemia, and myeloma) most of the visits resulted in admission to the hospital (Table 2). Among visits resulting in admission, the top three principal diagnoses were: septicemia (8%), cardiovascular problems (7%), and complications from surgery (5%) (not shown in tables). Among visits resulting in a discharge home, the three top principal diagnoses were abdominal pain (7%), cardiovascular problems (6%), and urinary, kidney, and bladder complaints other than a urinary tract infection (5%) (results not shown).
Individuals
The cumulative incidence of at least one ED visit was 35% (n = 70,813) within 180 days after diagnosis (Table 3). Visit rates varied by cancer type: individuals with pancreatic (62%), brain (60%), and lung (55%) cancers had the highest cumulative incidences of ED use within 180 days of diagnosis (Table 3). Those with melanoma (14%), prostate (17%), and eye (18%) cancers had the lowest cumulative incidences of ED visits (Table 3).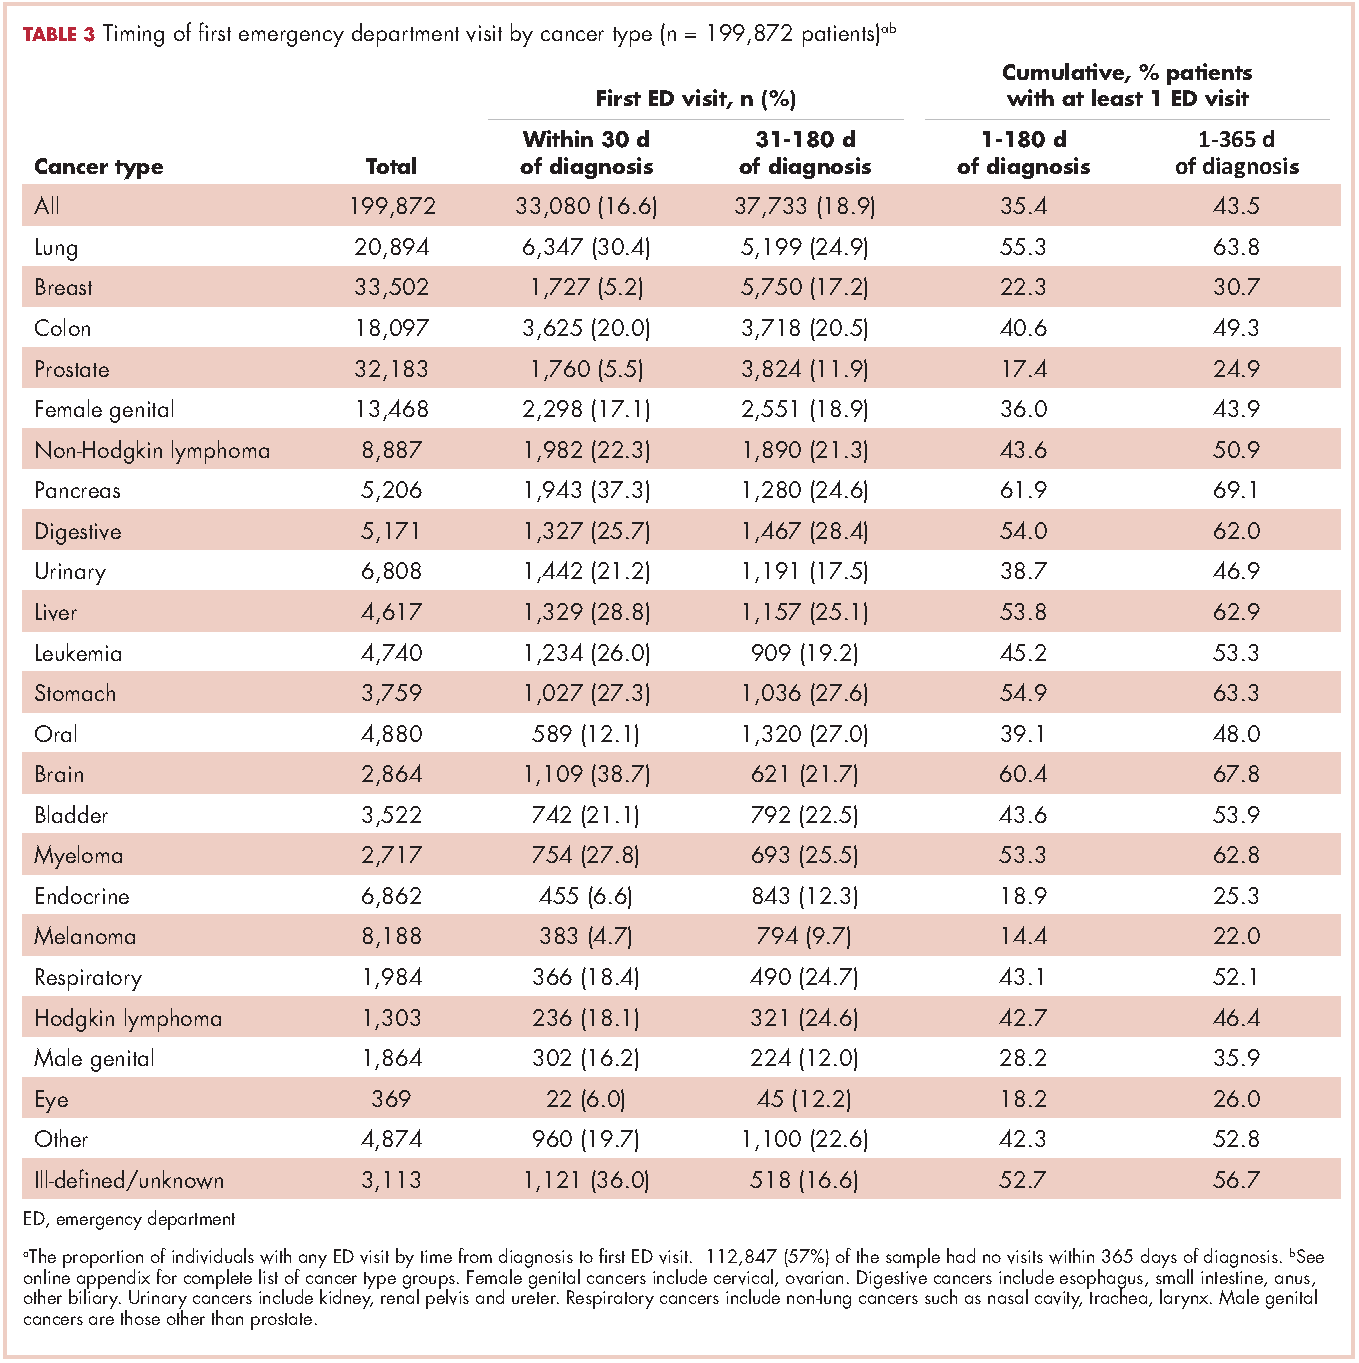
Recycled predictions from logistic regression models, accounting for potential confounding factors, yielded substantively similar results for the cumulative incidence of ED use across cancer types (Table 4). Results did not differ substantially after accounting for survival. Differences in the predicted probability of an ED visits adjusting for death within 180 days of diagnosis were noted to be 2% or greater from estimates reported in Table 4 for only four cancers. Estimates of having any ED visits for those with lung cancer decreased from 46% to 44% (95% CI: 43.0-44.4%), pancreatic cancer from 53% to 49% (95% CI: 48-51%), liver cancer from 51% to 47% (95% CI: 49-53%), and those with eye cancers increased from 20% to 22% (95% CI: 18-26%) (not shown in tables).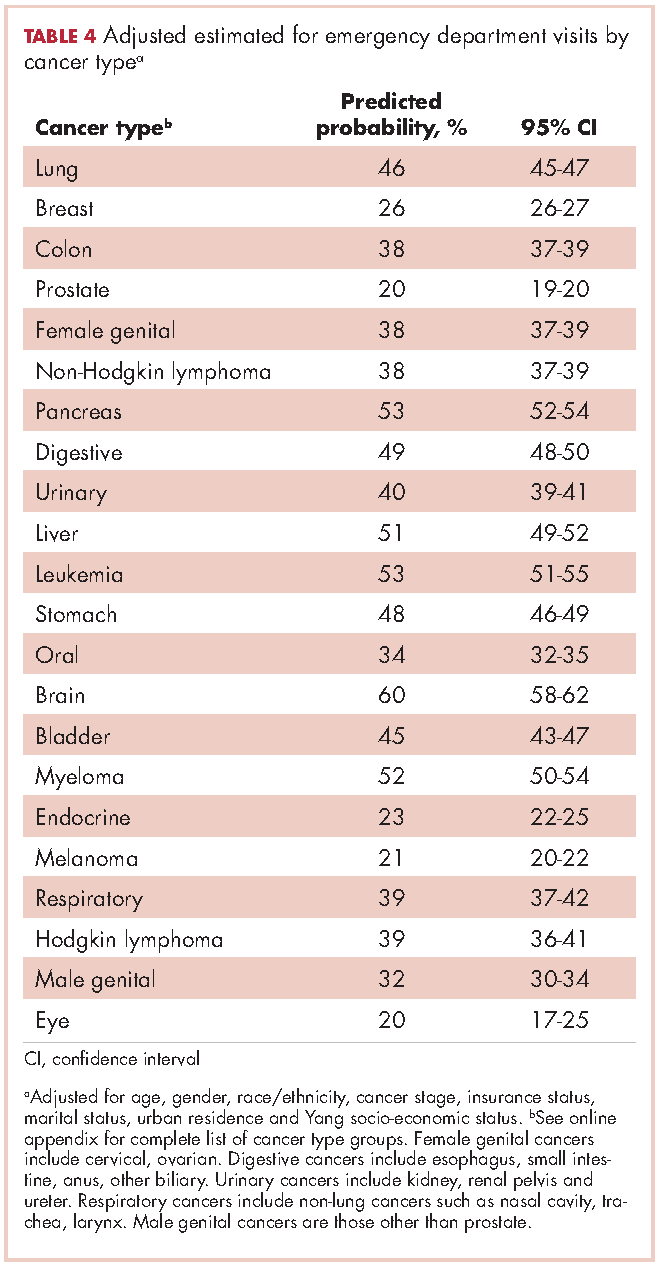
For patients with certain cancers (eg, lung, pancreas, leukemia) the proportion of individuals with an initial ED visit was highest in the first 30 days after diagnosis (Table 3). For individuals with other cancers (eg, breast, prostate, melanoma) the proportion of individuals with an initial ED visit increased by more than 5% during the 31-181–day time period. Those with the remaining cancers had less than 5% change in cumulative ED use between the two time periods.
The number of visits per person ranged from 0-44 during the first 180 days after diagnosis (results not shown in tables). Of all patients diagnosed with cancer, 20% (n = 39,429) had one ED visit, 8% (n = 16,238) had two visits, and 7% (n = 14,760) had three or more visits. Of those patients having at least one ED visit within 180 days of diagnosis, 44% (n = 31,080) had two or more visits and 21% (n = 14,760) had 3 or more visits.
Discussion
This study extends previous research by describing ED use for more than 20 cancer types by time from diagnosis in a large, heterogeneous and population-based sample of recently diagnosed adults in California. We found that 16% of newly diagnosed individuals with cancer used the ED within 30 days of diagnosis, 35% within 6 months of diagnosis, and 44% within 1 year of diagnosis. These findings suggest that ED use by cancer patients is more than double that of the US general population and is higher than previously estimated for cancer patients.10,24 In 2010, about 21% of the US population visited the ED, compared with 44% of cancer patients in the same time period.24 Although persons with greater medical need, such as those with cancer, inevitably require more health services, new approaches are needed to explore the extent to which some of these visits by cancer patients could be prevented by providing care in other settings.
Few studies have examined ED use by cancer patients, but previous findings suggest that 1%-12% of cancer patients use the ED within 30 days of diagnosis, and 15%-25% use the ED within a year of diagnosis.10,25,26 One study did report higher rates of ED use by cancer patients, but attributed the increased use to changes in Medicaid copayments.27 The finding that ED use is higher among cancer patients than previously considered is important for several reasons. First, high rates of ED use may reflect excessive fragmentation in cancer care, or patients’ inability to access providers when acute concerns arise. Furthermore, providers and policymakers may be particularly interested in populations with high ED use because reducing potentially preventable ED use is often cited as one of the goals of care coordination and alternative health care model programs.2,28,29
The number of newly diagnosed cancer patients with multiple ED visits is also substantial. We found 15% of recently diagnosed cancer patients had two or more ED visits within 180 days of diagnosis, compared with 8% of the general US population having two or more ED visits in all of 2010.24 Among cancer patients with at least one ED visit, 44% visited more than once. Repeat visits may represent worsening health status, continued unmet health needs, or new complications that might have been prevented or treated in other health care settings. In addition, there may be opportunities to identify cancer patients at risk for multiple visits at their initial ED visit. A better understanding of the reasons for ED visits and the factors driving unmet need – such as inadequate patient education, limited access to specialty services, or failure to admit a patient to resolve a problem appropriately (eg, pain, infection) – may help to identify which visits are potentially preventable. Ultimately, failure to adequately describe the number of cancer patients that visit the ED and the number of times they visit may result in a lost opportunity for improvement in care, the patient experience and cost reduction in cancer care.
The distinction between cancer types that account for the most ED visits and cancer types with the highest cumulative incidences of ED use is informative. For instance, lung cancer patients accounted for the largest number of ED visits and over half of those with lung cancer visited the ED within 180 days of diagnosis. However, although more than 60% of individuals with pancreatic cancer visited an ED within 180 days of diagnosis; they accounted for only 5% of all ED visits by cancer patients during the same time period. This in part reflects the relative frequency of these cancers. However, prostate cancer, which has a high incidence rate, represents about 8% of all ED visits by cancer patients, yet only 17% of all prostate cancer patients visit the ED within 180 days of diagnosis.
One approach to reduce the absolute number of ED visits by cancer patients would be to target the most frequent users of the ED such as lung, breast, prostate, and colon cancer patients. These cancers are the most common in the general population, so proportionate reduction in ED visits in these groups would have a large overall impact on ED use. Alternatively, patients with cancers that have high rates of ED use could be targeted with interventions to better address their needs. Additional studies of ED use among cancer patients, including understudied cancers, are needed to determine whether care provided in the ED could be provided in alternate clinical settings. Such research can also support training of emergency department staff to manage the full range of cancer-related conditions presenting to the ED.
Another approach to identifying potentially avoidable ED visits is to explore visits that result in admission to the hospital compared with those that result in discharge from the ED. In some circumstances, visits that result in discharge home may not have been true medical emergencies, and therefore might have been preventable. It is also true that even an acute problem requiring admission may have been preventable with timely outpatient management. While we found that 45% of visits ended in discharge home, over half of cancer patients who visit the ED are admitted to the hospital. This is higher than admission rates from the ED for the U.S. population overall (11%-15%),30-32and even higher than the estimated rate of individuals with chronic conditions, such as diabetes (42%), who visit the ED and then are subsequently admitted to the hospital.33
Relatively high rates of admissions may indicate that cancer patients seeking care in the ED require increased medical attention; however, it is possible that other explanations exist. For instance, ED physicians may be uncomfortable with complex cancer cases and may admit patients to be evaluated by a specialist. As such, it is possible that some of these admissions could have been appropriate for outpatient follow up. It is also possible that patients are referred to the ED for admission to the hospital. In these situations the ED visit may be entirely preventable through a direct admission process, although such processes are not available at all institutions and may vary by the admitting provider. For instance, if a hospitalist is overseeing the hospital stay, they may prefer the admission to occur through the ED, whereas a primary care provider or oncologist may be more likely to facilitate a direct admission. Future research could address the extent to which admissions from the ED may be avoidable by examining reasons for and length of admission following an ED visit. While this study found top reasons for admission (principal diagnosis) to be septicemia, cardiovascular complaints and complications from surgery, cumulatively these diagnosis accounted for less than 20% of admissions from the ED. Examining frequent diagnoses by cancer type will also provide insight into potentially avoidable ED use, which may vary by disease course and treatment regimen.
The distribution of days from diagnosis to the first ED visit also varied by cancer type. This variation is likely attributable, at least in part, to differences in condition-specific treatment regimens, severity of illness, and stage at diagnosis. For example, patients with ED visits within 30 days of diagnosis may be those with advanced stage cancers who are at higher risk of complications, or they may be visiting the ED for post-surgical problems. Likewise, individuals who incur visits during later time periods may be undergoing longer treatment regimens. Further research is warranted to explore site-specific predictors of ED use and high-risk periods, accounting for cancer treatment and the timing of treatments.
In summary, ED use among cancer patients is substantial and higher than previously reported. Most ED visits occur within the first 180 days after diagnosis, suggesting focus on the first 30 days after hospital discharge may be misguided. Time frames for ED measurement in future research should be selected with careful attention to cancer-specific periods within which most ED use occurs and the outcomes of interest. Furthermore, better models identifying cancer-specific predictors of ED use, which account for treatment and comorbidities, will facilitate the development of interventions focused on high-risk segments of this population. Research is needed to explore cancer-specific reasons for ED visits and which ED admission diagnoses may be potentially preventable.
Limitations
The limitations of this study include those common to use of administrative and registry data and the CCR and OSHPD data in particular. While CCR data are known to be complete with respect to demographic and cancer information, treatment data is less robust and specific treatment dates are not available.14,34 As a result, we were unable to analyze ED use in relation to receipt of outpatient treatment. As we included all ED visits on or up to a year after the day of diagnosis, it is possible that our analysis includes diagnoses that occurred in conjunction with an ED visits. However, it is unlikely a reporting hospital would report a cancer diagnosis to the CCR without a corresponding hospital admission. Therefore, we assume such cases to be rare.
Lastly, California had lower prevalence of health insurance coverage and higher market penetration by health maintenance organizations, relative to the national average, which may limit the generalizability of the results to other states.35 At the same time, CCR-OSHPD linked data offer the advantage of providing complete data to enumerate ED visits among patients whether they were discharged home or subsequently admitted to hospital.
1. American Cancer Society. Facts & Figures 2017. https://www.cancer.org/research/cancer-facts-statistics/all-cancer-facts-figures/cancer-facts-figures-2017.html. Published 2017. Accessed March 16, 2017.
2. Levit L, Balogh E, Nass S, Ganz PA. Delivering high-quality cancer care: charting a new course for a system in crisis. https://www.nap.edu/read/18359/chapter/1. Published 2013. Accessed March 16, 2017.
3. Readmissions Reduction Program (HRRP). CMS website. https://www.cms.gov/medicare/medicare-fee-for-service-payment/acuteinpatientpps/readmissions-reduction-program.html. Updated April 8, 2016. Accessed March 16, 2017.
4. Erikson C, Salsberg E, Forte G, Bruinooge S, Goldstein M. Future supply and demand for oncologists: challenges to assuring access to oncology services. J Clin Oncol. 2007;3(2):79-86.
5. Guadagnolo B, Dohan D, Raich P. Metrics for evaluating patient navigation during cancer diagnosis and treatment: crafting a policy-relevant research agenda for patient navigation in cancer care. Cancer. 2011;117(15 Suppl):3565-3574.
6. Medicare Patient Access to Cancer Treatment Act of 2013, H.R.2869, 113th Cong.(2013). https://www.congress.gov/bill/113th-congress/house-bill/2869/text?format=txt. Introduced July 31, 2013; latest action, referred to the Subcommittee on Health, August 2, 2013. Accessed March 16, 2017.
7. Smulowitz P, Honigman L, Landon B. A novel approach to identifying targets for cost reduction in the emergency department. Ann Emerg Med. 2013;61(3):293-300.
8. Agrawal S, Conway P. Integrating emergency care into a patient- and outcome-centered health care system. Ann Emerg Med. 2013;61(3):301-302.
9. Swenson K, Rose M, Ritz L, Murray CL, Adlis S. Recognition and evaluation of oncology-related symptoms in the emergency department. Ann Emerg Med.1995;26(1):12-17.
10. Lash R, Bell J, Reed S, et al. A systematic review of emergency department use among cancer patients. Cancer Nurs. 2017;40(2):135-144.
11. Sanoff H, Carpenter W, Freburger J, et al. Comparison of adverse events during 5-fluorouracil versus 5-fluorouracil/oxaliplatin adjuvant chemotherapy for stage III colon cancer: a population-based analysis. Cancer. 2012;118(17):4309-4320.
12. Hansen D, Fox J, Gross C, Bruun J. Hospital readmissions and emergency department visits following laparoscopic and open colon resection for cancer. Dis Colon Rectum. 2013;56(9):1053-1061.
13. Office of Statewide Health Planning and Development. Hospital Data Products. http://www.oshpd.ca.gov/HID/DataFlow/HospData.html. Last updated September 6, 2016. Accessed March 16, 2017.
14. California Cancer Registry. Overview. http://www.ccrcal.org/Inside_CCR/About_Us.shtml. Published 2009. Accessed April 15, 2015.
15. Patel M, Ma Y, Mitchell B, Rhoads K. How do differences in treatment impact racial and ethnic disparities in acute myeloid leukemia? Cancer Epidemiol Biomarkers Prev. 2015;24(2):344-349.
16. Parikh-Patel A, White R, Allen M, Cress R. Risk of cancer among rheumatoid arthritis patients in California. Cancer Causes Control. 2009;20(6):1001-1010.
17. National Cancer Institute: Surveillance, Epidemiology and End Results Program. Site recode ICD-O-3/WHO 2008 definition. https://seer.cancer.gov/siterecode/icdo3_dwhoheme/. Published 2008. Accessed March 16, 2017.
18. Washington State Cancer Registry. Cancer Codes Used in Reports. https://fortress. wa.gov/doh/wscr/WSCR/CancerCode.mvc/CancerCode. Data updated, January 2016; report updated, March 2016. Accessed March 16, 2017.
19. National Cancer Institute: Surveillance, Epidemiology and End Results Program. ICD-O-3 SEER Site/Histology Validation List. https://seer.cancer.gov/icd-o-3/. Published 2012, updated September 2015. Accessed March 16, 2017.
20. American Joint Committee on Cancer. What is Cancer Staging? https://cancerstaging.org/references-tools/Pages/What-is-Cancer-Staging.aspx. Published 2010. Accessed March 16, 2017.
21. Yang J S, Harrati A, Clarke C, Keegan T, Gomez S. Cancer Prevention Institute of California. Developing an area based socioeconomic measures from American Community Survey data. http://www.cpic.org/files/PDF/Research_Files/Reports/CPIC_ACS_SES_Index_Documentation_3-102014.pdf. Published March 10, 2014. Accessed March 16, 2017.
22. Basu A, Rathouz P. Estimating marginal and incremental effects on health outcomes using flexible link and variance function models. Biostatistics. 2005;6(1):93-109.
23. Stata Statistical Software [computer program]. Version 13 College Station, TX: StataCorp LP. 2013.
24. National Center for Health Statistics. Health, United States, 2013 – with a special feature on prescription drugs. https://www.cdc.gov/nchs/data/hus/hus13.pdf. Updated May 2014. Accessed March 16, 2017.
25. Goyal R, Wheeler S, Kohler R, et al. Health care utilization from chemotherapy-related adverse events among low-income breast cancer patients: effect of enrollment in a medical home program. N C Med J. 2014;75(4):231-238.
26. Hassett M, O’Malley A, Pakes J, Newhouse J, Earle C. Frequency and cost of chemotherapy-related serious adverse effects in a population sample of women with breast cancer. J Natl Cancer Inst. 2006;98(16):1108-1117.
27. Subramanian S. Impact of Medicaid copayments on patients with cancer: lessons for Medicaid expansion under health reform. Med Care. 2011;49(9):842-847.
28. Coyle Y, Miller A, Paulson R. Model for the cost-efficient delivery of continuous quality cancer care: a hospital and private-practice collaboration. Proc (Bayl Univ Med Cent). 2013;26(2):95-99.
29. Agency for Healthcare Research and Quality. 2011 National Healthcare Disparities Report. https://archive.ahrq.gov/research/findings/nhqrdr/nhdr11/index.html. Last reviewed October 2014. Accessed March 16, 2017.
30. Healthcare Cost and Utilization Project. Introduction to the HCUP Nationwide Emergency Department Sample (NEDS) 2010. https://www.hcup-us.ahrq.gov/db/nation/neds/NEDS_Introduction_2010.jsp. Issued November 2012, updated November 2015. Accessed March 16, 2017.
31. Healthcare Cost and Utilization Project. Introduction to the HCUP Nationwide Emergency Department Sample (NEDS) 2013. https://www.hcup-us.ahrq.gov/db/nation/neds/NEDS_Introduction_2013.jsp. Published November 2015. Accessed March 16, 2017.
32. Weiss AJ, Wier LM, Stocks C, Blanchard J. Overview of emergency department visits in the United States, 2011. Statistical Brief #174. https://www.hcup-us.ahrq.gov/reports/statbriefs/sb174-Emergency-Department-Visits-Overview.pdf. Published June 2014. Accessed March 16, 2017.
33. Washington R, Andrews R, Mutter, R. Emergency department visits for adults with diabetes, 2010. Statistical Brief #167. https://www.hcup-us.ahrq.gov/reports/statbriefs/sb167.jsp. Published November 2013. Accessed March 16, 2017.
34. Penberthy L, Petkov V, McClish D, et al. The value of billing data from oncology practice to supplement treatment information for cancer surveillance. Journal of registry management. 2014;41(2):57-64.
35. National Center for Health Statistics. Health, United States, 2014 – with a special feature on adults aged 55-64. https://www.cdc.gov/nchs/data/hus/hus14.pdf. Published May 2015. Accessed March 16, 2017.
In 2017 there will be nearly 1.7 million new cancer cases diagnosed, and over 600,000 cancer deaths in the Unites States.1 A 2013 Institute of Medicine report highlighted problems with the current quality of cancer care, including high costs and fragmentation of care.2 Other national reports have called for improvements in the overall quality of care and for reducing costly and possibly avoidable use of health services such as emergency department (ED) visits.3-6 Reduction of avoidable ED visits is often cited as a pathway to reduce costs by avoiding unnecessary tests and treatments that occur in the ED and subsequent hospital admissions.7,8
ED crowding, long waits, and unpredictable treatment environments can also make an ED visit an unpleasant experience for the patient. ED visits during cancer treatment can be particularly troubling and present health concerns for patients who are immunocompromised. In particular, cancer patients in the ED have been found to experience delays in the administration of analgesics, antiemetics, or antibiotics.9
Few studies have examined ED use or its associated predictors among cancer patients. Reports to date that have described ED use have focused on different cancers, which makes comparisons across studies difficult.10 Moreover, the time frames of interest and the type of event after which ED use is evaluated (ie, diagnosis or treatment) are inconsistent in the existing literature.10 Some studies quantifying ED use excluded patients admitted to the hospital after an ED visit.11,12 Taken together, these studies do not provide a clear overview of the extent of ED use by cancer patients or the amount of cancer-related care provided by EDs.
Patterns of ED use among cancer patients derived from large and generalizable samples may help inform providers about true risk factors for ED use. In addition, prioritizing new interventions and focusing future research on groups of patients who are at higher risk for preventable ED use could also improve overall care. To address these issues, accurate estimates of ED use among cancer patients are required.
To our knowledge, this is the first study to describe ED use across a range of cancers in a large population-based sample and to consider the timing of ED visits in relation to initial diagnosis. The findings could provide benchmark comparison data to inform future efforts to identify the subset of possibly preventable ED visits and to design interventions to address preventable ED use.
Material and methods
Data source
California’s Office of Statewide Health Planning and Development (OSHPD) manages the patient discharge dataset (PDD) and the emergency department use (EDU) dataset, providing a high-quality source of information on inpatient and ED use in the state.13 A principal diagnosis and up to 24 secondary diagnoses are recorded in OSHPD datasets. The EDU dataset was used to identify treat-and-release ED visits, and the PDD was used to identify hospitalizations initiated in the ED. The California Cancer Registry (CCR) obtains demographic and diagnosis information for every new invasive cancer diagnosed in California, and data collected by the registry are considered to be complete.14 CCR-OSPHD-linked data provide high-quality health care use information for cancer patients in California.15,16 Using an encrypted version of the social security number called the record linkage number (RLN), we linked the CCR records to the corresponding OSHPD files from 2009-2010.
Institutional review board approval for this study was obtained from the University of California, Davis, Human Subjects Committee and the State of California Committee for the Protection of Human Subjects.
Analysis
ED visits. Visits were included if they occurred on or up to 365 days after the date of cancer diagnosis recorded in the CCR. The visits were coded in mutually exclusive groups as occurring within 30, 31-180, and 181-365 days of diagnosis. Subsequently, we flagged each person as having any ED visit (Yes/No) within 180 days and within 365 days of diagnosis, and we tallied the total number of visits occurring within these time frames for each person.
Cancer type. We used relevant site and histology codes to classify cancer type into 24 mutually exclusive categories using the Surveillance Epidemiology and End Result‘s International Classification of Diseases for Oncology, 3rd Edition (ICD-O-3) Recode Definitions17-19 (Suppl Figure 1).
Individual-level variables. Sociodemographic information for each person was collected from the CCR including gender, age, race/ethnicity, marital status, health insurance status, rural residence, survival time in months, neighborhood socio-economic (SES) status based on the Yang index, and the American Joint Committee on Cancer (AJCC) stage.20,21
Data analysis
Demographic information was analyzed for the cohort using descriptive statistics (frequencies, proportions, means, standard deviations, and ranges) and evaluated for correlations. Fewer than 20 observations had missing data and we removed those observations from our analyses on an item-specific basis.
We tabulated ED visits by cancer type and time from diagnosis and then collapsed visit-level data by RLN to determine the number of ED visits for each person in the sample. The number of days from diagnosis to first ED visit was also tabulated. The cohort was stratified by cancer type and cumulative rates of ED visits were tabulated for individuals with ED visits within 0-180 and 0-365 days from diagnosis. To test the robustness of the findings adjusting for confounding factors known to impact ED use, we used logistic regression to model any ED use (Yes/No) as a function of age, gender, race/ethnicity, cancer stage, insurance status, marital status, urban residence, and Yang SES. After model estimation, we used the method of recycled predictions controlling for the confounding variables to compute the marginal probabilities of ED use by cancer type.22 To adjust for the possible impact of survival on ED use, we performed sensitivity analyses and estimated predicted probabilities adjusting for survival. Separate analyses were performed first adjusting for whether the patient died during the course of each month after diagnosis and then adjusting for whether or not the patient died within 180 days of diagnosis. All analyses were conducted using Stata 13.1.23
Results
The CCR identified 222,087 adults with a new primary cancer diagnosis in 2009-2010. After excluding those with Stage 0 cancer (n = 21,154) and nonmelanoma skin cancer (n = 1,031), for whom data are inconsistently collected by CCR, a total of 199,872 individuals were included in the analytic sample. Of those patients (Table 1), most were white non-Hispanic (62%), women (51%), holders of private insurance (53%), married (56%), and urban residents (86%). Most were older than 50 years and had either Stage I or Stage II cancer. The most common cancer types were breast (17%), prostate (16%), lung (11%), and colon (9%; results not shown). In unadjusted comparisons, the incidence of ED use was significantly higher among those who were older, of non-Hispanic black race/ethnicity, uninsured, in the lowest SES group, widowed, or diagnosed with Stage IV cancer (Table 1).
ED visits
Within 365 days after initial cancer diagnosis, 87,025 cancer patients made a total of 197,886 ED visits (not shown in tables). Of those visits, 68% (n = 134,556) occurred within 180 days of diagnosis, with 22% (n = 43,535) occurring within the first 30 days and 46% (n = 91,027) occurring within 31-180 days after diagnosis (Figure). Given that most of the visits occurred within 180 days of diagnosis, we used that time frame in subsequent analyses. Among all ED visits within 180 days of diagnosis (Table 2), the largest proportions of visits were made by those with lung cancer (16%), breast cancer (11%), and colon cancer (10%).
About 51% of visits resulted in admission to the hospital and 45% in discharge (Table 2). For some cancers (lung, colon, non-Hodgkin lymphoma, pancreatic, digestive, liver, stomach, leukemia, and myeloma) most of the visits resulted in admission to the hospital (Table 2). Among visits resulting in admission, the top three principal diagnoses were: septicemia (8%), cardiovascular problems (7%), and complications from surgery (5%) (not shown in tables). Among visits resulting in a discharge home, the three top principal diagnoses were abdominal pain (7%), cardiovascular problems (6%), and urinary, kidney, and bladder complaints other than a urinary tract infection (5%) (results not shown).
Individuals
The cumulative incidence of at least one ED visit was 35% (n = 70,813) within 180 days after diagnosis (Table 3). Visit rates varied by cancer type: individuals with pancreatic (62%), brain (60%), and lung (55%) cancers had the highest cumulative incidences of ED use within 180 days of diagnosis (Table 3). Those with melanoma (14%), prostate (17%), and eye (18%) cancers had the lowest cumulative incidences of ED visits (Table 3).
Recycled predictions from logistic regression models, accounting for potential confounding factors, yielded substantively similar results for the cumulative incidence of ED use across cancer types (Table 4). Results did not differ substantially after accounting for survival. Differences in the predicted probability of an ED visits adjusting for death within 180 days of diagnosis were noted to be 2% or greater from estimates reported in Table 4 for only four cancers. Estimates of having any ED visits for those with lung cancer decreased from 46% to 44% (95% CI: 43.0-44.4%), pancreatic cancer from 53% to 49% (95% CI: 48-51%), liver cancer from 51% to 47% (95% CI: 49-53%), and those with eye cancers increased from 20% to 22% (95% CI: 18-26%) (not shown in tables).
For patients with certain cancers (eg, lung, pancreas, leukemia) the proportion of individuals with an initial ED visit was highest in the first 30 days after diagnosis (Table 3). For individuals with other cancers (eg, breast, prostate, melanoma) the proportion of individuals with an initial ED visit increased by more than 5% during the 31-181–day time period. Those with the remaining cancers had less than 5% change in cumulative ED use between the two time periods.
The number of visits per person ranged from 0-44 during the first 180 days after diagnosis (results not shown in tables). Of all patients diagnosed with cancer, 20% (n = 39,429) had one ED visit, 8% (n = 16,238) had two visits, and 7% (n = 14,760) had three or more visits. Of those patients having at least one ED visit within 180 days of diagnosis, 44% (n = 31,080) had two or more visits and 21% (n = 14,760) had 3 or more visits.
Discussion
This study extends previous research by describing ED use for more than 20 cancer types by time from diagnosis in a large, heterogeneous and population-based sample of recently diagnosed adults in California. We found that 16% of newly diagnosed individuals with cancer used the ED within 30 days of diagnosis, 35% within 6 months of diagnosis, and 44% within 1 year of diagnosis. These findings suggest that ED use by cancer patients is more than double that of the US general population and is higher than previously estimated for cancer patients.10,24 In 2010, about 21% of the US population visited the ED, compared with 44% of cancer patients in the same time period.24 Although persons with greater medical need, such as those with cancer, inevitably require more health services, new approaches are needed to explore the extent to which some of these visits by cancer patients could be prevented by providing care in other settings.
Few studies have examined ED use by cancer patients, but previous findings suggest that 1%-12% of cancer patients use the ED within 30 days of diagnosis, and 15%-25% use the ED within a year of diagnosis.10,25,26 One study did report higher rates of ED use by cancer patients, but attributed the increased use to changes in Medicaid copayments.27 The finding that ED use is higher among cancer patients than previously considered is important for several reasons. First, high rates of ED use may reflect excessive fragmentation in cancer care, or patients’ inability to access providers when acute concerns arise. Furthermore, providers and policymakers may be particularly interested in populations with high ED use because reducing potentially preventable ED use is often cited as one of the goals of care coordination and alternative health care model programs.2,28,29
The number of newly diagnosed cancer patients with multiple ED visits is also substantial. We found 15% of recently diagnosed cancer patients had two or more ED visits within 180 days of diagnosis, compared with 8% of the general US population having two or more ED visits in all of 2010.24 Among cancer patients with at least one ED visit, 44% visited more than once. Repeat visits may represent worsening health status, continued unmet health needs, or new complications that might have been prevented or treated in other health care settings. In addition, there may be opportunities to identify cancer patients at risk for multiple visits at their initial ED visit. A better understanding of the reasons for ED visits and the factors driving unmet need – such as inadequate patient education, limited access to specialty services, or failure to admit a patient to resolve a problem appropriately (eg, pain, infection) – may help to identify which visits are potentially preventable. Ultimately, failure to adequately describe the number of cancer patients that visit the ED and the number of times they visit may result in a lost opportunity for improvement in care, the patient experience and cost reduction in cancer care.
The distinction between cancer types that account for the most ED visits and cancer types with the highest cumulative incidences of ED use is informative. For instance, lung cancer patients accounted for the largest number of ED visits and over half of those with lung cancer visited the ED within 180 days of diagnosis. However, although more than 60% of individuals with pancreatic cancer visited an ED within 180 days of diagnosis; they accounted for only 5% of all ED visits by cancer patients during the same time period. This in part reflects the relative frequency of these cancers. However, prostate cancer, which has a high incidence rate, represents about 8% of all ED visits by cancer patients, yet only 17% of all prostate cancer patients visit the ED within 180 days of diagnosis.
One approach to reduce the absolute number of ED visits by cancer patients would be to target the most frequent users of the ED such as lung, breast, prostate, and colon cancer patients. These cancers are the most common in the general population, so proportionate reduction in ED visits in these groups would have a large overall impact on ED use. Alternatively, patients with cancers that have high rates of ED use could be targeted with interventions to better address their needs. Additional studies of ED use among cancer patients, including understudied cancers, are needed to determine whether care provided in the ED could be provided in alternate clinical settings. Such research can also support training of emergency department staff to manage the full range of cancer-related conditions presenting to the ED.
Another approach to identifying potentially avoidable ED visits is to explore visits that result in admission to the hospital compared with those that result in discharge from the ED. In some circumstances, visits that result in discharge home may not have been true medical emergencies, and therefore might have been preventable. It is also true that even an acute problem requiring admission may have been preventable with timely outpatient management. While we found that 45% of visits ended in discharge home, over half of cancer patients who visit the ED are admitted to the hospital. This is higher than admission rates from the ED for the U.S. population overall (11%-15%),30-32and even higher than the estimated rate of individuals with chronic conditions, such as diabetes (42%), who visit the ED and then are subsequently admitted to the hospital.33
Relatively high rates of admissions may indicate that cancer patients seeking care in the ED require increased medical attention; however, it is possible that other explanations exist. For instance, ED physicians may be uncomfortable with complex cancer cases and may admit patients to be evaluated by a specialist. As such, it is possible that some of these admissions could have been appropriate for outpatient follow up. It is also possible that patients are referred to the ED for admission to the hospital. In these situations the ED visit may be entirely preventable through a direct admission process, although such processes are not available at all institutions and may vary by the admitting provider. For instance, if a hospitalist is overseeing the hospital stay, they may prefer the admission to occur through the ED, whereas a primary care provider or oncologist may be more likely to facilitate a direct admission. Future research could address the extent to which admissions from the ED may be avoidable by examining reasons for and length of admission following an ED visit. While this study found top reasons for admission (principal diagnosis) to be septicemia, cardiovascular complaints and complications from surgery, cumulatively these diagnosis accounted for less than 20% of admissions from the ED. Examining frequent diagnoses by cancer type will also provide insight into potentially avoidable ED use, which may vary by disease course and treatment regimen.
The distribution of days from diagnosis to the first ED visit also varied by cancer type. This variation is likely attributable, at least in part, to differences in condition-specific treatment regimens, severity of illness, and stage at diagnosis. For example, patients with ED visits within 30 days of diagnosis may be those with advanced stage cancers who are at higher risk of complications, or they may be visiting the ED for post-surgical problems. Likewise, individuals who incur visits during later time periods may be undergoing longer treatment regimens. Further research is warranted to explore site-specific predictors of ED use and high-risk periods, accounting for cancer treatment and the timing of treatments.
In summary, ED use among cancer patients is substantial and higher than previously reported. Most ED visits occur within the first 180 days after diagnosis, suggesting focus on the first 30 days after hospital discharge may be misguided. Time frames for ED measurement in future research should be selected with careful attention to cancer-specific periods within which most ED use occurs and the outcomes of interest. Furthermore, better models identifying cancer-specific predictors of ED use, which account for treatment and comorbidities, will facilitate the development of interventions focused on high-risk segments of this population. Research is needed to explore cancer-specific reasons for ED visits and which ED admission diagnoses may be potentially preventable.
Limitations
The limitations of this study include those common to use of administrative and registry data and the CCR and OSHPD data in particular. While CCR data are known to be complete with respect to demographic and cancer information, treatment data is less robust and specific treatment dates are not available.14,34 As a result, we were unable to analyze ED use in relation to receipt of outpatient treatment. As we included all ED visits on or up to a year after the day of diagnosis, it is possible that our analysis includes diagnoses that occurred in conjunction with an ED visits. However, it is unlikely a reporting hospital would report a cancer diagnosis to the CCR without a corresponding hospital admission. Therefore, we assume such cases to be rare.
Lastly, California had lower prevalence of health insurance coverage and higher market penetration by health maintenance organizations, relative to the national average, which may limit the generalizability of the results to other states.35 At the same time, CCR-OSHPD linked data offer the advantage of providing complete data to enumerate ED visits among patients whether they were discharged home or subsequently admitted to hospital.
1. American Cancer Society. Facts & Figures 2017. https://www.cancer.org/research/cancer-facts-statistics/all-cancer-facts-figures/cancer-facts-figures-2017.html. Published 2017. Accessed March 16, 2017.
2. Levit L, Balogh E, Nass S, Ganz PA. Delivering high-quality cancer care: charting a new course for a system in crisis. https://www.nap.edu/read/18359/chapter/1. Published 2013. Accessed March 16, 2017.
3. Readmissions Reduction Program (HRRP). CMS website. https://www.cms.gov/medicare/medicare-fee-for-service-payment/acuteinpatientpps/readmissions-reduction-program.html. Updated April 8, 2016. Accessed March 16, 2017.
4. Erikson C, Salsberg E, Forte G, Bruinooge S, Goldstein M. Future supply and demand for oncologists: challenges to assuring access to oncology services. J Clin Oncol. 2007;3(2):79-86.
5. Guadagnolo B, Dohan D, Raich P. Metrics for evaluating patient navigation during cancer diagnosis and treatment: crafting a policy-relevant research agenda for patient navigation in cancer care. Cancer. 2011;117(15 Suppl):3565-3574.
6. Medicare Patient Access to Cancer Treatment Act of 2013, H.R.2869, 113th Cong.(2013). https://www.congress.gov/bill/113th-congress/house-bill/2869/text?format=txt. Introduced July 31, 2013; latest action, referred to the Subcommittee on Health, August 2, 2013. Accessed March 16, 2017.
7. Smulowitz P, Honigman L, Landon B. A novel approach to identifying targets for cost reduction in the emergency department. Ann Emerg Med. 2013;61(3):293-300.
8. Agrawal S, Conway P. Integrating emergency care into a patient- and outcome-centered health care system. Ann Emerg Med. 2013;61(3):301-302.
9. Swenson K, Rose M, Ritz L, Murray CL, Adlis S. Recognition and evaluation of oncology-related symptoms in the emergency department. Ann Emerg Med.1995;26(1):12-17.
10. Lash R, Bell J, Reed S, et al. A systematic review of emergency department use among cancer patients. Cancer Nurs. 2017;40(2):135-144.
11. Sanoff H, Carpenter W, Freburger J, et al. Comparison of adverse events during 5-fluorouracil versus 5-fluorouracil/oxaliplatin adjuvant chemotherapy for stage III colon cancer: a population-based analysis. Cancer. 2012;118(17):4309-4320.
12. Hansen D, Fox J, Gross C, Bruun J. Hospital readmissions and emergency department visits following laparoscopic and open colon resection for cancer. Dis Colon Rectum. 2013;56(9):1053-1061.
13. Office of Statewide Health Planning and Development. Hospital Data Products. http://www.oshpd.ca.gov/HID/DataFlow/HospData.html. Last updated September 6, 2016. Accessed March 16, 2017.
14. California Cancer Registry. Overview. http://www.ccrcal.org/Inside_CCR/About_Us.shtml. Published 2009. Accessed April 15, 2015.
15. Patel M, Ma Y, Mitchell B, Rhoads K. How do differences in treatment impact racial and ethnic disparities in acute myeloid leukemia? Cancer Epidemiol Biomarkers Prev. 2015;24(2):344-349.
16. Parikh-Patel A, White R, Allen M, Cress R. Risk of cancer among rheumatoid arthritis patients in California. Cancer Causes Control. 2009;20(6):1001-1010.
17. National Cancer Institute: Surveillance, Epidemiology and End Results Program. Site recode ICD-O-3/WHO 2008 definition. https://seer.cancer.gov/siterecode/icdo3_dwhoheme/. Published 2008. Accessed March 16, 2017.
18. Washington State Cancer Registry. Cancer Codes Used in Reports. https://fortress. wa.gov/doh/wscr/WSCR/CancerCode.mvc/CancerCode. Data updated, January 2016; report updated, March 2016. Accessed March 16, 2017.
19. National Cancer Institute: Surveillance, Epidemiology and End Results Program. ICD-O-3 SEER Site/Histology Validation List. https://seer.cancer.gov/icd-o-3/. Published 2012, updated September 2015. Accessed March 16, 2017.
20. American Joint Committee on Cancer. What is Cancer Staging? https://cancerstaging.org/references-tools/Pages/What-is-Cancer-Staging.aspx. Published 2010. Accessed March 16, 2017.
21. Yang J S, Harrati A, Clarke C, Keegan T, Gomez S. Cancer Prevention Institute of California. Developing an area based socioeconomic measures from American Community Survey data. http://www.cpic.org/files/PDF/Research_Files/Reports/CPIC_ACS_SES_Index_Documentation_3-102014.pdf. Published March 10, 2014. Accessed March 16, 2017.
22. Basu A, Rathouz P. Estimating marginal and incremental effects on health outcomes using flexible link and variance function models. Biostatistics. 2005;6(1):93-109.
23. Stata Statistical Software [computer program]. Version 13 College Station, TX: StataCorp LP. 2013.
24. National Center for Health Statistics. Health, United States, 2013 – with a special feature on prescription drugs. https://www.cdc.gov/nchs/data/hus/hus13.pdf. Updated May 2014. Accessed March 16, 2017.
25. Goyal R, Wheeler S, Kohler R, et al. Health care utilization from chemotherapy-related adverse events among low-income breast cancer patients: effect of enrollment in a medical home program. N C Med J. 2014;75(4):231-238.
26. Hassett M, O’Malley A, Pakes J, Newhouse J, Earle C. Frequency and cost of chemotherapy-related serious adverse effects in a population sample of women with breast cancer. J Natl Cancer Inst. 2006;98(16):1108-1117.
27. Subramanian S. Impact of Medicaid copayments on patients with cancer: lessons for Medicaid expansion under health reform. Med Care. 2011;49(9):842-847.
28. Coyle Y, Miller A, Paulson R. Model for the cost-efficient delivery of continuous quality cancer care: a hospital and private-practice collaboration. Proc (Bayl Univ Med Cent). 2013;26(2):95-99.
29. Agency for Healthcare Research and Quality. 2011 National Healthcare Disparities Report. https://archive.ahrq.gov/research/findings/nhqrdr/nhdr11/index.html. Last reviewed October 2014. Accessed March 16, 2017.
30. Healthcare Cost and Utilization Project. Introduction to the HCUP Nationwide Emergency Department Sample (NEDS) 2010. https://www.hcup-us.ahrq.gov/db/nation/neds/NEDS_Introduction_2010.jsp. Issued November 2012, updated November 2015. Accessed March 16, 2017.
31. Healthcare Cost and Utilization Project. Introduction to the HCUP Nationwide Emergency Department Sample (NEDS) 2013. https://www.hcup-us.ahrq.gov/db/nation/neds/NEDS_Introduction_2013.jsp. Published November 2015. Accessed March 16, 2017.
32. Weiss AJ, Wier LM, Stocks C, Blanchard J. Overview of emergency department visits in the United States, 2011. Statistical Brief #174. https://www.hcup-us.ahrq.gov/reports/statbriefs/sb174-Emergency-Department-Visits-Overview.pdf. Published June 2014. Accessed March 16, 2017.
33. Washington R, Andrews R, Mutter, R. Emergency department visits for adults with diabetes, 2010. Statistical Brief #167. https://www.hcup-us.ahrq.gov/reports/statbriefs/sb167.jsp. Published November 2013. Accessed March 16, 2017.
34. Penberthy L, Petkov V, McClish D, et al. The value of billing data from oncology practice to supplement treatment information for cancer surveillance. Journal of registry management. 2014;41(2):57-64.
35. National Center for Health Statistics. Health, United States, 2014 – with a special feature on adults aged 55-64. https://www.cdc.gov/nchs/data/hus/hus14.pdf. Published May 2015. Accessed March 16, 2017.