User login
Patient flow throughout the hospital has been shown to be adversely affected by discharge delays.1 When hospitals are operating at peak capacity, these delays impact throughput, length of stay (LOS), and cost of care and block patients from the emergency department (ED), postanesthesia recovery unit (PACU), or home awaiting inpatient beds.2-5 As patients wait in locations not ideal for inpatient care, they may suffer from adverse events and poor satisfaction.3,6 Several studies have analyzed discharge timing as it relates to ED boarding of admitted patients and demonstrated that early discharges (EDCs) can impact boarding times.7-9 A number of recent improvement efforts directed at moving discharges earlier in the day have been published.10-15 However, these improvements are often targeted at specific units or teams within a larger hospital setting and only one is in the pediatric setting.
Lucile Packard Children’s Hospital Stanford (LPCHS) is a 311-bed quaternary care academic women and children’s hospital in Northern California. As our organization expanded, the demand for hospital beds often exceeded capacity. The challenge of overall demand was regularly compounded by a mismatch in bed availability timing – bed demand is early in the day and bed availability is later. This mismatch results in delays for admitted patients waiting in the ED and PACU. Organization leaders identified increasing early discharges (EDCs) as one initiative to contribute to improved patient flow.
Our organization aimed to increase the number of discharges before 11
METHODS
Setting
We focused our EDC interventions on the 87 acute care beds at LPCHS. All patients discharged from these beds were included in the study. We excluded patients discharged from intensive care, maternity, and nursery. Acute care includes five units, one focused on hematology/oncology (Unit A), one focused on cardiology (Unit B), and the others with a surgical and medical pediatric patient mix (Units C, D, and E). Although physician teams have primary units, due to unit size, patients on teams other than cardiology and hematology/oncology are often spread across multiple units wherever there is a bed (including Units A and B). Most of the frontline care physicians are residents supervised by attendings; however, a minority of patients are cared for by nurse practitioners (NPs) or physician assistants (PAs).
Improvement Team
In early 2015, we formed a multidisciplinary group inclusive of a case manager, frontline nurses, nurse management, pediatric residents, and hospitalist physicians with support from performance improvement. We periodically included physician leaders from other specialties to help initiate changes within their own clinical areas. Our group used Lean A3 thinking16 to gather information about the current state, formulate the problem statement, analyze the problem, and consider interventions implemented in three Plan–Do-Check-Act (PDCA) cycles. The A3 is a structured tool to analyze problems before jumping to solutions and communicate with stakeholders. We interviewed leaders, nurses, residents, case managers, etc. and observed work processes around discharge. We met weekly to follow data, assess results of interventions, and problem solve.
Barriers and Interventions
The first barrier we identified and addressed was poor identification and shared team mental model of potential EDC patients and lack of preparation when an EDC was identified. In intervention one starting May 2015, charge nurses on Units C, D, and E were each asked to identify one EDC for the following day. The identified patient was discussed at the previously existing afternoon daily unit huddle17 attended by nurse management, case management, and hospitalist leaders. Following the huddle, the resident, NP, or PA responsible for the patient was paged regarding the EDC plan and tasked with medication reconciliation and discharge paperwork. Others were asked to address their specific area of patient care for discharge (eg, case manager–supplies, nursing–education). The patient was identified on the unit white board with a yellow magnet (use of a visual control18), so that all would be aware of the EDC. An e-mail was sent to case management, nurse leaders, and patient placement coordinators regarding the planned EDCs. Finally, the EDCs were discussed during regularly scheduled huddles throughout the evening and into the next day.17
Despite this first intervention, we noted that progress toward increased EDCs was slow. Thus, we spent approximately seven days (spread over one month) further observing the work processes.19 Over five days, we asked each unit’s charge nurse every hour which patients were waiting to be discharged and the primary reason for waiting. From this information, we created a pareto chart demonstrating that rounds were the highest contributor to waiting (Appendix A). Thus, our second intervention was a daily physician morning huddle that the four nonsurgical physician teams (excluding cardiology, hematology/oncology) implemented one team at a time between November 2015 and February 2016. At the huddle, previously identified EDCs (located on any of the five units) were confirmed and preparatory work was completed (inclusive of the discharge order) before rounds. Further, the attending and resident physicians were to see the patient before or at the start of rounds.
Our working group still observed slow EDC improvement and sought feedback from all providers. EDC was described as “extra” work, apart from routine practices and culture. In addition, our interventions had not addressed most discharges on Units A and B. Consequently, our third intervention in February 2016 aimed to recognize and incentivize teams, units, and individuals for EDC successes. Units and/or physician teams that met 25% of EDCs the previous week were acknowledged through hospital-wide screensavers and certificates of appreciation signed by the Chief Nursing Officer. Units and/or physician teams that met 25% of EDC the previous month were acknowledged with a trophy. Residents received coffee cards for each EDC (though not without controversy among the improvement group as we acknowledged that all providers contributed to EDCs). Finally, weekly, we shared an EDC dashboard displaying unit, team, and organization performance at the hospital-wide leader huddle. We also e-mailed the dashboard regularly to division chiefs, medical directors, and nursing leaders.
Measures
Our primary outcome was percentage of EDCs (based on the time the patient left the room) across acute care. Secondary outcome measures were median wait times for an inpatient bed from the ED (time bed requested to the time patient left the ED) and the average PACU wait time (time the patient is ready to leave the PACU to time the patient left the PACU) per admitted patient. We also assessed balancing measures, including discharge satisfaction, seven-day readmission rates, and LOS. We obtained the mean discharge satisfaction score from the organization’s Press Ganey survey results across acute care (the three discharge questions’ mean – “degree … you felt ready to have your child discharged,” “speed of discharge process …,” and “instructions… to care for your child…”). We obtained seven-day readmission rates from acute care discharges using the hospital’s regularly reported data. We assessed patient characteristics, including sex, age, case mix index (CMI; >2 vs <2), insurance type (nongovernment vs government), day of discharge (weekend vs weekday), and LOS from those patients categorized as inpatients. Complete patient characteristics were not available for observation (InterQual® criteria) status patients.
Analysis
We used descriptive statistics to describe the inpatient population characteristics by analyzing differences when EDC did and did not occur using chi-square and the Mann–Whitney U tests. Patients with missing data were removed from analyses that incorporated patient factors.
To assess our primary outcome, we used an interrupted time series analysis assessing the percentage of EDC in the total population before any intervention (May 2015) and after the last intervention (March 2016). We used the Durbin–Watson statistic to assess autocorrelation of errors in our regression models. As we had only patient characteristics for the inpatient population, we repeated the analysis including only inpatients and accounting for patient factors significantly associated with EDC.
As units and physician teams had differential exposure to the interventions, we performed a subanalysis (using interrupted time series) creating groups based on the combination of interventions to which a patient’s discharge was exposed (based on unit and physician team at discharge). Patient discharges from group 1 (medical patients on Units C, D, and E) were exposed to all three interventions, group 2 patient discharges (medical patients on Units A and B) were exposed to interventions 2 and 3, group 3 (cardiology, hematology/oncology, surgical patients on Units A and B) were exposed to intervention 3, and group 4 (surgical, cardiology, hematology/oncology patients on Units C, D, and E) were exposed to interventions 1 and 3 (Figure 1). Interrupted time series models were fit using the R Statistical Software Package.20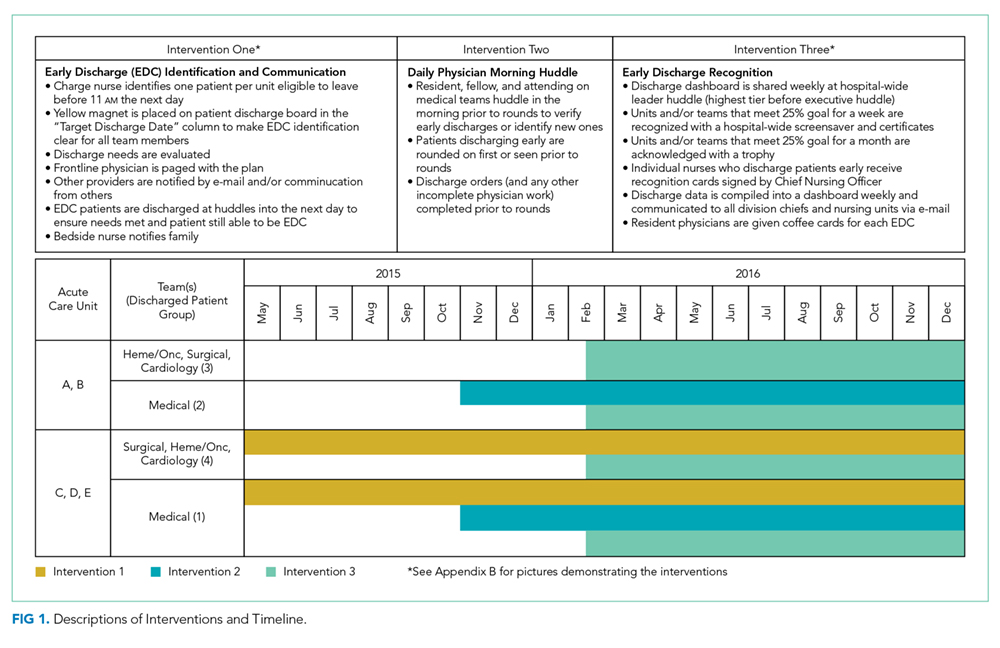
Because of seasonal variation in admissions, we compared secondary outcomes and balancing measures over similar time frames in the calendar year (January to September 2015 vs January to September 2016) using the Mann–Whitney U test and the unpaired t-test, respectively.
The project’s primary purpose was to implement a practice to improve the quality of care, and therefore, the Stanford Institutional Review Board determined it to be nonresearch.
RESULTS
There were 16,175 discharges on acute care from January 2014 through December 2016. Across all acute care units, EDCs increased from an average of 8.8% before the start of interventions (May 2015) to 15.8% after all interventions (February 2016). From the estimated trend in the preintervention period, there was a jump of 3.9% to the start of the postintervention trend (P = .02; Figure 2). Furthermore, there was an increase of 0.48% (95% CI 0.15-0.82%; P < .01) per month in the trend of the slope between the pre- and postintervention. The autocorrelation function and the Durbin–Watson test did not show evidence of autocorrelation (P = .85). Lack of evidence for autocorrelation in this and each of our subsequent fitted models led to excluding an autocorrelation parameter from our models.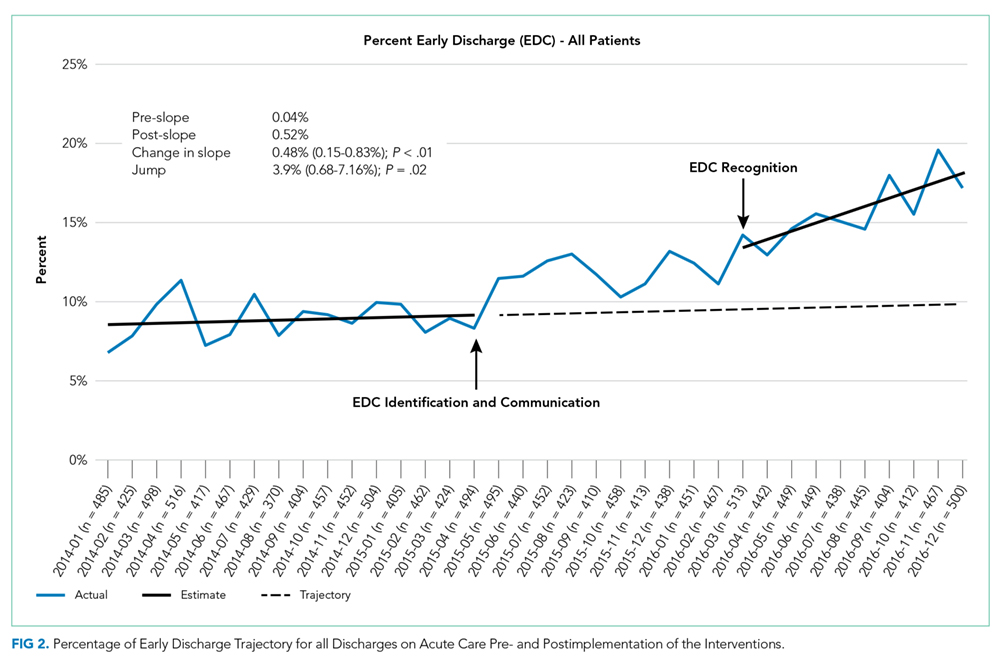
From 16,175 discharges, 1,764 (11%) were assigned to observation status. Among inpatients (14,411), patients with missing values (CMI, insurance status) were also excluded (n = 66, 0.5%). Among the remaining 14,345 inpatients, 54% were males, 50% were government-insured, and 1,645 (11.5%) were discharged early. The average age was 8.5 years, the average LOS was seven days, and the median CMI was 2.2. Children who were younger, had shorter LOS, CMI <2, and nongovernment insurance were more likely to be discharged early (P < .01 for all). For each of these variables, F-tests were performed to determine whether there was a statistically significant reduction in variation by adding the variable to our initial model. None of the variables alone or in combination led to a statistically significant reduction in variation. Including these factors in the interrupted time series did not change the significance of the results (jump at postintervention start 3.6%, 95% CI 0.7%-7.2%; P = .02, slope increased by 0.59% per month, 95% CI 0.29-0.89%; P < .01).
In the subgroup analysis, we did not account for patient factors as they did not change the results in the analysis of total population. Though each group had a greater percentage of EDCs in the postintervention period, the changes in slopes and jumps were primarily nonsignificant (Figure 3). Only the change in slope in group 4 was significant (1.1%, 95% CI 0.3-1.9%; P = .01).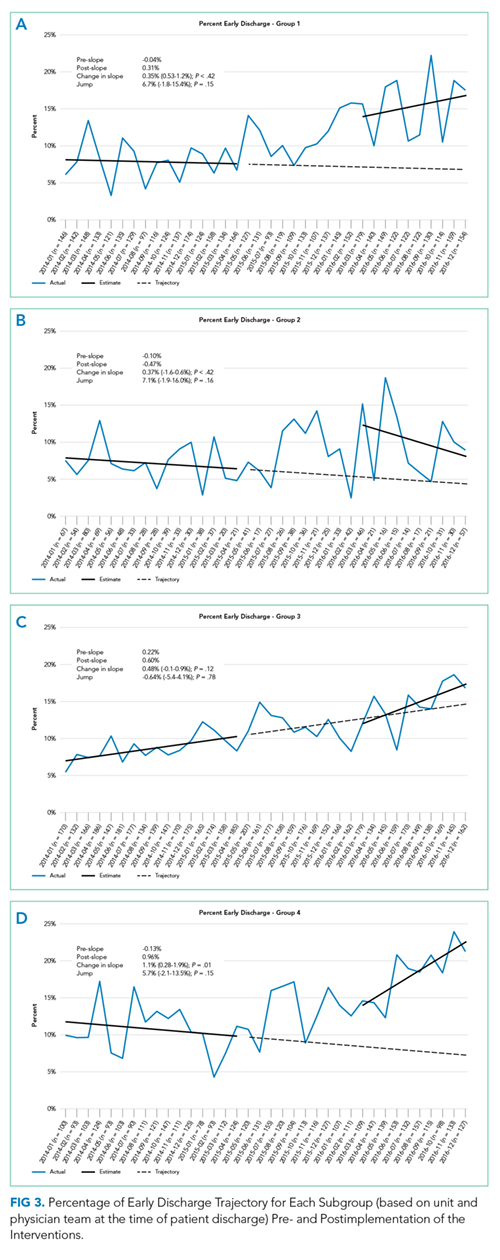
Between January to September 2015 and 2016, ED wait times decreased by 88 minutes (P <.01) and PACU wait times decreased by 20 minutes per patient admitted (P < .01; Table). There was no statistically significant change in seven-day readmissions (P = .19) or in families feeling ready to discharge (P = .11) or in general discharge satisfaction (P = .48) as measured by Press Ganey survey. Among all discharges (inpatient and observation), the average LOS significantly decreased by 0.6 days (P = .02).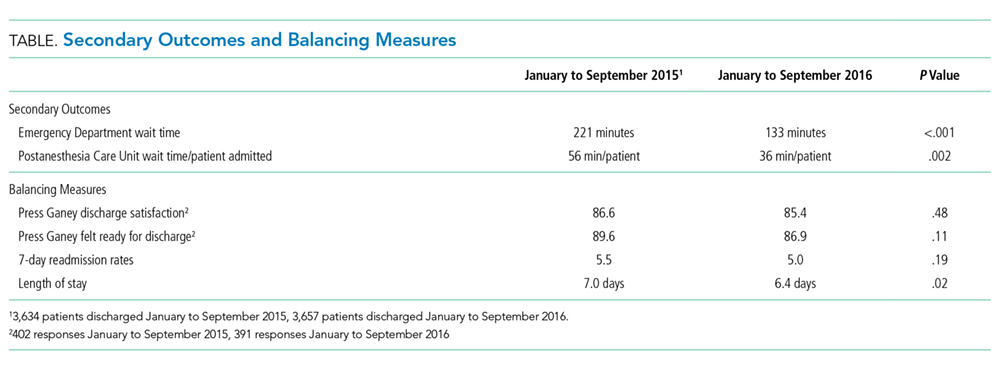
DISCUSSION
The percentage of patients who left the hospital prior to 11
It is difficult to compare our EDC improvements to those of previous studies, as we are unaware of published data on pediatric EDC efforts across an entire hospital. In addition, studies have reported discharges prior to different times in the day (noon, 1
As providers of all types were aware of the constant push for beds due to canceled surgeries, delayed admissions and intensive care transfers, and the inability to accept admission, it is difficult to compare the subgroups directly. Furthermore, although physician teams and units are distinct, individuals (nurses, case managers, trainees) may rotate through different units and teams and we cannot account for individual influences on EDCs depending on exposure to interventions over time. Although all groups improved, the improvement in slope in group 4 (exposed to interventions 1 and 3) was the only significant change. As group 4 contained a large number of surgical patients who often have more predictable hospital stays, perhaps this group was more responsive to the interventions.
Our EDC improvements were associated with a decrease in ED and PACU bed wait times. Importantly, we did not address potential confounding factors impacting these times such as total hospital admission volumes, ED and PACU patient complexity, and distribution of ED and PACU admission requests throughout the day. Modeling has suggested that EDCs could also improve ED flow,7 but studies implementing EDC have not necessarily assessed this outcome.10-15 One study retrospectively evaluated ED boarding times in the context of an EDC improvement effort and found a decrease in boarding times.21 This decrease is important as ED boarders may be at a higher risk for adverse events, a longer LOS, and more readmissions.3,7 Less is known about prolonged PACU wait times; however, studies have reported delays in receiving patients from the operating room (OR), which could presumably impact timeliness of other scheduled procedures and patient satisfaction.22-24 It is worth noting that OR holds as a result of PACU backups happened more frequently at our institution before our EDC work.
Our limitations include that individual providers in the various groups were not completely blind to the interventions and groups often comprised distinct patient populations. Second, LPCHS has a high CMI and LOS relative to most other children’s hospitals, complicating comparison with patient populations at other children’s hospitals. In addition, our work was done at this single institution. However, since a higher CMI was associated with a lower probability of EDC, hospitals with a lower CMI may have a greater opportunity for EDC improvements. Third, hospital systems are more impacted by low EDCs when operating at high occupancy (as we were at LPCHS); thus, improvements in ED and PACU wait times for inpatient beds might not be noted for hospitals operating with a >10% inventory of beds.25 Importantly, our hospital had multiple daily management structures in place, which we harnessed for our interventions, and better patient flow was a key hospital initiative garnering improvement of resources. Hospitals without these resources may have more difficulty implementing similar interventions. Finally, other work to improve patient flow was concurrently implemented, including matching numbers of scheduled OR admissions with anticipated capacity, which probably also contributed to the decrease in ED and PACU wait times.
CONCLUSIONS
We found that a multimodal intervention was associated with more EDCs and improved ED and PACU bed wait times. We observed no impact on discharge satisfaction or readmissions. Our EDC improvement efforts may guide institutions operating at high capacity and aiming to improve EDCs to improve patient flow.
Acknowledgments
The authors would like to acknowledge all those engaged in the early discharge work at LPCHS. They would like to particularly acknowledge Ava Rezvani for her engagement and work in helping to implement the interventions.
Disclosures
The authors have no conflicts of interest relevant to this article to disclose. The authors have no financial relationships relevant to this article to disclose.
Funding
This project was accomplished without specific funding. Funding for incentives was provided by the Lucile Packard Children’s Hospital Stanford.
1. Optimizing Patient Flow: Moving Patients Smoothly Through Acute Care Settings. IHI Innovation Series white paper. Boston: Institute for Healthcare Improvement; 2003. (Available on www.IHI.org)
2. Srivastava R, Stone BL, Patel R, et al. Delays in discharge in a tertiary care pediatric hospital. J Hosp Med. 2009;4(8):481-485. doi: 10.1002/jhm.490. PubMed
3. Bekmezian A, Chung PJ. Boarding admitted children in the emergency department impacts inpatient outcomes. Pediatr Emerg Care. 2012;28(3):236-242. doi: 10.1097/PEC.0b013e3182494b94. PubMed
4. Hillier DF, Parry GJ, Shannon MW, Stack AM. The effect of hospital bed occupancy on throughput in the pediatric emergency department. Ann Emerg Med. 2009;53(6):767-776. doi: 10.1016/j.annemergmed.2008.11.024. PubMed
5. McGowan JE, Truwit JD, Cipriano P, et al. Operating room efficiency and hospital capacity: factors affecting operating use during maximum hospital census. J Am Coll Surg. 2007;204(5):865-871. doi: 10.1016/j.jamcollsurg.2007.01.052. PubMed
6. Khanna S, Sier D, Boyle J, Zeitz K. Discharge timeliness and its impact on hospital crowding and emergency department flow performance. Emerg Med Australas. 2016;28(2):164-170. doi: 10.1111/1742-6723.12543. PubMed
7. Powell ES, Khare RK, Venkatesh AK, Van Roo BD, Adams JG, Reinhardt G. The relationship between inpatient discharge timing and emergency department boarding. J Emerg Med. 2012;42(2):186-196. doi: 10.1016/j.jemermed.2010.06.028. PubMed
8. Liu SW, Thomas SH, Gordon JA, Hamedani AG, Weissman JS. A pilot study examining undesirable events among emergency department-boarded patients awaiting beds. Ann Emerg Med. 2009;54(3):381-385. doi: 10.1016/j.annemergmed.2009.02.001. PubMed
9. Khanna S, Boyle J, Good N, Lind J. Impact of admission and discharge peak times on hospital overcrowding. Stud Health Technol Inform. 2011;168:82-88. doi: 10.3233/978-1-60750-791-8-82. PubMed
10. Beck MJ, Gosik K. Redesigning an inpatient pediatric service using lean to improve throughput efficiency. J Hosp Med. 2015;10(4):220-227. doi: 10.1002/jhm.2300. PubMed
11. Wertheimer B, Jacobs RE, Bailey M, et al. Discharge before noon: an achievable hospital goal. J Hosp Med. 2014;9(4):210-214. doi: 10.1002/jhm.2154. PubMed
12. Chaiyachati KH, Sofair AN, Schwartz JI, Chia D. Discharge rounds: implementation of a targeted intervention for improving patient throughput on an inpatient medical teaching service. South Med J. 2016;109(5):313-317. doi: 10.14423/SMJ.0000000000000458. PubMed
13. Kravet SJ, Levine RB, Rubin HR, Wright SM. Discharging patients earlier in the day: a concept worth evaluating. Health Care Manag. 2007;26(2):142-146. doi: 10.1097/01.HCM.0000268617.33491.60. PubMed
14. Wertheimer B, Ramon EA, Iturrate E, Bailey M, Hochman K. Discharge before noon: effect on throughput and sustainability. J Hosp Med. 2015;10(10):664-669. doi: 10.1002/jhm.2412. PubMed
15. Durvasula R, Kayihan A, Del Bene S, et al. A multidisciplinary care pathway significantly increases the number of early morning discharges in a large academic medical center. Qual Manag Health Care. 2015;24(1):45-51. doi: 10.1097/QMH.0000000000000049. PubMed
16. Shook J. Managing to Learn: Using the A3 Management Process. Cambridge, MA: Lean Enterprise Institute; 2008.
17. Donnelly, LF. Daily management systems in medicine. Radiographics. 2014;34(2):549-555. doi: 10.1148/rg.342130035.
18. Ching JM, Long CH, Williams BL, Blackmore C. Using lean to improve medication administration safety: in search of the “perfect dose.” Jt Comm J Qual Patient Saf. 2013;39(5):195-204. doi: 10.1016/S1553-7250(13)39026-6. PubMed
19. Kim CS, Spahlinger DA, Kin JM, Billi JE. Lean health care: what can hospitals learn from a world-class automaker. J Hosp Med. 2006;1(3):191-199. doi: 10.1002/jhm.68. PubMed
20. R Version 3.5.1. R: A language and environment for statistical computing. R Foundation for Statistical Computing, Vienna, Austria. https://www.R-project.org/.
21. Beck MJ, Okerblom D, Kumar A, Bandyopadhyay S, Scalzi LV. Lean intervention improves patient discharge times, improves emergency department throughput and reduces congestion. Hosp Pract. 2016;44(5):252-259. doi: 10.1080/21548331.2016.1254559. PubMed
22. Bruce M. A study in time: performance improvement to reduce excess holding time in PACU. J Perianesth Nurs. 2000;15(4):237-244. doi: 10.1053/jpan.2000.9462. PubMed
23. Dolkart O, Amar E, Weisman D, Flaisho R, Weinbroum AA. Patient dissatisfaction following prolonged stay in the post-anesthesia care unit due to unavailable ward bed in a tertiary hospital. Harefuah. 2013;152(8):446-450. PubMed
24. Lalani SB, Ali F, Kanji Z. Prolonged-stay patients in the PACU: a review of the literature. J Perianesth Nurs. 2013;28(3):151-155. doi: 10.1016/j.jopan.2012.06.009. PubMed
25. Fieldston ES, Hall M, Sills MR, et al. Children’s hospitals do not acutely respond to high occupancy. Pediatrics. 2010;125(5):974-981. doi: 10.1542/peds.2009-1627. PubMed
Patient flow throughout the hospital has been shown to be adversely affected by discharge delays.1 When hospitals are operating at peak capacity, these delays impact throughput, length of stay (LOS), and cost of care and block patients from the emergency department (ED), postanesthesia recovery unit (PACU), or home awaiting inpatient beds.2-5 As patients wait in locations not ideal for inpatient care, they may suffer from adverse events and poor satisfaction.3,6 Several studies have analyzed discharge timing as it relates to ED boarding of admitted patients and demonstrated that early discharges (EDCs) can impact boarding times.7-9 A number of recent improvement efforts directed at moving discharges earlier in the day have been published.10-15 However, these improvements are often targeted at specific units or teams within a larger hospital setting and only one is in the pediatric setting.
Lucile Packard Children’s Hospital Stanford (LPCHS) is a 311-bed quaternary care academic women and children’s hospital in Northern California. As our organization expanded, the demand for hospital beds often exceeded capacity. The challenge of overall demand was regularly compounded by a mismatch in bed availability timing – bed demand is early in the day and bed availability is later. This mismatch results in delays for admitted patients waiting in the ED and PACU. Organization leaders identified increasing early discharges (EDCs) as one initiative to contribute to improved patient flow.
Our organization aimed to increase the number of discharges before 11
METHODS
Setting
We focused our EDC interventions on the 87 acute care beds at LPCHS. All patients discharged from these beds were included in the study. We excluded patients discharged from intensive care, maternity, and nursery. Acute care includes five units, one focused on hematology/oncology (Unit A), one focused on cardiology (Unit B), and the others with a surgical and medical pediatric patient mix (Units C, D, and E). Although physician teams have primary units, due to unit size, patients on teams other than cardiology and hematology/oncology are often spread across multiple units wherever there is a bed (including Units A and B). Most of the frontline care physicians are residents supervised by attendings; however, a minority of patients are cared for by nurse practitioners (NPs) or physician assistants (PAs).
Improvement Team
In early 2015, we formed a multidisciplinary group inclusive of a case manager, frontline nurses, nurse management, pediatric residents, and hospitalist physicians with support from performance improvement. We periodically included physician leaders from other specialties to help initiate changes within their own clinical areas. Our group used Lean A3 thinking16 to gather information about the current state, formulate the problem statement, analyze the problem, and consider interventions implemented in three Plan–Do-Check-Act (PDCA) cycles. The A3 is a structured tool to analyze problems before jumping to solutions and communicate with stakeholders. We interviewed leaders, nurses, residents, case managers, etc. and observed work processes around discharge. We met weekly to follow data, assess results of interventions, and problem solve.
Barriers and Interventions
The first barrier we identified and addressed was poor identification and shared team mental model of potential EDC patients and lack of preparation when an EDC was identified. In intervention one starting May 2015, charge nurses on Units C, D, and E were each asked to identify one EDC for the following day. The identified patient was discussed at the previously existing afternoon daily unit huddle17 attended by nurse management, case management, and hospitalist leaders. Following the huddle, the resident, NP, or PA responsible for the patient was paged regarding the EDC plan and tasked with medication reconciliation and discharge paperwork. Others were asked to address their specific area of patient care for discharge (eg, case manager–supplies, nursing–education). The patient was identified on the unit white board with a yellow magnet (use of a visual control18), so that all would be aware of the EDC. An e-mail was sent to case management, nurse leaders, and patient placement coordinators regarding the planned EDCs. Finally, the EDCs were discussed during regularly scheduled huddles throughout the evening and into the next day.17
Despite this first intervention, we noted that progress toward increased EDCs was slow. Thus, we spent approximately seven days (spread over one month) further observing the work processes.19 Over five days, we asked each unit’s charge nurse every hour which patients were waiting to be discharged and the primary reason for waiting. From this information, we created a pareto chart demonstrating that rounds were the highest contributor to waiting (Appendix A). Thus, our second intervention was a daily physician morning huddle that the four nonsurgical physician teams (excluding cardiology, hematology/oncology) implemented one team at a time between November 2015 and February 2016. At the huddle, previously identified EDCs (located on any of the five units) were confirmed and preparatory work was completed (inclusive of the discharge order) before rounds. Further, the attending and resident physicians were to see the patient before or at the start of rounds.
Our working group still observed slow EDC improvement and sought feedback from all providers. EDC was described as “extra” work, apart from routine practices and culture. In addition, our interventions had not addressed most discharges on Units A and B. Consequently, our third intervention in February 2016 aimed to recognize and incentivize teams, units, and individuals for EDC successes. Units and/or physician teams that met 25% of EDCs the previous week were acknowledged through hospital-wide screensavers and certificates of appreciation signed by the Chief Nursing Officer. Units and/or physician teams that met 25% of EDC the previous month were acknowledged with a trophy. Residents received coffee cards for each EDC (though not without controversy among the improvement group as we acknowledged that all providers contributed to EDCs). Finally, weekly, we shared an EDC dashboard displaying unit, team, and organization performance at the hospital-wide leader huddle. We also e-mailed the dashboard regularly to division chiefs, medical directors, and nursing leaders.
Measures
Our primary outcome was percentage of EDCs (based on the time the patient left the room) across acute care. Secondary outcome measures were median wait times for an inpatient bed from the ED (time bed requested to the time patient left the ED) and the average PACU wait time (time the patient is ready to leave the PACU to time the patient left the PACU) per admitted patient. We also assessed balancing measures, including discharge satisfaction, seven-day readmission rates, and LOS. We obtained the mean discharge satisfaction score from the organization’s Press Ganey survey results across acute care (the three discharge questions’ mean – “degree … you felt ready to have your child discharged,” “speed of discharge process …,” and “instructions… to care for your child…”). We obtained seven-day readmission rates from acute care discharges using the hospital’s regularly reported data. We assessed patient characteristics, including sex, age, case mix index (CMI; >2 vs <2), insurance type (nongovernment vs government), day of discharge (weekend vs weekday), and LOS from those patients categorized as inpatients. Complete patient characteristics were not available for observation (InterQual® criteria) status patients.
Analysis
We used descriptive statistics to describe the inpatient population characteristics by analyzing differences when EDC did and did not occur using chi-square and the Mann–Whitney U tests. Patients with missing data were removed from analyses that incorporated patient factors.
To assess our primary outcome, we used an interrupted time series analysis assessing the percentage of EDC in the total population before any intervention (May 2015) and after the last intervention (March 2016). We used the Durbin–Watson statistic to assess autocorrelation of errors in our regression models. As we had only patient characteristics for the inpatient population, we repeated the analysis including only inpatients and accounting for patient factors significantly associated with EDC.
As units and physician teams had differential exposure to the interventions, we performed a subanalysis (using interrupted time series) creating groups based on the combination of interventions to which a patient’s discharge was exposed (based on unit and physician team at discharge). Patient discharges from group 1 (medical patients on Units C, D, and E) were exposed to all three interventions, group 2 patient discharges (medical patients on Units A and B) were exposed to interventions 2 and 3, group 3 (cardiology, hematology/oncology, surgical patients on Units A and B) were exposed to intervention 3, and group 4 (surgical, cardiology, hematology/oncology patients on Units C, D, and E) were exposed to interventions 1 and 3 (Figure 1). Interrupted time series models were fit using the R Statistical Software Package.20
Because of seasonal variation in admissions, we compared secondary outcomes and balancing measures over similar time frames in the calendar year (January to September 2015 vs January to September 2016) using the Mann–Whitney U test and the unpaired t-test, respectively.
The project’s primary purpose was to implement a practice to improve the quality of care, and therefore, the Stanford Institutional Review Board determined it to be nonresearch.
RESULTS
There were 16,175 discharges on acute care from January 2014 through December 2016. Across all acute care units, EDCs increased from an average of 8.8% before the start of interventions (May 2015) to 15.8% after all interventions (February 2016). From the estimated trend in the preintervention period, there was a jump of 3.9% to the start of the postintervention trend (P = .02; Figure 2). Furthermore, there was an increase of 0.48% (95% CI 0.15-0.82%; P < .01) per month in the trend of the slope between the pre- and postintervention. The autocorrelation function and the Durbin–Watson test did not show evidence of autocorrelation (P = .85). Lack of evidence for autocorrelation in this and each of our subsequent fitted models led to excluding an autocorrelation parameter from our models.
From 16,175 discharges, 1,764 (11%) were assigned to observation status. Among inpatients (14,411), patients with missing values (CMI, insurance status) were also excluded (n = 66, 0.5%). Among the remaining 14,345 inpatients, 54% were males, 50% were government-insured, and 1,645 (11.5%) were discharged early. The average age was 8.5 years, the average LOS was seven days, and the median CMI was 2.2. Children who were younger, had shorter LOS, CMI <2, and nongovernment insurance were more likely to be discharged early (P < .01 for all). For each of these variables, F-tests were performed to determine whether there was a statistically significant reduction in variation by adding the variable to our initial model. None of the variables alone or in combination led to a statistically significant reduction in variation. Including these factors in the interrupted time series did not change the significance of the results (jump at postintervention start 3.6%, 95% CI 0.7%-7.2%; P = .02, slope increased by 0.59% per month, 95% CI 0.29-0.89%; P < .01).
In the subgroup analysis, we did not account for patient factors as they did not change the results in the analysis of total population. Though each group had a greater percentage of EDCs in the postintervention period, the changes in slopes and jumps were primarily nonsignificant (Figure 3). Only the change in slope in group 4 was significant (1.1%, 95% CI 0.3-1.9%; P = .01).
Between January to September 2015 and 2016, ED wait times decreased by 88 minutes (P <.01) and PACU wait times decreased by 20 minutes per patient admitted (P < .01; Table). There was no statistically significant change in seven-day readmissions (P = .19) or in families feeling ready to discharge (P = .11) or in general discharge satisfaction (P = .48) as measured by Press Ganey survey. Among all discharges (inpatient and observation), the average LOS significantly decreased by 0.6 days (P = .02).
DISCUSSION
The percentage of patients who left the hospital prior to 11
It is difficult to compare our EDC improvements to those of previous studies, as we are unaware of published data on pediatric EDC efforts across an entire hospital. In addition, studies have reported discharges prior to different times in the day (noon, 1
As providers of all types were aware of the constant push for beds due to canceled surgeries, delayed admissions and intensive care transfers, and the inability to accept admission, it is difficult to compare the subgroups directly. Furthermore, although physician teams and units are distinct, individuals (nurses, case managers, trainees) may rotate through different units and teams and we cannot account for individual influences on EDCs depending on exposure to interventions over time. Although all groups improved, the improvement in slope in group 4 (exposed to interventions 1 and 3) was the only significant change. As group 4 contained a large number of surgical patients who often have more predictable hospital stays, perhaps this group was more responsive to the interventions.
Our EDC improvements were associated with a decrease in ED and PACU bed wait times. Importantly, we did not address potential confounding factors impacting these times such as total hospital admission volumes, ED and PACU patient complexity, and distribution of ED and PACU admission requests throughout the day. Modeling has suggested that EDCs could also improve ED flow,7 but studies implementing EDC have not necessarily assessed this outcome.10-15 One study retrospectively evaluated ED boarding times in the context of an EDC improvement effort and found a decrease in boarding times.21 This decrease is important as ED boarders may be at a higher risk for adverse events, a longer LOS, and more readmissions.3,7 Less is known about prolonged PACU wait times; however, studies have reported delays in receiving patients from the operating room (OR), which could presumably impact timeliness of other scheduled procedures and patient satisfaction.22-24 It is worth noting that OR holds as a result of PACU backups happened more frequently at our institution before our EDC work.
Our limitations include that individual providers in the various groups were not completely blind to the interventions and groups often comprised distinct patient populations. Second, LPCHS has a high CMI and LOS relative to most other children’s hospitals, complicating comparison with patient populations at other children’s hospitals. In addition, our work was done at this single institution. However, since a higher CMI was associated with a lower probability of EDC, hospitals with a lower CMI may have a greater opportunity for EDC improvements. Third, hospital systems are more impacted by low EDCs when operating at high occupancy (as we were at LPCHS); thus, improvements in ED and PACU wait times for inpatient beds might not be noted for hospitals operating with a >10% inventory of beds.25 Importantly, our hospital had multiple daily management structures in place, which we harnessed for our interventions, and better patient flow was a key hospital initiative garnering improvement of resources. Hospitals without these resources may have more difficulty implementing similar interventions. Finally, other work to improve patient flow was concurrently implemented, including matching numbers of scheduled OR admissions with anticipated capacity, which probably also contributed to the decrease in ED and PACU wait times.
CONCLUSIONS
We found that a multimodal intervention was associated with more EDCs and improved ED and PACU bed wait times. We observed no impact on discharge satisfaction or readmissions. Our EDC improvement efforts may guide institutions operating at high capacity and aiming to improve EDCs to improve patient flow.
Acknowledgments
The authors would like to acknowledge all those engaged in the early discharge work at LPCHS. They would like to particularly acknowledge Ava Rezvani for her engagement and work in helping to implement the interventions.
Disclosures
The authors have no conflicts of interest relevant to this article to disclose. The authors have no financial relationships relevant to this article to disclose.
Funding
This project was accomplished without specific funding. Funding for incentives was provided by the Lucile Packard Children’s Hospital Stanford.
1. Optimizing Patient Flow: Moving Patients Smoothly Through Acute Care Settings. IHI Innovation Series white paper. Boston: Institute for Healthcare Improvement; 2003. (Available on www.IHI.org)
2. Srivastava R, Stone BL, Patel R, et al. Delays in discharge in a tertiary care pediatric hospital. J Hosp Med. 2009;4(8):481-485. doi: 10.1002/jhm.490. PubMed
3. Bekmezian A, Chung PJ. Boarding admitted children in the emergency department impacts inpatient outcomes. Pediatr Emerg Care. 2012;28(3):236-242. doi: 10.1097/PEC.0b013e3182494b94. PubMed
4. Hillier DF, Parry GJ, Shannon MW, Stack AM. The effect of hospital bed occupancy on throughput in the pediatric emergency department. Ann Emerg Med. 2009;53(6):767-776. doi: 10.1016/j.annemergmed.2008.11.024. PubMed
5. McGowan JE, Truwit JD, Cipriano P, et al. Operating room efficiency and hospital capacity: factors affecting operating use during maximum hospital census. J Am Coll Surg. 2007;204(5):865-871. doi: 10.1016/j.jamcollsurg.2007.01.052. PubMed
6. Khanna S, Sier D, Boyle J, Zeitz K. Discharge timeliness and its impact on hospital crowding and emergency department flow performance. Emerg Med Australas. 2016;28(2):164-170. doi: 10.1111/1742-6723.12543. PubMed
7. Powell ES, Khare RK, Venkatesh AK, Van Roo BD, Adams JG, Reinhardt G. The relationship between inpatient discharge timing and emergency department boarding. J Emerg Med. 2012;42(2):186-196. doi: 10.1016/j.jemermed.2010.06.028. PubMed
8. Liu SW, Thomas SH, Gordon JA, Hamedani AG, Weissman JS. A pilot study examining undesirable events among emergency department-boarded patients awaiting beds. Ann Emerg Med. 2009;54(3):381-385. doi: 10.1016/j.annemergmed.2009.02.001. PubMed
9. Khanna S, Boyle J, Good N, Lind J. Impact of admission and discharge peak times on hospital overcrowding. Stud Health Technol Inform. 2011;168:82-88. doi: 10.3233/978-1-60750-791-8-82. PubMed
10. Beck MJ, Gosik K. Redesigning an inpatient pediatric service using lean to improve throughput efficiency. J Hosp Med. 2015;10(4):220-227. doi: 10.1002/jhm.2300. PubMed
11. Wertheimer B, Jacobs RE, Bailey M, et al. Discharge before noon: an achievable hospital goal. J Hosp Med. 2014;9(4):210-214. doi: 10.1002/jhm.2154. PubMed
12. Chaiyachati KH, Sofair AN, Schwartz JI, Chia D. Discharge rounds: implementation of a targeted intervention for improving patient throughput on an inpatient medical teaching service. South Med J. 2016;109(5):313-317. doi: 10.14423/SMJ.0000000000000458. PubMed
13. Kravet SJ, Levine RB, Rubin HR, Wright SM. Discharging patients earlier in the day: a concept worth evaluating. Health Care Manag. 2007;26(2):142-146. doi: 10.1097/01.HCM.0000268617.33491.60. PubMed
14. Wertheimer B, Ramon EA, Iturrate E, Bailey M, Hochman K. Discharge before noon: effect on throughput and sustainability. J Hosp Med. 2015;10(10):664-669. doi: 10.1002/jhm.2412. PubMed
15. Durvasula R, Kayihan A, Del Bene S, et al. A multidisciplinary care pathway significantly increases the number of early morning discharges in a large academic medical center. Qual Manag Health Care. 2015;24(1):45-51. doi: 10.1097/QMH.0000000000000049. PubMed
16. Shook J. Managing to Learn: Using the A3 Management Process. Cambridge, MA: Lean Enterprise Institute; 2008.
17. Donnelly, LF. Daily management systems in medicine. Radiographics. 2014;34(2):549-555. doi: 10.1148/rg.342130035.
18. Ching JM, Long CH, Williams BL, Blackmore C. Using lean to improve medication administration safety: in search of the “perfect dose.” Jt Comm J Qual Patient Saf. 2013;39(5):195-204. doi: 10.1016/S1553-7250(13)39026-6. PubMed
19. Kim CS, Spahlinger DA, Kin JM, Billi JE. Lean health care: what can hospitals learn from a world-class automaker. J Hosp Med. 2006;1(3):191-199. doi: 10.1002/jhm.68. PubMed
20. R Version 3.5.1. R: A language and environment for statistical computing. R Foundation for Statistical Computing, Vienna, Austria. https://www.R-project.org/.
21. Beck MJ, Okerblom D, Kumar A, Bandyopadhyay S, Scalzi LV. Lean intervention improves patient discharge times, improves emergency department throughput and reduces congestion. Hosp Pract. 2016;44(5):252-259. doi: 10.1080/21548331.2016.1254559. PubMed
22. Bruce M. A study in time: performance improvement to reduce excess holding time in PACU. J Perianesth Nurs. 2000;15(4):237-244. doi: 10.1053/jpan.2000.9462. PubMed
23. Dolkart O, Amar E, Weisman D, Flaisho R, Weinbroum AA. Patient dissatisfaction following prolonged stay in the post-anesthesia care unit due to unavailable ward bed in a tertiary hospital. Harefuah. 2013;152(8):446-450. PubMed
24. Lalani SB, Ali F, Kanji Z. Prolonged-stay patients in the PACU: a review of the literature. J Perianesth Nurs. 2013;28(3):151-155. doi: 10.1016/j.jopan.2012.06.009. PubMed
25. Fieldston ES, Hall M, Sills MR, et al. Children’s hospitals do not acutely respond to high occupancy. Pediatrics. 2010;125(5):974-981. doi: 10.1542/peds.2009-1627. PubMed
© 2019 Society of Hospital Medicine