User login
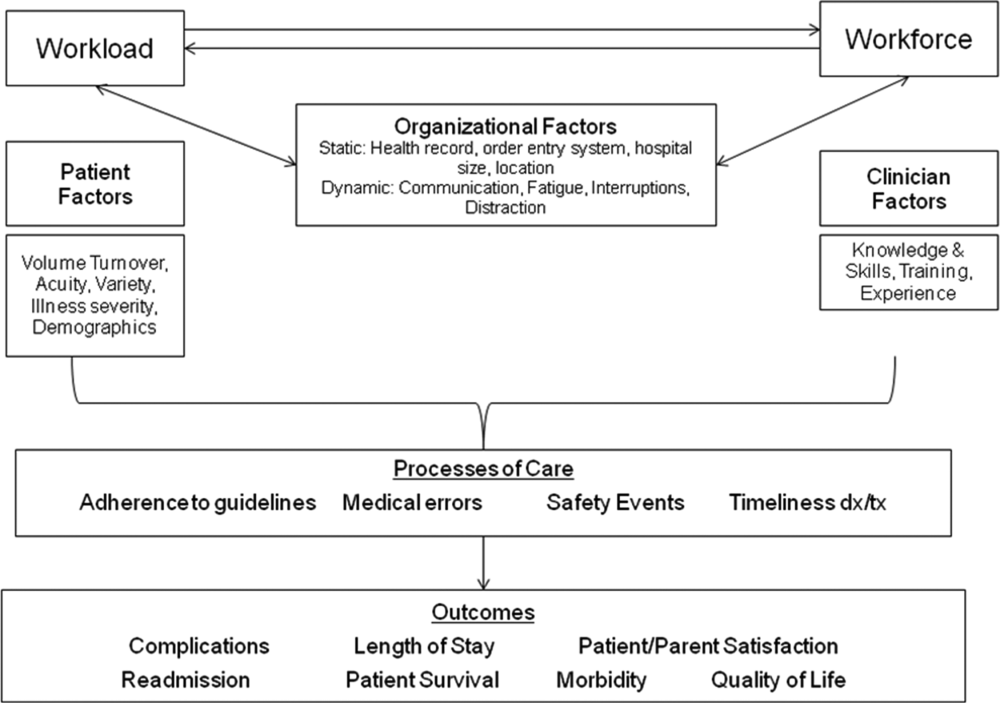
Healthcare systems face many clinical and operational challenges in optimizing the quality of patient care across the domains of safety, effectiveness, efficiency, timeliness, patient‐centeredness, and equity.[1] They must also balance staff satisfaction, and in academic settings, the education of trainees. In inpatient settings, the process of care encompasses many microsystems, and clinical outcomes are the result of a combination of endogenous patient factors, the capabilities of clinical staff, as well as the static and dynamic organizational characteristics of the systems delivering care.[2, 3, 4, 5] Static organizational characteristics include hospital type and size, whereas dynamic organizational characteristics include communications between staff, staff fatigue, interruptions in care, and other factors that impact patient care and clinical outcomes (Figure 1).[2] Two major components of healthcare microsystems are workload and workforce.
A principle in operations management describes the need to match capacity (eg, workforce) to demand (eg, workload) to optimize efficiency.[6] This is particularly relevant in healthcare settings, where an excess of workload for the available workforce may negatively impact processes and outcomes of patient care and resident learning. These problems can arise from fatigue and strain from a heavy cognitive load, or from interruptions, distractions, and ineffective communication.[7, 8, 9, 10, 11] Conversely, in addition to being inefficient, an excess of workforce is financially disadvantageous for the hospital and reduces trainees' opportunities for learning.
Workload represents patient demand for clinical resources, including staff time and effort.[5, 12] Its elements include volume, turnover, acuity, and patient variety. Patient volume is measured by census.[12] Turnover refers to the number of admissions, discharges, and transfers in a given time period.[12] Acuity reflects the intensity of patient needs,[12] and variety represents the heterogeneity of those needs. These 4 workload factors are highly variable across locations and highly dynamic, even within a fixed location. Thus, measuring workload to assemble the appropriate workforce is challenging.
Workforce is comprised of clinical and nonclinical staff members who directly or indirectly provide services to patients. In this article, clinicians who obtain histories, conduct physical exams, write admission and progress notes, enter orders, communicate with consultants, and obtain consents are referred to as front‐line ordering clinicians (FLOCs). FLOCs perform activities listed in Table 1. Historically, in teaching hospitals, FLOCs consisted primarily of residents. More recently, FLOCs include nurse practitioners, physician assistants, house physicians, and hospitalists (when providing direct care and not supervising trainees).[13] In academic settings, supervising physicians (eg, senior supervising residents, fellows, or attendings), who are usually on the floor only in a supervisory capacity, may also contribute to FLOC tasks for part of their work time.
| FLOC Responsibilities | FLOC Personnel |
|---|---|
| |
| Admission history and physical exam | Residents |
| Daily interval histories | Nurse practitioners |
| Daily physical exams | Physician assistants |
| Obtaining consents | House physicians |
| Counseling, guidance, and case management | Hospitalists (when not in supervisory role) |
| Performing minor procedures | Fellows (when not in supervisory role) |
| Ordering, performing and interpreting diagnostic tests | Attendings (when not in supervisory role) |
| Writing prescriptions | |
Though matching workforce to workload is essential for hospital efficiency, staff satisfaction, and optimizing patient outcomes, hospitals currently lack a means to measure and match dynamic workload and workforce factors. This is particularly problematic at large children's hospitals, where high volumes of admitted patients stay for short amounts of time (less than 2 or 3 days).[14] This frequent turnover contributes significantly to workload. We sought to address this issue as part of a larger effort to redefine the care model at our urban, tertiary care children's hospital. This article describes our work to develop and obtain consensus for use of a tool to dynamically match FLOC workforce to clinical workload in a variety of inpatient settings.
METHODS
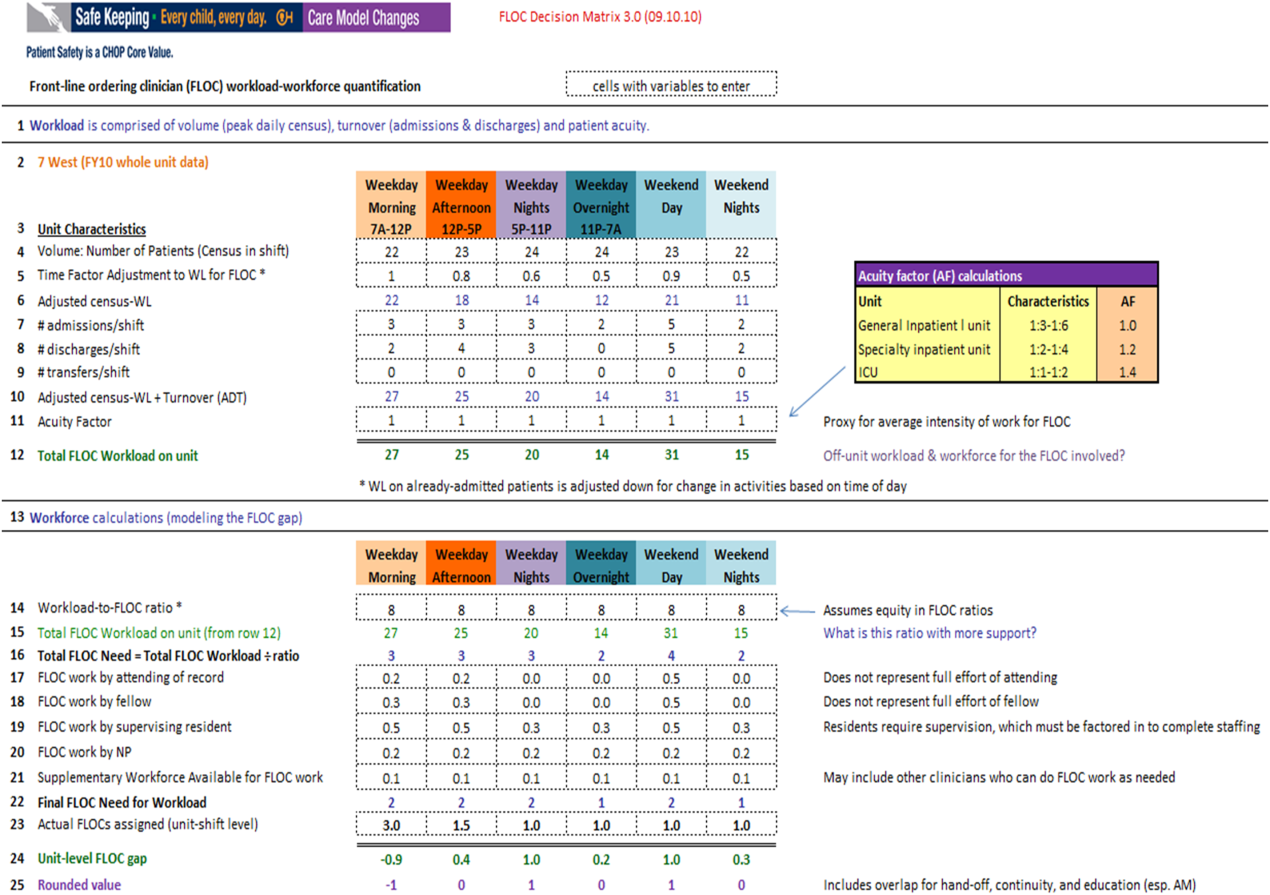
We undertook an iterative, multidisciplinary approach to develop the Care Model Matrix tool (Figure 2). The process involved literature reviews,[2, 3, 4, 5, 6, 7, 8, 9, 10, 11, 12, 13, 14] discussions with clinical leadership, and repeated validation sessions. Our focus was at the level of the patient nursing units, which are the discrete areas in a hospital where patient care is delivered and physician teams are organized. We met with physicians and nurses from every clinical care area at least twice to reach consensus on how to define model inputs, decide how to quantify those inputs for specific microsystems, and to validate whether model outputs seemed consistent with clinicians' experiences on the floors. For example, if the model indicated that a floor was short 1 FLOC during the nighttime period, relevant staff confirmed that this was consistent with their experience.
Quantifying Workload
In quantifying FLOC workload, we focused on 3 elements: volume, turnover, and acuity.[12] Volume is equal to the patient census at a moment in time for a particular floor or unit. Census data were extracted from the hospital's admission‐discharge‐transfer (ADT) system (Epic, Madison, WI). Timestamps for arrival and departure are available for each unit. These data were used to calculate census estimates for intervals of time that corresponded to activities such as rounds, conferences, or sign‐outs, and known variations in patient flow. Intervals for weekdays were: 7 am to 12 pm, 12 pm to 5 pm, 5 pm to 11 pm, and 11 pm to 7 am. Intervals for weekends were: 7 am to 7 pm (daytime), and 7 pm to 7 am (nighttime). Census data for each of the 6 intervals were averaged over 1 year.
In addition to patient volume, discussions with FLOCs highlighted the need to account for inpatients having different levels of need at different points throughout the day. For example, patients require the most attention in the morning, when FLOCs need to coordinate interval histories, conduct exams, enter orders, call consults, and interpret data. In the afternoon and overnight, patients already in beds have relatively fewer needs, especially in nonintensive care unit (ICU) settings. To adjust census data to account for time of day, a time factor was added, with 1 representing the normalized full morning workload (Figure 2, line 5). Based on clinical consensus, this time factor decreased over the course of the day, more so for non‐ICU patients than for ICU patients. For example, a time factor of 0.5 for overnight meant that patients in beds on that unit generated half as much work overnight as those same patients would in the morning when the time factor was set to 1. Multiplication of number of patients and the time factor equals adjusted census workload, which reflects what it felt like for FLOCs to care for that number of patients at that time. Specifically, if there were 20 patients at midnight with a time factor of 0.5, the patients generated a workload equal to 20 0.5=10 workload units (WU), whereas in the morning the same actual number of patients would generate a workload of 20 1=20 WU.
The ADT system was also used to track information about turnover, including number of admissions, discharges, and transfers in or out of each unit during each interval. Each turnover added to the workload count to reflect the work involved in admitting, transferring, or discharging a patient (Figure 2, lines 79). For example, a high‐turnover floor might have 20 patients in beds, with 4 admissions and 4 discharges in a given time period. Based on clinical consensus, it was determined that the work involved in managing each turnover would count as an additional workload element, yielding an adjusted census workload+turnover score of (20 1)+4+4=28 WU. Although only 20 patients would be counted in a static census during this time, the adjusted workload score was 28 WU. Like the time factor, this adjustment helps provide a feels‐like barometer.
Finally, this workload score is multiplied by an acuity factor that considers the intensity of need for patients on a unit (Figure 2, line 11). We stratified acuity based on whether the patient was in a general inpatient unit, a specialty unit, or an ICU, and assigned acuity factors based on observations of differences in intensity between those units. The acuity factor was normalized to 1 for patients on a regular inpatient floor. Specialty care areas were 20% higher (1.2), and ICUs were 40% higher (1.4). These differentials were estimated based on clinician experience and knowledge of current FLOC‐to‐patient and nurse‐to‐patient ratios.
Quantifying Workforce
To quantify workforce, we assumed that each FLOC, regardless of type, would be responsible for the same number of workload units. Limited evidence and research exist regarding ideal workload‐to‐staff ratios for FLOCs. Published literature and hospital experience suggest that the appropriate volume per trainee for non‐ICU inpatient care in medicine and pediatrics is between 6 and 10 patients (not workload units) per trainee.[13, 15, 16, 17, 18] Based on these data, we chose 8 workload units as a reasonable workload allocation per FLOC. This ratio appears in the matrix as a modifiable variable (Figure 2, line 14). We then divided total FLOC workload (Figure 2, line 15) from our workload calculations by 8 to determine total FLOC need (Figure 2, line 16). Because some of the workload captured in total FLOC need would be executed by personnel who are typically classified as non‐FLOCs, such as attendings, fellows, and supervising residents, we quantified the contributions of each of these non‐FLOCs through discussion with clinical leaders from each floor. For example, if an attending physician wrote complete notes on weekends, he or she would be contributing to FLOC work for that location on those days. A 0.2 contribution under attendings would mean that an attending contributed an amount of work equivalent to 20% of a FLOC. We subtracted contributions of non‐FLOCs from the total FLOC need to determine final FLOC need (Figure 2, line 22). Last, we subtracted the actual number of FLOCs assigned to a unit for a specific time period from the final FLOC need to determine the unit‐level FLOC gap at that time (Figure 2, line 24).
RESULTS
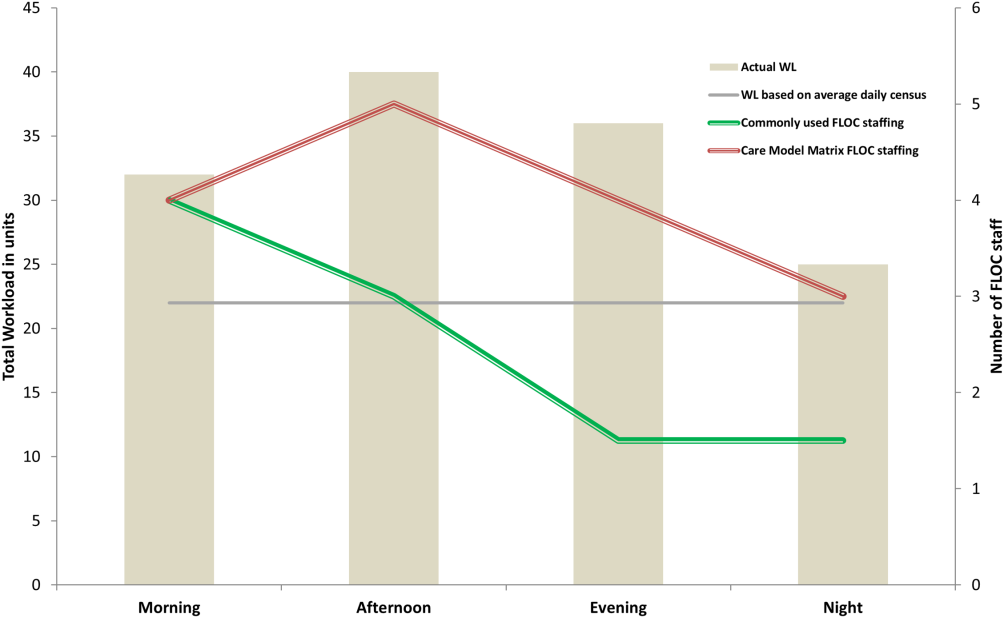
The Care Model Matrix compares predicted workforce need and actual workforce assignments, while considering the contributions of non‐FLOCs to FLOC work in various inpatient care settings. Figure 3 shows graphical representations of FLOC staffing models. The green line shows the traditional approach, and the red line shows the dynamic approach using the Care Model Matrix. The dynamic approach better captures variations in workload.
We presented the tool at over 25 meetings in 14 hospital divisions, and received widespread acceptance among physician, nursing, and administrative leadership. In addition, the hospital has used the tool to identify gaps in FLOC coverage and guide hiring and staffing decisions. Each clinical area also used the tool to review staffing for the 2012 academic year. Though a formal evaluation of the tool has not been conducted, feedback from attending physicians and FLOCs has been positive. Specifically, staffing adjustments have increased the available workforce in the afternoons and on weekends, when floors were previously perceived to be understaffed.
DISCUSSION
Hospitals depend upon a large, diverse workforce to manage and care for patients. In any system there will be a threshold at which workload exceeds the available workforce. In healthcare delivery settings, this can harm patient care and resident education.[12, 19] Conversely, a workforce that is larger than necessary is inefficient. If hospitals can define and measure relevant elements to better match workforce to workload, they can avoid under or over supplying staff, and mitigate the risks associated with an overburdened workforce or the waste of unused capacity. It also enables more flexible care models to dynamically match resources to needs.
The Care Model Matrix is a flexible, objective tool that quantifies multidimensional aspects of workload and workforce. With the tool, hospitals can use historic data on census, turnover, and acuity to predict workload and staffing needs at specific time periods. Managers can also identify discrepancies between workload and workforce, and match them more efficiently during the day.
The tool, which uses multiple modifiable variables, can be adapted to a variety of academic and community inpatient settings. Although our sample numbers in Figure 2 represent census, turnover, acuity, and workload‐to‐FLOC ratios at our hospital, other hospitals can adjust the model to reflect their numbers. The flexibility to add new factors as elements of workload or workforce enhances usability. For example, the model can be modified to capture other factors that affect staffing needs such as frequency of handoffs[11] and the staff's level of education or experience.
There are, however, numerous challenges associated with matching FLOC staffing to workload. Although there is a 24‐hour demand for FLOC coverage, unlike nursing, ideal FLOC to patients or workload ratios have not been established. Academic hospitals may experience additional challenges, because trainees have academic responsibilities in addition to clinical roles. Although trainees are included in FLOC counts, they are unavailable during certain didactic times, and their absence may affect the workload balance.
Another challenge associated with dynamically adjusting workforce to workload is that most hospitals do not have extensive flex or surge capacity. One way to address this is to have FLOCs choose days when they will be available as backup for a floor that is experiencing a heavier than expected workload. Similarly, when floors are experiencing a lighter than expected workload, additional FLOCs can be diverted to administrative tasks, to other floors in need of extra capacity, or sent home with the expectation that the day will be made up when the floor is experiencing a heavier workload.
Though the tool provides numerous advantages, there are several limitations to consider. First, the time and acuity factors used in the workload calculation, as well as the non‐FLOC contribution estimates and numbers reflecting desired workload per FLOC used in the workforce calculation, are somewhat subjective estimations based on observation and staff consensus. Thus, even though the tool's approach should be generalizable to any hospital, the specific values may not be. Therefore, other hospitals may need to change these values based on their unique situations. It is also worth noting that the flexibility of the tool presents both a virtue and potential vice. Those using the tool must agree upon a standard to define units so inconsistent definitions do not introduce unjustified discrepancies in workload. Second, the current tool does not consider the costs and benefits of different staffing approaches. Different types of FLOCs may handle workload differently, so an ideal combination of FLOC types should be considered in future studies. Third, although this work focused on matching FLOCs to workload, the appropriate matching of other workforce members is also essential to maximizing efficiency and patient care. Finally, because the tool has not yet been tested against outcomes, adhering to the tool's suggested ratios cannot necessary guarantee optimal outcomes in terms of patient care or provider satisfaction. Rather, the tool is designed to detect mismatches of workload and workforce based on desired workload levels, defined through local consensus.
CONCLUSION
We sought to develop a tool that quantifies workload and workforce to help our freestanding children's hospital predict and plan for future staffing needs. We created a tool that is objective and flexible, and can be applied to a variety of academic and community inpatient settings to identify mismatches of workload and workforce at discrete time intervals. However, given that the tool's recommendations are sensitive to model inputs that are based on local consensus, further research is necessary to test the validity and generalizability of the tool in various settings. Model inputs may need to be calibrated over time to maximize the tool's usefulness in a particular setting. Further study is also needed to determine how the tool directly impacts patient and provider satisfaction and the quality of care delivered.
Acknowledgements
The authors acknowledge the dozens of physicians and nurses for their involvement in the development of the Care Model Matrix through repeated meetings and dialog. The authors thank Sheyla Medina, Lawrence Chang, and Jennifer Jonas for their assistance in the production of this article.
Disclosures: Internal funds from The Children's Hospital of Philadelphia supported the conduct of this work. The authors have no financial interests, relationships, affiliations, or potential conflicts of interest relevant to the subject matter or materials discussed in the manuscript to disclose.
- . A user's manual for the IOM's “quality chasm” report. Health Aff. 2002;21(3):80–90.
- . Human error: models and management. BMJ. 2000;320(7237):768–770.
- , . Knowledge for Improvement: Improving Quality in the Micro‐systems of Care. in Providing Quality of Care in a Cost‐Focused Environment, Goldfield N, Nach DB (eds.), Gaithersburg, Maryland: Aspen Publishers, Inc. 1999;75–88.
- World Alliance For Patient Safety Drafting Group1, , , , et al. Towards an International Classification for Patient Safety: the conceptual framework. Int J Qual Health Care. F2009;21(1):2–8.
- , . Impact of workload on service time and patient safety: an econometric analysis of hospital operations. Manage Sci. 2009;55(9):1486–1498.
- , . Matching Supply With Demand: An Introduction to Operations Management. New York, NY: McGraw‐Hill; 2006.
- , . Operational failures and interruptions in hospital nursing. Health Serv Res. 2006;41:643–662.
- , , , , . Association of interruptions with an increased risk and severity of medication administration errors. Arch Intern Med. 2010;170(8):683–690.
- . The impact of fatigue on patient safety. Pediatr Clin North Am. 2006;53(6):1135–1153.
- , , , , . Effects of hospital care environment on patient mortality and nurse outcomes. J Nurs Adm. 2009;39(7/8):S45–S51.
- , , , , , . Perspective: beyond counting hours: the importance of supervision, professionalism, transitions of care, and workload in residency training. Acad Med. 2012;87(7):883–888.
- , , , et al. Hospital workload and adverse events. Med Care. 2007;45(5):448–455.
- , . Resident Work Hours, Hospitalist Programs, and Academic Medical Centers. The Hospitalist. Vol Jan/Feb: Society of Hospital Medicine; 2005: http://www.the‐hospitalist.org/details/article/257983/Resident_Work_Hours_Hospitalist_Programs_and_Academic_Medical_Centers.html#. Accessed on August 21, 2012.
- . Hospital stays for children, 2006. Healthcare Cost and Utilization Project. Statistical brief 56. Rockville, MD: Agency for Healthcare Research and Quality; 2008. Available at: http://www.hcup‐us.ahrq.gov/reports/statbriefs/sb56.pdf. Accessed on August 21, 2012
- , , , et al. Implications of the California nurse staffing mandate for other states. Health Serv Res. 2010;45:904–921.
- . Patient safety at ten: unmistakable progress, troubling gaps. Health Aff. 2010;29(1):165–173.
- , , , et al. Patient‐to‐nurse ratios and outcomes of moderately preterm infants. Pediatrics. 2010;125(2):320–326.
- , , , , . Nurse‐staffing levels and the quality of care in hospitals. N Engl J Med. 2002;346(22):1715–1722.
- , , , . Perceptions of educational experience and inpatient workload among pediatric residents. Hosp Pediatr. 2013;3(3):276–284.
Healthcare systems face many clinical and operational challenges in optimizing the quality of patient care across the domains of safety, effectiveness, efficiency, timeliness, patient‐centeredness, and equity.[1] They must also balance staff satisfaction, and in academic settings, the education of trainees. In inpatient settings, the process of care encompasses many microsystems, and clinical outcomes are the result of a combination of endogenous patient factors, the capabilities of clinical staff, as well as the static and dynamic organizational characteristics of the systems delivering care.[2, 3, 4, 5] Static organizational characteristics include hospital type and size, whereas dynamic organizational characteristics include communications between staff, staff fatigue, interruptions in care, and other factors that impact patient care and clinical outcomes (Figure 1).[2] Two major components of healthcare microsystems are workload and workforce.
A principle in operations management describes the need to match capacity (eg, workforce) to demand (eg, workload) to optimize efficiency.[6] This is particularly relevant in healthcare settings, where an excess of workload for the available workforce may negatively impact processes and outcomes of patient care and resident learning. These problems can arise from fatigue and strain from a heavy cognitive load, or from interruptions, distractions, and ineffective communication.[7, 8, 9, 10, 11] Conversely, in addition to being inefficient, an excess of workforce is financially disadvantageous for the hospital and reduces trainees' opportunities for learning.
Workload represents patient demand for clinical resources, including staff time and effort.[5, 12] Its elements include volume, turnover, acuity, and patient variety. Patient volume is measured by census.[12] Turnover refers to the number of admissions, discharges, and transfers in a given time period.[12] Acuity reflects the intensity of patient needs,[12] and variety represents the heterogeneity of those needs. These 4 workload factors are highly variable across locations and highly dynamic, even within a fixed location. Thus, measuring workload to assemble the appropriate workforce is challenging.
Workforce is comprised of clinical and nonclinical staff members who directly or indirectly provide services to patients. In this article, clinicians who obtain histories, conduct physical exams, write admission and progress notes, enter orders, communicate with consultants, and obtain consents are referred to as front‐line ordering clinicians (FLOCs). FLOCs perform activities listed in Table 1. Historically, in teaching hospitals, FLOCs consisted primarily of residents. More recently, FLOCs include nurse practitioners, physician assistants, house physicians, and hospitalists (when providing direct care and not supervising trainees).[13] In academic settings, supervising physicians (eg, senior supervising residents, fellows, or attendings), who are usually on the floor only in a supervisory capacity, may also contribute to FLOC tasks for part of their work time.
| FLOC Responsibilities | FLOC Personnel |
|---|---|
| |
| Admission history and physical exam | Residents |
| Daily interval histories | Nurse practitioners |
| Daily physical exams | Physician assistants |
| Obtaining consents | House physicians |
| Counseling, guidance, and case management | Hospitalists (when not in supervisory role) |
| Performing minor procedures | Fellows (when not in supervisory role) |
| Ordering, performing and interpreting diagnostic tests | Attendings (when not in supervisory role) |
| Writing prescriptions | |
Though matching workforce to workload is essential for hospital efficiency, staff satisfaction, and optimizing patient outcomes, hospitals currently lack a means to measure and match dynamic workload and workforce factors. This is particularly problematic at large children's hospitals, where high volumes of admitted patients stay for short amounts of time (less than 2 or 3 days).[14] This frequent turnover contributes significantly to workload. We sought to address this issue as part of a larger effort to redefine the care model at our urban, tertiary care children's hospital. This article describes our work to develop and obtain consensus for use of a tool to dynamically match FLOC workforce to clinical workload in a variety of inpatient settings.
METHODS
We undertook an iterative, multidisciplinary approach to develop the Care Model Matrix tool (Figure 2). The process involved literature reviews,[2, 3, 4, 5, 6, 7, 8, 9, 10, 11, 12, 13, 14] discussions with clinical leadership, and repeated validation sessions. Our focus was at the level of the patient nursing units, which are the discrete areas in a hospital where patient care is delivered and physician teams are organized. We met with physicians and nurses from every clinical care area at least twice to reach consensus on how to define model inputs, decide how to quantify those inputs for specific microsystems, and to validate whether model outputs seemed consistent with clinicians' experiences on the floors. For example, if the model indicated that a floor was short 1 FLOC during the nighttime period, relevant staff confirmed that this was consistent with their experience.
Quantifying Workload
In quantifying FLOC workload, we focused on 3 elements: volume, turnover, and acuity.[12] Volume is equal to the patient census at a moment in time for a particular floor or unit. Census data were extracted from the hospital's admission‐discharge‐transfer (ADT) system (Epic, Madison, WI). Timestamps for arrival and departure are available for each unit. These data were used to calculate census estimates for intervals of time that corresponded to activities such as rounds, conferences, or sign‐outs, and known variations in patient flow. Intervals for weekdays were: 7 am to 12 pm, 12 pm to 5 pm, 5 pm to 11 pm, and 11 pm to 7 am. Intervals for weekends were: 7 am to 7 pm (daytime), and 7 pm to 7 am (nighttime). Census data for each of the 6 intervals were averaged over 1 year.
In addition to patient volume, discussions with FLOCs highlighted the need to account for inpatients having different levels of need at different points throughout the day. For example, patients require the most attention in the morning, when FLOCs need to coordinate interval histories, conduct exams, enter orders, call consults, and interpret data. In the afternoon and overnight, patients already in beds have relatively fewer needs, especially in nonintensive care unit (ICU) settings. To adjust census data to account for time of day, a time factor was added, with 1 representing the normalized full morning workload (Figure 2, line 5). Based on clinical consensus, this time factor decreased over the course of the day, more so for non‐ICU patients than for ICU patients. For example, a time factor of 0.5 for overnight meant that patients in beds on that unit generated half as much work overnight as those same patients would in the morning when the time factor was set to 1. Multiplication of number of patients and the time factor equals adjusted census workload, which reflects what it felt like for FLOCs to care for that number of patients at that time. Specifically, if there were 20 patients at midnight with a time factor of 0.5, the patients generated a workload equal to 20 0.5=10 workload units (WU), whereas in the morning the same actual number of patients would generate a workload of 20 1=20 WU.
The ADT system was also used to track information about turnover, including number of admissions, discharges, and transfers in or out of each unit during each interval. Each turnover added to the workload count to reflect the work involved in admitting, transferring, or discharging a patient (Figure 2, lines 79). For example, a high‐turnover floor might have 20 patients in beds, with 4 admissions and 4 discharges in a given time period. Based on clinical consensus, it was determined that the work involved in managing each turnover would count as an additional workload element, yielding an adjusted census workload+turnover score of (20 1)+4+4=28 WU. Although only 20 patients would be counted in a static census during this time, the adjusted workload score was 28 WU. Like the time factor, this adjustment helps provide a feels‐like barometer.
Finally, this workload score is multiplied by an acuity factor that considers the intensity of need for patients on a unit (Figure 2, line 11). We stratified acuity based on whether the patient was in a general inpatient unit, a specialty unit, or an ICU, and assigned acuity factors based on observations of differences in intensity between those units. The acuity factor was normalized to 1 for patients on a regular inpatient floor. Specialty care areas were 20% higher (1.2), and ICUs were 40% higher (1.4). These differentials were estimated based on clinician experience and knowledge of current FLOC‐to‐patient and nurse‐to‐patient ratios.
Quantifying Workforce
To quantify workforce, we assumed that each FLOC, regardless of type, would be responsible for the same number of workload units. Limited evidence and research exist regarding ideal workload‐to‐staff ratios for FLOCs. Published literature and hospital experience suggest that the appropriate volume per trainee for non‐ICU inpatient care in medicine and pediatrics is between 6 and 10 patients (not workload units) per trainee.[13, 15, 16, 17, 18] Based on these data, we chose 8 workload units as a reasonable workload allocation per FLOC. This ratio appears in the matrix as a modifiable variable (Figure 2, line 14). We then divided total FLOC workload (Figure 2, line 15) from our workload calculations by 8 to determine total FLOC need (Figure 2, line 16). Because some of the workload captured in total FLOC need would be executed by personnel who are typically classified as non‐FLOCs, such as attendings, fellows, and supervising residents, we quantified the contributions of each of these non‐FLOCs through discussion with clinical leaders from each floor. For example, if an attending physician wrote complete notes on weekends, he or she would be contributing to FLOC work for that location on those days. A 0.2 contribution under attendings would mean that an attending contributed an amount of work equivalent to 20% of a FLOC. We subtracted contributions of non‐FLOCs from the total FLOC need to determine final FLOC need (Figure 2, line 22). Last, we subtracted the actual number of FLOCs assigned to a unit for a specific time period from the final FLOC need to determine the unit‐level FLOC gap at that time (Figure 2, line 24).
RESULTS
The Care Model Matrix compares predicted workforce need and actual workforce assignments, while considering the contributions of non‐FLOCs to FLOC work in various inpatient care settings. Figure 3 shows graphical representations of FLOC staffing models. The green line shows the traditional approach, and the red line shows the dynamic approach using the Care Model Matrix. The dynamic approach better captures variations in workload.
We presented the tool at over 25 meetings in 14 hospital divisions, and received widespread acceptance among physician, nursing, and administrative leadership. In addition, the hospital has used the tool to identify gaps in FLOC coverage and guide hiring and staffing decisions. Each clinical area also used the tool to review staffing for the 2012 academic year. Though a formal evaluation of the tool has not been conducted, feedback from attending physicians and FLOCs has been positive. Specifically, staffing adjustments have increased the available workforce in the afternoons and on weekends, when floors were previously perceived to be understaffed.
DISCUSSION
Hospitals depend upon a large, diverse workforce to manage and care for patients. In any system there will be a threshold at which workload exceeds the available workforce. In healthcare delivery settings, this can harm patient care and resident education.[12, 19] Conversely, a workforce that is larger than necessary is inefficient. If hospitals can define and measure relevant elements to better match workforce to workload, they can avoid under or over supplying staff, and mitigate the risks associated with an overburdened workforce or the waste of unused capacity. It also enables more flexible care models to dynamically match resources to needs.
The Care Model Matrix is a flexible, objective tool that quantifies multidimensional aspects of workload and workforce. With the tool, hospitals can use historic data on census, turnover, and acuity to predict workload and staffing needs at specific time periods. Managers can also identify discrepancies between workload and workforce, and match them more efficiently during the day.
The tool, which uses multiple modifiable variables, can be adapted to a variety of academic and community inpatient settings. Although our sample numbers in Figure 2 represent census, turnover, acuity, and workload‐to‐FLOC ratios at our hospital, other hospitals can adjust the model to reflect their numbers. The flexibility to add new factors as elements of workload or workforce enhances usability. For example, the model can be modified to capture other factors that affect staffing needs such as frequency of handoffs[11] and the staff's level of education or experience.
There are, however, numerous challenges associated with matching FLOC staffing to workload. Although there is a 24‐hour demand for FLOC coverage, unlike nursing, ideal FLOC to patients or workload ratios have not been established. Academic hospitals may experience additional challenges, because trainees have academic responsibilities in addition to clinical roles. Although trainees are included in FLOC counts, they are unavailable during certain didactic times, and their absence may affect the workload balance.
Another challenge associated with dynamically adjusting workforce to workload is that most hospitals do not have extensive flex or surge capacity. One way to address this is to have FLOCs choose days when they will be available as backup for a floor that is experiencing a heavier than expected workload. Similarly, when floors are experiencing a lighter than expected workload, additional FLOCs can be diverted to administrative tasks, to other floors in need of extra capacity, or sent home with the expectation that the day will be made up when the floor is experiencing a heavier workload.
Though the tool provides numerous advantages, there are several limitations to consider. First, the time and acuity factors used in the workload calculation, as well as the non‐FLOC contribution estimates and numbers reflecting desired workload per FLOC used in the workforce calculation, are somewhat subjective estimations based on observation and staff consensus. Thus, even though the tool's approach should be generalizable to any hospital, the specific values may not be. Therefore, other hospitals may need to change these values based on their unique situations. It is also worth noting that the flexibility of the tool presents both a virtue and potential vice. Those using the tool must agree upon a standard to define units so inconsistent definitions do not introduce unjustified discrepancies in workload. Second, the current tool does not consider the costs and benefits of different staffing approaches. Different types of FLOCs may handle workload differently, so an ideal combination of FLOC types should be considered in future studies. Third, although this work focused on matching FLOCs to workload, the appropriate matching of other workforce members is also essential to maximizing efficiency and patient care. Finally, because the tool has not yet been tested against outcomes, adhering to the tool's suggested ratios cannot necessary guarantee optimal outcomes in terms of patient care or provider satisfaction. Rather, the tool is designed to detect mismatches of workload and workforce based on desired workload levels, defined through local consensus.
CONCLUSION
We sought to develop a tool that quantifies workload and workforce to help our freestanding children's hospital predict and plan for future staffing needs. We created a tool that is objective and flexible, and can be applied to a variety of academic and community inpatient settings to identify mismatches of workload and workforce at discrete time intervals. However, given that the tool's recommendations are sensitive to model inputs that are based on local consensus, further research is necessary to test the validity and generalizability of the tool in various settings. Model inputs may need to be calibrated over time to maximize the tool's usefulness in a particular setting. Further study is also needed to determine how the tool directly impacts patient and provider satisfaction and the quality of care delivered.
Acknowledgements
The authors acknowledge the dozens of physicians and nurses for their involvement in the development of the Care Model Matrix through repeated meetings and dialog. The authors thank Sheyla Medina, Lawrence Chang, and Jennifer Jonas for their assistance in the production of this article.
Disclosures: Internal funds from The Children's Hospital of Philadelphia supported the conduct of this work. The authors have no financial interests, relationships, affiliations, or potential conflicts of interest relevant to the subject matter or materials discussed in the manuscript to disclose.
- . A user's manual for the IOM's “quality chasm” report. Health Aff. 2002;21(3):80–90.
- . Human error: models and management. BMJ. 2000;320(7237):768–770.
- , . Knowledge for Improvement: Improving Quality in the Micro‐systems of Care. in Providing Quality of Care in a Cost‐Focused Environment, Goldfield N, Nach DB (eds.), Gaithersburg, Maryland: Aspen Publishers, Inc. 1999;75–88.
- World Alliance For Patient Safety Drafting Group1, , , , et al. Towards an International Classification for Patient Safety: the conceptual framework. Int J Qual Health Care. F2009;21(1):2–8.
- , . Impact of workload on service time and patient safety: an econometric analysis of hospital operations. Manage Sci. 2009;55(9):1486–1498.
- , . Matching Supply With Demand: An Introduction to Operations Management. New York, NY: McGraw‐Hill; 2006.
- , . Operational failures and interruptions in hospital nursing. Health Serv Res. 2006;41:643–662.
- , , , , . Association of interruptions with an increased risk and severity of medication administration errors. Arch Intern Med. 2010;170(8):683–690.
- . The impact of fatigue on patient safety. Pediatr Clin North Am. 2006;53(6):1135–1153.
- , , , , . Effects of hospital care environment on patient mortality and nurse outcomes. J Nurs Adm. 2009;39(7/8):S45–S51.
- , , , , , . Perspective: beyond counting hours: the importance of supervision, professionalism, transitions of care, and workload in residency training. Acad Med. 2012;87(7):883–888.
- , , , et al. Hospital workload and adverse events. Med Care. 2007;45(5):448–455.
- , . Resident Work Hours, Hospitalist Programs, and Academic Medical Centers. The Hospitalist. Vol Jan/Feb: Society of Hospital Medicine; 2005: http://www.the‐hospitalist.org/details/article/257983/Resident_Work_Hours_Hospitalist_Programs_and_Academic_Medical_Centers.html#. Accessed on August 21, 2012.
- . Hospital stays for children, 2006. Healthcare Cost and Utilization Project. Statistical brief 56. Rockville, MD: Agency for Healthcare Research and Quality; 2008. Available at: http://www.hcup‐us.ahrq.gov/reports/statbriefs/sb56.pdf. Accessed on August 21, 2012
- , , , et al. Implications of the California nurse staffing mandate for other states. Health Serv Res. 2010;45:904–921.
- . Patient safety at ten: unmistakable progress, troubling gaps. Health Aff. 2010;29(1):165–173.
- , , , et al. Patient‐to‐nurse ratios and outcomes of moderately preterm infants. Pediatrics. 2010;125(2):320–326.
- , , , , . Nurse‐staffing levels and the quality of care in hospitals. N Engl J Med. 2002;346(22):1715–1722.
- , , , . Perceptions of educational experience and inpatient workload among pediatric residents. Hosp Pediatr. 2013;3(3):276–284.
