User login
Few today deny the importance of the Hospital Consumer Assessment of Healthcare Providers and Systems (HCAHPS) survey.[1, 2] The Centers for Medicare and Medicaid Services' (CMS) Value Based Purchasing incentive, sympathy for the ill, and relationships between the patient experience and quality of care provide sufficient justification.[3, 4] How to improve the experience scores is not well understood. The national scores have improved only modestly over the past 3 years.[5, 6]
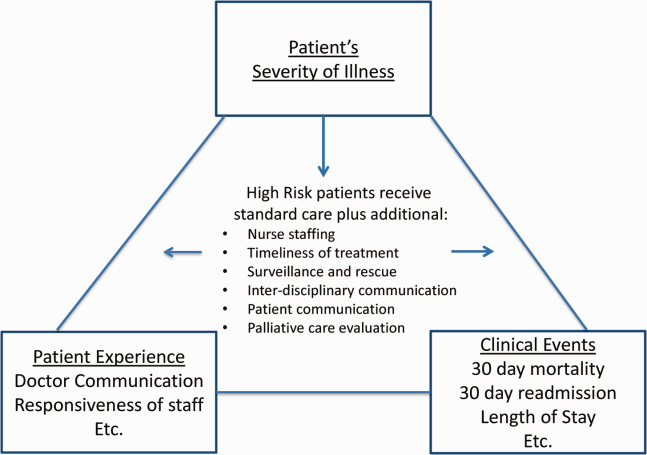
Clinicians may not typically compartmentalize what they do to improve outcomes versus the patient experience. A possible source for new improvement strategies is to understand the types of patients in which both adverse outcomes and suboptimal experiences are likely to occur, then redesign the multidisciplinary care processes to address both concurrently.[7] Previous studies support the existence of a relationship between a higher mortality risk on admission and subsequent worse outcomes, as well as a relationship between worse outcomes and lower HCAHPS scores.[8, 9, 10, 11, 12, 13] We hypothesized the mortality risk on admission, patient experience, and outcomes might share a triad relationship (Figure 1). In this article we explore the third edge of this triangle, the association between the mortality risk on admission and the subsequent patient experience.
METHODS
We studied HCAHPS from 5 midwestern US hospitals having 113, 136, 304, 443, and 537 licensed beds, affiliated with the same multistate healthcare system. HCAHPS telephone surveys were administered via a vendor to a random sample of inpatients 18 years of age or older discharged from January 1, 2012 through June 30, 2014. Per CMS guidelines, surveyed patients must have been discharged alive after a hospital stay of at least 1 night.[14] Patients ineligible to be surveyed included those discharged to skilled nursing facilities or hospice care.[14] Because not all study hospitals provided obstetrical services, we restricted the analyses to medical and surgical respondents. With the permission of the local institutional review board, subjects' survey responses were linked confidentially to their clinical data.
We focused on the 8 dimensions of the care experience used in the CMS Value Based Purchasing program: communication with doctors, communication with nurses, responsiveness of hospital staff, pain management, communication about medicines, discharge information, hospital environment, and an overall rating of the hospital.[2] Following the scoring convention for publicly reported results, we dichotomized the 4‐level Likert scales into the most favorable response possible (always) versus all other responses.[15] Similarly we dichotomized the hospital rating scale at 9 and above for the most favorable response.
Our unit of analysis was an individual hospitalization. Our primary outcome of interest was whether or not the respondent provided the most favorable response for all questions answered within a given domain. For example, for the physician communication domain, the patient must have answered always to each of the 3 questions answered within the domain. This approach is appropriate for learning which patient‐level factors influence the survey responses, but differs from that used for the publically reported domain scores for which the relative performance of hospitals is the focus.[16] For the latter, the hospital was the unit of analysis, and the domain score was basically the average of the percentages of top box scores for the questions within a domain. For example, if 90% respondents from a hospital provided a top box response for courtesy, 80% for listening, and 70% for explanation, the hospital's physician communication score would be (90 + 80 + 70)/3 = 80%.[17]
Our primary explanatory variable was a binary high versus low mortality‐risk status of the respondent on admission based on age, gender, prior hospitalizations, clinical laboratory values, and diagnoses present on admission.[12] The calculated mortality risk was then dichotomized prior to the analysis at a probability of dying equal to 0.07 or higher. This corresponded roughly to the top quintile of predicted risk found in prior studies.[12, 13] During the study period, only 2 of the hospitals had the capability of generating mortality scores in real time, so for this study the mortality risk was calculated retrospectively, using information deemed present on admission.[12]
To estimate the sample size, we assumed that the high‐risk strata contained approximately 13% of respondents, and that the true percent of top box responses from patients in the lower‐risk stratum was approximately 80% for each domain. A meaningful difference in the proportion of most favorable responses was considered as an odds ratio (OR) of 0.75 for high risk versus low risk. A significance level of P < 0.003 was set to control study‐wide type I error due to multiple comparisons. We determined that for each dimension, approximately 8583 survey responses would be required for low‐risk patients and approximately 1116 responses for high‐risk patients to achieve 80% power under these assumptions. We were able to accrue the target number of surveys for all but 3 domains (pain management, communication about medicines, and hospital environment) because of data availability, and because patients are allowed to skip questions that do not apply. Univariate relationships were examined with 2, t test, and Fisher exact tests where indicated. Generalized linear mixed regression models with a logit link were fit to determine the association between patient mortality risk and the top box experience for each of the HCAHPS domains and for the overall rating. The patient's hospital was considered a random intercept to account for the patient‐hospital hierarchy and the unmeasured hospital‐specific practices. The multivariable models controlled for gender plus the HCAHPS patient‐mix adjustment variables of age, education, self‐rated health, language spoken at home, service line, and the number of days elapsed between the date of discharge and date of the survey.[18, 19, 20, 21] In keeping with the industry analyses, a second order interaction variable was included between surgery patients and age.[19] We considered the potential collinearity between the mortality risk status, age, and patient self‐reported health. We found the variance inflation factors were small, so we drew inference from the full multivariable model.
We also performed a post hoc sensitivity analysis to determine if our conclusions were biased due to missing patient responses for the risk‐adjustment variables. Accordingly, we imputed the response level most negatively associated with most HCAHPS domains as previously reported and reran the multivariable models.[19] We did not find a meaningful change in our conclusions (see Supporting Figure 1 in the online version of this article).
RESULTS
The hospitals discharged 152,333 patients during the study period, 39,905 of whom (26.2 %) had a predicted 30‐day mortality risk greater or equal to 0.07 (Table 1). Of the 36,280 high‐risk patients discharged alive, 5901 (16.3%) died in the ensuing 30 days, and 7951 (22%) were readmitted.
| Characteristic | Low‐Risk Stratum, No./Discharged (%) or Mean (SD) | High‐Risk Stratum, No./Discharged (%) or Mean (SD) | P Value* |
|---|---|---|---|
| |||
| Total discharges (row percent) | 112,428/152,333 (74) | 39,905/152,333 (26) | <0.001 |
| Total alive discharges (row percent) | 111,600/147,880 (75) | 36,280/147,880 (25) | <0.001 |
| No. of respondents (row percent) | 14,996/17,509 (86) | 2,513/17,509 (14) | |
| HCAHPS surveys completed | 14,996/111,600 (13) | 2,513/36,280 (7) | < 0.001 |
| Readmissions within 30 days (total discharges) | 12,311/112,428 (11) | 7,951/39,905 (20) | <0.001 |
| Readmissions within 30 days (alive discharges) | 12,311/111,600 (11) | 7,951/36,280 (22) | <0.001 |
| Readmissions within 30 days (respondents) | 1,220/14,996 (8) | 424/2,513 (17) | <0.001 |
| Mean predicted probability of 30‐day mortality (total discharges) | 0.022 (0.018) | 0.200 (0.151) | <0.001 |
| Mean predicted probability of 30‐day mortality (alive discharges) | 0.022 (0.018) | 0.187 (0.136) | <0.001 |
| Mean predicted probability of 30‐day mortality (respondents) | 0.020 (0.017) | 0.151 (0.098) | <0.001 |
| In‐hospital death (total discharges) | 828/112,428 (0.74) | 3,625/39,905 (9) | <0.001 |
| Mortality within 30 days (total discharges) | 2,455/112,428 (2) | 9,526/39,905 (24) | <0.001 |
| Mortality within 30 days (alive discharges) | 1,627/111,600 (1.5) | 5,901/36,280 (16) | <0.001 |
| Mortality within 30 days (respondents) | 9/14,996 (0.06) | 16/2,513 (0.64) | <0.001 |
| Female (total discharges) | 62,681/112,368 (56) | 21,058/39,897 (53) | <0.001 |
| Female (alive discharges) | 62,216/111,540 (56) | 19,164/36,272 (53) | <0.001 |
| Female (respondents) | 8,684/14,996 (58) | 1,318/2,513 (52) | <0.001 |
| Age (total discharges) | 61.3 (16.8) | 78.3 (12.5) | <0.001 |
| Age (alive discharges) | 61.2 (16.8) | 78.4 (12.5) | <0.001 |
| Age (respondents) | 63.1 (15.2) | 76.6 (11.5) | <0.001 |
| Highest education attained | |||
| 8th grade or less | 297/14,996 (2) | 98/2,513 (4) | |
| Some high school | 1,190/14,996 (8) | 267/2,513 (11) | |
| High school grad | 4,648/14,996 (31) | 930/2,513 (37) | <0.001 |
| Some college | 6,338/14,996 (42) | 768/2,513 (31) | |
| 4‐year college grad | 1,502/14,996 (10) | 183/2,513 (7) | |
| Missing response | 1,021/14,996 (7) | 267/2,513 (11) | |
| Language spoken at home | |||
| English | 13,763/14,996 (92) | 2,208/2,513 (88) | |
| Spanish | 56/14,996 (0.37) | 8/2,513 (0.32) | 0.47 |
| Chinese | 153/14,996 (1) | 31/2,513 (1) | |
| Missing response | 1,024/14,996 (7) | 266/2,513 (11) | |
| Self‐rated health | |||
| Excellent | 1,399/14,996 (9) | 114/2,513 (5) | |
| Very good | 3,916/14,996 (26) | 405/2,513 (16) | |
| Good | 4,861/14,996 (32) | 713/2,513 (28) | |
| Fair | 2,900/14,996 (19) | 652/2,513 (26) | <0.001 |
| Poor | 1,065/14,996 (7) | 396/2,513 (16) | |
| Missing response | 855/14,996 (6) | 233/2,513 (9) | |
| Length of hospitalization, d (respondents) | 3.5 (2.8) | 4.6 (3.6) | <0.001 |
| Consulting specialties (respondents) | 1.7 (1.0) | 2.2 (1.3) | <0.001 |
| Service line | |||
| Surgical | 6,380/14,996 (43) | 346/2,513 (14) | <0.001 |
| Medical | 8,616/14,996 (57) | 2,167/2,513 (86) | |
| HCAHPS | |||
| Domain 1: Communication With Doctors | 9,564/14,731 (65) | 1,339/2,462 (54) | <0.001 |
| Domain 2: Communication With Nurses | 10,097/14,991 (67) | 1,531/2,511 (61) | <0.001 |
| Domain 3: Responsiveness of Hospital Staff | 7,813/12,964 (60) | 1,158/2,277 (51) | <0.001 |
| Domain 4: Pain Management | 6,565/10,424 (63) | 786/1,328 (59) | 00.007 |
| Domain 5: Communication About Medicines | 3,769/8,088 (47) | 456/1,143 (40) | <0.001 |
| Domain 6: Discharge Information | 11,331/14,033 (81) | 1,767/2,230 (79) | 0.09 |
| Domain 7: Hospital Environment | 6,981/14,687 (48) | 1,093/2,451 (45) | 0.007 |
| Overall rating | 10,708/14,996 (71) | 1,695/2,513 (67) | <0.001 |
The high‐risk subset was under‐represented in those who completed the HCAHPS survey with 7% (2513/36,280) completing surveys compared to 13% of low‐risk patients (14,996/111,600) (P < 0.0001). Moreover, compared to high‐risk patients who were alive at discharge but did not complete surveys, high‐risk survey respondents were less likely to die within 30 days (16/2513 = 0.64% vs 5885/33,767 = 17.4%, P < 0.0001), and less likely to be readmitted (424/2513 = 16.9% vs 7527/33,767 = 22.3%, P < 0.0001).
On average, high‐risk respondents (compared to low risk) were slightly less likely to be female (52.4% vs 57.9%), less educated (30.6% with some college vs 42.3%), less likely to have been on a surgical service (13.8% vs 42.5%), and less likely to report good or better health (49.0% vs 68.0%, all P < 0.0001). High‐risk respondents were also older (76.6 vs 63.1 years), stayed in the hospital longer (4.6 vs 3.5 days), and received care from more specialties (2.2 vs 1.7 specialties) (all P < 0.0001). High‐risk respondents experienced more 30‐day readmissions (16.9% vs 8.1%) and deaths within 30 days (0.6 % vs 0.1 %, all P < 0.0001) than their low‐risk counterparts.
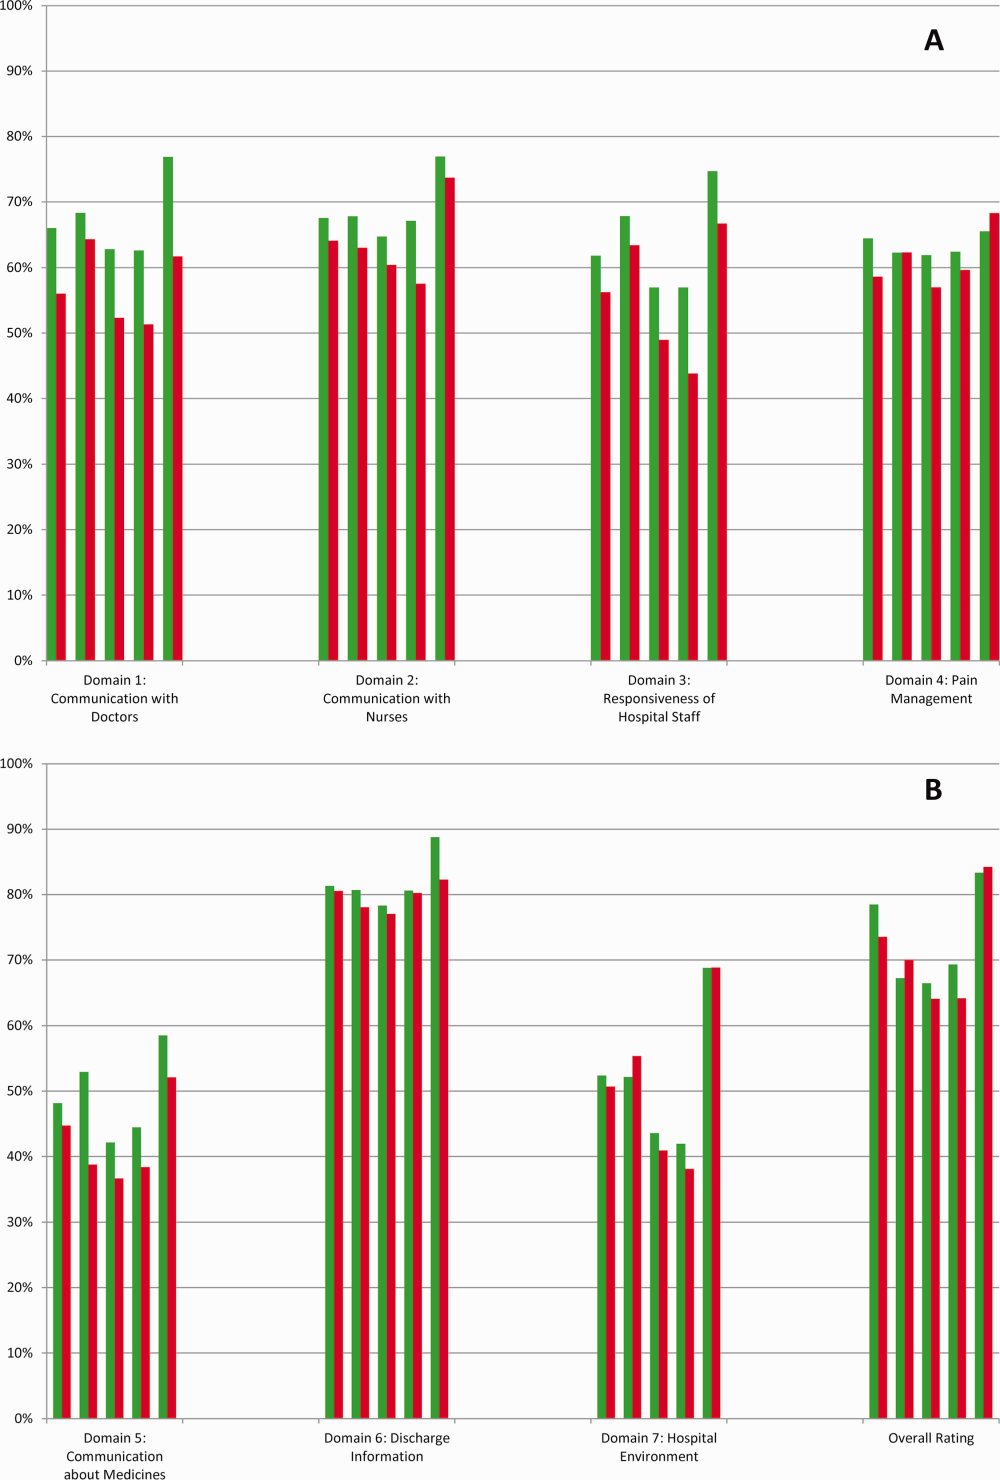
High‐risk respondents were less likely to provide the most favorable response (unadjusted) for all HCAHPS domains compared to low‐risk respondents, although the difference was not significant for discharge information (Table 1, Figure 2A). The gradient between high‐risk and low‐risk patients was seen for all domains within each hospital except for pain management, hospital environment, and overall rating (Figure 3).
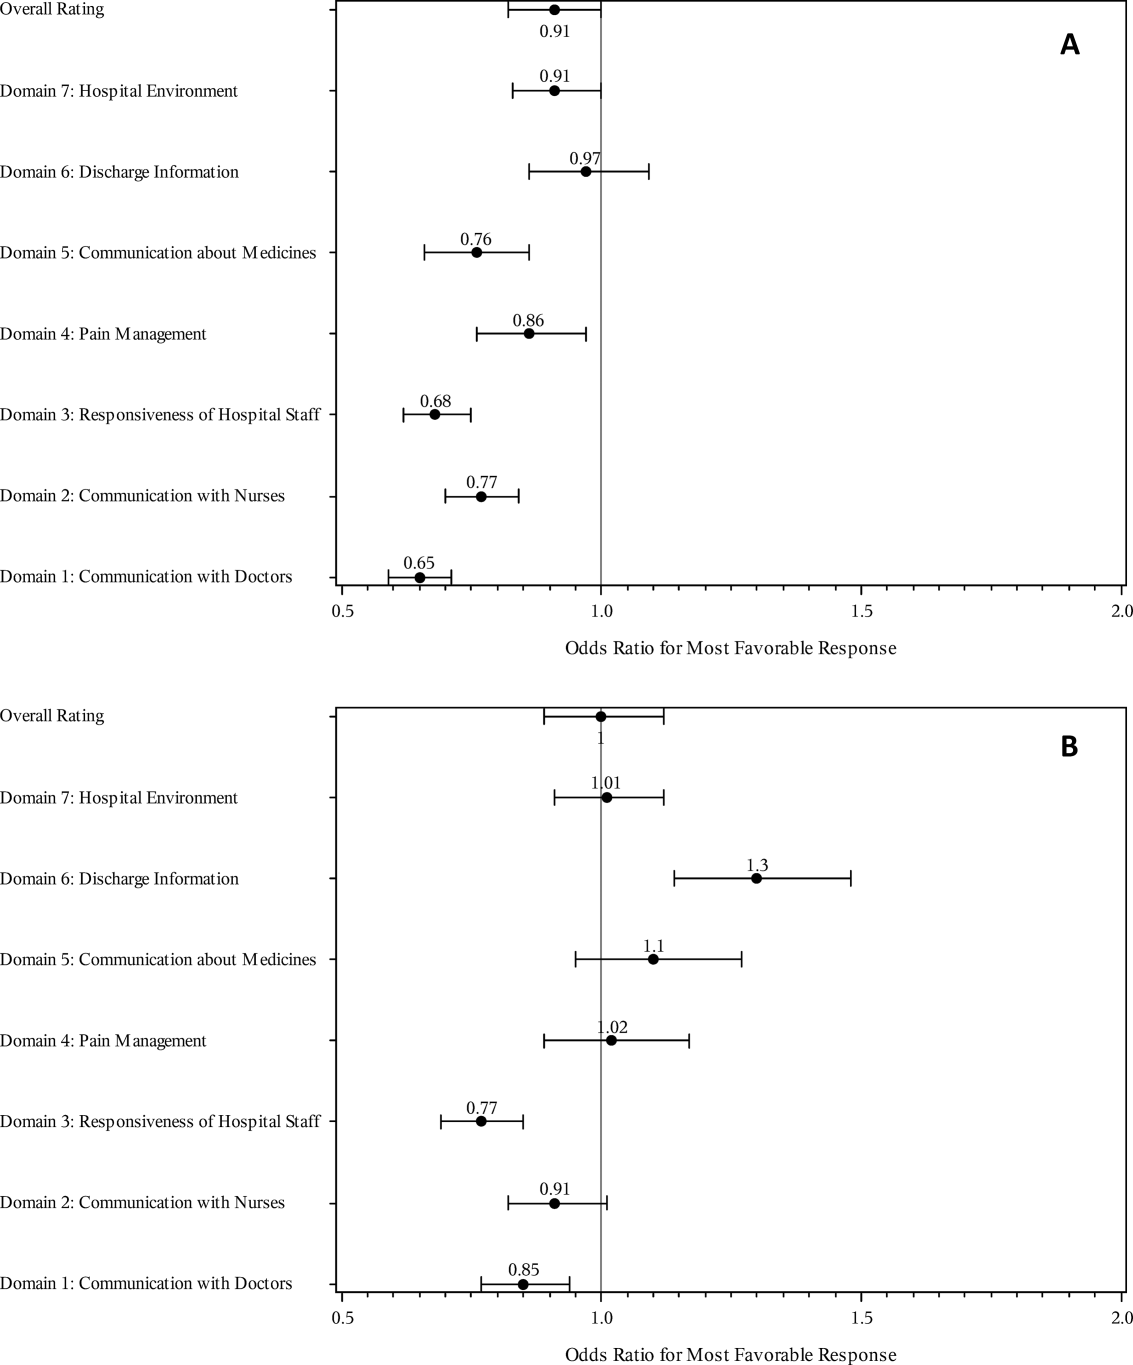
The multivariable regression models examined whether the mortality risk on admission simply represented older medical patients and/or those who considered themselves unhealthy (Figure 2B) (see Supporting Table 1 in the online version of this article). Accounting for hospital, age, gender, language, self‐reported health, educational level, service line, and days elapsed from discharge, respondents in the high‐mortality‐risk stratum were still less likely to report an always experience for doctor communication (OR: 0.85; 95% confidence interval [CI]: 0.77‐0.94) and responsiveness of hospital staff (OR: 0.77; 95% CI: 0.69‐0.85). Higher‐risk patients also tended to have less favorable experiences with nursing communication, although the CI crossed 1 (OR: 0.91; 95% CI: 0.82‐1.01). In contrast, higher‐risk patients were more likely to provide top box responses for having received discharge information (OR: 1.30; 95% CI: 1.14‐1.48). We did not find independent associations between mortality risk and the other domains when the patient risk‐adjustment factors were considered.[18, 19, 20, 21]
DISCUSSION
The high‐mortality‐risk stratum on admission contained a subset of patients who provided less favorable responses for almost all incentivized HCAHPS domains when other risk‐adjustment variables were not taken into consideration (Figure 2A). These univariate relationships weakened when we controlled for gender, the standard HCAHPS risk‐adjustment variables, and individual hospital influences (Figure 2B).[18, 19, 20, 21] After multivariable adjustment, survey respondents in the high‐risk category remained less likely to report their physicians always communicated well and to experience hospital staff responding quickly, but were more likely to report receiving discharge information. We did not find an independent association between the underlying mortality risk and the other incentivized HCAHPS domains after risk adjustment.
We are cautious with initial interpretations of our findings in light of the relatively small number of hospitals studied and the substantial survey response bias of healthier patients. Undoubtedly, the CMS exclusions of patients discharged to hospice or skilled nursing facilities provide a partial explanation for the selection bias, but the experience of those at high risk who did not complete surveys remains conjecture at this point.[14] Previous evidence suggests sicker patients and those with worse experiences are less likely to respond to the HCAHPS survey.[18, 22] On the other hand, it is possible that high‐risk nonrespondents who died could have received better communication and staff responsiveness.[23, 24] We were unable to find a previous, patient‐level study that explicitly tested the association between the admission mortality risk and the subsequent patient experience, yet our findings are consistent with a previous single‐site study of a surgical population showing lower overall ratings from patients with higher Injury Severity Scores.[25]
Our findings provide evidence of complex relationships among admission mortality risk, the 3 domains of the patient experience, and adverse outcomes, at least within the study hospitals (Figure 1). The developing field of palliative care has found very ill patients have special communication needs regarding goals of care, as well as physical symptoms, anxiety, and depression that might prompt more calls for help.[26] If these needs were more important for high‐risk compared to low‐risk patients, and were either not recognized or adequately addressed by the clinical teams at the study hospitals, then the high‐risk patients may have been less likely to perceive their physicians listened and explained things well, or that staff responded promptly to their requests for help.[27] On the other hand, the higher ratings for discharge information suggest the needs of the high‐risk patients were relatively easier to address by current practices at these hospitals. The lack of association between the mortality risk and the other HCAHPS domains may reflect the relatively stronger influence of age, gender, educational level, provider variability, and other unmeasured influences within the study sites, or that the level of patient need was similar among high‐risk and low‐risk patients within these domains.[27]
There are several possible confounders of our observed relationship between mortality risk and HCAHPS scores. The first category of confounders represents patient level variables that might impact the communication scores, some of which are part of the formula of our mortality prediction rule, for example, cognitive impairment and emergent admission.[18, 22, 27] The effect of the mortality risk could also be confounded by unmeasured patient‐level factors such as lower socioeconomic status.[28] A second category of confounders pertains to clinical outcomes and processes of care associated with serious illness irrespective of the risk of dying. More physicians involved in the care of the seriously ill (Table 1) may impact the communication scores, due to the larger opportunity for conflicting or confusing information presented to patients and their families.[29] The longer hospital stays, readmissions, and adverse events of the seriously ill may also underlie the apparent association between mortality risk and HCAHPS scores.[8, 9, 10]
Even if we do not understand precisely if and how the mortality risk might be associated with suboptimal physician communication and staff responsiveness, there may still be some value in considering how these possible relationships could be leveraged to improve patient care. We recall Berwick's insight that every system is perfectly designed to achieve the results it achieves.[7] We have previously argued for the use of mortality‐risk strata to initiate concurrent, multidisciplinary care processes to reduce adverse outcomes.[12, 13] Others have used risk‐based approaches for anticipating clinical deterioration of surgical patients, and determining the intensity of individualized case management services.[30, 31] In this framework, all patients receive a standard set of care processes, but higher‐risk patients receive additional efforts to promote better outcomes. An efficient extension of this approach is to assume patients at risk for adverse outcomes also have additional needs for communication, coordination of specialty care, and timely response to the call button. The admission mortality risk could be used as a determinant for the level of nurse staffing to reduce deaths plus shorten response time to the call button.[32, 33] Hospitalists and specialists could work together on a standard way to conference among themselves for high‐risk patients above that needed for less‐complex cases. Patients in the high‐risk strata could be screened early to see if they might benefit from the involvement of the palliative care team.[26]
Our study has limitations in addition to those already noted. First, our use of the top box as the formulation of the outcome of interest could be challenged. We chose this to be relevant to the Value‐Based Purchasing environment, but other formulations or use of other survey instruments may be needed to tease out the complex relationships we hypothesize. Next, we do not know the extent to which the patients and care processes reflected in our study represent other settings. The literature indicates some hospitals are more effective in providing care for certain subgroups of patients than for others, and that there is substantial regional variation in care intensity that is in turn associated with the patient experience.[29, 34] The mortality‐risk experience relationship for nonstudy hospitals could be weaker or stronger than what we found. Third, many hospitals may not have the capability to generate mortality scores on admission, although more hospitals may be able to do so in the future.[35] Explicit risk strata have the benefit of providing members of the multidisciplinary team with a quick preview of the clinical needs and prognoses of patients in much the way that the term baroque alerts the audience to the genre of music. Still, clinicians in any hospital could attempt to improve outcomes and experience through the use of informal risk assessment during interdisciplinary care rounds or by simply asking the team if they would be surprised if this patient died in the next year.[30, 36] Finally, we do not know if awareness of an experience risk will identify remediable practices that actually improve the experience. Clearly, future studies are needed to answer all of these concerns.
We have provided evidence that a group of patients who were at elevated risk for dying at the time of admission were more likely to have issues with physician communication and staff responsiveness than their lower‐risk counterparts. While we await future studies to confirm these findings, clinical teams can consider whether or not their patients' HCAHPS scores reflect how their system of care addresses the needs of these vulnerable people.
Acknowledgements
The authors thank Steven Lewis for assistance in the interpretation of the HCAHPS scores, Bonita Singal, MD, PhD, for initial statistical consultation, and Frank Smith, MD, for reviewing an earlier version of the manuscript. The authors acknowledge the input of the peer reviewers.
Disclosures: Dr. Cowen and Mr. Kabara had full access to all of the data in the study and take responsibility for the integrity of the data and the accuracy of the data analysis. Study concept and design: all authors. Acquisition, analysis or interpretation of data: all authors. Drafting of the manuscript: Dr. Cowen and Mr. Kabara. Critical revision of the manuscript for important intellectual content: all authors. Statistical analysis: Dr. Cowen and Mr. Kabara. Administrative, technical or material support: Ms. Czerwinski. Study supervision: Dr. Cowen and Ms. Czerwinski. Funding/support: internal. Conflicts of interest disclosures: no potential conflicts reported.
Disclosures
Dr. Cowen and Mr. Kabara had full access to all of the data in the study and take responsibility for the integrity of the data and the accuracy of the data analysis. Study concept and design: all authors. Acquisition, analysis or interpretation of data: all authors. Drafting of the manuscript: Dr. Cowen and Mr. Kabara. Critical revision of the manuscript for important intellectual content: all authors. Statistical analysis: Dr. Cowen and Mr. Kabara. Administrative, technical or material support: Ms. Czerwinski. Study supervision: Dr. Cowen and Ms. Czerwinski. Funding/support: internal. Conflicts of interest disclosures: no potential conflicts reported.
- , , , , . Measuring hospital care from the patients' perspective: an overview of the CAHPS hospital survey development process. Health Serv Res. 2005;40 (6 part 2):1977–1995.
- Centers for Medicare 79(163):49854–50449.
- , , , . The relationship between patients' perception of care and measures of hospital quality and safety. Health Serv Res. 2010;45(4):1024–1040.
- Centers for Medicare 312(7031):619–622.
- , , , , . Relationship between patient satisfaction with inpatient care and hospital readmission within 30 days. Am J Manag Care. 2011;17(1):41–48.
- , , , , , . Getting satisfaction: drivers of surgical Hospital Consumer Assessment of Health care Providers and Systems survey scores. J Surg Res. 2015;197(1):155–161.
- , , . Patient satisfaction and quality of surgical care in US hospitals. Ann Surg. 2015;261(1):2–8.
- , , . Is there a relationship between patient satisfaction and favorable outcomes? Ann Surg. 2014;260(4):592–598; discussion 598–600.
- , , , , . Mortality predictions on admission as a context for organizing care activities. J Hosp Med. 2013;8(5):229–235.
- , , , et al. Implementation of a mortality prediction rule for real‐time decision making: feasibility and validity. J Hosp Med. 2014;9(11):720–726.
- Centers for Medicare 40(6 pt 2):2078–2095.
- Centers for Medicare 44(2 pt 1):501–518.
- Patient‐mix coefficients for October 2015 (1Q14 through 4Q14 discharges) publicly reported HCAHPS Results. Available at: http://www.hcahpsonline.org/Files/October_2015_PMA_Web_Document_a.pdf. Published July 2, 2015. Accessed August 4, 2015.
- , , , , . Case‐mix adjustment of the CAHPS hospital survey. Health Serv Res. 2005;40(6):2162–2181.
- , , , et.al. Gender differences in patients' perceptions of inpatient care. Health Serv Res. 2012;47(4):1482–1501.
- , , , et al. Patterns of unit and item nonresponse in the CAHPS hospital survey. Health Serv Res. 2005;40(6 pt 2):2096–2119.
- , , , . The cost of satisfaction: a national study of patient satisfaction, health care utilization, expenditures, and mortality. Arch Intern Med. 2012;172(5):405–411.
- , , , et al. Care experiences of managed care Medicare enrollees near the end of life. J Am Geriatr Soc. 2013;61(3):407–412.
- , , , , . Measuring satisfaction: factors that drive hospital consumer assessment of healthcare providers and systems survey responses in a trauma and acute care surgery population. Am Surg. 2015;81(5):537–543.
- , . Palliative care for the seriously ill. N Engl J Med. 2015;373(8):747–755.
- , , , et.al. Components of care vary in importance for overall patient‐reported experience by type of hospitalization. Med Care. 2009;47(8):842–849.
- , , , et al. Socioeconomic status, structural and functional measures of social support, and mortality: the British Whitehall II cohort study, 1985–2009. Am J Epidemiol. 2012;175(12):1275–1283.
- , , , et al. Inpatient care intensity and patients' ratings of their hospital experiences. Health Aff (Millwood). 2009;28(1):103–112.
- , , , et al. A validated value‐based model to improve hospital‐wide perioperative outcomes. Ann Surg. 2010;252(3):486–498.
- , , , et al. Allocating scare resources in real‐time to reduce heart failure readmissions: a prospective, controlled study. BMJ Qual Saf. 2013;22(12):998–1005.
- , , , . Patients' perception of hospital care in the United States. N Engl J Med. 2008;359(18):1921–1931.
- , , , , , . Nurse staffing and inpatient hospital mortality. N Engl J Med. 2011;364(11):1037–1045.
- , , , et al. Do hospitals rank differently on HCAHPS for different patient subgroups? Med Care Res Rev. 2010;67(1):56–73.
- , , , , , . Risk‐adjusting hospital inpatient mortality using automated inpatient, outpatient, and laboratory databases. Med Care. 2008;46(3):232–239.
- , , , et al. Utility of the “surprise” question to identify dialysis patients with high mortality. Clin J Am Soc Nephrol. 2008;3(5):1379–1384.
Few today deny the importance of the Hospital Consumer Assessment of Healthcare Providers and Systems (HCAHPS) survey.[1, 2] The Centers for Medicare and Medicaid Services' (CMS) Value Based Purchasing incentive, sympathy for the ill, and relationships between the patient experience and quality of care provide sufficient justification.[3, 4] How to improve the experience scores is not well understood. The national scores have improved only modestly over the past 3 years.[5, 6]
Clinicians may not typically compartmentalize what they do to improve outcomes versus the patient experience. A possible source for new improvement strategies is to understand the types of patients in which both adverse outcomes and suboptimal experiences are likely to occur, then redesign the multidisciplinary care processes to address both concurrently.[7] Previous studies support the existence of a relationship between a higher mortality risk on admission and subsequent worse outcomes, as well as a relationship between worse outcomes and lower HCAHPS scores.[8, 9, 10, 11, 12, 13] We hypothesized the mortality risk on admission, patient experience, and outcomes might share a triad relationship (Figure 1). In this article we explore the third edge of this triangle, the association between the mortality risk on admission and the subsequent patient experience.
METHODS
We studied HCAHPS from 5 midwestern US hospitals having 113, 136, 304, 443, and 537 licensed beds, affiliated with the same multistate healthcare system. HCAHPS telephone surveys were administered via a vendor to a random sample of inpatients 18 years of age or older discharged from January 1, 2012 through June 30, 2014. Per CMS guidelines, surveyed patients must have been discharged alive after a hospital stay of at least 1 night.[14] Patients ineligible to be surveyed included those discharged to skilled nursing facilities or hospice care.[14] Because not all study hospitals provided obstetrical services, we restricted the analyses to medical and surgical respondents. With the permission of the local institutional review board, subjects' survey responses were linked confidentially to their clinical data.
We focused on the 8 dimensions of the care experience used in the CMS Value Based Purchasing program: communication with doctors, communication with nurses, responsiveness of hospital staff, pain management, communication about medicines, discharge information, hospital environment, and an overall rating of the hospital.[2] Following the scoring convention for publicly reported results, we dichotomized the 4‐level Likert scales into the most favorable response possible (always) versus all other responses.[15] Similarly we dichotomized the hospital rating scale at 9 and above for the most favorable response.
Our unit of analysis was an individual hospitalization. Our primary outcome of interest was whether or not the respondent provided the most favorable response for all questions answered within a given domain. For example, for the physician communication domain, the patient must have answered always to each of the 3 questions answered within the domain. This approach is appropriate for learning which patient‐level factors influence the survey responses, but differs from that used for the publically reported domain scores for which the relative performance of hospitals is the focus.[16] For the latter, the hospital was the unit of analysis, and the domain score was basically the average of the percentages of top box scores for the questions within a domain. For example, if 90% respondents from a hospital provided a top box response for courtesy, 80% for listening, and 70% for explanation, the hospital's physician communication score would be (90 + 80 + 70)/3 = 80%.[17]
Our primary explanatory variable was a binary high versus low mortality‐risk status of the respondent on admission based on age, gender, prior hospitalizations, clinical laboratory values, and diagnoses present on admission.[12] The calculated mortality risk was then dichotomized prior to the analysis at a probability of dying equal to 0.07 or higher. This corresponded roughly to the top quintile of predicted risk found in prior studies.[12, 13] During the study period, only 2 of the hospitals had the capability of generating mortality scores in real time, so for this study the mortality risk was calculated retrospectively, using information deemed present on admission.[12]
To estimate the sample size, we assumed that the high‐risk strata contained approximately 13% of respondents, and that the true percent of top box responses from patients in the lower‐risk stratum was approximately 80% for each domain. A meaningful difference in the proportion of most favorable responses was considered as an odds ratio (OR) of 0.75 for high risk versus low risk. A significance level of P < 0.003 was set to control study‐wide type I error due to multiple comparisons. We determined that for each dimension, approximately 8583 survey responses would be required for low‐risk patients and approximately 1116 responses for high‐risk patients to achieve 80% power under these assumptions. We were able to accrue the target number of surveys for all but 3 domains (pain management, communication about medicines, and hospital environment) because of data availability, and because patients are allowed to skip questions that do not apply. Univariate relationships were examined with 2, t test, and Fisher exact tests where indicated. Generalized linear mixed regression models with a logit link were fit to determine the association between patient mortality risk and the top box experience for each of the HCAHPS domains and for the overall rating. The patient's hospital was considered a random intercept to account for the patient‐hospital hierarchy and the unmeasured hospital‐specific practices. The multivariable models controlled for gender plus the HCAHPS patient‐mix adjustment variables of age, education, self‐rated health, language spoken at home, service line, and the number of days elapsed between the date of discharge and date of the survey.[18, 19, 20, 21] In keeping with the industry analyses, a second order interaction variable was included between surgery patients and age.[19] We considered the potential collinearity between the mortality risk status, age, and patient self‐reported health. We found the variance inflation factors were small, so we drew inference from the full multivariable model.
We also performed a post hoc sensitivity analysis to determine if our conclusions were biased due to missing patient responses for the risk‐adjustment variables. Accordingly, we imputed the response level most negatively associated with most HCAHPS domains as previously reported and reran the multivariable models.[19] We did not find a meaningful change in our conclusions (see Supporting Figure 1 in the online version of this article).
RESULTS
The hospitals discharged 152,333 patients during the study period, 39,905 of whom (26.2 %) had a predicted 30‐day mortality risk greater or equal to 0.07 (Table 1). Of the 36,280 high‐risk patients discharged alive, 5901 (16.3%) died in the ensuing 30 days, and 7951 (22%) were readmitted.
| Characteristic | Low‐Risk Stratum, No./Discharged (%) or Mean (SD) | High‐Risk Stratum, No./Discharged (%) or Mean (SD) | P Value* |
|---|---|---|---|
| |||
| Total discharges (row percent) | 112,428/152,333 (74) | 39,905/152,333 (26) | <0.001 |
| Total alive discharges (row percent) | 111,600/147,880 (75) | 36,280/147,880 (25) | <0.001 |
| No. of respondents (row percent) | 14,996/17,509 (86) | 2,513/17,509 (14) | |
| HCAHPS surveys completed | 14,996/111,600 (13) | 2,513/36,280 (7) | < 0.001 |
| Readmissions within 30 days (total discharges) | 12,311/112,428 (11) | 7,951/39,905 (20) | <0.001 |
| Readmissions within 30 days (alive discharges) | 12,311/111,600 (11) | 7,951/36,280 (22) | <0.001 |
| Readmissions within 30 days (respondents) | 1,220/14,996 (8) | 424/2,513 (17) | <0.001 |
| Mean predicted probability of 30‐day mortality (total discharges) | 0.022 (0.018) | 0.200 (0.151) | <0.001 |
| Mean predicted probability of 30‐day mortality (alive discharges) | 0.022 (0.018) | 0.187 (0.136) | <0.001 |
| Mean predicted probability of 30‐day mortality (respondents) | 0.020 (0.017) | 0.151 (0.098) | <0.001 |
| In‐hospital death (total discharges) | 828/112,428 (0.74) | 3,625/39,905 (9) | <0.001 |
| Mortality within 30 days (total discharges) | 2,455/112,428 (2) | 9,526/39,905 (24) | <0.001 |
| Mortality within 30 days (alive discharges) | 1,627/111,600 (1.5) | 5,901/36,280 (16) | <0.001 |
| Mortality within 30 days (respondents) | 9/14,996 (0.06) | 16/2,513 (0.64) | <0.001 |
| Female (total discharges) | 62,681/112,368 (56) | 21,058/39,897 (53) | <0.001 |
| Female (alive discharges) | 62,216/111,540 (56) | 19,164/36,272 (53) | <0.001 |
| Female (respondents) | 8,684/14,996 (58) | 1,318/2,513 (52) | <0.001 |
| Age (total discharges) | 61.3 (16.8) | 78.3 (12.5) | <0.001 |
| Age (alive discharges) | 61.2 (16.8) | 78.4 (12.5) | <0.001 |
| Age (respondents) | 63.1 (15.2) | 76.6 (11.5) | <0.001 |
| Highest education attained | |||
| 8th grade or less | 297/14,996 (2) | 98/2,513 (4) | |
| Some high school | 1,190/14,996 (8) | 267/2,513 (11) | |
| High school grad | 4,648/14,996 (31) | 930/2,513 (37) | <0.001 |
| Some college | 6,338/14,996 (42) | 768/2,513 (31) | |
| 4‐year college grad | 1,502/14,996 (10) | 183/2,513 (7) | |
| Missing response | 1,021/14,996 (7) | 267/2,513 (11) | |
| Language spoken at home | |||
| English | 13,763/14,996 (92) | 2,208/2,513 (88) | |
| Spanish | 56/14,996 (0.37) | 8/2,513 (0.32) | 0.47 |
| Chinese | 153/14,996 (1) | 31/2,513 (1) | |
| Missing response | 1,024/14,996 (7) | 266/2,513 (11) | |
| Self‐rated health | |||
| Excellent | 1,399/14,996 (9) | 114/2,513 (5) | |
| Very good | 3,916/14,996 (26) | 405/2,513 (16) | |
| Good | 4,861/14,996 (32) | 713/2,513 (28) | |
| Fair | 2,900/14,996 (19) | 652/2,513 (26) | <0.001 |
| Poor | 1,065/14,996 (7) | 396/2,513 (16) | |
| Missing response | 855/14,996 (6) | 233/2,513 (9) | |
| Length of hospitalization, d (respondents) | 3.5 (2.8) | 4.6 (3.6) | <0.001 |
| Consulting specialties (respondents) | 1.7 (1.0) | 2.2 (1.3) | <0.001 |
| Service line | |||
| Surgical | 6,380/14,996 (43) | 346/2,513 (14) | <0.001 |
| Medical | 8,616/14,996 (57) | 2,167/2,513 (86) | |
| HCAHPS | |||
| Domain 1: Communication With Doctors | 9,564/14,731 (65) | 1,339/2,462 (54) | <0.001 |
| Domain 2: Communication With Nurses | 10,097/14,991 (67) | 1,531/2,511 (61) | <0.001 |
| Domain 3: Responsiveness of Hospital Staff | 7,813/12,964 (60) | 1,158/2,277 (51) | <0.001 |
| Domain 4: Pain Management | 6,565/10,424 (63) | 786/1,328 (59) | 00.007 |
| Domain 5: Communication About Medicines | 3,769/8,088 (47) | 456/1,143 (40) | <0.001 |
| Domain 6: Discharge Information | 11,331/14,033 (81) | 1,767/2,230 (79) | 0.09 |
| Domain 7: Hospital Environment | 6,981/14,687 (48) | 1,093/2,451 (45) | 0.007 |
| Overall rating | 10,708/14,996 (71) | 1,695/2,513 (67) | <0.001 |
The high‐risk subset was under‐represented in those who completed the HCAHPS survey with 7% (2513/36,280) completing surveys compared to 13% of low‐risk patients (14,996/111,600) (P < 0.0001). Moreover, compared to high‐risk patients who were alive at discharge but did not complete surveys, high‐risk survey respondents were less likely to die within 30 days (16/2513 = 0.64% vs 5885/33,767 = 17.4%, P < 0.0001), and less likely to be readmitted (424/2513 = 16.9% vs 7527/33,767 = 22.3%, P < 0.0001).
On average, high‐risk respondents (compared to low risk) were slightly less likely to be female (52.4% vs 57.9%), less educated (30.6% with some college vs 42.3%), less likely to have been on a surgical service (13.8% vs 42.5%), and less likely to report good or better health (49.0% vs 68.0%, all P < 0.0001). High‐risk respondents were also older (76.6 vs 63.1 years), stayed in the hospital longer (4.6 vs 3.5 days), and received care from more specialties (2.2 vs 1.7 specialties) (all P < 0.0001). High‐risk respondents experienced more 30‐day readmissions (16.9% vs 8.1%) and deaths within 30 days (0.6 % vs 0.1 %, all P < 0.0001) than their low‐risk counterparts.
High‐risk respondents were less likely to provide the most favorable response (unadjusted) for all HCAHPS domains compared to low‐risk respondents, although the difference was not significant for discharge information (Table 1, Figure 2A). The gradient between high‐risk and low‐risk patients was seen for all domains within each hospital except for pain management, hospital environment, and overall rating (Figure 3).
The multivariable regression models examined whether the mortality risk on admission simply represented older medical patients and/or those who considered themselves unhealthy (Figure 2B) (see Supporting Table 1 in the online version of this article). Accounting for hospital, age, gender, language, self‐reported health, educational level, service line, and days elapsed from discharge, respondents in the high‐mortality‐risk stratum were still less likely to report an always experience for doctor communication (OR: 0.85; 95% confidence interval [CI]: 0.77‐0.94) and responsiveness of hospital staff (OR: 0.77; 95% CI: 0.69‐0.85). Higher‐risk patients also tended to have less favorable experiences with nursing communication, although the CI crossed 1 (OR: 0.91; 95% CI: 0.82‐1.01). In contrast, higher‐risk patients were more likely to provide top box responses for having received discharge information (OR: 1.30; 95% CI: 1.14‐1.48). We did not find independent associations between mortality risk and the other domains when the patient risk‐adjustment factors were considered.[18, 19, 20, 21]
DISCUSSION
The high‐mortality‐risk stratum on admission contained a subset of patients who provided less favorable responses for almost all incentivized HCAHPS domains when other risk‐adjustment variables were not taken into consideration (Figure 2A). These univariate relationships weakened when we controlled for gender, the standard HCAHPS risk‐adjustment variables, and individual hospital influences (Figure 2B).[18, 19, 20, 21] After multivariable adjustment, survey respondents in the high‐risk category remained less likely to report their physicians always communicated well and to experience hospital staff responding quickly, but were more likely to report receiving discharge information. We did not find an independent association between the underlying mortality risk and the other incentivized HCAHPS domains after risk adjustment.
We are cautious with initial interpretations of our findings in light of the relatively small number of hospitals studied and the substantial survey response bias of healthier patients. Undoubtedly, the CMS exclusions of patients discharged to hospice or skilled nursing facilities provide a partial explanation for the selection bias, but the experience of those at high risk who did not complete surveys remains conjecture at this point.[14] Previous evidence suggests sicker patients and those with worse experiences are less likely to respond to the HCAHPS survey.[18, 22] On the other hand, it is possible that high‐risk nonrespondents who died could have received better communication and staff responsiveness.[23, 24] We were unable to find a previous, patient‐level study that explicitly tested the association between the admission mortality risk and the subsequent patient experience, yet our findings are consistent with a previous single‐site study of a surgical population showing lower overall ratings from patients with higher Injury Severity Scores.[25]
Our findings provide evidence of complex relationships among admission mortality risk, the 3 domains of the patient experience, and adverse outcomes, at least within the study hospitals (Figure 1). The developing field of palliative care has found very ill patients have special communication needs regarding goals of care, as well as physical symptoms, anxiety, and depression that might prompt more calls for help.[26] If these needs were more important for high‐risk compared to low‐risk patients, and were either not recognized or adequately addressed by the clinical teams at the study hospitals, then the high‐risk patients may have been less likely to perceive their physicians listened and explained things well, or that staff responded promptly to their requests for help.[27] On the other hand, the higher ratings for discharge information suggest the needs of the high‐risk patients were relatively easier to address by current practices at these hospitals. The lack of association between the mortality risk and the other HCAHPS domains may reflect the relatively stronger influence of age, gender, educational level, provider variability, and other unmeasured influences within the study sites, or that the level of patient need was similar among high‐risk and low‐risk patients within these domains.[27]
There are several possible confounders of our observed relationship between mortality risk and HCAHPS scores. The first category of confounders represents patient level variables that might impact the communication scores, some of which are part of the formula of our mortality prediction rule, for example, cognitive impairment and emergent admission.[18, 22, 27] The effect of the mortality risk could also be confounded by unmeasured patient‐level factors such as lower socioeconomic status.[28] A second category of confounders pertains to clinical outcomes and processes of care associated with serious illness irrespective of the risk of dying. More physicians involved in the care of the seriously ill (Table 1) may impact the communication scores, due to the larger opportunity for conflicting or confusing information presented to patients and their families.[29] The longer hospital stays, readmissions, and adverse events of the seriously ill may also underlie the apparent association between mortality risk and HCAHPS scores.[8, 9, 10]
Even if we do not understand precisely if and how the mortality risk might be associated with suboptimal physician communication and staff responsiveness, there may still be some value in considering how these possible relationships could be leveraged to improve patient care. We recall Berwick's insight that every system is perfectly designed to achieve the results it achieves.[7] We have previously argued for the use of mortality‐risk strata to initiate concurrent, multidisciplinary care processes to reduce adverse outcomes.[12, 13] Others have used risk‐based approaches for anticipating clinical deterioration of surgical patients, and determining the intensity of individualized case management services.[30, 31] In this framework, all patients receive a standard set of care processes, but higher‐risk patients receive additional efforts to promote better outcomes. An efficient extension of this approach is to assume patients at risk for adverse outcomes also have additional needs for communication, coordination of specialty care, and timely response to the call button. The admission mortality risk could be used as a determinant for the level of nurse staffing to reduce deaths plus shorten response time to the call button.[32, 33] Hospitalists and specialists could work together on a standard way to conference among themselves for high‐risk patients above that needed for less‐complex cases. Patients in the high‐risk strata could be screened early to see if they might benefit from the involvement of the palliative care team.[26]
Our study has limitations in addition to those already noted. First, our use of the top box as the formulation of the outcome of interest could be challenged. We chose this to be relevant to the Value‐Based Purchasing environment, but other formulations or use of other survey instruments may be needed to tease out the complex relationships we hypothesize. Next, we do not know the extent to which the patients and care processes reflected in our study represent other settings. The literature indicates some hospitals are more effective in providing care for certain subgroups of patients than for others, and that there is substantial regional variation in care intensity that is in turn associated with the patient experience.[29, 34] The mortality‐risk experience relationship for nonstudy hospitals could be weaker or stronger than what we found. Third, many hospitals may not have the capability to generate mortality scores on admission, although more hospitals may be able to do so in the future.[35] Explicit risk strata have the benefit of providing members of the multidisciplinary team with a quick preview of the clinical needs and prognoses of patients in much the way that the term baroque alerts the audience to the genre of music. Still, clinicians in any hospital could attempt to improve outcomes and experience through the use of informal risk assessment during interdisciplinary care rounds or by simply asking the team if they would be surprised if this patient died in the next year.[30, 36] Finally, we do not know if awareness of an experience risk will identify remediable practices that actually improve the experience. Clearly, future studies are needed to answer all of these concerns.
We have provided evidence that a group of patients who were at elevated risk for dying at the time of admission were more likely to have issues with physician communication and staff responsiveness than their lower‐risk counterparts. While we await future studies to confirm these findings, clinical teams can consider whether or not their patients' HCAHPS scores reflect how their system of care addresses the needs of these vulnerable people.
Acknowledgements
The authors thank Steven Lewis for assistance in the interpretation of the HCAHPS scores, Bonita Singal, MD, PhD, for initial statistical consultation, and Frank Smith, MD, for reviewing an earlier version of the manuscript. The authors acknowledge the input of the peer reviewers.
Disclosures: Dr. Cowen and Mr. Kabara had full access to all of the data in the study and take responsibility for the integrity of the data and the accuracy of the data analysis. Study concept and design: all authors. Acquisition, analysis or interpretation of data: all authors. Drafting of the manuscript: Dr. Cowen and Mr. Kabara. Critical revision of the manuscript for important intellectual content: all authors. Statistical analysis: Dr. Cowen and Mr. Kabara. Administrative, technical or material support: Ms. Czerwinski. Study supervision: Dr. Cowen and Ms. Czerwinski. Funding/support: internal. Conflicts of interest disclosures: no potential conflicts reported.
Disclosures
Dr. Cowen and Mr. Kabara had full access to all of the data in the study and take responsibility for the integrity of the data and the accuracy of the data analysis. Study concept and design: all authors. Acquisition, analysis or interpretation of data: all authors. Drafting of the manuscript: Dr. Cowen and Mr. Kabara. Critical revision of the manuscript for important intellectual content: all authors. Statistical analysis: Dr. Cowen and Mr. Kabara. Administrative, technical or material support: Ms. Czerwinski. Study supervision: Dr. Cowen and Ms. Czerwinski. Funding/support: internal. Conflicts of interest disclosures: no potential conflicts reported.
- , , , , . Measuring hospital care from the patients' perspective: an overview of the CAHPS hospital survey development process. Health Serv Res. 2005;40 (6 part 2):1977–1995.
- Centers for Medicare 79(163):49854–50449.
- , , , . The relationship between patients' perception of care and measures of hospital quality and safety. Health Serv Res. 2010;45(4):1024–1040.
- Centers for Medicare 312(7031):619–622.
- , , , , . Relationship between patient satisfaction with inpatient care and hospital readmission within 30 days. Am J Manag Care. 2011;17(1):41–48.
- , , , , , . Getting satisfaction: drivers of surgical Hospital Consumer Assessment of Health care Providers and Systems survey scores. J Surg Res. 2015;197(1):155–161.
- , , . Patient satisfaction and quality of surgical care in US hospitals. Ann Surg. 2015;261(1):2–8.
- , , . Is there a relationship between patient satisfaction and favorable outcomes? Ann Surg. 2014;260(4):592–598; discussion 598–600.
- , , , , . Mortality predictions on admission as a context for organizing care activities. J Hosp Med. 2013;8(5):229–235.
- , , , et al. Implementation of a mortality prediction rule for real‐time decision making: feasibility and validity. J Hosp Med. 2014;9(11):720–726.
- Centers for Medicare 40(6 pt 2):2078–2095.
- Centers for Medicare 44(2 pt 1):501–518.
- Patient‐mix coefficients for October 2015 (1Q14 through 4Q14 discharges) publicly reported HCAHPS Results. Available at: http://www.hcahpsonline.org/Files/October_2015_PMA_Web_Document_a.pdf. Published July 2, 2015. Accessed August 4, 2015.
- , , , , . Case‐mix adjustment of the CAHPS hospital survey. Health Serv Res. 2005;40(6):2162–2181.
- , , , et.al. Gender differences in patients' perceptions of inpatient care. Health Serv Res. 2012;47(4):1482–1501.
- , , , et al. Patterns of unit and item nonresponse in the CAHPS hospital survey. Health Serv Res. 2005;40(6 pt 2):2096–2119.
- , , , . The cost of satisfaction: a national study of patient satisfaction, health care utilization, expenditures, and mortality. Arch Intern Med. 2012;172(5):405–411.
- , , , et al. Care experiences of managed care Medicare enrollees near the end of life. J Am Geriatr Soc. 2013;61(3):407–412.
- , , , , . Measuring satisfaction: factors that drive hospital consumer assessment of healthcare providers and systems survey responses in a trauma and acute care surgery population. Am Surg. 2015;81(5):537–543.
- , . Palliative care for the seriously ill. N Engl J Med. 2015;373(8):747–755.
- , , , et.al. Components of care vary in importance for overall patient‐reported experience by type of hospitalization. Med Care. 2009;47(8):842–849.
- , , , et al. Socioeconomic status, structural and functional measures of social support, and mortality: the British Whitehall II cohort study, 1985–2009. Am J Epidemiol. 2012;175(12):1275–1283.
- , , , et al. Inpatient care intensity and patients' ratings of their hospital experiences. Health Aff (Millwood). 2009;28(1):103–112.
- , , , et al. A validated value‐based model to improve hospital‐wide perioperative outcomes. Ann Surg. 2010;252(3):486–498.
- , , , et al. Allocating scare resources in real‐time to reduce heart failure readmissions: a prospective, controlled study. BMJ Qual Saf. 2013;22(12):998–1005.
- , , , . Patients' perception of hospital care in the United States. N Engl J Med. 2008;359(18):1921–1931.
- , , , , , . Nurse staffing and inpatient hospital mortality. N Engl J Med. 2011;364(11):1037–1045.
- , , , et al. Do hospitals rank differently on HCAHPS for different patient subgroups? Med Care Res Rev. 2010;67(1):56–73.
- , , , , , . Risk‐adjusting hospital inpatient mortality using automated inpatient, outpatient, and laboratory databases. Med Care. 2008;46(3):232–239.
- , , , et al. Utility of the “surprise” question to identify dialysis patients with high mortality. Clin J Am Soc Nephrol. 2008;3(5):1379–1384.
