User login
With last month’s publication of the 2012 State of Hospital Medicine report (www.hospitalmedicine.org/survey), we have some fascinating new information about the scheduling choices of HM groups—some of which has never been collected by SHM before.
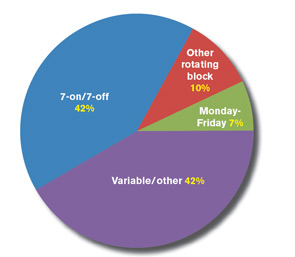
For example, we learned this year that 42% of respondent groups serving adult patients predominantly utilize a schedule of seven days on followed by seven days off (“seven-on, seven-off”), while another 42% use variable/other scheduling patterns. A small minority of groups utilize other types of rotating block schedules (e.g. five-on/five-off) or Monday-Friday schedules. The type of schedule used varies a lot by area of the country, ownership/employment model, and other group characteristics.
Full-time adult medicine hospitalists working shift-based schedules now work a median of 182 shifts, or work periods, annually, down from 188 the last time SHM asked this question in 2005. For doctors working hybrid schedules, including both shifts and on-call duties, the number of shifts declined to 204 from 215 in 2005. During the same period, hospitalists’ annual encounter volume also has declined, though compensation has continued its inexorable rise.
So if the number of shifts worked and patient encounters both have declined since 2005, why do hospitalists feel so much busier today?
Well, for one thing, we learned in this year’s survey that 75% of adult hospitalist groups schedule day shifts of 12 to 13.9 hours in length, while the other 25% use shorter day shifts. About 85% of night shifts are also 12 to 13.9 hours long, while the preponderance of evening/swing shifts fall into either the 10- to 11.9-hour range (45%) or the eight-hours-or-less range (33%). In 2005, the median shift length for all respondents—both adult and pediatric—was 11 hours for groups using shift-based models, and only eight hours for groups using hybrid or other scheduling models. So although this year’s data is not presented in the same way as it was in 2005, it would appear that the typical shift length might have increased some.
In addition, in 2005, only 51% of groups reported having an on-site provider at night. This year, 55% of groups reported having total on-site nighttime coverage, and an additional 28% reported using a combination of on-site and on-call coverage. And the proportion of groups reporting no responsibility for night coverage at all declined to about 1% from 8%. I’m guessing the need to work more nights also contributes to hospitalists’ feelings of increased workload.
Although encounters have decreased, hospitalist wRVUs have risen dramatically. In part, this is due to adjustments in Medicare wRVU values for typical E&M services, but I believe it also is the result of increased patient complexity and/or improved documentation and coding by hospitalists—both of which require more time.
And finally, hospitalists are being asked to do a lot more nonclinical work these days, such as participating in quality-improvement (QI) and patient-flow initiatives, and championing the implementation of electronic health records (EHRs).
All of these factors, and probably others, have combined to make the typical hospitalist’s job much more complex and demanding today than it was in 2005, despite working a few less shifts and have a few less patient encounters annually.
Leslie Flores is SHM senior advisor, practice management.
With last month’s publication of the 2012 State of Hospital Medicine report (www.hospitalmedicine.org/survey), we have some fascinating new information about the scheduling choices of HM groups—some of which has never been collected by SHM before.
For example, we learned this year that 42% of respondent groups serving adult patients predominantly utilize a schedule of seven days on followed by seven days off (“seven-on, seven-off”), while another 42% use variable/other scheduling patterns. A small minority of groups utilize other types of rotating block schedules (e.g. five-on/five-off) or Monday-Friday schedules. The type of schedule used varies a lot by area of the country, ownership/employment model, and other group characteristics.
Full-time adult medicine hospitalists working shift-based schedules now work a median of 182 shifts, or work periods, annually, down from 188 the last time SHM asked this question in 2005. For doctors working hybrid schedules, including both shifts and on-call duties, the number of shifts declined to 204 from 215 in 2005. During the same period, hospitalists’ annual encounter volume also has declined, though compensation has continued its inexorable rise.
So if the number of shifts worked and patient encounters both have declined since 2005, why do hospitalists feel so much busier today?
Well, for one thing, we learned in this year’s survey that 75% of adult hospitalist groups schedule day shifts of 12 to 13.9 hours in length, while the other 25% use shorter day shifts. About 85% of night shifts are also 12 to 13.9 hours long, while the preponderance of evening/swing shifts fall into either the 10- to 11.9-hour range (45%) or the eight-hours-or-less range (33%). In 2005, the median shift length for all respondents—both adult and pediatric—was 11 hours for groups using shift-based models, and only eight hours for groups using hybrid or other scheduling models. So although this year’s data is not presented in the same way as it was in 2005, it would appear that the typical shift length might have increased some.
In addition, in 2005, only 51% of groups reported having an on-site provider at night. This year, 55% of groups reported having total on-site nighttime coverage, and an additional 28% reported using a combination of on-site and on-call coverage. And the proportion of groups reporting no responsibility for night coverage at all declined to about 1% from 8%. I’m guessing the need to work more nights also contributes to hospitalists’ feelings of increased workload.
Although encounters have decreased, hospitalist wRVUs have risen dramatically. In part, this is due to adjustments in Medicare wRVU values for typical E&M services, but I believe it also is the result of increased patient complexity and/or improved documentation and coding by hospitalists—both of which require more time.
And finally, hospitalists are being asked to do a lot more nonclinical work these days, such as participating in quality-improvement (QI) and patient-flow initiatives, and championing the implementation of electronic health records (EHRs).
All of these factors, and probably others, have combined to make the typical hospitalist’s job much more complex and demanding today than it was in 2005, despite working a few less shifts and have a few less patient encounters annually.
Leslie Flores is SHM senior advisor, practice management.