User login
Influenza is a common infectious agent in the pediatric population, infecting 15% to 42% of preschool children, with a fatality rate of 3.8 per 100,000.13 Those with underlying respiratory and cardiac disease are more likely to require hospitalization and more susceptible to morbidity from the disease.47 Trivalent inactivated influenza vaccine is a safe, cost‐effective method of preventing influenza in children, with a seroconversion rate of up to 89%.810 Both the American Academy of Pediatrics and the Advisory Committee on Immunization Practices recommend that the influenza vaccine be administered to household contacts and out‐of‐home caretakers of infants up to 6 months of age.11 Also included in this high‐risk category are children with chronic respiratory and cardiac disease.8
The immunization rate in the indicated pediatric population ranges from 9% to 22%.12 Because most adults who meet eligible criteria are not vaccinated, it has been proposed that the NICU begin to administer the influenza vaccine to parents of high‐risk infants, eliminating commonly encountered obstacles to vaccine administration and preventing infection in these close contacts of infants, who likely serve as infectious agents of disease in the infants.13, 14
Yet the cost of instituting such a program remains a concern, especially given the recent shortages of the inactivated influenza vaccine, which have increased cost.15 The economic implications of instituting an inactivated influenza vaccination program for parents of patients in the NICU have not been fully evaluated. Given that upwards of 40,000 premature infants are admitted to intensive care units each year, an examination of cost savings is critical prior to implementing such a program.16
METHODS
Data and Assumptions
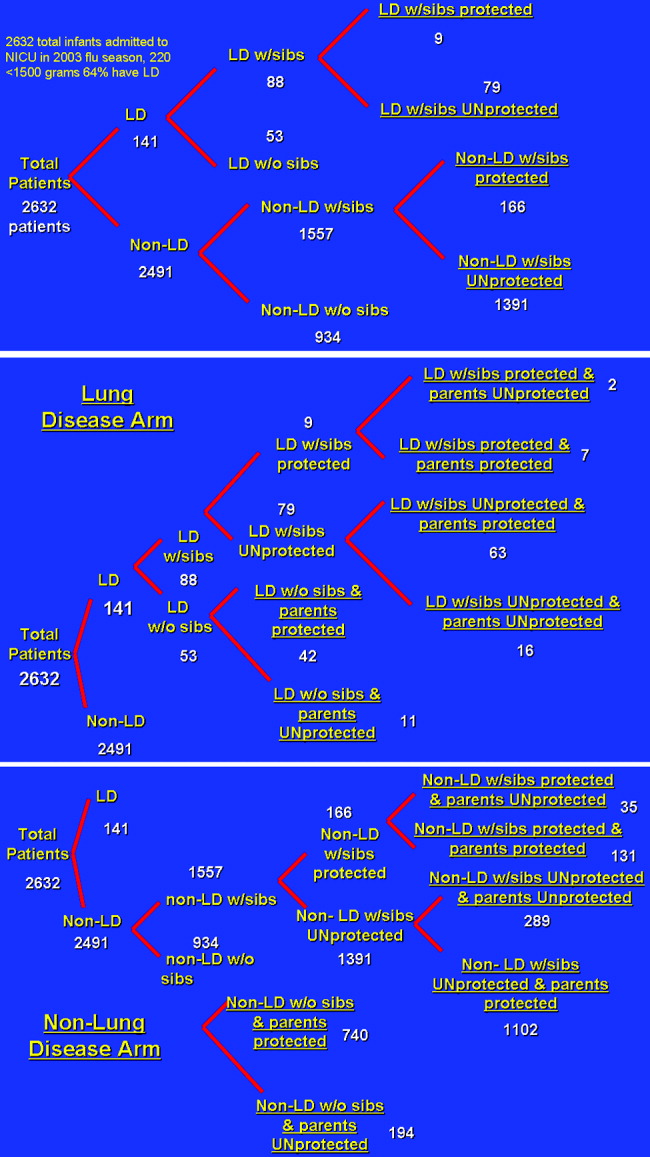
A 3‐ and 4‐tiered computer model (with the tiers reflecting the variables presence of lung disease, having siblings, and sibling immunization status and the fourth tier reflecting parental immunization in the NICU as a function of the immunization program) assessing influenza vaccination status of parents of a cohort of 2632 patients admitted to the New York Regional Perinatal Center NICU during the influenza season of 2003‐2004 was constructed using the viewpoint of a large multinetwork medical center predominantly serving a lower socioeconomic status population. The likelihood of influenza infection of an infant, the need for infant hospitalization, subsequent length of stay, and the need for the patient to have outpatient physician visits were based on the following clinical variables: lung disease in the infant (defined as a 28‐day‐old patient whose birth weight was less than 1500 g being oxygen dependent); having school‐age siblings, sibling vaccination status; parental vaccination status; and parental compliance. Variables of the model were based on published results when possible. For the purposes of this model, we assumed a 10% reduction in influenza infectivity for parents of children who were immunized in the absence of other confounders based on the risk of needing medical attention of children less than 6 months old for documented influenza with parental vaccination in the 9 states that make up the Emerging Infections Program Network of the Centers for Disease Control.1719 Infected patients younger than 6 months of age were also programmed to have a 10% chance of an outpatient hospitalization visit. No deaths were introduced in the cohort. An outline of the different groups into which patients were classified (before and after the influenza vaccination campaign) is outlined in Figure 1.

Direct Costs
Medical Costs
The average wholesale cost of a dose of influenza vaccine including administration was $15.20 Each parent received 1 dose of influenza vaccine administered during the influenza season (the 5 months from October thru February). In our model, the vaccine is administered by nurses, physicians, or physician‐extenders in a neonatal intensive care unit and thus does not require increased personnel to support the program. Hence, no increased costs were included for administration of the vaccine.
Siblings were not offered immunization in the NICU program. Most NICUs do not allow children younger than 13 years to visit during influenza and respiratory syncytial virus season to prevent infection of newborns. Immunization of younger siblings requires prior knowledge of their vaccination status, as those previously immunized require 1 dose of vaccine, whereas those less than 9 years old not immunized require 2 doses scheduled 1 month apart. As this was considered logistically difficult for a high‐acuity NICU, sibling immunization was deferred to that sibling's primary medical doctor, a policy consistent with that of the American Academy of Pediatrics Medical Home Initiative.
Infant Hospitalization for Influenza
Cost estimates were obtained from published data on the length of stay of infants with respiratory disease.21 In this series the average length of stay of former NICU patients with low socioeconomic status hospitalized for influenza was 4.5 4 days. Average hospital costs were estimated as $1508/day.22, 23 No intensive care unit days were factored into the current cost model. Hospitalization costs for each group were estimated by (number of infants in each group from the New York Regional Perinatal Center 2004 Database hospitalization rate of each group number of days hospitalized $1508/day). This estimation technique was previously validated and used.21
Intensive care unit cost was estimated as 2.5 times the cost of nonintensive care ($3770/day). Intensive care hospitalization for influenza is difficult to measure, as it correlates with bacterial superinfection, which has an incidence of 0.5/10,000 patients with documented influenza.5 However, in another study, ICU hospitalization of infected patients was 0.5%, which would translate to 13 patients in the studied group.18 The length of ICU stay was 1 day, and by univariate analysis, bacterial coinfection was again the highest predictor of ICU admission. These patients were admitted because positive results of outpatient blood cultures, signs of shock, and influenza were noted until several days into the hospitalization and may have been nosocomial in origin.18 Thus, costs are reported in the tables without intensive care unit stays for the 13 patients who may have required them in the model. But to acknowledge the role ICU admission plays in deferring costs, 2 cost‐estimate graphs were generated, 1 including ICU admission.
Outpatient Costs
For patients in each cohort who were unprotected from influenza because of parental or sibling immunization, a 10% increase in the number of outpatient medical visits was considered. Outpatient costs were tallied on the basis of average general pediatrician's salary of $68/hour.23 Duration of outpatient visits was estimated as 20 minutes with no accounting for extra nursing time. Hence, tallies were made by (number of unprotected infants 10% 20 minutes/visit $68/hour 1 hour/60 minutes). As 3% of actual cases of influenza in the group of those less than 6 months old can be misdiagnosed as clinical bacterial pneumonia, prescription costs were estimated as $3.20 for a 7‐day course of generic amoxicillin, which was the only prescribed antibiotic considered.
Indirect Costs
For each outpatient office visit, we used the cost‐estimation scheme outlined by Yount et al.20. We assumed that 1 parent accompanied the infant and 3 hours of lost work should be accounted for. Using the U.S. Bureau of Labor and Statistics 2002 average wage of $17/hour, lost wages for each extra outpatient visits were tabulated by (number of extra MD visits per group 3 hours $17/hour).24 No travel or transportation costs were considered.
Hospitalization
For each hospitalization, we assumed 1 parent stayed with an infant at bedside during the infant's inpatient stay. We calculated the average length of stay for patients with lung disease as 8 days and for those without lung disease as 4.5 days. Calculations were obtained using the following formula: (number of infants in each group from the New York Regional Perinatal Center 2004 Database hospitalization rate of each group number of days hospitalized $17/hour 8 work hours/day 5/7 workdays/week).
Sensitivity Analysis
We evaluated the sensitivity of the model to variations in the assumptions made. We varied the sibling immunization rate from 12% to 17% and the reduction in hospitalization for parents who received influenza vaccine from 10% to 20%. A summary of variables used in the analysis is included in Table 1.
| Compliance of parents offered influenza vaccine | 89% (17) |
| Seroconversion rate of vaccine recipients | 89% (17) |
| Percentage of siblings vaccinated | 12% (12) |
| Excess PMD visits of infected patients | 10% (7) |
| Hospitalization rate of lung disease patients without siblings | 10% (7) |
| Hospitalization rate of lung disease patients with siblings | 15% (7) |
| Length of hospitalization of Lung Disease patients | 8 days (7) |
| Hospitalization rate of nonlung disease patients without siblings | 7/1000 (19) |
| Hospitalization rate of nonlung disease patients with siblings | 19/1000 (19) |
| Length of hospitalization of nonlung disease patients | 4.5 days (19) |
RESULTS
Influenza Costs Prior to Implementation of NICU‐Based Parental Vaccination
Direct and indirect costs of influenza hospitalization of the NICU graduates are summarized in Table 2. The total per‐patient cost of influenza vaccination obtained in the NICU for the 2632 patients in the source data 1 one season was $181.20. NICU patients with lung disease and siblings who were not protected from or immunized for influenza demonstrated the greatest per capita inpatient cost, $1925/patient. Vaccination of patients without lung disease who had no siblings cost $51, the same amount that it cost to vaccinate patients without lung disease who had vaccinated siblings.
| Subgroup type | Cost per patient ($) | Direct costs ($) | Indirect dosts ($) |
|---|---|---|---|
| |||
| Patients with lung disease whose siblings were protected | 1284 | 10,857.60 | 699.42 |
| Patients with lung disease whose siblings were unprotected | 1925 | 142,958.40 | 9,170.29 |
| Patients with lung disease without siblings | 1284 | 63,939.20 | 4,118.85 |
| Patients without lung disease whose siblings were protected | 51 | 7,885.33 | 507.96 |
| Patients without lung disease whose siblings were unprotected | 137 | 179,347.19 | 11,553.25 |
| Patients without lung disease without siblings | 51 | 44,366.86 | 2,858.04 |
Outpatient costs of influenza hospitalization based on source data revealed summarized costs for 1 season of $6.80/patient. This reflected 245 excess primary care visits at a total cost of $5569.20. The cost of excess prescriptions of the antibiotic amoxicillin because of misdiagnoses. Indirect costs secondary to parent lost work hours while attending to their infants in the hospital totaled $12,530.70. Thus, the total cost of influenza in the source population for 1 season including inpatient, outpatient, direct, and indirect costs was $188/patient.
Influenza Costs after Implementation of an NICU‐Based Parental Vaccination Program
Direct and indirect costs of influenza hospitalization for neonates with lung disease are summarized in Table 3. The introduction of parental vaccination decreased the per‐patient cost in the cohort of patients with lung disease and unprotected siblings to $1732 from $1925. This group showed the largest cost savings compared with the costs for this group prior to introduction of the campaign.
| Subgroup type | Cost/patient ($) | Direct costs ($) | Indirect costs ($) |
|---|---|---|---|
| |||
| Patients with lung disease with protected siblings/unprotected parents | 1283 | 2412.80 | 154.49 |
| Patients with lung disease with protected siblings/protected parents | 1155 | 7600.32 | 486.66 |
| Patients with lung disease with unprotected siblings/protected parents | 1732 (Pre‐1925) | 102,604.32 | 6569.94 |
| Patients with lung disease with unprotected siblings/unprotected parents | 1925 | 28,953.60 | 1853.95 |
| Patients with lung disease without siblings/with protected parents | 1155 | 45,601.92 | 2919.97 |
| Patients with lung disease without siblings/with unprotected parents | 1283 | 13,270.40 | 849.73 |
Direct and indirect costs of influenza hospitalization for infants without lung disease are summarized in Table 4. The introduction of parental vaccination to disrupt the cycle of infectious transmission to infant decreased per‐patient costs in patients whose parents and siblings received vaccinations to $45. This reduction of $6/patient was the greatest savings among all the groups in the cohort without lung disease.
| Subgroup type | Cost/Patient ($) | Direct Costs ($) | Indirect Costs ($) |
|---|---|---|---|
| |||
| Patients without lung disease with protected siblings/unprotected parents | 51 | 1662.57 | 106.45 |
| Patients without lung disease with protected siblings/protected parents | 45 (pre‐51) | 5600.48 | 256.30 |
| Patients without lung disease with unprotected siblings/unprotected parents | 137 | 37,261.92 | 2385.51 |
| Patients without lung disease with unprotected siblings/protected parents | 123 | 127,876.74 | 8168.97 |
| Patients without lung disease without siblings/with protected parents | 45 | 31,215.60 | 1998.79 |
| Patients without lung disease without siblings/with unprotected parents | 51 | 9215.38 | 586.60 |
Outpatient costs were reduced after the introduction of the campaign to $1.40/patient, reflecting the decrease in the number of outpatient visits from 245 to 51. Thus, the total cost of influenza in the source population after the introduction of an NICU‐based parental vaccination campaign was $200/patient. The $193/patient savings in the lung disease cohort with unprotected siblings ($1925 vs. $1732) was not sufficient to cover the increased cost of the vaccine. For this population of 2632 NICU patients, administration of NICU‐based parental influenza cost $12 extra/patient.
Financial Modeling Based on Source Data
Using the financial model, cost per patient was determined using the same estimates of incidence of the variables (ie, lung disease, siblings); only the number of enrollees in the program was varied. The relationship of cost per patient with number of NICU patients is shown in Figure 2. Cost per patient was zero at 4000 patients. Beyond that point, cost savings occurred, increasing with number of NICU admissions.
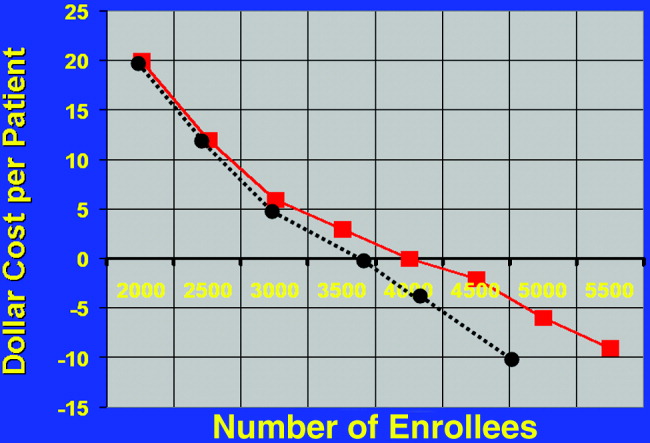
Estimating a 1‐day ICU admission rate of 0.5% at $3770/day reduces the required patient population for costs/patient to zero. This occurs at 3700 patients. Initially there is no added benefit with ICU admission, as the overall patient population is not large enough to support a significant ICU burden. As the population increases to 3000 patients, cost savings begin.
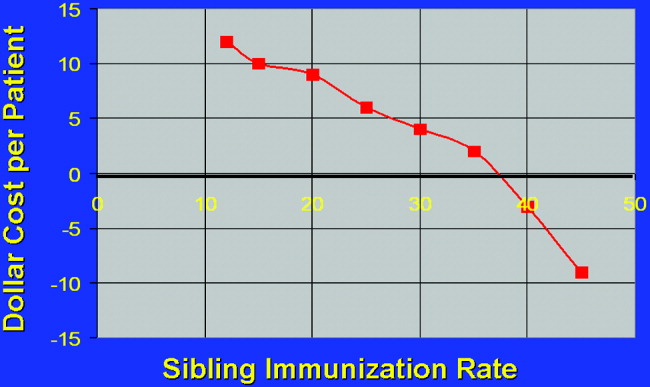
The relationship of variable immunization rates in siblings of the 2632 NICU patients in the source data is presented in Figure 3. Cost savings were not achieved until 37% of siblings had been immunized. A steep reduction in cost was seen as the immunization rate of siblings increased in the cohort. Marginal cost effectiveness was also increased in sibling immunization, meaning greater cost savings is achieved by immunizing a sibling of a high‐risk infant than by immunizing the parents, reflecting that siblings are more likely than parents to be vectors of disease in multichild households.
DISCUSSION
This is the first computer‐based model of the cost effectiveness of offering inactivated influenza vaccine to parents of patients in the NICU for the purpose of preventing illness in their offspring. Based on the source data, the study has demonstrated that offering immunization to parents in the NICU is not cost effective until the NICU population covered is at least 4000 patients. Cost effectiveness can also be reached in smaller populations by increasing the level of sibling immunization. These factors should be considered by public health specialists when mandating administration of influenza vaccine to parents in the NICU setting.
Cost‐effectiveness studies are limited by the variables chosen, by hospitalization rates, and by estimates made. Although we attempted to obtain hospitalization rates based on previously validated, published data, any variation in these rates will alter the cost‐savings model we constructed. For variables affecting the infectivity of and hospitalization for influenza, we chose lung disease, siblings with immunization rate, and parental immunization rate. Other variables, notably day care attendance, were not believed to highly influence infections due to respiratory pathogens.18
Another potential source of error in construction of the model is calculation of indirect costs. Although estimates of lost wages from work hours spent while a patient is hospitalized were calculated as an indirect cost, Leader et al. points out that there are also indirect costs after hospitalization secondary to increased outpatient physician surveillance.25 Furthermore, our model based lost wages on parents of patients earning an average salary of $17/hour. However, our source data represented the Regional Perinatal Center, a consortium of NICUs in New York City serving a primarily uninsured, indigent population. Hence, these estimates of lost wages may be overestimated.
Most cost‐utility analysis studies are performed to help compare public health policy policies across medical disciplines. Most data on adults and on children calculate the cost of quality‐of‐life‐adjusted year. In our study no such calculations were made because influenza was not thought to affect life long term. In other words, quality of life was not thought to be more likely to be affected by the variables NICU admission and birth weight than by the variable influenza infection, and these factors were considered in estimating hospitalization rates. Furthermore, because mortality from influenza is roughly 1 of every 100,000 for children less than 6 months old, no patients in the source data would have died, making quality‐of‐life‐adjusted year difficult to factor.26
Given a limited amount of medical resources, it is imperative to critically evaluate the economic implications of any widespread public health strategy. This cost analysis has demonstrated that the benefits of sponsoring NICU‐based immunization programs for parents will remain low unless the issue of sibling immunization is addressed or the number of patients in the cohort increases to a scale larger than any single traditional NICU may provide.
- ,.Interpandemic influenza in the Houston area, 1974‐1976.N Engl J Med.1978;298:587–592.
- ,,, et al.Burden of interpandemic influenza in children younger than 5 years: a 25‐year prospective study.J Infect Dis.2002;185:147–152.
- .Serious morbidity and mortality associated with influenza epidemics.Epidemiol Rev.1982;4:25–44.
- ,,, et al.Impact of respiratory virus infections on persons with chronic underlying conditions.JAMA.2000;283:499–505.
- ,,, et al.Influenza and the rates of hospitalization for respiratory disease among infants and young children.N Engl J Med.2000;342:232–239.
- ,,.Impact of influenza on morbidity in children with cystic fibrosis.J Paediatr Child Health.1991;27:308–311.
- ,,, et al.The burden of influenza illness in children with asthma and other chronic medical conditions.J Pediatr.2000;137:856–864.
- ,;Committee on Infectious Diseases.Technical report. Reduction of the influenza burden in children.Pediatrics.2002;110:e80. Available at: http://www.pediatrics.org/cgi/content/full/110/6/e80.
- ,,, et al.Clinical reactions and serologic responses after vaccination with while‐virus or split‐virus influenza vaccines in children aged 6 to 36 months.Pediatrics.1982;69:404–408.
- ,.Economic impact of influenza vaccination in preschool children.Pediatrics.2000;106:973–976.
- Committee on Infectious Disease Policy Statement.Reduction of the influenza burden in children.Pediatrics.2002;110:1246–1252.
- ,.Change in recommendation affects influenza vaccinations among children 6 to 59 months of age.Pediatrics.2004;114;948–952.
- ,,.Factors associated with influenza vaccination coverage among the elderly: role of health care personnel.Public Health.1996;110:163–168.
- ,.Optimizing long‐term care by administration of influenza vaccine to parents of NICU patients.J Perinatol.2004;24:273–274.
- ,.Reduction of the influenza burden in children: policy statement of the Committee on Infectious Diseases: American Academy of Pediatrics.Pediatrics.2002;110:1246–1252.
- National Center for Health Statistics. Incidence of prematurity data. Available at: http://www.marchofdimes.com/peristats. Accessed April 16,2006.
- Centers for Disease Control and Prevention (CDC).Estimated influenza vaccination coverage among adults and children—United States, September 1, 2004‐January 31, 2005.MMWR Morb Mortal Wkly Rep.2005;54:304–307.
- ,,, et al.Multistate surveillance for laboratory‐confirmed, influenza‐associated hospitalizations in children: 2003‐2004.Pediatr Infect Dis J.2006;25:395–400.
- .., et al.Population‐based surveillance for hospitalizations associated with respiratory syncytial virus, influenza virus, and parainfluenza viruses among young children.Pediatrics.2004;113:1758–1764.
- New York University Outpatient Pharmacy, personal communication.
- ,.Economic analysis of palivizumab in infants with congenital heart disease.Pediatrics.2004;114:1606–1611.
- Equitable Life Assurance Society of the United States.Hospital Daily Service Charges.New York, NY:Equitable Life Assurance Company,1982.
- ,,Hospital costs of pediatric intensive care.Crit Care Med.1999;27:2079–2085.
- U.S. Bureau of Labor Statistics. Employment and earnings2004. Available at: www.bls.gov/bls/wages.html.
- ,,,,,.Time and out‐of‐pocket costs associated with respiratory syncytial virus hospitalization of infants.Value Health.2003;6:100–106.
- ,,, et al.Influenza‐associated deaths among children in the United States.N Engl J Med.2005;353:2559–2569.
Influenza is a common infectious agent in the pediatric population, infecting 15% to 42% of preschool children, with a fatality rate of 3.8 per 100,000.13 Those with underlying respiratory and cardiac disease are more likely to require hospitalization and more susceptible to morbidity from the disease.47 Trivalent inactivated influenza vaccine is a safe, cost‐effective method of preventing influenza in children, with a seroconversion rate of up to 89%.810 Both the American Academy of Pediatrics and the Advisory Committee on Immunization Practices recommend that the influenza vaccine be administered to household contacts and out‐of‐home caretakers of infants up to 6 months of age.11 Also included in this high‐risk category are children with chronic respiratory and cardiac disease.8
The immunization rate in the indicated pediatric population ranges from 9% to 22%.12 Because most adults who meet eligible criteria are not vaccinated, it has been proposed that the NICU begin to administer the influenza vaccine to parents of high‐risk infants, eliminating commonly encountered obstacles to vaccine administration and preventing infection in these close contacts of infants, who likely serve as infectious agents of disease in the infants.13, 14
Yet the cost of instituting such a program remains a concern, especially given the recent shortages of the inactivated influenza vaccine, which have increased cost.15 The economic implications of instituting an inactivated influenza vaccination program for parents of patients in the NICU have not been fully evaluated. Given that upwards of 40,000 premature infants are admitted to intensive care units each year, an examination of cost savings is critical prior to implementing such a program.16
METHODS
Data and Assumptions
A 3‐ and 4‐tiered computer model (with the tiers reflecting the variables presence of lung disease, having siblings, and sibling immunization status and the fourth tier reflecting parental immunization in the NICU as a function of the immunization program) assessing influenza vaccination status of parents of a cohort of 2632 patients admitted to the New York Regional Perinatal Center NICU during the influenza season of 2003‐2004 was constructed using the viewpoint of a large multinetwork medical center predominantly serving a lower socioeconomic status population. The likelihood of influenza infection of an infant, the need for infant hospitalization, subsequent length of stay, and the need for the patient to have outpatient physician visits were based on the following clinical variables: lung disease in the infant (defined as a 28‐day‐old patient whose birth weight was less than 1500 g being oxygen dependent); having school‐age siblings, sibling vaccination status; parental vaccination status; and parental compliance. Variables of the model were based on published results when possible. For the purposes of this model, we assumed a 10% reduction in influenza infectivity for parents of children who were immunized in the absence of other confounders based on the risk of needing medical attention of children less than 6 months old for documented influenza with parental vaccination in the 9 states that make up the Emerging Infections Program Network of the Centers for Disease Control.1719 Infected patients younger than 6 months of age were also programmed to have a 10% chance of an outpatient hospitalization visit. No deaths were introduced in the cohort. An outline of the different groups into which patients were classified (before and after the influenza vaccination campaign) is outlined in Figure 1.
Direct Costs
Medical Costs
The average wholesale cost of a dose of influenza vaccine including administration was $15.20 Each parent received 1 dose of influenza vaccine administered during the influenza season (the 5 months from October thru February). In our model, the vaccine is administered by nurses, physicians, or physician‐extenders in a neonatal intensive care unit and thus does not require increased personnel to support the program. Hence, no increased costs were included for administration of the vaccine.
Siblings were not offered immunization in the NICU program. Most NICUs do not allow children younger than 13 years to visit during influenza and respiratory syncytial virus season to prevent infection of newborns. Immunization of younger siblings requires prior knowledge of their vaccination status, as those previously immunized require 1 dose of vaccine, whereas those less than 9 years old not immunized require 2 doses scheduled 1 month apart. As this was considered logistically difficult for a high‐acuity NICU, sibling immunization was deferred to that sibling's primary medical doctor, a policy consistent with that of the American Academy of Pediatrics Medical Home Initiative.
Infant Hospitalization for Influenza
Cost estimates were obtained from published data on the length of stay of infants with respiratory disease.21 In this series the average length of stay of former NICU patients with low socioeconomic status hospitalized for influenza was 4.5 4 days. Average hospital costs were estimated as $1508/day.22, 23 No intensive care unit days were factored into the current cost model. Hospitalization costs for each group were estimated by (number of infants in each group from the New York Regional Perinatal Center 2004 Database hospitalization rate of each group number of days hospitalized $1508/day). This estimation technique was previously validated and used.21
Intensive care unit cost was estimated as 2.5 times the cost of nonintensive care ($3770/day). Intensive care hospitalization for influenza is difficult to measure, as it correlates with bacterial superinfection, which has an incidence of 0.5/10,000 patients with documented influenza.5 However, in another study, ICU hospitalization of infected patients was 0.5%, which would translate to 13 patients in the studied group.18 The length of ICU stay was 1 day, and by univariate analysis, bacterial coinfection was again the highest predictor of ICU admission. These patients were admitted because positive results of outpatient blood cultures, signs of shock, and influenza were noted until several days into the hospitalization and may have been nosocomial in origin.18 Thus, costs are reported in the tables without intensive care unit stays for the 13 patients who may have required them in the model. But to acknowledge the role ICU admission plays in deferring costs, 2 cost‐estimate graphs were generated, 1 including ICU admission.
Outpatient Costs
For patients in each cohort who were unprotected from influenza because of parental or sibling immunization, a 10% increase in the number of outpatient medical visits was considered. Outpatient costs were tallied on the basis of average general pediatrician's salary of $68/hour.23 Duration of outpatient visits was estimated as 20 minutes with no accounting for extra nursing time. Hence, tallies were made by (number of unprotected infants 10% 20 minutes/visit $68/hour 1 hour/60 minutes). As 3% of actual cases of influenza in the group of those less than 6 months old can be misdiagnosed as clinical bacterial pneumonia, prescription costs were estimated as $3.20 for a 7‐day course of generic amoxicillin, which was the only prescribed antibiotic considered.
Indirect Costs
For each outpatient office visit, we used the cost‐estimation scheme outlined by Yount et al.20. We assumed that 1 parent accompanied the infant and 3 hours of lost work should be accounted for. Using the U.S. Bureau of Labor and Statistics 2002 average wage of $17/hour, lost wages for each extra outpatient visits were tabulated by (number of extra MD visits per group 3 hours $17/hour).24 No travel or transportation costs were considered.
Hospitalization
For each hospitalization, we assumed 1 parent stayed with an infant at bedside during the infant's inpatient stay. We calculated the average length of stay for patients with lung disease as 8 days and for those without lung disease as 4.5 days. Calculations were obtained using the following formula: (number of infants in each group from the New York Regional Perinatal Center 2004 Database hospitalization rate of each group number of days hospitalized $17/hour 8 work hours/day 5/7 workdays/week).
Sensitivity Analysis
We evaluated the sensitivity of the model to variations in the assumptions made. We varied the sibling immunization rate from 12% to 17% and the reduction in hospitalization for parents who received influenza vaccine from 10% to 20%. A summary of variables used in the analysis is included in Table 1.
| Compliance of parents offered influenza vaccine | 89% (17) |
| Seroconversion rate of vaccine recipients | 89% (17) |
| Percentage of siblings vaccinated | 12% (12) |
| Excess PMD visits of infected patients | 10% (7) |
| Hospitalization rate of lung disease patients without siblings | 10% (7) |
| Hospitalization rate of lung disease patients with siblings | 15% (7) |
| Length of hospitalization of Lung Disease patients | 8 days (7) |
| Hospitalization rate of nonlung disease patients without siblings | 7/1000 (19) |
| Hospitalization rate of nonlung disease patients with siblings | 19/1000 (19) |
| Length of hospitalization of nonlung disease patients | 4.5 days (19) |
RESULTS
Influenza Costs Prior to Implementation of NICU‐Based Parental Vaccination
Direct and indirect costs of influenza hospitalization of the NICU graduates are summarized in Table 2. The total per‐patient cost of influenza vaccination obtained in the NICU for the 2632 patients in the source data 1 one season was $181.20. NICU patients with lung disease and siblings who were not protected from or immunized for influenza demonstrated the greatest per capita inpatient cost, $1925/patient. Vaccination of patients without lung disease who had no siblings cost $51, the same amount that it cost to vaccinate patients without lung disease who had vaccinated siblings.
| Subgroup type | Cost per patient ($) | Direct costs ($) | Indirect dosts ($) |
|---|---|---|---|
| |||
| Patients with lung disease whose siblings were protected | 1284 | 10,857.60 | 699.42 |
| Patients with lung disease whose siblings were unprotected | 1925 | 142,958.40 | 9,170.29 |
| Patients with lung disease without siblings | 1284 | 63,939.20 | 4,118.85 |
| Patients without lung disease whose siblings were protected | 51 | 7,885.33 | 507.96 |
| Patients without lung disease whose siblings were unprotected | 137 | 179,347.19 | 11,553.25 |
| Patients without lung disease without siblings | 51 | 44,366.86 | 2,858.04 |
Outpatient costs of influenza hospitalization based on source data revealed summarized costs for 1 season of $6.80/patient. This reflected 245 excess primary care visits at a total cost of $5569.20. The cost of excess prescriptions of the antibiotic amoxicillin because of misdiagnoses. Indirect costs secondary to parent lost work hours while attending to their infants in the hospital totaled $12,530.70. Thus, the total cost of influenza in the source population for 1 season including inpatient, outpatient, direct, and indirect costs was $188/patient.
Influenza Costs after Implementation of an NICU‐Based Parental Vaccination Program
Direct and indirect costs of influenza hospitalization for neonates with lung disease are summarized in Table 3. The introduction of parental vaccination decreased the per‐patient cost in the cohort of patients with lung disease and unprotected siblings to $1732 from $1925. This group showed the largest cost savings compared with the costs for this group prior to introduction of the campaign.
| Subgroup type | Cost/patient ($) | Direct costs ($) | Indirect costs ($) |
|---|---|---|---|
| |||
| Patients with lung disease with protected siblings/unprotected parents | 1283 | 2412.80 | 154.49 |
| Patients with lung disease with protected siblings/protected parents | 1155 | 7600.32 | 486.66 |
| Patients with lung disease with unprotected siblings/protected parents | 1732 (Pre‐1925) | 102,604.32 | 6569.94 |
| Patients with lung disease with unprotected siblings/unprotected parents | 1925 | 28,953.60 | 1853.95 |
| Patients with lung disease without siblings/with protected parents | 1155 | 45,601.92 | 2919.97 |
| Patients with lung disease without siblings/with unprotected parents | 1283 | 13,270.40 | 849.73 |
Direct and indirect costs of influenza hospitalization for infants without lung disease are summarized in Table 4. The introduction of parental vaccination to disrupt the cycle of infectious transmission to infant decreased per‐patient costs in patients whose parents and siblings received vaccinations to $45. This reduction of $6/patient was the greatest savings among all the groups in the cohort without lung disease.
| Subgroup type | Cost/Patient ($) | Direct Costs ($) | Indirect Costs ($) |
|---|---|---|---|
| |||
| Patients without lung disease with protected siblings/unprotected parents | 51 | 1662.57 | 106.45 |
| Patients without lung disease with protected siblings/protected parents | 45 (pre‐51) | 5600.48 | 256.30 |
| Patients without lung disease with unprotected siblings/unprotected parents | 137 | 37,261.92 | 2385.51 |
| Patients without lung disease with unprotected siblings/protected parents | 123 | 127,876.74 | 8168.97 |
| Patients without lung disease without siblings/with protected parents | 45 | 31,215.60 | 1998.79 |
| Patients without lung disease without siblings/with unprotected parents | 51 | 9215.38 | 586.60 |
Outpatient costs were reduced after the introduction of the campaign to $1.40/patient, reflecting the decrease in the number of outpatient visits from 245 to 51. Thus, the total cost of influenza in the source population after the introduction of an NICU‐based parental vaccination campaign was $200/patient. The $193/patient savings in the lung disease cohort with unprotected siblings ($1925 vs. $1732) was not sufficient to cover the increased cost of the vaccine. For this population of 2632 NICU patients, administration of NICU‐based parental influenza cost $12 extra/patient.
Financial Modeling Based on Source Data
Using the financial model, cost per patient was determined using the same estimates of incidence of the variables (ie, lung disease, siblings); only the number of enrollees in the program was varied. The relationship of cost per patient with number of NICU patients is shown in Figure 2. Cost per patient was zero at 4000 patients. Beyond that point, cost savings occurred, increasing with number of NICU admissions.
Estimating a 1‐day ICU admission rate of 0.5% at $3770/day reduces the required patient population for costs/patient to zero. This occurs at 3700 patients. Initially there is no added benefit with ICU admission, as the overall patient population is not large enough to support a significant ICU burden. As the population increases to 3000 patients, cost savings begin.
The relationship of variable immunization rates in siblings of the 2632 NICU patients in the source data is presented in Figure 3. Cost savings were not achieved until 37% of siblings had been immunized. A steep reduction in cost was seen as the immunization rate of siblings increased in the cohort. Marginal cost effectiveness was also increased in sibling immunization, meaning greater cost savings is achieved by immunizing a sibling of a high‐risk infant than by immunizing the parents, reflecting that siblings are more likely than parents to be vectors of disease in multichild households.
DISCUSSION
This is the first computer‐based model of the cost effectiveness of offering inactivated influenza vaccine to parents of patients in the NICU for the purpose of preventing illness in their offspring. Based on the source data, the study has demonstrated that offering immunization to parents in the NICU is not cost effective until the NICU population covered is at least 4000 patients. Cost effectiveness can also be reached in smaller populations by increasing the level of sibling immunization. These factors should be considered by public health specialists when mandating administration of influenza vaccine to parents in the NICU setting.
Cost‐effectiveness studies are limited by the variables chosen, by hospitalization rates, and by estimates made. Although we attempted to obtain hospitalization rates based on previously validated, published data, any variation in these rates will alter the cost‐savings model we constructed. For variables affecting the infectivity of and hospitalization for influenza, we chose lung disease, siblings with immunization rate, and parental immunization rate. Other variables, notably day care attendance, were not believed to highly influence infections due to respiratory pathogens.18
Another potential source of error in construction of the model is calculation of indirect costs. Although estimates of lost wages from work hours spent while a patient is hospitalized were calculated as an indirect cost, Leader et al. points out that there are also indirect costs after hospitalization secondary to increased outpatient physician surveillance.25 Furthermore, our model based lost wages on parents of patients earning an average salary of $17/hour. However, our source data represented the Regional Perinatal Center, a consortium of NICUs in New York City serving a primarily uninsured, indigent population. Hence, these estimates of lost wages may be overestimated.
Most cost‐utility analysis studies are performed to help compare public health policy policies across medical disciplines. Most data on adults and on children calculate the cost of quality‐of‐life‐adjusted year. In our study no such calculations were made because influenza was not thought to affect life long term. In other words, quality of life was not thought to be more likely to be affected by the variables NICU admission and birth weight than by the variable influenza infection, and these factors were considered in estimating hospitalization rates. Furthermore, because mortality from influenza is roughly 1 of every 100,000 for children less than 6 months old, no patients in the source data would have died, making quality‐of‐life‐adjusted year difficult to factor.26
Given a limited amount of medical resources, it is imperative to critically evaluate the economic implications of any widespread public health strategy. This cost analysis has demonstrated that the benefits of sponsoring NICU‐based immunization programs for parents will remain low unless the issue of sibling immunization is addressed or the number of patients in the cohort increases to a scale larger than any single traditional NICU may provide.
- ,.Interpandemic influenza in the Houston area, 1974‐1976.N Engl J Med.1978;298:587–592.
- ,,, et al.Burden of interpandemic influenza in children younger than 5 years: a 25‐year prospective study.J Infect Dis.2002;185:147–152.
- .Serious morbidity and mortality associated with influenza epidemics.Epidemiol Rev.1982;4:25–44.
- ,,, et al.Impact of respiratory virus infections on persons with chronic underlying conditions.JAMA.2000;283:499–505.
- ,,, et al.Influenza and the rates of hospitalization for respiratory disease among infants and young children.N Engl J Med.2000;342:232–239.
- ,,.Impact of influenza on morbidity in children with cystic fibrosis.J Paediatr Child Health.1991;27:308–311.
- ,,, et al.The burden of influenza illness in children with asthma and other chronic medical conditions.J Pediatr.2000;137:856–864.
- ,;Committee on Infectious Diseases.Technical report. Reduction of the influenza burden in children.Pediatrics.2002;110:e80. Available at: http://www.pediatrics.org/cgi/content/full/110/6/e80.
- ,,, et al.Clinical reactions and serologic responses after vaccination with while‐virus or split‐virus influenza vaccines in children aged 6 to 36 months.Pediatrics.1982;69:404–408.
- ,.Economic impact of influenza vaccination in preschool children.Pediatrics.2000;106:973–976.
- Committee on Infectious Disease Policy Statement.Reduction of the influenza burden in children.Pediatrics.2002;110:1246–1252.
- ,.Change in recommendation affects influenza vaccinations among children 6 to 59 months of age.Pediatrics.2004;114;948–952.
- ,,.Factors associated with influenza vaccination coverage among the elderly: role of health care personnel.Public Health.1996;110:163–168.
- ,.Optimizing long‐term care by administration of influenza vaccine to parents of NICU patients.J Perinatol.2004;24:273–274.
- ,.Reduction of the influenza burden in children: policy statement of the Committee on Infectious Diseases: American Academy of Pediatrics.Pediatrics.2002;110:1246–1252.
- National Center for Health Statistics. Incidence of prematurity data. Available at: http://www.marchofdimes.com/peristats. Accessed April 16,2006.
- Centers for Disease Control and Prevention (CDC).Estimated influenza vaccination coverage among adults and children—United States, September 1, 2004‐January 31, 2005.MMWR Morb Mortal Wkly Rep.2005;54:304–307.
- ,,, et al.Multistate surveillance for laboratory‐confirmed, influenza‐associated hospitalizations in children: 2003‐2004.Pediatr Infect Dis J.2006;25:395–400.
- .., et al.Population‐based surveillance for hospitalizations associated with respiratory syncytial virus, influenza virus, and parainfluenza viruses among young children.Pediatrics.2004;113:1758–1764.
- New York University Outpatient Pharmacy, personal communication.
- ,.Economic analysis of palivizumab in infants with congenital heart disease.Pediatrics.2004;114:1606–1611.
- Equitable Life Assurance Society of the United States.Hospital Daily Service Charges.New York, NY:Equitable Life Assurance Company,1982.
- ,,Hospital costs of pediatric intensive care.Crit Care Med.1999;27:2079–2085.
- U.S. Bureau of Labor Statistics. Employment and earnings2004. Available at: www.bls.gov/bls/wages.html.
- ,,,,,.Time and out‐of‐pocket costs associated with respiratory syncytial virus hospitalization of infants.Value Health.2003;6:100–106.
- ,,, et al.Influenza‐associated deaths among children in the United States.N Engl J Med.2005;353:2559–2569.
Copyright © 2007 Society of Hospital Medicine