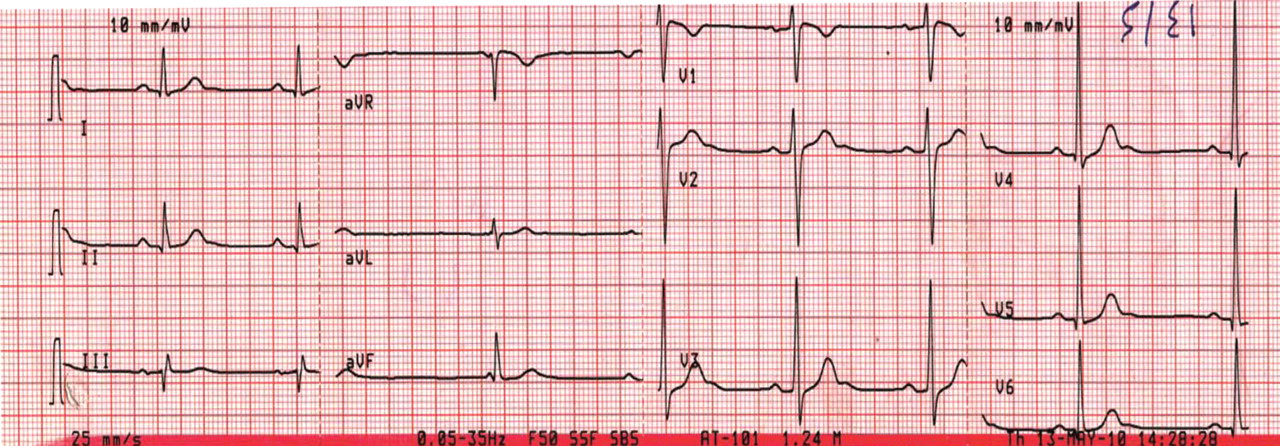
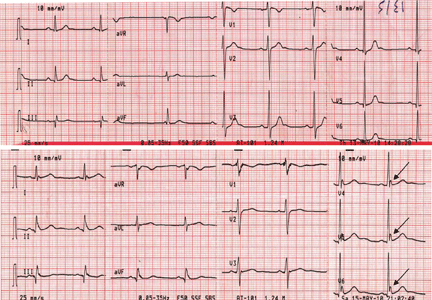
Figure 1. Sinus bradycardia, heart rate 55 beats per minute. The patient’s core body temperature was 36°C (96.8°F). There are no evident J waves.A 22-year-old man was brought to the emergency room after a motor vehicle accident. He was in a deep coma, with a Glasgow coma score of 4 out of 15 (3 being the worst score) and a core body temperature of 36°C (96.8°F). The next day, clinical evidence of brain death was noted, and his core body temperature dropped as low as 29.6°C (85.3°F). At that time, his electrocardiogram revealed sinus bradycardia, with a rate of 48 beats per minute, PR interval 0.24 second, QRS interval 0.16 second, corrected QT duration 0.5 second, and classic high-amplitude Osborn waves (J waves) that were evident in all leads. Figures 1, 2, and 3 show the effect of various degrees of hypothermia on the electrocardiogram.
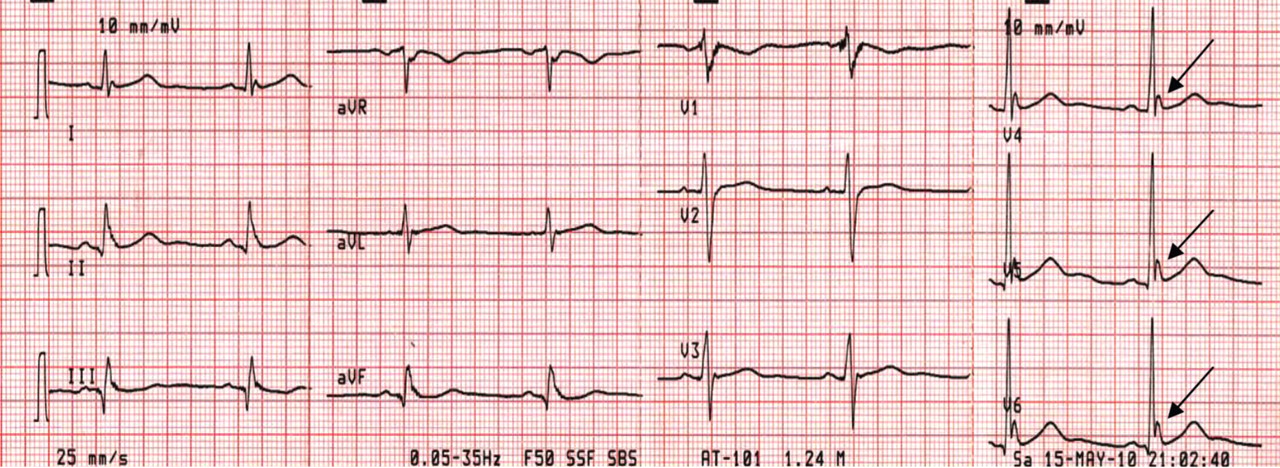
Figure 2. Sinus bradycardia, heart rate 50 beats per minute; low-amplitude J waves are visible in leads V4, V5, and V6 (arrows). The patient’s core body temperature was 31°C (87.8°F).The Osborn wave1 (J wave) is the result of a transient, outward, potassium-mediated current in the ventricular epicardium but not the endocardium, corresponding to a notch in the action potential. This gives rise to a transmural voltage gradient during early repolarization, which appears as the J wave on electrocardiography. It is more pronounced in hypothermia, disappears after normalization of the body temperature, and is usually evident in the inferolateral leads.
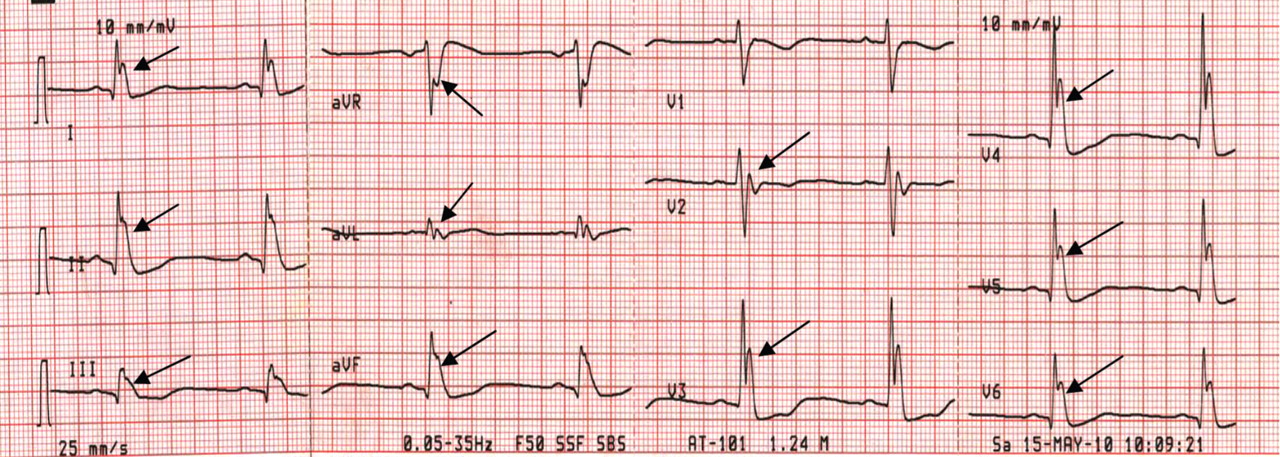
Figure 3. Sinus bradycardia, 48 beats per minute; the PR interval is prolonged at 0.24 second, the QRS interval is prolonged at 0.16 second, the corrected QT interval is 0.5 second, and classic high-amplitude J waves are visible in all leads (arrows). Core body temperature was 29.6°C (85.3°F).
Although Osborn waves are a marker of hypothermia, they also occur in nonhypothermic conditions. Brainstem death is a precursor of the J wave, and this is explained by impaired thermoregulatory ability resulting from hypothalamic dysfunction and subsequent hypothermia.
The three electrocardiograms presented here illustrate several points:
Classic findings in hypothermia include J waves, sinus bradycardia, prolongation of the PR interval, widening of the QRS complex, and prolongation of the QT interval.
The lower the core body temperature, the higher the amplitude of the J wave.
The J wave in brain death (unlike hypothermic causes of the J wave) is not associated with the characteristic signs of shivering in the surface electrocardiogram.
As hypothermia becomes more profound, the J wave becomes evident in all leads, not only the inferolateral leads.
References
Osborn JJ. Experimental hypothermia; respiratory and blood pH changes in relation to cardiac function. Am J Physiol1953; 175:389–398.
Hesham R. Omar, MD Internal Medicine Program, Department of Medicine, Mercy Hospital and Medical Center, Chicago, IL
Hany D. Abdelmalak, MD Internal Medicine Program, Department of Medicine, Mercy Hospital and Medical Center, Chicago, IL
Address: Hesham R. Omar, MD, Internal Medicine Department, Mercy Hospital and Medical Center, 2525 South Michigan Avenue, Chicago, IL 60616; e-mail hesham_omar2003@yahoo.com
Author and Disclosure Information
Hesham R. Omar, MD Internal Medicine Program, Department of Medicine, Mercy Hospital and Medical Center, Chicago, IL
Hany D. Abdelmalak, MD Internal Medicine Program, Department of Medicine, Mercy Hospital and Medical Center, Chicago, IL
Address: Hesham R. Omar, MD, Internal Medicine Department, Mercy Hospital and Medical Center, 2525 South Michigan Avenue, Chicago, IL 60616; e-mail hesham_omar2003@yahoo.com
Figure 1. Sinus bradycardia, heart rate 55 beats per minute. The patient’s core body temperature was 36°C (96.8°F). There are no evident J waves.A 22-year-old man was brought to the emergency room after a motor vehicle accident. He was in a deep coma, with a Glasgow coma score of 4 out of 15 (3 being the worst score) and a core body temperature of 36°C (96.8°F). The next day, clinical evidence of brain death was noted, and his core body temperature dropped as low as 29.6°C (85.3°F). At that time, his electrocardiogram revealed sinus bradycardia, with a rate of 48 beats per minute, PR interval 0.24 second, QRS interval 0.16 second, corrected QT duration 0.5 second, and classic high-amplitude Osborn waves (J waves) that were evident in all leads. Figures 1, 2, and 3 show the effect of various degrees of hypothermia on the electrocardiogram.
Figure 2. Sinus bradycardia, heart rate 50 beats per minute; low-amplitude J waves are visible in leads V4, V5, and V6 (arrows). The patient’s core body temperature was 31°C (87.8°F).The Osborn wave1 (J wave) is the result of a transient, outward, potassium-mediated current in the ventricular epicardium but not the endocardium, corresponding to a notch in the action potential. This gives rise to a transmural voltage gradient during early repolarization, which appears as the J wave on electrocardiography. It is more pronounced in hypothermia, disappears after normalization of the body temperature, and is usually evident in the inferolateral leads.
Figure 3. Sinus bradycardia, 48 beats per minute; the PR interval is prolonged at 0.24 second, the QRS interval is prolonged at 0.16 second, the corrected QT interval is 0.5 second, and classic high-amplitude J waves are visible in all leads (arrows). Core body temperature was 29.6°C (85.3°F).
Although Osborn waves are a marker of hypothermia, they also occur in nonhypothermic conditions. Brainstem death is a precursor of the J wave, and this is explained by impaired thermoregulatory ability resulting from hypothalamic dysfunction and subsequent hypothermia.
The three electrocardiograms presented here illustrate several points:
Classic findings in hypothermia include J waves, sinus bradycardia, prolongation of the PR interval, widening of the QRS complex, and prolongation of the QT interval.
The lower the core body temperature, the higher the amplitude of the J wave.
The J wave in brain death (unlike hypothermic causes of the J wave) is not associated with the characteristic signs of shivering in the surface electrocardiogram.
As hypothermia becomes more profound, the J wave becomes evident in all leads, not only the inferolateral leads.
References
Osborn JJ. Experimental hypothermia; respiratory and blood pH changes in relation to cardiac function. Am J Physiol1953; 175:389–398.
References
Osborn JJ. Experimental hypothermia; respiratory and blood pH changes in relation to cardiac function. Am J Physiol1953; 175:389–398.