User login
How many hospitalists left your group during the past year? If you're lucky, your group is one of the 36% of adult medicine groups that had no turnover at all. The proportion of groups with no turnover has ranged from a low of 32% (in the 2008-2009 SHM Focused Survey) to a high of 39% (2005-2006 and 2007-2008 SHM biannual surveys), so the 2012 results appear to be right in line with previous years.
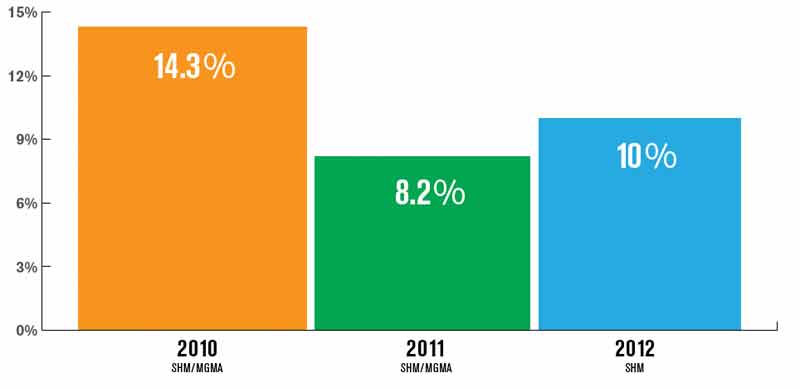
But what about the groups that did encounter turnover? SHM's 2012 State of Hospital Medicine Report, which is based on 2011 data, reported a median turnover rate of 10% for nonacademic HM groups serving adults only. That's a little higher than last year's rate but lower than the rate reported in the 2010 SHM/MGMA survey. (It's worth keeping in mind that, in 2012, SHM conducted its own survey separate from MGMA, so the results might not be directly comparable to the previous two years' SHM/MGMA surveys.)
What part of the country you practice in and who employs you matters. In 2012, groups in the Western region of the U.S. reported only about 5% turnover, compared with 10% or 11% in other parts of the country. Turnover also varied by ownership/employment model: Groups employed by management companies and university/medical schools reported higher-than-median turnover; private hospitalist groups and those employed by multispecialty groups reported lower turnover. And medium-sized groups (five to 19 hospitalist FTEs) reported higher turnover than very small or larger groups.
The report also includes turnover rates for physician assistants (PAs) and nurse practitioners (NPs). Interestingly, turnover was much lower among NPs and PAs, with around 70% of the adult medicine groups who used NP/PAs reporting no NP/PA turnover at all.
Some folks have speculated that hospitalist turnover will decline as the supply of hospitalists begins to catch up with demand, which seems reasonable. Although we can't assess turnover data at this level of granularity, I'm guessing that turnover in highly-sought-after metropolitan markets, such as Washington, New York City, and Seattle, already is trending lower than in areas that are harder to recruit to.
But as far back as its 2005-2006 survey, SHM reported median turnover of 9%—not meaningfully different from this year's survey results. I suspect hospitalist turnover will continue to hover in the 10% to 15% range for the foreseeable future. Part of that figure can be attributed to the fact that significant numbers of hospitalists working in remote locations are international medical graduates on H-1B and J-1 visas. They typically make a three-year commitment, then move on to a more desirable location. But I think it's also because of the kinds of people who are attracted to hospital medicine.
As my colleague John Nelson, MD, MHM, likes to say, "hospitalists tend to want to date their practice, rather than marry it."
HM jobs have low barriers to entry and exit, at least compared with traditional primary care, which involves building an infrastructure and a panel of patients over many years. HM likely will continue to attract clinicians who enjoy looking around and changing jobs periodically. It will be interesting to see what the next few years bring to our specialty.
Leslie Flores is a partner in Nelson Flores Hospital Medicine Consultants and SHM Practice Analysis Committee member.
How many hospitalists left your group during the past year? If you're lucky, your group is one of the 36% of adult medicine groups that had no turnover at all. The proportion of groups with no turnover has ranged from a low of 32% (in the 2008-2009 SHM Focused Survey) to a high of 39% (2005-2006 and 2007-2008 SHM biannual surveys), so the 2012 results appear to be right in line with previous years.
But what about the groups that did encounter turnover? SHM's 2012 State of Hospital Medicine Report, which is based on 2011 data, reported a median turnover rate of 10% for nonacademic HM groups serving adults only. That's a little higher than last year's rate but lower than the rate reported in the 2010 SHM/MGMA survey. (It's worth keeping in mind that, in 2012, SHM conducted its own survey separate from MGMA, so the results might not be directly comparable to the previous two years' SHM/MGMA surveys.)
What part of the country you practice in and who employs you matters. In 2012, groups in the Western region of the U.S. reported only about 5% turnover, compared with 10% or 11% in other parts of the country. Turnover also varied by ownership/employment model: Groups employed by management companies and university/medical schools reported higher-than-median turnover; private hospitalist groups and those employed by multispecialty groups reported lower turnover. And medium-sized groups (five to 19 hospitalist FTEs) reported higher turnover than very small or larger groups.
The report also includes turnover rates for physician assistants (PAs) and nurse practitioners (NPs). Interestingly, turnover was much lower among NPs and PAs, with around 70% of the adult medicine groups who used NP/PAs reporting no NP/PA turnover at all.
Some folks have speculated that hospitalist turnover will decline as the supply of hospitalists begins to catch up with demand, which seems reasonable. Although we can't assess turnover data at this level of granularity, I'm guessing that turnover in highly-sought-after metropolitan markets, such as Washington, New York City, and Seattle, already is trending lower than in areas that are harder to recruit to.
But as far back as its 2005-2006 survey, SHM reported median turnover of 9%—not meaningfully different from this year's survey results. I suspect hospitalist turnover will continue to hover in the 10% to 15% range for the foreseeable future. Part of that figure can be attributed to the fact that significant numbers of hospitalists working in remote locations are international medical graduates on H-1B and J-1 visas. They typically make a three-year commitment, then move on to a more desirable location. But I think it's also because of the kinds of people who are attracted to hospital medicine.
As my colleague John Nelson, MD, MHM, likes to say, "hospitalists tend to want to date their practice, rather than marry it."
HM jobs have low barriers to entry and exit, at least compared with traditional primary care, which involves building an infrastructure and a panel of patients over many years. HM likely will continue to attract clinicians who enjoy looking around and changing jobs periodically. It will be interesting to see what the next few years bring to our specialty.
Leslie Flores is a partner in Nelson Flores Hospital Medicine Consultants and SHM Practice Analysis Committee member.