User login
The tool is still in the prototype stage, but it could eventually synthesize patient responses to an integrated questionnaire and produce a chart illustrating where the patient stands with respect to a range of modifiable risk factors, including depression, medication overuse, insomnia, and body mass index, among others.
A few such tools exist for other conditions, such as stroke and risk of developing chronic diseases. Existing migraine visualization models focus only on individual risk factors, but they are capable of much more. “Visualization tools can effectively communicate a huge amount of clinical information,” said lead author Ami Cuneo, MD, who is a headache fellow at the University of Washington, Seattle, in an interview. Dr. Cuneo presented a poster describing the concept at the virtual annual meeting of the American Headache Society.
A picture is worth a thousand words
Dr. Cuneo’s background is well suited to the effort: Before entering medicine, she was a documentary producer. “I have a lot of interest in the patient story and history,” she added. She also believes that the tool could improve patient-provider relationships. In rushed sessions, patients may not feel heard. Patients gain a therapeutic benefit from the belief that their provider is listening to them and listening to their story. Visualization tools could promote that if the provider can quickly identify key elements of the patient’s condition. “A lot of headache patients can have a complex picture,” said Dr. Cuneo.
Physicians must see patients in short appointment periods, making it difficult to communicate all of the risk factors and behavioral characteristics that can contribute to risk of progression. “If you have a patient and you’re able to look at a visualization tool quickly and say: ‘Okay, my patient really is having insomnia and sleep issues,’ you can focus the session talking about sleep, cognitive-behavioral therapy for insomnia, and all the things we can help patients with,” said Dr. Cuneo.
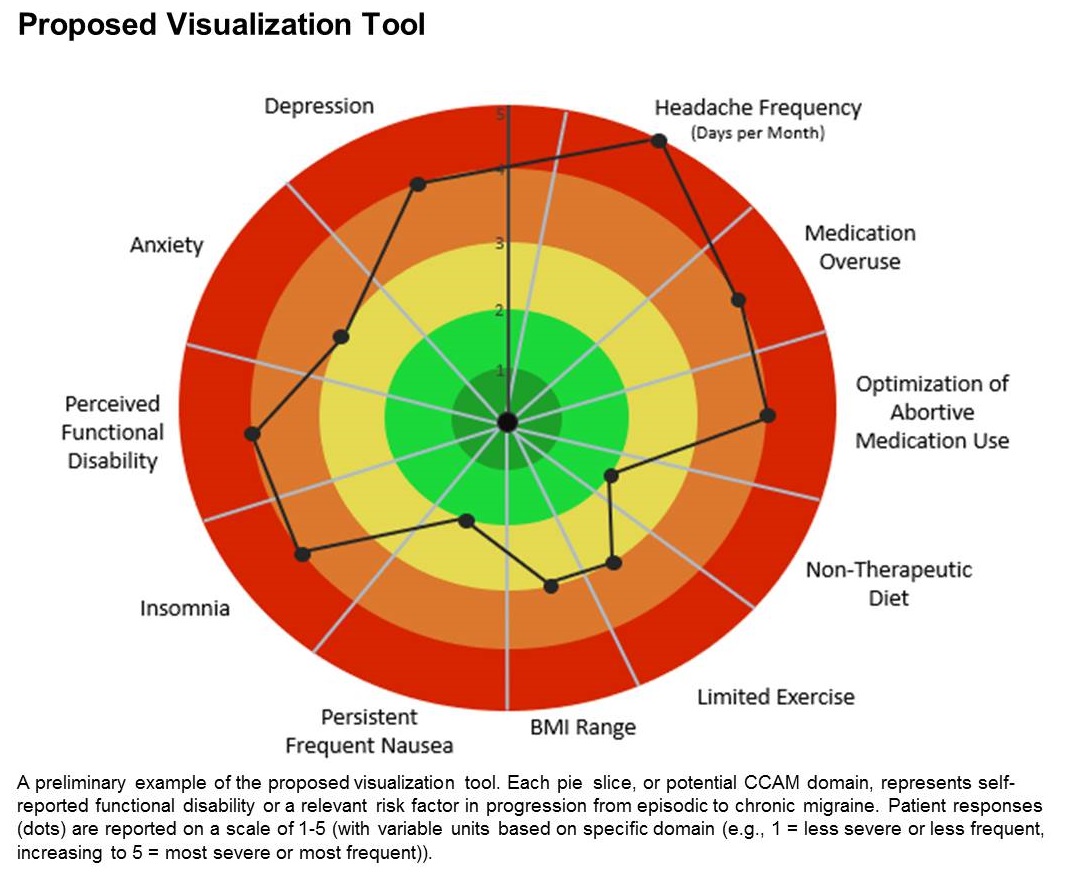
The prototype visualization tool uses a color-coded wheel divided into pie slices, each representing a clinical characteristic or modifiable risk factor. In the proposed tool presented in the poster, these included depression, anxiety, functional disability, insomnia, nausea, headache frequency, medication overuse, optimization of abortive medication use, nontherapeutic diet, limited exercise, and body mass index range. The circle also contains colored concentric circles, ranging from red to green, and a small filled circle represents the patient’s status in each category as ranked using the integrated questionnaire. A line connects the circles in each pie, revealing the patient’s overall status.
The visual cue allows both the physician and patient to quickly assess these factors and see them in relationship to one another. Verbally communicating each factor is time consuming and harder for the patient to take in, according to Dr. Cuneo. “The provider can just look at it and see the areas to focus questions on to try to improve care. So it’s a way I’m hopeful that we can help target visits and improve patient-provider communication without extending visit time.”
A key challenge for the project will be choosing and consolidating scales so that the patient isn’t burdened with too many questions in advance of the appointment. The team will draw from existing scales and then create their own and validate it. “The questions will have to be vetted with patients through focus groups, and then the software platform [will have to be developed] so that patients can complete the survey online. Then we have to test it to see if providers and patients feel this is something that’s helpful in the clinical practice,” said Dr. Cuneo.
Will it change behavior?
If successful, the tool would be a welcome addition, according to Andrew Charles, MD, who was asked to comment on the work. “Epidemiological studies have identified these risk factors, but we haven’t had a way of operationalizing a strategy to reduce them systematically, so having some sort of tool that visualizes not just one but multiple risk factors is something I think could be helpful to address those factors more aggressively. The real question would be, if you put it in the hands of practitioners and patients, will they really be able to easily implement it and will it change behavior,” said Dr. Charles, who is a professor of neurology and director of the Goldberg Migraine Program at the University of California, Los Angeles.
The study received no funding. Dr. Cuneo and Dr. Charles have no relevant financial disclosures.
SOURCE; Cuneo A et al. AHS 2020, Abstract 273715.
The tool is still in the prototype stage, but it could eventually synthesize patient responses to an integrated questionnaire and produce a chart illustrating where the patient stands with respect to a range of modifiable risk factors, including depression, medication overuse, insomnia, and body mass index, among others.
A few such tools exist for other conditions, such as stroke and risk of developing chronic diseases. Existing migraine visualization models focus only on individual risk factors, but they are capable of much more. “Visualization tools can effectively communicate a huge amount of clinical information,” said lead author Ami Cuneo, MD, who is a headache fellow at the University of Washington, Seattle, in an interview. Dr. Cuneo presented a poster describing the concept at the virtual annual meeting of the American Headache Society.
A picture is worth a thousand words
Dr. Cuneo’s background is well suited to the effort: Before entering medicine, she was a documentary producer. “I have a lot of interest in the patient story and history,” she added. She also believes that the tool could improve patient-provider relationships. In rushed sessions, patients may not feel heard. Patients gain a therapeutic benefit from the belief that their provider is listening to them and listening to their story. Visualization tools could promote that if the provider can quickly identify key elements of the patient’s condition. “A lot of headache patients can have a complex picture,” said Dr. Cuneo.
Physicians must see patients in short appointment periods, making it difficult to communicate all of the risk factors and behavioral characteristics that can contribute to risk of progression. “If you have a patient and you’re able to look at a visualization tool quickly and say: ‘Okay, my patient really is having insomnia and sleep issues,’ you can focus the session talking about sleep, cognitive-behavioral therapy for insomnia, and all the things we can help patients with,” said Dr. Cuneo.
The prototype visualization tool uses a color-coded wheel divided into pie slices, each representing a clinical characteristic or modifiable risk factor. In the proposed tool presented in the poster, these included depression, anxiety, functional disability, insomnia, nausea, headache frequency, medication overuse, optimization of abortive medication use, nontherapeutic diet, limited exercise, and body mass index range. The circle also contains colored concentric circles, ranging from red to green, and a small filled circle represents the patient’s status in each category as ranked using the integrated questionnaire. A line connects the circles in each pie, revealing the patient’s overall status.
The visual cue allows both the physician and patient to quickly assess these factors and see them in relationship to one another. Verbally communicating each factor is time consuming and harder for the patient to take in, according to Dr. Cuneo. “The provider can just look at it and see the areas to focus questions on to try to improve care. So it’s a way I’m hopeful that we can help target visits and improve patient-provider communication without extending visit time.”
A key challenge for the project will be choosing and consolidating scales so that the patient isn’t burdened with too many questions in advance of the appointment. The team will draw from existing scales and then create their own and validate it. “The questions will have to be vetted with patients through focus groups, and then the software platform [will have to be developed] so that patients can complete the survey online. Then we have to test it to see if providers and patients feel this is something that’s helpful in the clinical practice,” said Dr. Cuneo.
Will it change behavior?
If successful, the tool would be a welcome addition, according to Andrew Charles, MD, who was asked to comment on the work. “Epidemiological studies have identified these risk factors, but we haven’t had a way of operationalizing a strategy to reduce them systematically, so having some sort of tool that visualizes not just one but multiple risk factors is something I think could be helpful to address those factors more aggressively. The real question would be, if you put it in the hands of practitioners and patients, will they really be able to easily implement it and will it change behavior,” said Dr. Charles, who is a professor of neurology and director of the Goldberg Migraine Program at the University of California, Los Angeles.
The study received no funding. Dr. Cuneo and Dr. Charles have no relevant financial disclosures.
SOURCE; Cuneo A et al. AHS 2020, Abstract 273715.
FROM AHS 2020