User login
Timing of Adverse Events Following Geriatric Hip Fracture Surgery: A Study of 19,873 Patients in the American College of Surgeons National Surgical Quality Improvement Program
ABSTRACT
This study uses a prospective surgical registry to characterize the timing of 10 postoperative adverse events following geriatric hip fracture surgery. There were 19,873 patients identified who were ≥70 years undergoing surgery for hip fracture as part of the American College of Surgeons National Surgical Quality Improvement Program (ACS-NSQIP). The median postoperative day of diagnosis (and interquartile range) for myocardial infarction was 3 (1-5), cardiac arrest requiring cardiopulmonary resuscitation 3 (0-8), stroke 3 (1-10), pneumonia 4 (2-10), pulmonary embolism 4 (2-11), urinary tract infection 7 (2-13), deep vein thrombosis 9 (4-16), sepsis 9 (4-18), mortality 11 (6-19), and surgical site infection 16 (11-22). For the earliest diagnosed adverse events, the rate of adverse events had diminished by postoperative day 30. For the later diagnosed adverse events, the rate of adverse events remained high at postoperative day 30. Findings help to enable more targeted clinical surveillance, inform patient counseling, and determine the duration of follow-up required to study specific adverse events effectively. Orthopedic surgeons should have the lowest threshold for testing for each adverse event during the time period of greatest risk.
Continue to: Geriatric hip fracture surgery is associated with...
Geriatric hip fracture surgery is associated with a higher rate of occurrence of postoperative adverse events than any other commonly performed orthopedic procedure.1-4 Indeed, the 90-day mortality rate following a geriatric hip fracture surgery may be as high as 15%2 and the 30-day morbidity rate as high as 30%.3 Furthermore, more than half of postoperative mortalities following orthopedic procedures occur after surgery for hip fracture.4 Therefore, extensive research has been conducted regarding interventions to reduce the rates of adverse events following a hip fracture surgery.5-12 For example, randomized trials have been conducted involving venous thromboembolism prophylaxis,5,6nutritional supplementation,7 delirium prevention,8-10 anemia correction,11 geriatrics consultation,9 and anesthetic technique.12
Despite these extensive research efforts, there is currently little information in the literature regarding when postoperative adverse events occur. A clear depiction of the timing of adverse events could help target clinical surveillance, inform patient counseling, and determine the duration of follow-up required for studies. The reason that the timing of adverse events has not been previously characterized may be that the sample sizes available through standard single- or multi-institutional studies may be insufficient to accurately characterize the timing of rare adverse events (eg, myocardial infarction, stroke, etc.). Moreover, although administrative datasets have become common data sources for investigation of rare postoperative adverse events,13-16 such data sources often do not contain data on the timing of diagnosis.
The American College of Surgeons National Surgical Quality Improvement Program (ACS-NSQIP) is a relatively new and growing surgical registry.1,3,13-22 The registry follows up patients undergoing surgical procedures at several hundred community and academic institutions nationwide. Unlike the administrative datasets discussed above, the ACS-NSQIP characterizes the postoperative day of diagnosis of well-defined adverse events during the first 30 postoperative days.22
In this study, data collected by the ACS-NSQIP are used to characterize the timing of 10 specific postoperative adverse events following a geriatric hip fracture surgery.
Continue to: METHODS...
METHODS
A retrospective analysis of data collected prospectively through the ACS-NSQIP was conducted. Geriatric patients who underwent hip fracture surgery during 2010 to 2013 were identified. Specific inclusion criteria were (1) International Classification of Diseases, Ninth Revision, diagnosis code 820, (2) primary Current Procedural Terminology codes 27125, 27130, 27235, 27236, 27244, or 27245, and (3) age ≥70 years.
The ACS-NSQIP captures patient demographic, comorbidity, and procedural characteristics at baseline.22 At the end of the 30-day follow-up period, the ACS-NSQIP personnel review both inpatient and outpatient charts to characterize the occurrence vs nonoccurrence of specific postoperative adverse events.22-25 When an adverse event does occur, the postoperative day of diagnosis is recorded.
For this study, the following adverse event categories were investigated: myocardial infarction, cardiac arrest requiring cardiopulmonary resuscitation, stroke, pneumonia, pulmonary embolism, urinary tract infection, deep vein thrombosis, sepsis (either with or without shock), mortality, and surgical site infection (including superficial surgical site infection, deep surgical site infection, and organ or space surgical site infection). Detailed definitions of each adverse event are provided in ACS-NSQIP materials.22
First, the 30-day incidence (and the associated 95% confidence interval) was determined for each adverse event. Second, the median postoperative day of diagnosis (and the associated interquartile range) was determined for each adverse event. Third, the postoperative length of stay was used to estimate the proportion of diagnoses occurring prior to vs following discharge for each adverse event. Finally, multivariate Cox proportional hazards models were used to identify independent risk factors for earlier occurrence of postoperative adverse events. The final models were selected using a backward stepwise process that sequentially eliminated variables with the weakest associations until all variables had P < .05.
Because the ACS-NSQIP reports timing data in calendar days, when the postoperative length of stay was equivalent to the postoperative day of diagnosis, it was not possible to ascertain whether the diagnosis occurred prior to or following discharge. For this study, when the postoperative length of stay was equivalent to the postoperative day of diagnosis, the adverse event was considered to have been diagnosed following discharge. The rationale for this is that for most of the adverse events, it was thought to be unlikely that an inpatient would be discharged before the end of the same day as an inpatient diagnosis. However, there was one exception to this rule; when the postoperative day of discharge, the postoperative length of stay, and the postoperative day of death were all equivalent, the adverse event was considered to have occurred prior to discharge. This is because when a patient dies during the initial inpatient stay, the ACS-NSQIP considers the postoperative length of stay to be equivalent to the postoperative day of death. This makes it much more likely that a diagnosis on the final hospital day had occurred in a patient who had not been discharged.
The mandatory ACS-NSQIP statement is “The American College of Surgeons National Surgical Quality Improvement Program and the hospitals participating in the ACS-NSQIP are the source of the data used herein; they have not verified and are not responsible for the statistical validity of the data analysis or the conclusions derived by the authors.”26
Continue to: RESULTS...
RESULTS
In total, 19,873 geriatric patients undergoing a hip fracture surgery were identified (Table 1). The rates of adverse events ranged from 6.7% for urinary tract infection to 0.6% for pulmonary embolism (Table 2).
Table 1. Patient Population
| Number | Percent |
Total | 19,873 | 100.0% |
Age |
|
|
70-74 years | 1852 | 9.3% |
75-79 years | 2764 | 13.9% |
80-84 years | 4328 | 21.8% |
85-89 years | 5525 | 27.8% |
≥90 years | 5404 | 27.2% |
Sex |
|
|
Male | 5359 | 27.0% |
Female | 14,514 | 73.0% |
Body mass index |
|
|
<30 kg/m2 | 17,733 | 89.2% |
≥30 kg/m2 | 2140 | 10.8% |
Functional status |
|
|
Independent | 14,348 | 72.2% |
Dependent | 5525 | 27.8% |
Diabetes | 3321 | 16.7% |
Congestive heart failure | 738 | 3.7% |
Dyspnea on exertion | 1542 | 7.8% |
Hypertension | 14,265 | 71.8% |
End-stage renal disease | 322 | 1.6% |
COPD | 2239 | 11.3% |
Current smoker | 1506 | 7.6% |
Abbreviation: COPD, chronic obstructive pulmonary disease.
Table 2. Patients with Adverse Events Diagnosed During the First 30 postoperative days (N = 19,873)
Adverse Event | Number | Percent | 95% CI |
Urinary tract infection | 1321 | 6.7% | 6.3%-7.0% |
Mortality | 1240 | 6.2% | 5.9%-6.6% |
Pneumonia | 771 | 3.9% | 3.6%-4.2% |
Sepsis | 428 | 2.2% | 2.0%-2.4% |
Myocardial infarction | 347 | 1.8% | 1.6%-1.9% |
Surgical site infection | 247 | 1.2% | 1.1%-1.4% |
Deep vein thrombosis | 199 | 1.0% | 0.9%-1.1% |
Stroke | 144 | 0.7% | 0.6%-0.8% |
Cardiac arrest | 136 | 0.7% | 0.6%-0.8% |
Pulmonary embolism | 126 | 0.6% | 0.5%-0.7% |
Abbreviation: CI, confidence interval.
Figure 1 depicts the timing of postoperative adverse events in detail in histograms and timing curves. For the earliest diagnosed adverse events, the rate of adverse events had diminished by postoperative day 30. For the later diagnosed adverse events, the rate of adverse events remained high at postoperative day 30.
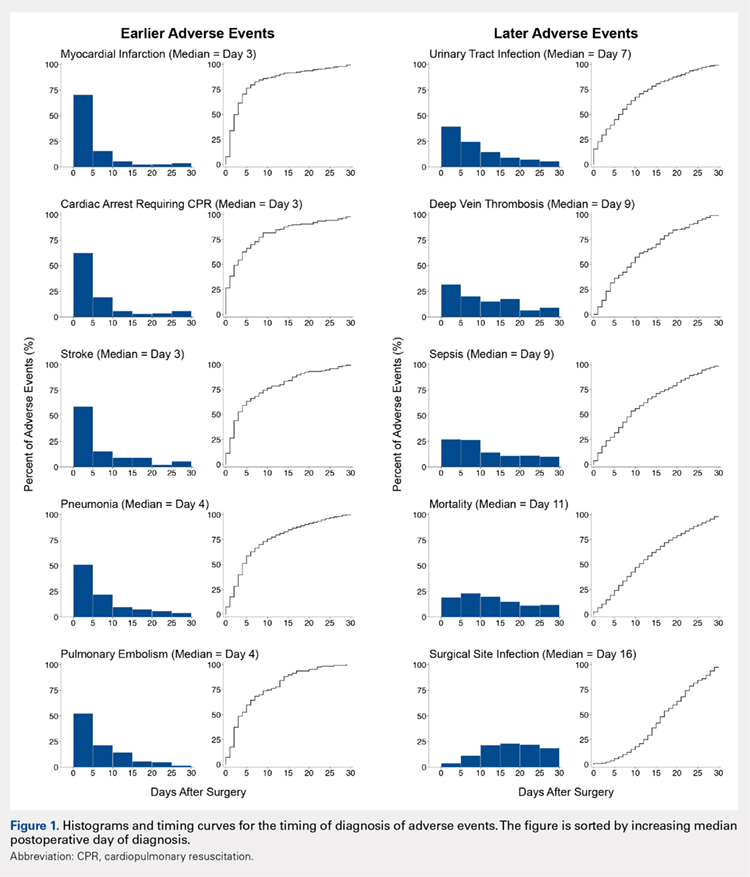
Figure 2 provides the summary statistics for adverse events diagnosed in the first 30 postoperative days. The median postoperative day of diagnosis (and the interquartile range) was 3 (1-5) for myocardial infarction, 3 (0-8) for cardiac arrest requiring cardiopulmonary resuscitation, 3 (1-10) for stroke, 4 (2-10) for pneumonia, 4 (2-11) for pulmonary embolism, 7 (2-13) for urinary tract infection, 9 (4-16) for deep vein thrombosis, 9 (4-18) for sepsis, 11 (6-19) for mortality, and 16 (11-22) for surgical site infection.
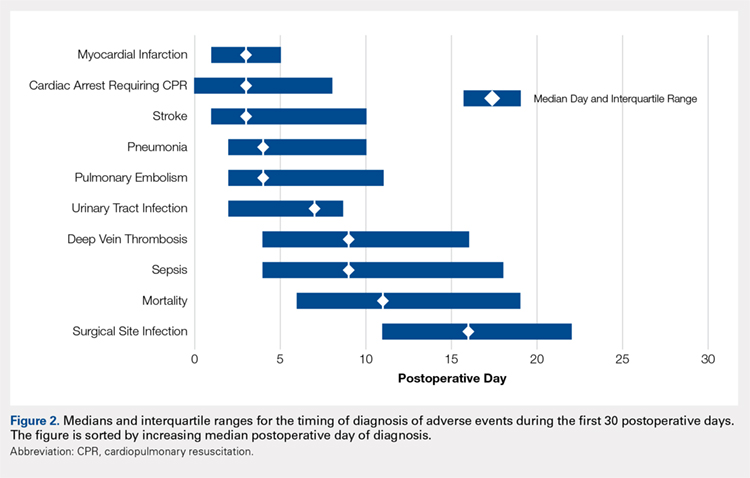
Figure 3 depicts the timing of adverse events relative to discharge. The proportions of adverse events diagnosed prior to discharge were 81.0% for myocardial infarction, 77.8% for stroke, 76.1% for cardiac arrest requiring cardiopulmonary resuscitation, 71.9% for pulmonary embolism, 71.1% for pneumonia, 58.0% for urinary tract infection, 52.1% for sepsis, 46.9% for deep vein thrombosis, 44.3% for mortality, and 27.6% for surgical site infection.
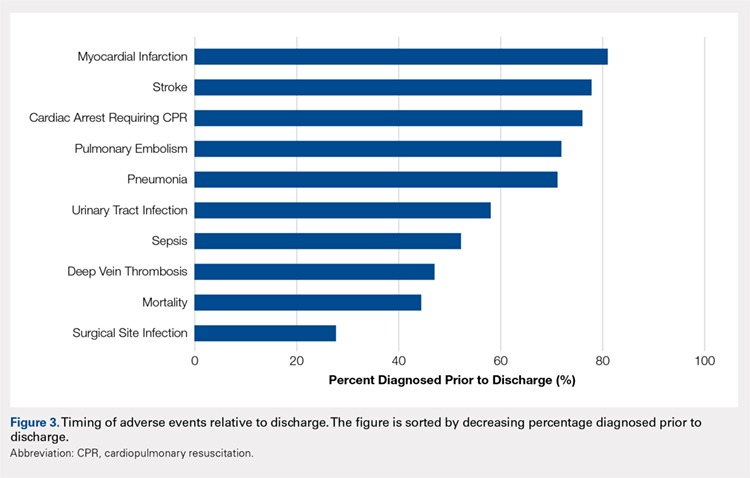
Table 3 shows the independent risk factors for earlier occurrence of adverse events. Following multivariate stepwise selection of final models, at least 1 patient characteristic was independently associated with the timing of cardiac arrest, stroke, urinary tract infection, deep vein thrombosis, and death. In contrast, no patient characteristics were independently associated with the timing of myocardial infarction, pneumonia, pulmonary embolism, sepsis, and surgical site infection.
Table 3. Timing of Diagnosis of Adverse Eventsa
Adverse events and associated baseline characteristic(s) | Median postoperative day of diagnosis with vs without baseline characteristic | P-valueb |
Cardiac arrest |
|
|
End-stage renal disease | 1 vs 3 | .005 |
Stroke |
|
|
Hypertension | 4 vs 2 | .025 |
Dependent functional status | 2 vs 4 | .027 |
Urinary tract infection |
|
|
Female sex | 6 vs 8 | .009 |
Deep vein thrombosis |
|
|
Body mass index ≥30 kg/m2 | 5 vs 10 | .015 |
Death |
|
|
End-stage renal disease | 10 vs 11 | .031 |
aBaseline characteristics that were independently associated with the timing of each adverse event were identified through a backwards stepwise selection process initially including all characteristics listed in Table 1, and sequentially excluding characteristics with the weakest associations until only characteristics with P < .05 remained. Independent associations with the timing of cardiac arrest, stroke, urinary tract infection, deep vein thrombosis, and death are shown. There were no characteristics independently associated with timing of myocardial infarction, pneumonia, pulmonary embolism, sepsis, or surgical site infection; hence, these adverse events are not listed in the table.
bFrom final Cox proportional hazards models identified through multivariate stepwise selection.
Continue to: DISCUSSION...
DISCUSSION
Adverse events are extremely common following a geriatric hip fracture surgery.1-4 Despite extensive investigation regarding methods to prevent these events,5-12 there is limited published description of the timing at which such events occur. This study used a large prospectively followed up cohort of geriatric patients undergoing a hip fracture surgery to deliver a better description of the timing of adverse events than was previously available. The findings of this study should enable more targeted clinical surveillance, inform patient counseling, and help determine the duration of follow-up required for studies on adverse events.
There was wide variability in the timing at which the different postoperative adverse events were diagnosed (Figures 1, 2). Myocardial infarction was diagnosed the earliest, with more than three-fourth of diagnoses in the first postoperative week. Other relatively early-diagnosed adverse events included cardiac arrest requiring cardiopulmonary resuscitation, stroke, pneumonia, and pulmonary embolism.
The latest-diagnosed adverse event was surgical site infection (Figures 1, 2). Surgical site infection was actually the only adverse event with a rate of diagnosis during the first week that was lower than the rate of diagnosis later in the month (as can be seen by the inflection in the timing curve for surgical site infection in Figure 1). Mortality showed a relatively consistent rate of diagnosis throughout the entire first postoperative month. Other relatively late-diagnosed postoperative events, including sepsis, deep vein thrombosis, and urinary tract infection, showed varying degrees of decreased rate of diagnosis near the end of the first postoperative month. Of note, for the later-diagnosed adverse events, the estimated median and interquartile ranges (Figure 2) were presumably quite biased toward earlier diagnosis, as the 30-day follow-up period clearly failed to capture a large proportion of later-occurring adverse events (Figure 1).
Certain risk factors were independently associated with earlier occurrence of adverse events. Perhaps most strikingly, body mass index in the obese range was associated with substantially earlier occurrence of deep vein thrombosis (median of 5 vs 10 days). This finding suggests that clinical monitoring for deep vein thrombosis should be performed earlier in patients with greater body mass index. Also notable is the earlier occurrence of cardiac arrest and death among patients with end-stage renal disease than among those without. Patients with end-stage renal disease may have a greater risk for these adverse events immediately following the cardiac stresses of surgery.27 Similarly, such patients may be more prone to early electrolyte abnormalities and arrhythmia.
Continue to: In addition to its clinical implications, this study...
In addition to its clinical implications, this study informs about the interpretation of the many studies of adverse events following hip fracture procedures that have been conducted using retrospective data. Several such studies have relied on inpatient-only administrative databases.4,13,14,28-35 As clearly demonstrated in Figure 3, for most of the commonly studied adverse events, inpatient-only databases failed to capture a large proportion of adverse events occurring in the first postoperative month. This highlights a substantial limitation of this commonly published type of study that is often not emphasized in the literature.
There has also been an increase in the publication of studies of adverse events following a hip fracture surgery using the ACS-NSQIP data.3,13,14,17,18,21 As discussed, the ACS-NSQIP provides data on 30-days of follow-up. This relatively extended follow-up is often touted as a distinct advantage. However, this study demonstrates that even the 30-day follow-up afforded by the ACS-NSQIP is limited in its ability to enable investigation of the later-occurring adverse events (Figure 1). In particular, the rate of surgical site infection shows little sign of slowing by postoperative day 30. Similarly, the rates of mortality, sepsis, deep vein thrombosis, and urinary tract infection remain substantial.
This study does have limitations. First, as discussed, the duration of follow-up is a limitation of any ACS-NSQIP-based investigation, including this study. Second, the ACS-NSQIP does not capture relevant orthopedic-specific outcomes (eg, screw cutout). In addition, it could not be determined with certainty whether adverse events occurring on the final hospital day occurred prior to or following discharge. However, only a small proportion of most of the adverse events was diagnosed on the final hospital day. Finally, the ACS-NSQIP reports on days from the operation until diagnosis of the adverse event. Although some adverse events are probably diagnosed quickly after they have occurred (eg, myocardial infarction and cardiac arrest), other adverse events may have a delayed diagnosis (eg, surgical site infection may be identified days after its initial occurrence during a follow-up examination). Therefore, it is important to note the subtle distinction between occurrence and diagnosis throughout the article. This article reports on the timing of diagnosis, not actual occurrence.
CONCLUSION
The timing of postoperative adverse events has been understudied in the past. This may be due to an inability of standard single- or multi-institutional investigations to achieve sample sizes adequate to study the less commonly occurring adverse events. Using a relatively new prospective surgical registry, this study provides a far more detailed description of the timing of adverse events following surgery than was previously available. The authors anticipate that these data can be used to inform patient counseling, target clinical surveillance, and direct clinical research. The authors chose to study the timing of postoperative adverse events following geriatric hip fracture surgery because of the high rate of adverse events associated with the procedure. However, future ACS-NSQIP studies may involve characterization of the timing of adverse events following other orthopedic and non-orthopedic procedures.
This paper will be judged for the Resident Writer’s Award.
1. Schilling PL, Hallstrom BR, Birkmeyer JD, Carpenter JE. Prioritizing perioperative quality improvement in orthopaedic surgery. J Bone Joint Surg Am. 2010;92(9):1884-1889. doi:10.2106/jbjs.i.00735.
2. Forte ML, Virnig BA, Swiontkowski MF, et al. Ninety-day mortality after intertrochanteric hip fracture: does provider volume matter? J Bone Joint Surg Am. 2010;92(4):799-806. doi:10.2106/jbjs.h.01204.
3. Pugely AJ, Martin CT, Gao Y, Klocke NF, Callaghan JJ, Marsh JL. A risk calculator for short-term morbidity and mortality after hip fracture surgery. J Orthop Trauma.2014;28(2):63-69. doi:10.1097/BOT.0b013e3182a22744.
4. Bhattacharyya T, Iorio R, Healy WL. Rate of and risk factors for acute inpatient mortality after orthopaedic surgery. J Bone Joint Surg Am. 2002;84-a(4):562-572.
5. Eriksson BI, Lassen MR. Duration of prophylaxis against venous thromboembolism with fondaparinux after hip fracture surgery: a multicenter, randomized, placebo-controlled, double-blind study. Arch Intern Med. 2003;163(11):1337-1342. doi:10.1001/archinte.163.11.1337.
6. Handoll HH, Farrar MJ, McBirnie J, Tytherleigh-Strong G, Milne AA, Gillespie WJ. Heparin, low molecular weight heparin and physical methods for preventing deep vein thrombosis and pulmonary embolism following surgery for hip fractures. Cochrane Database Syst Rev.2002;(4):Cd000305. doi:10.1002/14651858.cd000305.
7. Avenell A, Handoll HH. Nutritional supplementation for hip fracture aftercare in the elderly. Cochrane Database Syst Rev. 2004;(1):Cd001880. doi:10.1002/14651858.CD001880.pub2.
8. Marcantonio ER, Flacker JM, Wright RJ, Resnick NM. Reducing delirium after hip fracture: a randomized trial. J Am Geriatr Soc. 2001;49(5):516-522. doi:10.1046/j.1532-5415.2001.49108.x.
9. Deschodt M, Braes T, Flamaing J, et al. Preventing delirium in older adults with recent hip fracture through multidisciplinary geriatric consultation. J Am Geriatr Soc. 2012;60(4):733-739. doi:10.1111/j.1532-5415.2012.03899.x.
10. Marcantonio ER, Palihnich K, Appleton P, Davis RB. Pilot randomized trial of donepezil hydrochloride for delirium after hip fracture. J Am Geriatr Soc. 2011;59 Suppl 2:S282-S288. doi:10.1111/j.1532-5415.2011.03691.x.
11. Parker MJ. Iron supplementation for anemia after hip fracture surgery: a randomized trial of 300 patients. J Bone Joint Surg Am. 2010;92(2):265-269. doi:10.2106/jbjs.i.00883.
12. Urwin SC, Parker MJ, Griffiths R. General versus regional anaesthesia for hip fracture surgery: a meta-analysis of randomized trials. Br J Anaesth. 2000;84(4):450-455. doi:10.1093/oxfordjournals.bja.a013468.
13. Bohl DD, Basques BA, Golinvaux NS, Baumgaertner MR, Grauer JN. Nationwide Inpatient Sample and National Surgical Quality Improvement Program give different results in hip fracture studies. Clin Orthop Relat Res. 2014;472(6):1672-1680. doi:10.1007/s11999-014-3559-0.
14. Bohl DD, Grauer JN, Leopold SS. Editor's spotlight/Take 5: nationwide inpatient sample and national surgical quality improvement program give different results in hip fracture studies. Clin Orthop Relat Res. 2014;472(6):1667-1671. doi:10.1007/s11999-014-3595-9.
15. Bohl DD, Russo GS, Basques BA, et al. Variations in data collection methods between national databases affect study results: a comparison of the nationwide inpatient sample and national surgical quality improvement program databases for lumbar spine fusion procedures. J Bone Joint Surg Am. 2014;96(23):e193. doi:10.2106/jbjs.m.01490.
16. Levin PE. Apples, oranges, and national databases: commentary on an article by Daniel D. Bohl, MPH, et al.: "Variations in data collection methods between national databases affect study results: a comparison of the nationwide inpatient sample and national surgical quality improvement program databases for lumbar spine fusion procedures.” J Bone Joint Surg Am. 2014;96(23):e198. doi:10.2106/jbjs.n.00890.
17. Basques BA, Bohl DD, Golinvaux NS, Leslie MP, Baumgaertner MR, Grauer JN. Postoperative length of stay and thirty-day readmission following geriatric hip fracture: an analysis of 8,434 patients. J Orthop Trauma. 2015;29(3):e115-e120. doi:10.1097/bot.0000000000000222.
18. Golinvaux NS, Bohl DD, Basques BA, Baumgaertner MR, Grauer JN. Diabetes confers little to no increased risk of postoperative complications after hip fracture surgery in geriatric patients. Clin Orthop Relat Res. 2015;473(3):1043-1051. doi:10.1007/s11999-014-3945-7.
19. Maciejewski ML, Radcliff TA, Henderson WG, et al. Determinants of postsurgical discharge setting for male hip fracture patients. J Rehabil Res Dev. 2013;50(9):1267-1276. doi:10.1682/jrrd.2013.02.0041.
20. Molina CS, Thakore RV, Blumer A, Obremskey WT, Sethi MK. Use of the National Surgical Quality Improvement Program in orthopaedic surgery. Clin Orthop Relat Res.2015;473(5):1574-1581. doi:10.1007/s11999-014-3597-7.
21. Bohl DD, Basques BA, Golinvaux NS, Miller CP, Baumgaertner MR, Grauer JN. Extramedullary compared with intramedullary implants for intertrochanteric hip fractures: thirty-day outcomes of 4432 procedures from the ACS NSQIP database. J Bone Joint Surg Am. 2014;96(22):1871-1877. doi:10.2106/jbjs.n.00041.
22. Alosh H, Riley LH 3rd, Skolasky RL. Insurance status, geography, race, and ethnicity as predictors of anterior cervical spine surgery rates and in-hospital mortality: an examination of United States trends from 1992 to 2005. Spine (Phila Pa 1976). 2009;34(18):1956-1962. doi:10.1097/BRS.0b013e3181ab930e.
23. Cahill KS, Chi JH, Day A, Claus EB. Prevalence, complications, and hospital charges associated with use of bone-morphogenetic proteins in spinal fusion procedures. JAMA.2009;302(1):58-66. doi:10.1001/jama.2009.956.
24. Ingraham AM, Richards KE, Hall BL, Ko CY. Quality improvement in surgery: the American College of Surgeons National Surgical Quality Improvement Program approach. Adv Surg. 2010;44(1):251-267. doi:10.1016/j.yasu.2010.05.003.
25. Shiloach M, Frencher SK Jr, Steeger JE, et al. Toward robust information: data quality and inter-rater reliability in the American College of Surgeons National Surgical Quality Improvement Program. J Am Coll Surg. 2010;210(1):6-16. doi:10.1016/j.jamcollsurg.2009.09.031.
26. ACS-NSQIP. Data Use Agreement. American College of Surgeons Web site. https://www.facs.org/quality-programs/acs-nsqip/participant-use/puf-form. Accessed September 20, 2018.
27. Blacher J, Guerin AP, Pannier B, Marchais SJ, London GM. Arterial calcifications, arterial stiffness, and cardiovascular risk in end-stage renal disease. Hypertension. 2001;38(4):938-942. doi:10.1161/hy1001.096358.
28. Browne JA, Cook C, Olson SA, Bolognesi MP. Resident duty-hour reform associated with increased morbidity following hip fracture. J Bone Joint Surg Am. 2009;91(9):2079-2085. doi:10.2106/jbjs.h.01240.
29. Browne JA, Pietrobon R, Olson SA. Hip fracture outcomes: does surgeon or hospital volume really matter? J Trauma. 2009;66(3):809-814. doi:10.1097/TA.0b013e31816166bb.
30. Menendez ME, Ring D. Failure to rescue after proximal femur fracture surgery. J Orthop Trauma. 2015;29(3):e96-e102. doi:10.1097/bot.0000000000000234.
31. Nikkel LE, Fox EJ, Black KP, Davis C, Andersen L, Hollenbeak CS. Impact of comorbidities on hospitalization costs following hip fracture. J Bone Joint Surg Am. 2012;94(1):9-17. doi:10.2106/jbjs.j.01077.
32. Anderson KL, Koval KJ, Spratt KF. Hip fracture outcome: is there a “July effect”? Am J Orthop. 2009;38(12):606-611.
33. Koval KJ, Rust CL, Spratt KF. The effect of hospital setting and teaching status on outcomes after hip fracture. Am J Orthop. 2011;40(1):19-28.
34. Bacon WE. Secular trends in hip fracture occurrence and survival: age and sex differences. J Aging Health. 1996;8(4):538-553. doi:10.1177/089826439600800404.
35. Orces CH. In-hospital hip fracture mortality trends in older adults: the National Hospital Discharge Survey, 1988-2007. J Am Geriatr Soc. 2013;61(12):2248-2249. doi:10.1111/jgs.12567.
ABSTRACT
This study uses a prospective surgical registry to characterize the timing of 10 postoperative adverse events following geriatric hip fracture surgery. There were 19,873 patients identified who were ≥70 years undergoing surgery for hip fracture as part of the American College of Surgeons National Surgical Quality Improvement Program (ACS-NSQIP). The median postoperative day of diagnosis (and interquartile range) for myocardial infarction was 3 (1-5), cardiac arrest requiring cardiopulmonary resuscitation 3 (0-8), stroke 3 (1-10), pneumonia 4 (2-10), pulmonary embolism 4 (2-11), urinary tract infection 7 (2-13), deep vein thrombosis 9 (4-16), sepsis 9 (4-18), mortality 11 (6-19), and surgical site infection 16 (11-22). For the earliest diagnosed adverse events, the rate of adverse events had diminished by postoperative day 30. For the later diagnosed adverse events, the rate of adverse events remained high at postoperative day 30. Findings help to enable more targeted clinical surveillance, inform patient counseling, and determine the duration of follow-up required to study specific adverse events effectively. Orthopedic surgeons should have the lowest threshold for testing for each adverse event during the time period of greatest risk.
Continue to: Geriatric hip fracture surgery is associated with...
Geriatric hip fracture surgery is associated with a higher rate of occurrence of postoperative adverse events than any other commonly performed orthopedic procedure.1-4 Indeed, the 90-day mortality rate following a geriatric hip fracture surgery may be as high as 15%2 and the 30-day morbidity rate as high as 30%.3 Furthermore, more than half of postoperative mortalities following orthopedic procedures occur after surgery for hip fracture.4 Therefore, extensive research has been conducted regarding interventions to reduce the rates of adverse events following a hip fracture surgery.5-12 For example, randomized trials have been conducted involving venous thromboembolism prophylaxis,5,6nutritional supplementation,7 delirium prevention,8-10 anemia correction,11 geriatrics consultation,9 and anesthetic technique.12
Despite these extensive research efforts, there is currently little information in the literature regarding when postoperative adverse events occur. A clear depiction of the timing of adverse events could help target clinical surveillance, inform patient counseling, and determine the duration of follow-up required for studies. The reason that the timing of adverse events has not been previously characterized may be that the sample sizes available through standard single- or multi-institutional studies may be insufficient to accurately characterize the timing of rare adverse events (eg, myocardial infarction, stroke, etc.). Moreover, although administrative datasets have become common data sources for investigation of rare postoperative adverse events,13-16 such data sources often do not contain data on the timing of diagnosis.
The American College of Surgeons National Surgical Quality Improvement Program (ACS-NSQIP) is a relatively new and growing surgical registry.1,3,13-22 The registry follows up patients undergoing surgical procedures at several hundred community and academic institutions nationwide. Unlike the administrative datasets discussed above, the ACS-NSQIP characterizes the postoperative day of diagnosis of well-defined adverse events during the first 30 postoperative days.22
In this study, data collected by the ACS-NSQIP are used to characterize the timing of 10 specific postoperative adverse events following a geriatric hip fracture surgery.
Continue to: METHODS...
METHODS
A retrospective analysis of data collected prospectively through the ACS-NSQIP was conducted. Geriatric patients who underwent hip fracture surgery during 2010 to 2013 were identified. Specific inclusion criteria were (1) International Classification of Diseases, Ninth Revision, diagnosis code 820, (2) primary Current Procedural Terminology codes 27125, 27130, 27235, 27236, 27244, or 27245, and (3) age ≥70 years.
The ACS-NSQIP captures patient demographic, comorbidity, and procedural characteristics at baseline.22 At the end of the 30-day follow-up period, the ACS-NSQIP personnel review both inpatient and outpatient charts to characterize the occurrence vs nonoccurrence of specific postoperative adverse events.22-25 When an adverse event does occur, the postoperative day of diagnosis is recorded.
For this study, the following adverse event categories were investigated: myocardial infarction, cardiac arrest requiring cardiopulmonary resuscitation, stroke, pneumonia, pulmonary embolism, urinary tract infection, deep vein thrombosis, sepsis (either with or without shock), mortality, and surgical site infection (including superficial surgical site infection, deep surgical site infection, and organ or space surgical site infection). Detailed definitions of each adverse event are provided in ACS-NSQIP materials.22
First, the 30-day incidence (and the associated 95% confidence interval) was determined for each adverse event. Second, the median postoperative day of diagnosis (and the associated interquartile range) was determined for each adverse event. Third, the postoperative length of stay was used to estimate the proportion of diagnoses occurring prior to vs following discharge for each adverse event. Finally, multivariate Cox proportional hazards models were used to identify independent risk factors for earlier occurrence of postoperative adverse events. The final models were selected using a backward stepwise process that sequentially eliminated variables with the weakest associations until all variables had P < .05.
Because the ACS-NSQIP reports timing data in calendar days, when the postoperative length of stay was equivalent to the postoperative day of diagnosis, it was not possible to ascertain whether the diagnosis occurred prior to or following discharge. For this study, when the postoperative length of stay was equivalent to the postoperative day of diagnosis, the adverse event was considered to have been diagnosed following discharge. The rationale for this is that for most of the adverse events, it was thought to be unlikely that an inpatient would be discharged before the end of the same day as an inpatient diagnosis. However, there was one exception to this rule; when the postoperative day of discharge, the postoperative length of stay, and the postoperative day of death were all equivalent, the adverse event was considered to have occurred prior to discharge. This is because when a patient dies during the initial inpatient stay, the ACS-NSQIP considers the postoperative length of stay to be equivalent to the postoperative day of death. This makes it much more likely that a diagnosis on the final hospital day had occurred in a patient who had not been discharged.
The mandatory ACS-NSQIP statement is “The American College of Surgeons National Surgical Quality Improvement Program and the hospitals participating in the ACS-NSQIP are the source of the data used herein; they have not verified and are not responsible for the statistical validity of the data analysis or the conclusions derived by the authors.”26
Continue to: RESULTS...
RESULTS
In total, 19,873 geriatric patients undergoing a hip fracture surgery were identified (Table 1). The rates of adverse events ranged from 6.7% for urinary tract infection to 0.6% for pulmonary embolism (Table 2).
Table 1. Patient Population
| Number | Percent |
Total | 19,873 | 100.0% |
Age |
|
|
70-74 years | 1852 | 9.3% |
75-79 years | 2764 | 13.9% |
80-84 years | 4328 | 21.8% |
85-89 years | 5525 | 27.8% |
≥90 years | 5404 | 27.2% |
Sex |
|
|
Male | 5359 | 27.0% |
Female | 14,514 | 73.0% |
Body mass index |
|
|
<30 kg/m2 | 17,733 | 89.2% |
≥30 kg/m2 | 2140 | 10.8% |
Functional status |
|
|
Independent | 14,348 | 72.2% |
Dependent | 5525 | 27.8% |
Diabetes | 3321 | 16.7% |
Congestive heart failure | 738 | 3.7% |
Dyspnea on exertion | 1542 | 7.8% |
Hypertension | 14,265 | 71.8% |
End-stage renal disease | 322 | 1.6% |
COPD | 2239 | 11.3% |
Current smoker | 1506 | 7.6% |
Abbreviation: COPD, chronic obstructive pulmonary disease.
Table 2. Patients with Adverse Events Diagnosed During the First 30 postoperative days (N = 19,873)
Adverse Event | Number | Percent | 95% CI |
Urinary tract infection | 1321 | 6.7% | 6.3%-7.0% |
Mortality | 1240 | 6.2% | 5.9%-6.6% |
Pneumonia | 771 | 3.9% | 3.6%-4.2% |
Sepsis | 428 | 2.2% | 2.0%-2.4% |
Myocardial infarction | 347 | 1.8% | 1.6%-1.9% |
Surgical site infection | 247 | 1.2% | 1.1%-1.4% |
Deep vein thrombosis | 199 | 1.0% | 0.9%-1.1% |
Stroke | 144 | 0.7% | 0.6%-0.8% |
Cardiac arrest | 136 | 0.7% | 0.6%-0.8% |
Pulmonary embolism | 126 | 0.6% | 0.5%-0.7% |
Abbreviation: CI, confidence interval.
Figure 1 depicts the timing of postoperative adverse events in detail in histograms and timing curves. For the earliest diagnosed adverse events, the rate of adverse events had diminished by postoperative day 30. For the later diagnosed adverse events, the rate of adverse events remained high at postoperative day 30.
Figure 2 provides the summary statistics for adverse events diagnosed in the first 30 postoperative days. The median postoperative day of diagnosis (and the interquartile range) was 3 (1-5) for myocardial infarction, 3 (0-8) for cardiac arrest requiring cardiopulmonary resuscitation, 3 (1-10) for stroke, 4 (2-10) for pneumonia, 4 (2-11) for pulmonary embolism, 7 (2-13) for urinary tract infection, 9 (4-16) for deep vein thrombosis, 9 (4-18) for sepsis, 11 (6-19) for mortality, and 16 (11-22) for surgical site infection.
Figure 3 depicts the timing of adverse events relative to discharge. The proportions of adverse events diagnosed prior to discharge were 81.0% for myocardial infarction, 77.8% for stroke, 76.1% for cardiac arrest requiring cardiopulmonary resuscitation, 71.9% for pulmonary embolism, 71.1% for pneumonia, 58.0% for urinary tract infection, 52.1% for sepsis, 46.9% for deep vein thrombosis, 44.3% for mortality, and 27.6% for surgical site infection.
Table 3 shows the independent risk factors for earlier occurrence of adverse events. Following multivariate stepwise selection of final models, at least 1 patient characteristic was independently associated with the timing of cardiac arrest, stroke, urinary tract infection, deep vein thrombosis, and death. In contrast, no patient characteristics were independently associated with the timing of myocardial infarction, pneumonia, pulmonary embolism, sepsis, and surgical site infection.
Table 3. Timing of Diagnosis of Adverse Eventsa
Adverse events and associated baseline characteristic(s) | Median postoperative day of diagnosis with vs without baseline characteristic | P-valueb |
Cardiac arrest |
|
|
End-stage renal disease | 1 vs 3 | .005 |
Stroke |
|
|
Hypertension | 4 vs 2 | .025 |
Dependent functional status | 2 vs 4 | .027 |
Urinary tract infection |
|
|
Female sex | 6 vs 8 | .009 |
Deep vein thrombosis |
|
|
Body mass index ≥30 kg/m2 | 5 vs 10 | .015 |
Death |
|
|
End-stage renal disease | 10 vs 11 | .031 |
aBaseline characteristics that were independently associated with the timing of each adverse event were identified through a backwards stepwise selection process initially including all characteristics listed in Table 1, and sequentially excluding characteristics with the weakest associations until only characteristics with P < .05 remained. Independent associations with the timing of cardiac arrest, stroke, urinary tract infection, deep vein thrombosis, and death are shown. There were no characteristics independently associated with timing of myocardial infarction, pneumonia, pulmonary embolism, sepsis, or surgical site infection; hence, these adverse events are not listed in the table.
bFrom final Cox proportional hazards models identified through multivariate stepwise selection.
Continue to: DISCUSSION...
DISCUSSION
Adverse events are extremely common following a geriatric hip fracture surgery.1-4 Despite extensive investigation regarding methods to prevent these events,5-12 there is limited published description of the timing at which such events occur. This study used a large prospectively followed up cohort of geriatric patients undergoing a hip fracture surgery to deliver a better description of the timing of adverse events than was previously available. The findings of this study should enable more targeted clinical surveillance, inform patient counseling, and help determine the duration of follow-up required for studies on adverse events.
There was wide variability in the timing at which the different postoperative adverse events were diagnosed (Figures 1, 2). Myocardial infarction was diagnosed the earliest, with more than three-fourth of diagnoses in the first postoperative week. Other relatively early-diagnosed adverse events included cardiac arrest requiring cardiopulmonary resuscitation, stroke, pneumonia, and pulmonary embolism.
The latest-diagnosed adverse event was surgical site infection (Figures 1, 2). Surgical site infection was actually the only adverse event with a rate of diagnosis during the first week that was lower than the rate of diagnosis later in the month (as can be seen by the inflection in the timing curve for surgical site infection in Figure 1). Mortality showed a relatively consistent rate of diagnosis throughout the entire first postoperative month. Other relatively late-diagnosed postoperative events, including sepsis, deep vein thrombosis, and urinary tract infection, showed varying degrees of decreased rate of diagnosis near the end of the first postoperative month. Of note, for the later-diagnosed adverse events, the estimated median and interquartile ranges (Figure 2) were presumably quite biased toward earlier diagnosis, as the 30-day follow-up period clearly failed to capture a large proportion of later-occurring adverse events (Figure 1).
Certain risk factors were independently associated with earlier occurrence of adverse events. Perhaps most strikingly, body mass index in the obese range was associated with substantially earlier occurrence of deep vein thrombosis (median of 5 vs 10 days). This finding suggests that clinical monitoring for deep vein thrombosis should be performed earlier in patients with greater body mass index. Also notable is the earlier occurrence of cardiac arrest and death among patients with end-stage renal disease than among those without. Patients with end-stage renal disease may have a greater risk for these adverse events immediately following the cardiac stresses of surgery.27 Similarly, such patients may be more prone to early electrolyte abnormalities and arrhythmia.
Continue to: In addition to its clinical implications, this study...
In addition to its clinical implications, this study informs about the interpretation of the many studies of adverse events following hip fracture procedures that have been conducted using retrospective data. Several such studies have relied on inpatient-only administrative databases.4,13,14,28-35 As clearly demonstrated in Figure 3, for most of the commonly studied adverse events, inpatient-only databases failed to capture a large proportion of adverse events occurring in the first postoperative month. This highlights a substantial limitation of this commonly published type of study that is often not emphasized in the literature.
There has also been an increase in the publication of studies of adverse events following a hip fracture surgery using the ACS-NSQIP data.3,13,14,17,18,21 As discussed, the ACS-NSQIP provides data on 30-days of follow-up. This relatively extended follow-up is often touted as a distinct advantage. However, this study demonstrates that even the 30-day follow-up afforded by the ACS-NSQIP is limited in its ability to enable investigation of the later-occurring adverse events (Figure 1). In particular, the rate of surgical site infection shows little sign of slowing by postoperative day 30. Similarly, the rates of mortality, sepsis, deep vein thrombosis, and urinary tract infection remain substantial.
This study does have limitations. First, as discussed, the duration of follow-up is a limitation of any ACS-NSQIP-based investigation, including this study. Second, the ACS-NSQIP does not capture relevant orthopedic-specific outcomes (eg, screw cutout). In addition, it could not be determined with certainty whether adverse events occurring on the final hospital day occurred prior to or following discharge. However, only a small proportion of most of the adverse events was diagnosed on the final hospital day. Finally, the ACS-NSQIP reports on days from the operation until diagnosis of the adverse event. Although some adverse events are probably diagnosed quickly after they have occurred (eg, myocardial infarction and cardiac arrest), other adverse events may have a delayed diagnosis (eg, surgical site infection may be identified days after its initial occurrence during a follow-up examination). Therefore, it is important to note the subtle distinction between occurrence and diagnosis throughout the article. This article reports on the timing of diagnosis, not actual occurrence.
CONCLUSION
The timing of postoperative adverse events has been understudied in the past. This may be due to an inability of standard single- or multi-institutional investigations to achieve sample sizes adequate to study the less commonly occurring adverse events. Using a relatively new prospective surgical registry, this study provides a far more detailed description of the timing of adverse events following surgery than was previously available. The authors anticipate that these data can be used to inform patient counseling, target clinical surveillance, and direct clinical research. The authors chose to study the timing of postoperative adverse events following geriatric hip fracture surgery because of the high rate of adverse events associated with the procedure. However, future ACS-NSQIP studies may involve characterization of the timing of adverse events following other orthopedic and non-orthopedic procedures.
This paper will be judged for the Resident Writer’s Award.
1. Schilling PL, Hallstrom BR, Birkmeyer JD, Carpenter JE. Prioritizing perioperative quality improvement in orthopaedic surgery. J Bone Joint Surg Am. 2010;92(9):1884-1889. doi:10.2106/jbjs.i.00735.
2. Forte ML, Virnig BA, Swiontkowski MF, et al. Ninety-day mortality after intertrochanteric hip fracture: does provider volume matter? J Bone Joint Surg Am. 2010;92(4):799-806. doi:10.2106/jbjs.h.01204.
3. Pugely AJ, Martin CT, Gao Y, Klocke NF, Callaghan JJ, Marsh JL. A risk calculator for short-term morbidity and mortality after hip fracture surgery. J Orthop Trauma.2014;28(2):63-69. doi:10.1097/BOT.0b013e3182a22744.
4. Bhattacharyya T, Iorio R, Healy WL. Rate of and risk factors for acute inpatient mortality after orthopaedic surgery. J Bone Joint Surg Am. 2002;84-a(4):562-572.
5. Eriksson BI, Lassen MR. Duration of prophylaxis against venous thromboembolism with fondaparinux after hip fracture surgery: a multicenter, randomized, placebo-controlled, double-blind study. Arch Intern Med. 2003;163(11):1337-1342. doi:10.1001/archinte.163.11.1337.
6. Handoll HH, Farrar MJ, McBirnie J, Tytherleigh-Strong G, Milne AA, Gillespie WJ. Heparin, low molecular weight heparin and physical methods for preventing deep vein thrombosis and pulmonary embolism following surgery for hip fractures. Cochrane Database Syst Rev.2002;(4):Cd000305. doi:10.1002/14651858.cd000305.
7. Avenell A, Handoll HH. Nutritional supplementation for hip fracture aftercare in the elderly. Cochrane Database Syst Rev. 2004;(1):Cd001880. doi:10.1002/14651858.CD001880.pub2.
8. Marcantonio ER, Flacker JM, Wright RJ, Resnick NM. Reducing delirium after hip fracture: a randomized trial. J Am Geriatr Soc. 2001;49(5):516-522. doi:10.1046/j.1532-5415.2001.49108.x.
9. Deschodt M, Braes T, Flamaing J, et al. Preventing delirium in older adults with recent hip fracture through multidisciplinary geriatric consultation. J Am Geriatr Soc. 2012;60(4):733-739. doi:10.1111/j.1532-5415.2012.03899.x.
10. Marcantonio ER, Palihnich K, Appleton P, Davis RB. Pilot randomized trial of donepezil hydrochloride for delirium after hip fracture. J Am Geriatr Soc. 2011;59 Suppl 2:S282-S288. doi:10.1111/j.1532-5415.2011.03691.x.
11. Parker MJ. Iron supplementation for anemia after hip fracture surgery: a randomized trial of 300 patients. J Bone Joint Surg Am. 2010;92(2):265-269. doi:10.2106/jbjs.i.00883.
12. Urwin SC, Parker MJ, Griffiths R. General versus regional anaesthesia for hip fracture surgery: a meta-analysis of randomized trials. Br J Anaesth. 2000;84(4):450-455. doi:10.1093/oxfordjournals.bja.a013468.
13. Bohl DD, Basques BA, Golinvaux NS, Baumgaertner MR, Grauer JN. Nationwide Inpatient Sample and National Surgical Quality Improvement Program give different results in hip fracture studies. Clin Orthop Relat Res. 2014;472(6):1672-1680. doi:10.1007/s11999-014-3559-0.
14. Bohl DD, Grauer JN, Leopold SS. Editor's spotlight/Take 5: nationwide inpatient sample and national surgical quality improvement program give different results in hip fracture studies. Clin Orthop Relat Res. 2014;472(6):1667-1671. doi:10.1007/s11999-014-3595-9.
15. Bohl DD, Russo GS, Basques BA, et al. Variations in data collection methods between national databases affect study results: a comparison of the nationwide inpatient sample and national surgical quality improvement program databases for lumbar spine fusion procedures. J Bone Joint Surg Am. 2014;96(23):e193. doi:10.2106/jbjs.m.01490.
16. Levin PE. Apples, oranges, and national databases: commentary on an article by Daniel D. Bohl, MPH, et al.: "Variations in data collection methods between national databases affect study results: a comparison of the nationwide inpatient sample and national surgical quality improvement program databases for lumbar spine fusion procedures.” J Bone Joint Surg Am. 2014;96(23):e198. doi:10.2106/jbjs.n.00890.
17. Basques BA, Bohl DD, Golinvaux NS, Leslie MP, Baumgaertner MR, Grauer JN. Postoperative length of stay and thirty-day readmission following geriatric hip fracture: an analysis of 8,434 patients. J Orthop Trauma. 2015;29(3):e115-e120. doi:10.1097/bot.0000000000000222.
18. Golinvaux NS, Bohl DD, Basques BA, Baumgaertner MR, Grauer JN. Diabetes confers little to no increased risk of postoperative complications after hip fracture surgery in geriatric patients. Clin Orthop Relat Res. 2015;473(3):1043-1051. doi:10.1007/s11999-014-3945-7.
19. Maciejewski ML, Radcliff TA, Henderson WG, et al. Determinants of postsurgical discharge setting for male hip fracture patients. J Rehabil Res Dev. 2013;50(9):1267-1276. doi:10.1682/jrrd.2013.02.0041.
20. Molina CS, Thakore RV, Blumer A, Obremskey WT, Sethi MK. Use of the National Surgical Quality Improvement Program in orthopaedic surgery. Clin Orthop Relat Res.2015;473(5):1574-1581. doi:10.1007/s11999-014-3597-7.
21. Bohl DD, Basques BA, Golinvaux NS, Miller CP, Baumgaertner MR, Grauer JN. Extramedullary compared with intramedullary implants for intertrochanteric hip fractures: thirty-day outcomes of 4432 procedures from the ACS NSQIP database. J Bone Joint Surg Am. 2014;96(22):1871-1877. doi:10.2106/jbjs.n.00041.
22. Alosh H, Riley LH 3rd, Skolasky RL. Insurance status, geography, race, and ethnicity as predictors of anterior cervical spine surgery rates and in-hospital mortality: an examination of United States trends from 1992 to 2005. Spine (Phila Pa 1976). 2009;34(18):1956-1962. doi:10.1097/BRS.0b013e3181ab930e.
23. Cahill KS, Chi JH, Day A, Claus EB. Prevalence, complications, and hospital charges associated with use of bone-morphogenetic proteins in spinal fusion procedures. JAMA.2009;302(1):58-66. doi:10.1001/jama.2009.956.
24. Ingraham AM, Richards KE, Hall BL, Ko CY. Quality improvement in surgery: the American College of Surgeons National Surgical Quality Improvement Program approach. Adv Surg. 2010;44(1):251-267. doi:10.1016/j.yasu.2010.05.003.
25. Shiloach M, Frencher SK Jr, Steeger JE, et al. Toward robust information: data quality and inter-rater reliability in the American College of Surgeons National Surgical Quality Improvement Program. J Am Coll Surg. 2010;210(1):6-16. doi:10.1016/j.jamcollsurg.2009.09.031.
26. ACS-NSQIP. Data Use Agreement. American College of Surgeons Web site. https://www.facs.org/quality-programs/acs-nsqip/participant-use/puf-form. Accessed September 20, 2018.
27. Blacher J, Guerin AP, Pannier B, Marchais SJ, London GM. Arterial calcifications, arterial stiffness, and cardiovascular risk in end-stage renal disease. Hypertension. 2001;38(4):938-942. doi:10.1161/hy1001.096358.
28. Browne JA, Cook C, Olson SA, Bolognesi MP. Resident duty-hour reform associated with increased morbidity following hip fracture. J Bone Joint Surg Am. 2009;91(9):2079-2085. doi:10.2106/jbjs.h.01240.
29. Browne JA, Pietrobon R, Olson SA. Hip fracture outcomes: does surgeon or hospital volume really matter? J Trauma. 2009;66(3):809-814. doi:10.1097/TA.0b013e31816166bb.
30. Menendez ME, Ring D. Failure to rescue after proximal femur fracture surgery. J Orthop Trauma. 2015;29(3):e96-e102. doi:10.1097/bot.0000000000000234.
31. Nikkel LE, Fox EJ, Black KP, Davis C, Andersen L, Hollenbeak CS. Impact of comorbidities on hospitalization costs following hip fracture. J Bone Joint Surg Am. 2012;94(1):9-17. doi:10.2106/jbjs.j.01077.
32. Anderson KL, Koval KJ, Spratt KF. Hip fracture outcome: is there a “July effect”? Am J Orthop. 2009;38(12):606-611.
33. Koval KJ, Rust CL, Spratt KF. The effect of hospital setting and teaching status on outcomes after hip fracture. Am J Orthop. 2011;40(1):19-28.
34. Bacon WE. Secular trends in hip fracture occurrence and survival: age and sex differences. J Aging Health. 1996;8(4):538-553. doi:10.1177/089826439600800404.
35. Orces CH. In-hospital hip fracture mortality trends in older adults: the National Hospital Discharge Survey, 1988-2007. J Am Geriatr Soc. 2013;61(12):2248-2249. doi:10.1111/jgs.12567.
TAKE-HOME POINTS
- The median postoperative day of diagnosis for myocardial infarction was 3, 3 for cardiac arrest requiring cardiopulmonary resuscitation, 3 for stroke, 4 for pneumonia, 4 for pulmonary embolism, 7 for urinary tract infection, 9 for deep vein thrombosis, 9 for sepsis, 11 for mortality, and 16 for surgical site infection.
- For the earliest diagnosed adverse events, the rate of adverse events had diminished by postoperative day 30; however, for the later diagnosed adverse events, the rate of adverse events remained high at postoperative day 30.
- The proportions of adverse events diagnosed prior to discharge were 81.0% for myocardial infarction, 77.8% for stroke, 76.1% for cardiac arrest requiring cardiopulmonary resuscitation, 71.9% for pulmonary embolism, 71.1% for pneumonia, 58.0% for urinary tract infection, 52.1% for sepsis, 46.9% for deep vein thrombosis, 44.3% for mortality, and 27.6% for surgical site infection.
- These results facilitate targeted clinical surveillance, guide patient counseling, and inform the duration of follow-up required in research studies.
- Clinicians should have the lowest threshold for testing for each adverse event during the time period of greatest risk.
Electronic Health Record Implementation Is Associated With a Negligible Change in Outpatient Volume and Billing
Take-Home Points
- With EHR implementation there are small changes in the level of billing coding.
- Although these changes may be statistically significant they are relatively minor.
- In the general internal medicine department, level 4 coding increased by 1.2% while level 3 coding decreased by 0.5%.
- In the orthopedics department, level 4 coding increased by 3.3% while level 3 coding decreased by 3.1%.
- Reports in the lay media regarding dramatic up-coding after EHR implementation may be misleading.
The Health Information Technology for Economic and Clinical Health (HITECH) Act, which was signed into law in 2009, mandated that hospitals that care for Medicare patients either begin using electronic health records (EHRs) or pay a nontrivial penalty.1 By now, the majority of orthopedic surgeons have implemented EHRs in their practices.2 Despite ongoing debate in the orthopedic literature,3 EHRs are expected to improve coordination of care, reduce duplicate testing, and reduce costs over the long term as healthcare insurance coverage is extended to millions more Americans.
In early coverage, however, media reported that EHR implementation at some hospitals was correlated with substantial increases in Medicare payments.4 Journalists suggested the billion dollars more paid by Medicare to hospitals in 2010 than in 2005 were partly attributable to up-coding facilitated by EHRs.5 The secretary of the Department of Health and Human Services (DHHS) and the attorney general of the Department of Justice also weighed in on this controversy by expressing their concerns in a letter to the presidents of 5 hospital associations.6 The inspector general of DHHS also published a report critical of Medicare officials’ oversight of EHRs.7Responding to the critical reception of EHR implementations, investigators studied the validity of the early reports and anecdotes. Some initial reports cited the emergency department (ED) as an area at high risk for using the convenience of EHRs to up-code visits.5 The DHHS Office of the Inspector General noted that, between 2001 and 2010, the proportion of claims for lower reimbursement categories of American Medical Association Current Procedural Terminology (CPT) codes decreased while the proportion for higher-paid billing codes increased for all visit types.8 Addressing these concerns, the American Hospital Association9 issued a brief that noted that any observed coding increases were more likely attributable to more ED use by Medicare patients and increased average illness severity. In a thoughtful perspective, Pitts10 conceded that, though utilization and illness severity may explain part of the trend, the trend may also be related to technological innovations and changes in culture and practice style in the ED.
Because these studies and reports variously suggested that EHR implementation affects patient volume and up-coding, and because none of the reports specifically addressed orthopedics, we conducted a study to determine whether any significant up-coding or change in patient volumes occurred around the time of EHR implementation in ambulatory practices at our academic medical center. In a recent national study, Adler-Milstein and Jha11 compared billing data of hospitals that adopted EHRs and hospitals that did not. Although both groups showed increased billing trends, the increases were not significantly different between the EHR adopters and nonadopters. To more effectively control for the confounding differences between groups of EHR adopters and nonadopters, we studied individual departments during EHR implementation at our institution.
Methods
In 2011, our academic medical center began the transition to EHRs (Epic). We examined our center’s trends in patient volumes and billing coding around the time of the transition in the outpatient practice of the general internal medicine (GIM) department (EHR transition, October 2011) and the outpatient practice of the orthopedics department (EHR transition, March 2012). These departments were chosen because they are representative of a GIM practice and a subspecialty practice, and because a recent study found that GIM practitioners and orthopedic surgeons were among those specialists who used EHRs the most.12
After this study was approved by our Human Investigations Committee, we began using CPT codes to identify all outpatient visits (new, consultation, and return) on a monthly basis. We compared the volume of patient visits and the billing coding level in the GIM and orthopedics departments before and after EHR implementation. Pearson χ2 test was used when appropriate, and statistical analyses were performed with SPSS for Windows Version 16.0.
Results
In the GIM department, mean monthly volume of patient visits in the 12 months before EHR implementation was similar to that in the 12 months afterward (613 vs 587; P = .439). Even when normalized for changes in provider availability (maternity leave), the decrease in volume of patient visits after EHR implementation in the GIM department was not significant (6.9%; P = .107). Likewise, in the orthopedics department, mean monthly volume of patient visits in the 17 months before EHR implementation was similar to that in the 7 months afterward (2157 vs 2317; P = .156). In fact, patient volumes remained constant during the EHR transition (Figure 1).
EHR implementation brought small changes in billing coding levels. In the GIM department, the largest change was a 1.2% increase in level 4 billing coding—an increase accompanied by a 0.5% decrease in level 3 coding. 
Discussion
It is remarkable that the volumes of patient visits in the GIM and orthopedics departments at our academic center were not affected by EHR implementation. 
Rather than reduce scheduling during the EHR transition, surgeons in our practice either added or lengthened clinic sessions, and the level of ancillary staffing was adjusted accordingly. As staffing costs at any given time are multifactorial and vary widely, estimating the cost of these staffing changes during the EHR transition is difficult. We should note that extending ancillary staff hours during the transition very likely increased costs, and it is unclear whether they were higher or lower than the costs that would have been incurred had we reduced scheduling or tried some combination of these strategies.
Although billing coding levels changed with EHR implementation, the changes were small. In the GIM department, level 4 CPT coded visits as percentages of all visits increased to 59.5% from 58.3%, and level 5 visits increased to 6.2% from 6.0%; in the orthopedics department, level 4 visits increased to 40.2% from 37.1%, and level 5 visits increased to 5.5% from 3.8% (Table). The 1.2% and 0.2% absolute increases in level 4 and level 5 visits in the GIM department represent 2.1% and 3.3% relative increases in level 4 and level 5 visits, and the 3.3% and 1.7% absolute increases in the orthopedics department represent 8.4% and 44.7% relative increases in level 4 and level 5 visits after EHR implementation.
Although the absolute increases in level 4 and level 5 visits were relatively minor, popular media have raised the alarm about 43% and 82% relative increases in level 5 visits after EHR implementation in some hospitals’ EDs.4 Although our orthopedics department showed a 44.7% relative increase in level 5 visits after EHR implementation, this represented an increase of only 1.7% of patient visits overall. Our findings therefore indicate that lay media reports could be misleading. Nevertheless, the small changes we found were statistically significant.
One explanation for these small changes is that EHRs facilitate better documentation of services provided. Therefore, what seem to be billing coding changes could be more accurate reports of high-level care that is the same as before. In addition, because of meaningful use mandates that coincided with the requirement to implement EHRs, additional data elements are now being consistently collected and reviewed (these may not necessarily have been collected and reviewed before). In some patient encounters, these additional data elements may have contributed to higher levels of service, and this effect could be especially apparent in EDs.
Some have suggested a potential for large-scale up-coding during EHR transitions. Others have contended that coding level increases are a consequence of a time-intensive data entry process, collection and review of additional data, and more accurate reporting of services already being provided. We are not convinced that large coding changes are attributable solely to EHR implementation, as the changes at our center have been relatively small.
Nevertheless, minor coding level changes could translate to large changes in healthcare costs when scaled nationally. Although causes may be innocuous, any increases in national healthcare costs are concerning in our time of limited budgets and scrutinized healthcare utilization.
This study had its limitations. First, including billing data from only 2 departments at a single center may limit the generalizability of findings. However, we specifically selected a GIM department and a specialty (orthopedics) department in an attempt to capture a representative sample of practices. Another limitation is that we investigated billing codes over only 2 years, around the implementation of EHRs in these departments, and therefore may have captured only short-term changes. However, as patient volumes and billing are subject to many factors, including staffing changes (eg, new partners, new hires, retirements, other departures), we attempted to limit the effect of confounding variables by limiting the period of analysis.
Overall, changes in patient volume and coded level of service during EHR implementation at our institution were relatively small. Although the trend toward higher billing coding levels was statistically significant, these 0.2% and 1.7% increases in level 5 coding hardly deserve the negative attention from lay media. These small increases are unlikely caused by intentional up-coding, and more likely reflect better documentation of an already high level of care. We hope these findings allay the concern that up-coding increased dramatically with EHR implementation.
Am J Orthop. 2017;46(3):E172-E176. Copyright Frontline Medical Communications Inc. 2017. All rights reserved.
1. Centers for Medicare & Medicaid Services. Electronic health records (EHR) incentive programs. http://www.cms.gov/Regulations-and-Guidance/Legislation/EHRIncentivePrograms. Accessed February 5, 2015.
2. American Academy of Orthopaedic Surgeons Practice Management Committee. EMR: A Primer for Orthopaedic Surgeons. 2nd ed. Rosemont, IL: American Academy of Orthopaedic Surgeons; 2010.
3. Ries MD. Electronic medical records: friends or foes? Clin Orthop Relat Res. 2014;472(1):16-21.
4. Abelson R. Medicare is faulted on shift to electronic records. New York Times. November 29, 2012;B1. http://www.nytimes.com/2012/11/29/business/medicare-is-faulted-in-electronic-medical-records-conversion.html. Accessed February 5, 2015.
5. Abelson R, Creswell J, Palmer G. Medicare bills rise as records turn electronic. New York Times. September 22, 2012;A1. http://www.nytimes.com/2012/09/22/business/medicare-billing-rises-at-hospitals-with-electronic-records.html. Accessed February 5, 2015.
6. Carlson J. Warning bell. Potential for fraud through use of EHRs draws federal scrutiny. Mod Healthc. 2012;42(40):8-9.
7. Levinson DR. Early assessment finds that CMS faces obstacles in overseeing the Medicare EHR Incentive Program. Dept of Health and Human Services, Office of Inspector General website. https://oig.hss.gov/oei/reports/oei-05-11-00250.pdf. Publication OEI-05-11-00250. Published November 2012. Accessed February 5, 2015.
8. Levinson DR. Coding trends of Medicare evaluation and management services. Dept of Health and Human Services, Office of Inspector General website. https://oig.hhs.gov/oei/reports/oei-04-10-00180.pdf. Publication OEI-04-10-00180. Published May 2012. Accessed February 5, 2015.
9. American Hospital Association. Sicker, more complex patients are driving up intensity of ED care [issue brief]. http://www.aha.org/content/13/13issuebrief-ed.pdf. Published May 2, 2013. Accessed February 5, 2015.
10. Pitts SR. Higher-complexity ED billing codes—sicker patients, more intensive practice, or improper payments? N Engl J Med. 2012;367(26):2465-2467.
11. Adler-Milstein J, Jha AK. No evidence found that hospitals are using new electronic health records to increase Medicare reimbursements. Health Aff (Millwood). 2014;33(7):1271-1277.
12. Kokkonen EW, Davis SA, Lin HC, Dabade TS, Feldman SR, Fleischer AB Jr. Use of electronic medical records differs by specialty and office settings. J Am Med Inform Assoc. 2013;20(e1):e33-e38.
13. Samaan ZM, Klein MD, Mansour ME, DeWitt TG. The impact of the electronic health record on an academic pediatric primary care center. J Ambul Care Manage. 2009;32(3):180-187.
Take-Home Points
- With EHR implementation there are small changes in the level of billing coding.
- Although these changes may be statistically significant they are relatively minor.
- In the general internal medicine department, level 4 coding increased by 1.2% while level 3 coding decreased by 0.5%.
- In the orthopedics department, level 4 coding increased by 3.3% while level 3 coding decreased by 3.1%.
- Reports in the lay media regarding dramatic up-coding after EHR implementation may be misleading.
The Health Information Technology for Economic and Clinical Health (HITECH) Act, which was signed into law in 2009, mandated that hospitals that care for Medicare patients either begin using electronic health records (EHRs) or pay a nontrivial penalty.1 By now, the majority of orthopedic surgeons have implemented EHRs in their practices.2 Despite ongoing debate in the orthopedic literature,3 EHRs are expected to improve coordination of care, reduce duplicate testing, and reduce costs over the long term as healthcare insurance coverage is extended to millions more Americans.
In early coverage, however, media reported that EHR implementation at some hospitals was correlated with substantial increases in Medicare payments.4 Journalists suggested the billion dollars more paid by Medicare to hospitals in 2010 than in 2005 were partly attributable to up-coding facilitated by EHRs.5 The secretary of the Department of Health and Human Services (DHHS) and the attorney general of the Department of Justice also weighed in on this controversy by expressing their concerns in a letter to the presidents of 5 hospital associations.6 The inspector general of DHHS also published a report critical of Medicare officials’ oversight of EHRs.7Responding to the critical reception of EHR implementations, investigators studied the validity of the early reports and anecdotes. Some initial reports cited the emergency department (ED) as an area at high risk for using the convenience of EHRs to up-code visits.5 The DHHS Office of the Inspector General noted that, between 2001 and 2010, the proportion of claims for lower reimbursement categories of American Medical Association Current Procedural Terminology (CPT) codes decreased while the proportion for higher-paid billing codes increased for all visit types.8 Addressing these concerns, the American Hospital Association9 issued a brief that noted that any observed coding increases were more likely attributable to more ED use by Medicare patients and increased average illness severity. In a thoughtful perspective, Pitts10 conceded that, though utilization and illness severity may explain part of the trend, the trend may also be related to technological innovations and changes in culture and practice style in the ED.
Because these studies and reports variously suggested that EHR implementation affects patient volume and up-coding, and because none of the reports specifically addressed orthopedics, we conducted a study to determine whether any significant up-coding or change in patient volumes occurred around the time of EHR implementation in ambulatory practices at our academic medical center. In a recent national study, Adler-Milstein and Jha11 compared billing data of hospitals that adopted EHRs and hospitals that did not. Although both groups showed increased billing trends, the increases were not significantly different between the EHR adopters and nonadopters. To more effectively control for the confounding differences between groups of EHR adopters and nonadopters, we studied individual departments during EHR implementation at our institution.
Methods
In 2011, our academic medical center began the transition to EHRs (Epic). We examined our center’s trends in patient volumes and billing coding around the time of the transition in the outpatient practice of the general internal medicine (GIM) department (EHR transition, October 2011) and the outpatient practice of the orthopedics department (EHR transition, March 2012). These departments were chosen because they are representative of a GIM practice and a subspecialty practice, and because a recent study found that GIM practitioners and orthopedic surgeons were among those specialists who used EHRs the most.12
After this study was approved by our Human Investigations Committee, we began using CPT codes to identify all outpatient visits (new, consultation, and return) on a monthly basis. We compared the volume of patient visits and the billing coding level in the GIM and orthopedics departments before and after EHR implementation. Pearson χ2 test was used when appropriate, and statistical analyses were performed with SPSS for Windows Version 16.0.
Results
In the GIM department, mean monthly volume of patient visits in the 12 months before EHR implementation was similar to that in the 12 months afterward (613 vs 587; P = .439). Even when normalized for changes in provider availability (maternity leave), the decrease in volume of patient visits after EHR implementation in the GIM department was not significant (6.9%; P = .107). Likewise, in the orthopedics department, mean monthly volume of patient visits in the 17 months before EHR implementation was similar to that in the 7 months afterward (2157 vs 2317; P = .156). In fact, patient volumes remained constant during the EHR transition (Figure 1).
EHR implementation brought small changes in billing coding levels. In the GIM department, the largest change was a 1.2% increase in level 4 billing coding—an increase accompanied by a 0.5% decrease in level 3 coding.
Discussion
It is remarkable that the volumes of patient visits in the GIM and orthopedics departments at our academic center were not affected by EHR implementation.
Rather than reduce scheduling during the EHR transition, surgeons in our practice either added or lengthened clinic sessions, and the level of ancillary staffing was adjusted accordingly. As staffing costs at any given time are multifactorial and vary widely, estimating the cost of these staffing changes during the EHR transition is difficult. We should note that extending ancillary staff hours during the transition very likely increased costs, and it is unclear whether they were higher or lower than the costs that would have been incurred had we reduced scheduling or tried some combination of these strategies.
Although billing coding levels changed with EHR implementation, the changes were small. In the GIM department, level 4 CPT coded visits as percentages of all visits increased to 59.5% from 58.3%, and level 5 visits increased to 6.2% from 6.0%; in the orthopedics department, level 4 visits increased to 40.2% from 37.1%, and level 5 visits increased to 5.5% from 3.8% (Table). The 1.2% and 0.2% absolute increases in level 4 and level 5 visits in the GIM department represent 2.1% and 3.3% relative increases in level 4 and level 5 visits, and the 3.3% and 1.7% absolute increases in the orthopedics department represent 8.4% and 44.7% relative increases in level 4 and level 5 visits after EHR implementation.
Although the absolute increases in level 4 and level 5 visits were relatively minor, popular media have raised the alarm about 43% and 82% relative increases in level 5 visits after EHR implementation in some hospitals’ EDs.4 Although our orthopedics department showed a 44.7% relative increase in level 5 visits after EHR implementation, this represented an increase of only 1.7% of patient visits overall. Our findings therefore indicate that lay media reports could be misleading. Nevertheless, the small changes we found were statistically significant.
One explanation for these small changes is that EHRs facilitate better documentation of services provided. Therefore, what seem to be billing coding changes could be more accurate reports of high-level care that is the same as before. In addition, because of meaningful use mandates that coincided with the requirement to implement EHRs, additional data elements are now being consistently collected and reviewed (these may not necessarily have been collected and reviewed before). In some patient encounters, these additional data elements may have contributed to higher levels of service, and this effect could be especially apparent in EDs.
Some have suggested a potential for large-scale up-coding during EHR transitions. Others have contended that coding level increases are a consequence of a time-intensive data entry process, collection and review of additional data, and more accurate reporting of services already being provided. We are not convinced that large coding changes are attributable solely to EHR implementation, as the changes at our center have been relatively small.
Nevertheless, minor coding level changes could translate to large changes in healthcare costs when scaled nationally. Although causes may be innocuous, any increases in national healthcare costs are concerning in our time of limited budgets and scrutinized healthcare utilization.
This study had its limitations. First, including billing data from only 2 departments at a single center may limit the generalizability of findings. However, we specifically selected a GIM department and a specialty (orthopedics) department in an attempt to capture a representative sample of practices. Another limitation is that we investigated billing codes over only 2 years, around the implementation of EHRs in these departments, and therefore may have captured only short-term changes. However, as patient volumes and billing are subject to many factors, including staffing changes (eg, new partners, new hires, retirements, other departures), we attempted to limit the effect of confounding variables by limiting the period of analysis.
Overall, changes in patient volume and coded level of service during EHR implementation at our institution were relatively small. Although the trend toward higher billing coding levels was statistically significant, these 0.2% and 1.7% increases in level 5 coding hardly deserve the negative attention from lay media. These small increases are unlikely caused by intentional up-coding, and more likely reflect better documentation of an already high level of care. We hope these findings allay the concern that up-coding increased dramatically with EHR implementation.
Am J Orthop. 2017;46(3):E172-E176. Copyright Frontline Medical Communications Inc. 2017. All rights reserved.
1. Centers for Medicare & Medicaid Services. Electronic health records (EHR) incentive programs. http://www.cms.gov/Regulations-and-Guidance/Legislation/EHRIncentivePrograms. Accessed February 5, 2015.
2. American Academy of Orthopaedic Surgeons Practice Management Committee. EMR: A Primer for Orthopaedic Surgeons. 2nd ed. Rosemont, IL: American Academy of Orthopaedic Surgeons; 2010.
3. Ries MD. Electronic medical records: friends or foes? Clin Orthop Relat Res. 2014;472(1):16-21.
4. Abelson R. Medicare is faulted on shift to electronic records. New York Times. November 29, 2012;B1. http://www.nytimes.com/2012/11/29/business/medicare-is-faulted-in-electronic-medical-records-conversion.html. Accessed February 5, 2015.
5. Abelson R, Creswell J, Palmer G. Medicare bills rise as records turn electronic. New York Times. September 22, 2012;A1. http://www.nytimes.com/2012/09/22/business/medicare-billing-rises-at-hospitals-with-electronic-records.html. Accessed February 5, 2015.
6. Carlson J. Warning bell. Potential for fraud through use of EHRs draws federal scrutiny. Mod Healthc. 2012;42(40):8-9.
7. Levinson DR. Early assessment finds that CMS faces obstacles in overseeing the Medicare EHR Incentive Program. Dept of Health and Human Services, Office of Inspector General website. https://oig.hss.gov/oei/reports/oei-05-11-00250.pdf. Publication OEI-05-11-00250. Published November 2012. Accessed February 5, 2015.
8. Levinson DR. Coding trends of Medicare evaluation and management services. Dept of Health and Human Services, Office of Inspector General website. https://oig.hhs.gov/oei/reports/oei-04-10-00180.pdf. Publication OEI-04-10-00180. Published May 2012. Accessed February 5, 2015.
9. American Hospital Association. Sicker, more complex patients are driving up intensity of ED care [issue brief]. http://www.aha.org/content/13/13issuebrief-ed.pdf. Published May 2, 2013. Accessed February 5, 2015.
10. Pitts SR. Higher-complexity ED billing codes—sicker patients, more intensive practice, or improper payments? N Engl J Med. 2012;367(26):2465-2467.
11. Adler-Milstein J, Jha AK. No evidence found that hospitals are using new electronic health records to increase Medicare reimbursements. Health Aff (Millwood). 2014;33(7):1271-1277.
12. Kokkonen EW, Davis SA, Lin HC, Dabade TS, Feldman SR, Fleischer AB Jr. Use of electronic medical records differs by specialty and office settings. J Am Med Inform Assoc. 2013;20(e1):e33-e38.
13. Samaan ZM, Klein MD, Mansour ME, DeWitt TG. The impact of the electronic health record on an academic pediatric primary care center. J Ambul Care Manage. 2009;32(3):180-187.