User login
Timing of Adverse Events Following Geriatric Hip Fracture Surgery: A Study of 19,873 Patients in the American College of Surgeons National Surgical Quality Improvement Program
ABSTRACT
This study uses a prospective surgical registry to characterize the timing of 10 postoperative adverse events following geriatric hip fracture surgery. There were 19,873 patients identified who were ≥70 years undergoing surgery for hip fracture as part of the American College of Surgeons National Surgical Quality Improvement Program (ACS-NSQIP). The median postoperative day of diagnosis (and interquartile range) for myocardial infarction was 3 (1-5), cardiac arrest requiring cardiopulmonary resuscitation 3 (0-8), stroke 3 (1-10), pneumonia 4 (2-10), pulmonary embolism 4 (2-11), urinary tract infection 7 (2-13), deep vein thrombosis 9 (4-16), sepsis 9 (4-18), mortality 11 (6-19), and surgical site infection 16 (11-22). For the earliest diagnosed adverse events, the rate of adverse events had diminished by postoperative day 30. For the later diagnosed adverse events, the rate of adverse events remained high at postoperative day 30. Findings help to enable more targeted clinical surveillance, inform patient counseling, and determine the duration of follow-up required to study specific adverse events effectively. Orthopedic surgeons should have the lowest threshold for testing for each adverse event during the time period of greatest risk.
Continue to: Geriatric hip fracture surgery is associated with...
Geriatric hip fracture surgery is associated with a higher rate of occurrence of postoperative adverse events than any other commonly performed orthopedic procedure.1-4 Indeed, the 90-day mortality rate following a geriatric hip fracture surgery may be as high as 15%2 and the 30-day morbidity rate as high as 30%.3 Furthermore, more than half of postoperative mortalities following orthopedic procedures occur after surgery for hip fracture.4 Therefore, extensive research has been conducted regarding interventions to reduce the rates of adverse events following a hip fracture surgery.5-12 For example, randomized trials have been conducted involving venous thromboembolism prophylaxis,5,6nutritional supplementation,7 delirium prevention,8-10 anemia correction,11 geriatrics consultation,9 and anesthetic technique.12
Despite these extensive research efforts, there is currently little information in the literature regarding when postoperative adverse events occur. A clear depiction of the timing of adverse events could help target clinical surveillance, inform patient counseling, and determine the duration of follow-up required for studies. The reason that the timing of adverse events has not been previously characterized may be that the sample sizes available through standard single- or multi-institutional studies may be insufficient to accurately characterize the timing of rare adverse events (eg, myocardial infarction, stroke, etc.). Moreover, although administrative datasets have become common data sources for investigation of rare postoperative adverse events,13-16 such data sources often do not contain data on the timing of diagnosis.
The American College of Surgeons National Surgical Quality Improvement Program (ACS-NSQIP) is a relatively new and growing surgical registry.1,3,13-22 The registry follows up patients undergoing surgical procedures at several hundred community and academic institutions nationwide. Unlike the administrative datasets discussed above, the ACS-NSQIP characterizes the postoperative day of diagnosis of well-defined adverse events during the first 30 postoperative days.22
In this study, data collected by the ACS-NSQIP are used to characterize the timing of 10 specific postoperative adverse events following a geriatric hip fracture surgery.
Continue to: METHODS...
METHODS
A retrospective analysis of data collected prospectively through the ACS-NSQIP was conducted. Geriatric patients who underwent hip fracture surgery during 2010 to 2013 were identified. Specific inclusion criteria were (1) International Classification of Diseases, Ninth Revision, diagnosis code 820, (2) primary Current Procedural Terminology codes 27125, 27130, 27235, 27236, 27244, or 27245, and (3) age ≥70 years.
The ACS-NSQIP captures patient demographic, comorbidity, and procedural characteristics at baseline.22 At the end of the 30-day follow-up period, the ACS-NSQIP personnel review both inpatient and outpatient charts to characterize the occurrence vs nonoccurrence of specific postoperative adverse events.22-25 When an adverse event does occur, the postoperative day of diagnosis is recorded.
For this study, the following adverse event categories were investigated: myocardial infarction, cardiac arrest requiring cardiopulmonary resuscitation, stroke, pneumonia, pulmonary embolism, urinary tract infection, deep vein thrombosis, sepsis (either with or without shock), mortality, and surgical site infection (including superficial surgical site infection, deep surgical site infection, and organ or space surgical site infection). Detailed definitions of each adverse event are provided in ACS-NSQIP materials.22
First, the 30-day incidence (and the associated 95% confidence interval) was determined for each adverse event. Second, the median postoperative day of diagnosis (and the associated interquartile range) was determined for each adverse event. Third, the postoperative length of stay was used to estimate the proportion of diagnoses occurring prior to vs following discharge for each adverse event. Finally, multivariate Cox proportional hazards models were used to identify independent risk factors for earlier occurrence of postoperative adverse events. The final models were selected using a backward stepwise process that sequentially eliminated variables with the weakest associations until all variables had P < .05.
Because the ACS-NSQIP reports timing data in calendar days, when the postoperative length of stay was equivalent to the postoperative day of diagnosis, it was not possible to ascertain whether the diagnosis occurred prior to or following discharge. For this study, when the postoperative length of stay was equivalent to the postoperative day of diagnosis, the adverse event was considered to have been diagnosed following discharge. The rationale for this is that for most of the adverse events, it was thought to be unlikely that an inpatient would be discharged before the end of the same day as an inpatient diagnosis. However, there was one exception to this rule; when the postoperative day of discharge, the postoperative length of stay, and the postoperative day of death were all equivalent, the adverse event was considered to have occurred prior to discharge. This is because when a patient dies during the initial inpatient stay, the ACS-NSQIP considers the postoperative length of stay to be equivalent to the postoperative day of death. This makes it much more likely that a diagnosis on the final hospital day had occurred in a patient who had not been discharged.
The mandatory ACS-NSQIP statement is “The American College of Surgeons National Surgical Quality Improvement Program and the hospitals participating in the ACS-NSQIP are the source of the data used herein; they have not verified and are not responsible for the statistical validity of the data analysis or the conclusions derived by the authors.”26
Continue to: RESULTS...
RESULTS
In total, 19,873 geriatric patients undergoing a hip fracture surgery were identified (Table 1). The rates of adverse events ranged from 6.7% for urinary tract infection to 0.6% for pulmonary embolism (Table 2).
Table 1. Patient Population
| Number | Percent |
Total | 19,873 | 100.0% |
Age |
|
|
70-74 years | 1852 | 9.3% |
75-79 years | 2764 | 13.9% |
80-84 years | 4328 | 21.8% |
85-89 years | 5525 | 27.8% |
≥90 years | 5404 | 27.2% |
Sex |
|
|
Male | 5359 | 27.0% |
Female | 14,514 | 73.0% |
Body mass index |
|
|
<30 kg/m2 | 17,733 | 89.2% |
≥30 kg/m2 | 2140 | 10.8% |
Functional status |
|
|
Independent | 14,348 | 72.2% |
Dependent | 5525 | 27.8% |
Diabetes | 3321 | 16.7% |
Congestive heart failure | 738 | 3.7% |
Dyspnea on exertion | 1542 | 7.8% |
Hypertension | 14,265 | 71.8% |
End-stage renal disease | 322 | 1.6% |
COPD | 2239 | 11.3% |
Current smoker | 1506 | 7.6% |
Abbreviation: COPD, chronic obstructive pulmonary disease.
Table 2. Patients with Adverse Events Diagnosed During the First 30 postoperative days (N = 19,873)
Adverse Event | Number | Percent | 95% CI |
Urinary tract infection | 1321 | 6.7% | 6.3%-7.0% |
Mortality | 1240 | 6.2% | 5.9%-6.6% |
Pneumonia | 771 | 3.9% | 3.6%-4.2% |
Sepsis | 428 | 2.2% | 2.0%-2.4% |
Myocardial infarction | 347 | 1.8% | 1.6%-1.9% |
Surgical site infection | 247 | 1.2% | 1.1%-1.4% |
Deep vein thrombosis | 199 | 1.0% | 0.9%-1.1% |
Stroke | 144 | 0.7% | 0.6%-0.8% |
Cardiac arrest | 136 | 0.7% | 0.6%-0.8% |
Pulmonary embolism | 126 | 0.6% | 0.5%-0.7% |
Abbreviation: CI, confidence interval.
Figure 1 depicts the timing of postoperative adverse events in detail in histograms and timing curves. For the earliest diagnosed adverse events, the rate of adverse events had diminished by postoperative day 30. For the later diagnosed adverse events, the rate of adverse events remained high at postoperative day 30.
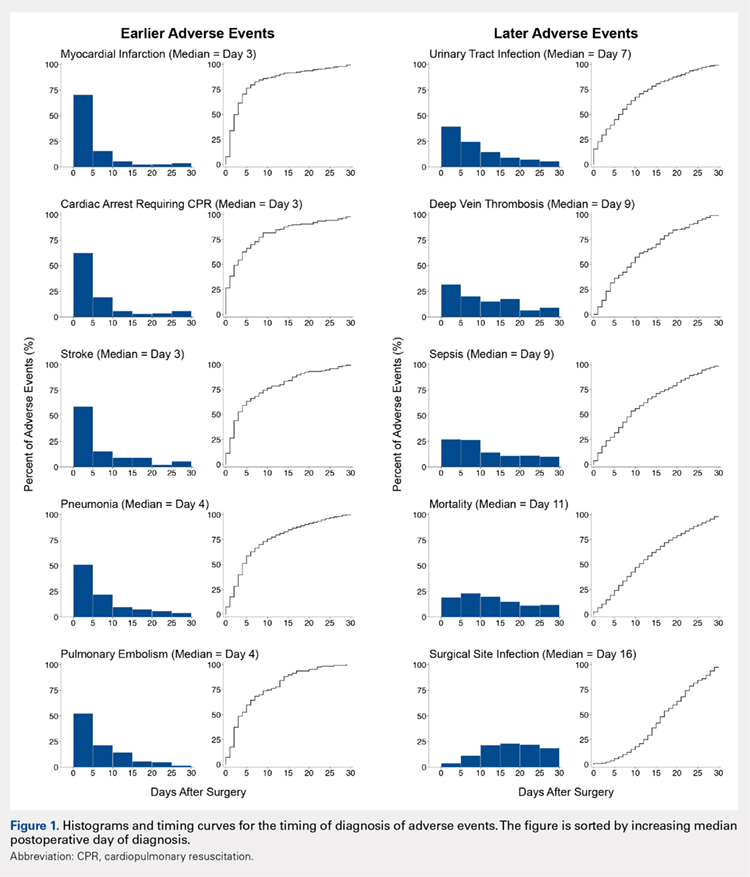
Figure 2 provides the summary statistics for adverse events diagnosed in the first 30 postoperative days. The median postoperative day of diagnosis (and the interquartile range) was 3 (1-5) for myocardial infarction, 3 (0-8) for cardiac arrest requiring cardiopulmonary resuscitation, 3 (1-10) for stroke, 4 (2-10) for pneumonia, 4 (2-11) for pulmonary embolism, 7 (2-13) for urinary tract infection, 9 (4-16) for deep vein thrombosis, 9 (4-18) for sepsis, 11 (6-19) for mortality, and 16 (11-22) for surgical site infection.
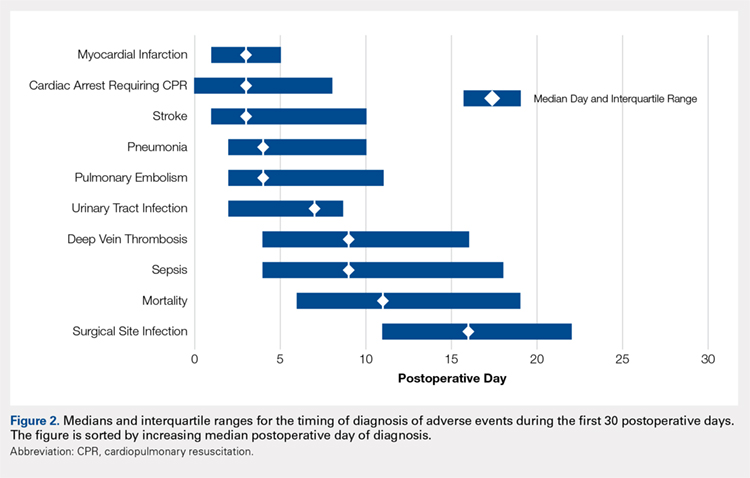
Figure 3 depicts the timing of adverse events relative to discharge. The proportions of adverse events diagnosed prior to discharge were 81.0% for myocardial infarction, 77.8% for stroke, 76.1% for cardiac arrest requiring cardiopulmonary resuscitation, 71.9% for pulmonary embolism, 71.1% for pneumonia, 58.0% for urinary tract infection, 52.1% for sepsis, 46.9% for deep vein thrombosis, 44.3% for mortality, and 27.6% for surgical site infection.
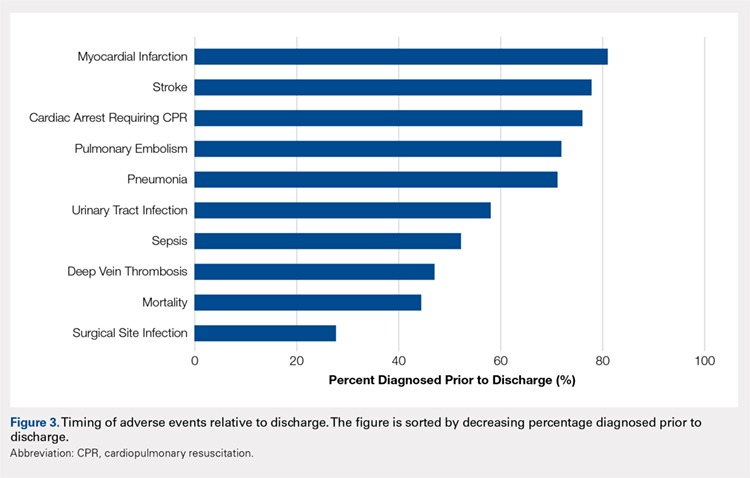
Table 3 shows the independent risk factors for earlier occurrence of adverse events. Following multivariate stepwise selection of final models, at least 1 patient characteristic was independently associated with the timing of cardiac arrest, stroke, urinary tract infection, deep vein thrombosis, and death. In contrast, no patient characteristics were independently associated with the timing of myocardial infarction, pneumonia, pulmonary embolism, sepsis, and surgical site infection.
Table 3. Timing of Diagnosis of Adverse Eventsa
Adverse events and associated baseline characteristic(s) | Median postoperative day of diagnosis with vs without baseline characteristic | P-valueb |
Cardiac arrest |
|
|
End-stage renal disease | 1 vs 3 | .005 |
Stroke |
|
|
Hypertension | 4 vs 2 | .025 |
Dependent functional status | 2 vs 4 | .027 |
Urinary tract infection |
|
|
Female sex | 6 vs 8 | .009 |
Deep vein thrombosis |
|
|
Body mass index ≥30 kg/m2 | 5 vs 10 | .015 |
Death |
|
|
End-stage renal disease | 10 vs 11 | .031 |
aBaseline characteristics that were independently associated with the timing of each adverse event were identified through a backwards stepwise selection process initially including all characteristics listed in Table 1, and sequentially excluding characteristics with the weakest associations until only characteristics with P < .05 remained. Independent associations with the timing of cardiac arrest, stroke, urinary tract infection, deep vein thrombosis, and death are shown. There were no characteristics independently associated with timing of myocardial infarction, pneumonia, pulmonary embolism, sepsis, or surgical site infection; hence, these adverse events are not listed in the table.
bFrom final Cox proportional hazards models identified through multivariate stepwise selection.
Continue to: DISCUSSION...
DISCUSSION
Adverse events are extremely common following a geriatric hip fracture surgery.1-4 Despite extensive investigation regarding methods to prevent these events,5-12 there is limited published description of the timing at which such events occur. This study used a large prospectively followed up cohort of geriatric patients undergoing a hip fracture surgery to deliver a better description of the timing of adverse events than was previously available. The findings of this study should enable more targeted clinical surveillance, inform patient counseling, and help determine the duration of follow-up required for studies on adverse events.
There was wide variability in the timing at which the different postoperative adverse events were diagnosed (Figures 1, 2). Myocardial infarction was diagnosed the earliest, with more than three-fourth of diagnoses in the first postoperative week. Other relatively early-diagnosed adverse events included cardiac arrest requiring cardiopulmonary resuscitation, stroke, pneumonia, and pulmonary embolism.
The latest-diagnosed adverse event was surgical site infection (Figures 1, 2). Surgical site infection was actually the only adverse event with a rate of diagnosis during the first week that was lower than the rate of diagnosis later in the month (as can be seen by the inflection in the timing curve for surgical site infection in Figure 1). Mortality showed a relatively consistent rate of diagnosis throughout the entire first postoperative month. Other relatively late-diagnosed postoperative events, including sepsis, deep vein thrombosis, and urinary tract infection, showed varying degrees of decreased rate of diagnosis near the end of the first postoperative month. Of note, for the later-diagnosed adverse events, the estimated median and interquartile ranges (Figure 2) were presumably quite biased toward earlier diagnosis, as the 30-day follow-up period clearly failed to capture a large proportion of later-occurring adverse events (Figure 1).
Certain risk factors were independently associated with earlier occurrence of adverse events. Perhaps most strikingly, body mass index in the obese range was associated with substantially earlier occurrence of deep vein thrombosis (median of 5 vs 10 days). This finding suggests that clinical monitoring for deep vein thrombosis should be performed earlier in patients with greater body mass index. Also notable is the earlier occurrence of cardiac arrest and death among patients with end-stage renal disease than among those without. Patients with end-stage renal disease may have a greater risk for these adverse events immediately following the cardiac stresses of surgery.27 Similarly, such patients may be more prone to early electrolyte abnormalities and arrhythmia.
Continue to: In addition to its clinical implications, this study...
In addition to its clinical implications, this study informs about the interpretation of the many studies of adverse events following hip fracture procedures that have been conducted using retrospective data. Several such studies have relied on inpatient-only administrative databases.4,13,14,28-35 As clearly demonstrated in Figure 3, for most of the commonly studied adverse events, inpatient-only databases failed to capture a large proportion of adverse events occurring in the first postoperative month. This highlights a substantial limitation of this commonly published type of study that is often not emphasized in the literature.
There has also been an increase in the publication of studies of adverse events following a hip fracture surgery using the ACS-NSQIP data.3,13,14,17,18,21 As discussed, the ACS-NSQIP provides data on 30-days of follow-up. This relatively extended follow-up is often touted as a distinct advantage. However, this study demonstrates that even the 30-day follow-up afforded by the ACS-NSQIP is limited in its ability to enable investigation of the later-occurring adverse events (Figure 1). In particular, the rate of surgical site infection shows little sign of slowing by postoperative day 30. Similarly, the rates of mortality, sepsis, deep vein thrombosis, and urinary tract infection remain substantial.
This study does have limitations. First, as discussed, the duration of follow-up is a limitation of any ACS-NSQIP-based investigation, including this study. Second, the ACS-NSQIP does not capture relevant orthopedic-specific outcomes (eg, screw cutout). In addition, it could not be determined with certainty whether adverse events occurring on the final hospital day occurred prior to or following discharge. However, only a small proportion of most of the adverse events was diagnosed on the final hospital day. Finally, the ACS-NSQIP reports on days from the operation until diagnosis of the adverse event. Although some adverse events are probably diagnosed quickly after they have occurred (eg, myocardial infarction and cardiac arrest), other adverse events may have a delayed diagnosis (eg, surgical site infection may be identified days after its initial occurrence during a follow-up examination). Therefore, it is important to note the subtle distinction between occurrence and diagnosis throughout the article. This article reports on the timing of diagnosis, not actual occurrence.
CONCLUSION
The timing of postoperative adverse events has been understudied in the past. This may be due to an inability of standard single- or multi-institutional investigations to achieve sample sizes adequate to study the less commonly occurring adverse events. Using a relatively new prospective surgical registry, this study provides a far more detailed description of the timing of adverse events following surgery than was previously available. The authors anticipate that these data can be used to inform patient counseling, target clinical surveillance, and direct clinical research. The authors chose to study the timing of postoperative adverse events following geriatric hip fracture surgery because of the high rate of adverse events associated with the procedure. However, future ACS-NSQIP studies may involve characterization of the timing of adverse events following other orthopedic and non-orthopedic procedures.
This paper will be judged for the Resident Writer’s Award.
1. Schilling PL, Hallstrom BR, Birkmeyer JD, Carpenter JE. Prioritizing perioperative quality improvement in orthopaedic surgery. J Bone Joint Surg Am. 2010;92(9):1884-1889. doi:10.2106/jbjs.i.00735.
2. Forte ML, Virnig BA, Swiontkowski MF, et al. Ninety-day mortality after intertrochanteric hip fracture: does provider volume matter? J Bone Joint Surg Am. 2010;92(4):799-806. doi:10.2106/jbjs.h.01204.
3. Pugely AJ, Martin CT, Gao Y, Klocke NF, Callaghan JJ, Marsh JL. A risk calculator for short-term morbidity and mortality after hip fracture surgery. J Orthop Trauma.2014;28(2):63-69. doi:10.1097/BOT.0b013e3182a22744.
4. Bhattacharyya T, Iorio R, Healy WL. Rate of and risk factors for acute inpatient mortality after orthopaedic surgery. J Bone Joint Surg Am. 2002;84-a(4):562-572.
5. Eriksson BI, Lassen MR. Duration of prophylaxis against venous thromboembolism with fondaparinux after hip fracture surgery: a multicenter, randomized, placebo-controlled, double-blind study. Arch Intern Med. 2003;163(11):1337-1342. doi:10.1001/archinte.163.11.1337.
6. Handoll HH, Farrar MJ, McBirnie J, Tytherleigh-Strong G, Milne AA, Gillespie WJ. Heparin, low molecular weight heparin and physical methods for preventing deep vein thrombosis and pulmonary embolism following surgery for hip fractures. Cochrane Database Syst Rev.2002;(4):Cd000305. doi:10.1002/14651858.cd000305.
7. Avenell A, Handoll HH. Nutritional supplementation for hip fracture aftercare in the elderly. Cochrane Database Syst Rev. 2004;(1):Cd001880. doi:10.1002/14651858.CD001880.pub2.
8. Marcantonio ER, Flacker JM, Wright RJ, Resnick NM. Reducing delirium after hip fracture: a randomized trial. J Am Geriatr Soc. 2001;49(5):516-522. doi:10.1046/j.1532-5415.2001.49108.x.
9. Deschodt M, Braes T, Flamaing J, et al. Preventing delirium in older adults with recent hip fracture through multidisciplinary geriatric consultation. J Am Geriatr Soc. 2012;60(4):733-739. doi:10.1111/j.1532-5415.2012.03899.x.
10. Marcantonio ER, Palihnich K, Appleton P, Davis RB. Pilot randomized trial of donepezil hydrochloride for delirium after hip fracture. J Am Geriatr Soc. 2011;59 Suppl 2:S282-S288. doi:10.1111/j.1532-5415.2011.03691.x.
11. Parker MJ. Iron supplementation for anemia after hip fracture surgery: a randomized trial of 300 patients. J Bone Joint Surg Am. 2010;92(2):265-269. doi:10.2106/jbjs.i.00883.
12. Urwin SC, Parker MJ, Griffiths R. General versus regional anaesthesia for hip fracture surgery: a meta-analysis of randomized trials. Br J Anaesth. 2000;84(4):450-455. doi:10.1093/oxfordjournals.bja.a013468.
13. Bohl DD, Basques BA, Golinvaux NS, Baumgaertner MR, Grauer JN. Nationwide Inpatient Sample and National Surgical Quality Improvement Program give different results in hip fracture studies. Clin Orthop Relat Res. 2014;472(6):1672-1680. doi:10.1007/s11999-014-3559-0.
14. Bohl DD, Grauer JN, Leopold SS. Editor's spotlight/Take 5: nationwide inpatient sample and national surgical quality improvement program give different results in hip fracture studies. Clin Orthop Relat Res. 2014;472(6):1667-1671. doi:10.1007/s11999-014-3595-9.
15. Bohl DD, Russo GS, Basques BA, et al. Variations in data collection methods between national databases affect study results: a comparison of the nationwide inpatient sample and national surgical quality improvement program databases for lumbar spine fusion procedures. J Bone Joint Surg Am. 2014;96(23):e193. doi:10.2106/jbjs.m.01490.
16. Levin PE. Apples, oranges, and national databases: commentary on an article by Daniel D. Bohl, MPH, et al.: "Variations in data collection methods between national databases affect study results: a comparison of the nationwide inpatient sample and national surgical quality improvement program databases for lumbar spine fusion procedures.” J Bone Joint Surg Am. 2014;96(23):e198. doi:10.2106/jbjs.n.00890.
17. Basques BA, Bohl DD, Golinvaux NS, Leslie MP, Baumgaertner MR, Grauer JN. Postoperative length of stay and thirty-day readmission following geriatric hip fracture: an analysis of 8,434 patients. J Orthop Trauma. 2015;29(3):e115-e120. doi:10.1097/bot.0000000000000222.
18. Golinvaux NS, Bohl DD, Basques BA, Baumgaertner MR, Grauer JN. Diabetes confers little to no increased risk of postoperative complications after hip fracture surgery in geriatric patients. Clin Orthop Relat Res. 2015;473(3):1043-1051. doi:10.1007/s11999-014-3945-7.
19. Maciejewski ML, Radcliff TA, Henderson WG, et al. Determinants of postsurgical discharge setting for male hip fracture patients. J Rehabil Res Dev. 2013;50(9):1267-1276. doi:10.1682/jrrd.2013.02.0041.
20. Molina CS, Thakore RV, Blumer A, Obremskey WT, Sethi MK. Use of the National Surgical Quality Improvement Program in orthopaedic surgery. Clin Orthop Relat Res.2015;473(5):1574-1581. doi:10.1007/s11999-014-3597-7.
21. Bohl DD, Basques BA, Golinvaux NS, Miller CP, Baumgaertner MR, Grauer JN. Extramedullary compared with intramedullary implants for intertrochanteric hip fractures: thirty-day outcomes of 4432 procedures from the ACS NSQIP database. J Bone Joint Surg Am. 2014;96(22):1871-1877. doi:10.2106/jbjs.n.00041.
22. Alosh H, Riley LH 3rd, Skolasky RL. Insurance status, geography, race, and ethnicity as predictors of anterior cervical spine surgery rates and in-hospital mortality: an examination of United States trends from 1992 to 2005. Spine (Phila Pa 1976). 2009;34(18):1956-1962. doi:10.1097/BRS.0b013e3181ab930e.
23. Cahill KS, Chi JH, Day A, Claus EB. Prevalence, complications, and hospital charges associated with use of bone-morphogenetic proteins in spinal fusion procedures. JAMA.2009;302(1):58-66. doi:10.1001/jama.2009.956.
24. Ingraham AM, Richards KE, Hall BL, Ko CY. Quality improvement in surgery: the American College of Surgeons National Surgical Quality Improvement Program approach. Adv Surg. 2010;44(1):251-267. doi:10.1016/j.yasu.2010.05.003.
25. Shiloach M, Frencher SK Jr, Steeger JE, et al. Toward robust information: data quality and inter-rater reliability in the American College of Surgeons National Surgical Quality Improvement Program. J Am Coll Surg. 2010;210(1):6-16. doi:10.1016/j.jamcollsurg.2009.09.031.
26. ACS-NSQIP. Data Use Agreement. American College of Surgeons Web site. https://www.facs.org/quality-programs/acs-nsqip/participant-use/puf-form. Accessed September 20, 2018.
27. Blacher J, Guerin AP, Pannier B, Marchais SJ, London GM. Arterial calcifications, arterial stiffness, and cardiovascular risk in end-stage renal disease. Hypertension. 2001;38(4):938-942. doi:10.1161/hy1001.096358.
28. Browne JA, Cook C, Olson SA, Bolognesi MP. Resident duty-hour reform associated with increased morbidity following hip fracture. J Bone Joint Surg Am. 2009;91(9):2079-2085. doi:10.2106/jbjs.h.01240.
29. Browne JA, Pietrobon R, Olson SA. Hip fracture outcomes: does surgeon or hospital volume really matter? J Trauma. 2009;66(3):809-814. doi:10.1097/TA.0b013e31816166bb.
30. Menendez ME, Ring D. Failure to rescue after proximal femur fracture surgery. J Orthop Trauma. 2015;29(3):e96-e102. doi:10.1097/bot.0000000000000234.
31. Nikkel LE, Fox EJ, Black KP, Davis C, Andersen L, Hollenbeak CS. Impact of comorbidities on hospitalization costs following hip fracture. J Bone Joint Surg Am. 2012;94(1):9-17. doi:10.2106/jbjs.j.01077.
32. Anderson KL, Koval KJ, Spratt KF. Hip fracture outcome: is there a “July effect”? Am J Orthop. 2009;38(12):606-611.
33. Koval KJ, Rust CL, Spratt KF. The effect of hospital setting and teaching status on outcomes after hip fracture. Am J Orthop. 2011;40(1):19-28.
34. Bacon WE. Secular trends in hip fracture occurrence and survival: age and sex differences. J Aging Health. 1996;8(4):538-553. doi:10.1177/089826439600800404.
35. Orces CH. In-hospital hip fracture mortality trends in older adults: the National Hospital Discharge Survey, 1988-2007. J Am Geriatr Soc. 2013;61(12):2248-2249. doi:10.1111/jgs.12567.
ABSTRACT
This study uses a prospective surgical registry to characterize the timing of 10 postoperative adverse events following geriatric hip fracture surgery. There were 19,873 patients identified who were ≥70 years undergoing surgery for hip fracture as part of the American College of Surgeons National Surgical Quality Improvement Program (ACS-NSQIP). The median postoperative day of diagnosis (and interquartile range) for myocardial infarction was 3 (1-5), cardiac arrest requiring cardiopulmonary resuscitation 3 (0-8), stroke 3 (1-10), pneumonia 4 (2-10), pulmonary embolism 4 (2-11), urinary tract infection 7 (2-13), deep vein thrombosis 9 (4-16), sepsis 9 (4-18), mortality 11 (6-19), and surgical site infection 16 (11-22). For the earliest diagnosed adverse events, the rate of adverse events had diminished by postoperative day 30. For the later diagnosed adverse events, the rate of adverse events remained high at postoperative day 30. Findings help to enable more targeted clinical surveillance, inform patient counseling, and determine the duration of follow-up required to study specific adverse events effectively. Orthopedic surgeons should have the lowest threshold for testing for each adverse event during the time period of greatest risk.
Continue to: Geriatric hip fracture surgery is associated with...
Geriatric hip fracture surgery is associated with a higher rate of occurrence of postoperative adverse events than any other commonly performed orthopedic procedure.1-4 Indeed, the 90-day mortality rate following a geriatric hip fracture surgery may be as high as 15%2 and the 30-day morbidity rate as high as 30%.3 Furthermore, more than half of postoperative mortalities following orthopedic procedures occur after surgery for hip fracture.4 Therefore, extensive research has been conducted regarding interventions to reduce the rates of adverse events following a hip fracture surgery.5-12 For example, randomized trials have been conducted involving venous thromboembolism prophylaxis,5,6nutritional supplementation,7 delirium prevention,8-10 anemia correction,11 geriatrics consultation,9 and anesthetic technique.12
Despite these extensive research efforts, there is currently little information in the literature regarding when postoperative adverse events occur. A clear depiction of the timing of adverse events could help target clinical surveillance, inform patient counseling, and determine the duration of follow-up required for studies. The reason that the timing of adverse events has not been previously characterized may be that the sample sizes available through standard single- or multi-institutional studies may be insufficient to accurately characterize the timing of rare adverse events (eg, myocardial infarction, stroke, etc.). Moreover, although administrative datasets have become common data sources for investigation of rare postoperative adverse events,13-16 such data sources often do not contain data on the timing of diagnosis.
The American College of Surgeons National Surgical Quality Improvement Program (ACS-NSQIP) is a relatively new and growing surgical registry.1,3,13-22 The registry follows up patients undergoing surgical procedures at several hundred community and academic institutions nationwide. Unlike the administrative datasets discussed above, the ACS-NSQIP characterizes the postoperative day of diagnosis of well-defined adverse events during the first 30 postoperative days.22
In this study, data collected by the ACS-NSQIP are used to characterize the timing of 10 specific postoperative adverse events following a geriatric hip fracture surgery.
Continue to: METHODS...
METHODS
A retrospective analysis of data collected prospectively through the ACS-NSQIP was conducted. Geriatric patients who underwent hip fracture surgery during 2010 to 2013 were identified. Specific inclusion criteria were (1) International Classification of Diseases, Ninth Revision, diagnosis code 820, (2) primary Current Procedural Terminology codes 27125, 27130, 27235, 27236, 27244, or 27245, and (3) age ≥70 years.
The ACS-NSQIP captures patient demographic, comorbidity, and procedural characteristics at baseline.22 At the end of the 30-day follow-up period, the ACS-NSQIP personnel review both inpatient and outpatient charts to characterize the occurrence vs nonoccurrence of specific postoperative adverse events.22-25 When an adverse event does occur, the postoperative day of diagnosis is recorded.
For this study, the following adverse event categories were investigated: myocardial infarction, cardiac arrest requiring cardiopulmonary resuscitation, stroke, pneumonia, pulmonary embolism, urinary tract infection, deep vein thrombosis, sepsis (either with or without shock), mortality, and surgical site infection (including superficial surgical site infection, deep surgical site infection, and organ or space surgical site infection). Detailed definitions of each adverse event are provided in ACS-NSQIP materials.22
First, the 30-day incidence (and the associated 95% confidence interval) was determined for each adverse event. Second, the median postoperative day of diagnosis (and the associated interquartile range) was determined for each adverse event. Third, the postoperative length of stay was used to estimate the proportion of diagnoses occurring prior to vs following discharge for each adverse event. Finally, multivariate Cox proportional hazards models were used to identify independent risk factors for earlier occurrence of postoperative adverse events. The final models were selected using a backward stepwise process that sequentially eliminated variables with the weakest associations until all variables had P < .05.
Because the ACS-NSQIP reports timing data in calendar days, when the postoperative length of stay was equivalent to the postoperative day of diagnosis, it was not possible to ascertain whether the diagnosis occurred prior to or following discharge. For this study, when the postoperative length of stay was equivalent to the postoperative day of diagnosis, the adverse event was considered to have been diagnosed following discharge. The rationale for this is that for most of the adverse events, it was thought to be unlikely that an inpatient would be discharged before the end of the same day as an inpatient diagnosis. However, there was one exception to this rule; when the postoperative day of discharge, the postoperative length of stay, and the postoperative day of death were all equivalent, the adverse event was considered to have occurred prior to discharge. This is because when a patient dies during the initial inpatient stay, the ACS-NSQIP considers the postoperative length of stay to be equivalent to the postoperative day of death. This makes it much more likely that a diagnosis on the final hospital day had occurred in a patient who had not been discharged.
The mandatory ACS-NSQIP statement is “The American College of Surgeons National Surgical Quality Improvement Program and the hospitals participating in the ACS-NSQIP are the source of the data used herein; they have not verified and are not responsible for the statistical validity of the data analysis or the conclusions derived by the authors.”26
Continue to: RESULTS...
RESULTS
In total, 19,873 geriatric patients undergoing a hip fracture surgery were identified (Table 1). The rates of adverse events ranged from 6.7% for urinary tract infection to 0.6% for pulmonary embolism (Table 2).
Table 1. Patient Population
| Number | Percent |
Total | 19,873 | 100.0% |
Age |
|
|
70-74 years | 1852 | 9.3% |
75-79 years | 2764 | 13.9% |
80-84 years | 4328 | 21.8% |
85-89 years | 5525 | 27.8% |
≥90 years | 5404 | 27.2% |
Sex |
|
|
Male | 5359 | 27.0% |
Female | 14,514 | 73.0% |
Body mass index |
|
|
<30 kg/m2 | 17,733 | 89.2% |
≥30 kg/m2 | 2140 | 10.8% |
Functional status |
|
|
Independent | 14,348 | 72.2% |
Dependent | 5525 | 27.8% |
Diabetes | 3321 | 16.7% |
Congestive heart failure | 738 | 3.7% |
Dyspnea on exertion | 1542 | 7.8% |
Hypertension | 14,265 | 71.8% |
End-stage renal disease | 322 | 1.6% |
COPD | 2239 | 11.3% |
Current smoker | 1506 | 7.6% |
Abbreviation: COPD, chronic obstructive pulmonary disease.
Table 2. Patients with Adverse Events Diagnosed During the First 30 postoperative days (N = 19,873)
Adverse Event | Number | Percent | 95% CI |
Urinary tract infection | 1321 | 6.7% | 6.3%-7.0% |
Mortality | 1240 | 6.2% | 5.9%-6.6% |
Pneumonia | 771 | 3.9% | 3.6%-4.2% |
Sepsis | 428 | 2.2% | 2.0%-2.4% |
Myocardial infarction | 347 | 1.8% | 1.6%-1.9% |
Surgical site infection | 247 | 1.2% | 1.1%-1.4% |
Deep vein thrombosis | 199 | 1.0% | 0.9%-1.1% |
Stroke | 144 | 0.7% | 0.6%-0.8% |
Cardiac arrest | 136 | 0.7% | 0.6%-0.8% |
Pulmonary embolism | 126 | 0.6% | 0.5%-0.7% |
Abbreviation: CI, confidence interval.
Figure 1 depicts the timing of postoperative adverse events in detail in histograms and timing curves. For the earliest diagnosed adverse events, the rate of adverse events had diminished by postoperative day 30. For the later diagnosed adverse events, the rate of adverse events remained high at postoperative day 30.
Figure 2 provides the summary statistics for adverse events diagnosed in the first 30 postoperative days. The median postoperative day of diagnosis (and the interquartile range) was 3 (1-5) for myocardial infarction, 3 (0-8) for cardiac arrest requiring cardiopulmonary resuscitation, 3 (1-10) for stroke, 4 (2-10) for pneumonia, 4 (2-11) for pulmonary embolism, 7 (2-13) for urinary tract infection, 9 (4-16) for deep vein thrombosis, 9 (4-18) for sepsis, 11 (6-19) for mortality, and 16 (11-22) for surgical site infection.
Figure 3 depicts the timing of adverse events relative to discharge. The proportions of adverse events diagnosed prior to discharge were 81.0% for myocardial infarction, 77.8% for stroke, 76.1% for cardiac arrest requiring cardiopulmonary resuscitation, 71.9% for pulmonary embolism, 71.1% for pneumonia, 58.0% for urinary tract infection, 52.1% for sepsis, 46.9% for deep vein thrombosis, 44.3% for mortality, and 27.6% for surgical site infection.
Table 3 shows the independent risk factors for earlier occurrence of adverse events. Following multivariate stepwise selection of final models, at least 1 patient characteristic was independently associated with the timing of cardiac arrest, stroke, urinary tract infection, deep vein thrombosis, and death. In contrast, no patient characteristics were independently associated with the timing of myocardial infarction, pneumonia, pulmonary embolism, sepsis, and surgical site infection.
Table 3. Timing of Diagnosis of Adverse Eventsa
Adverse events and associated baseline characteristic(s) | Median postoperative day of diagnosis with vs without baseline characteristic | P-valueb |
Cardiac arrest |
|
|
End-stage renal disease | 1 vs 3 | .005 |
Stroke |
|
|
Hypertension | 4 vs 2 | .025 |
Dependent functional status | 2 vs 4 | .027 |
Urinary tract infection |
|
|
Female sex | 6 vs 8 | .009 |
Deep vein thrombosis |
|
|
Body mass index ≥30 kg/m2 | 5 vs 10 | .015 |
Death |
|
|
End-stage renal disease | 10 vs 11 | .031 |
aBaseline characteristics that were independently associated with the timing of each adverse event were identified through a backwards stepwise selection process initially including all characteristics listed in Table 1, and sequentially excluding characteristics with the weakest associations until only characteristics with P < .05 remained. Independent associations with the timing of cardiac arrest, stroke, urinary tract infection, deep vein thrombosis, and death are shown. There were no characteristics independently associated with timing of myocardial infarction, pneumonia, pulmonary embolism, sepsis, or surgical site infection; hence, these adverse events are not listed in the table.
bFrom final Cox proportional hazards models identified through multivariate stepwise selection.
Continue to: DISCUSSION...
DISCUSSION
Adverse events are extremely common following a geriatric hip fracture surgery.1-4 Despite extensive investigation regarding methods to prevent these events,5-12 there is limited published description of the timing at which such events occur. This study used a large prospectively followed up cohort of geriatric patients undergoing a hip fracture surgery to deliver a better description of the timing of adverse events than was previously available. The findings of this study should enable more targeted clinical surveillance, inform patient counseling, and help determine the duration of follow-up required for studies on adverse events.
There was wide variability in the timing at which the different postoperative adverse events were diagnosed (Figures 1, 2). Myocardial infarction was diagnosed the earliest, with more than three-fourth of diagnoses in the first postoperative week. Other relatively early-diagnosed adverse events included cardiac arrest requiring cardiopulmonary resuscitation, stroke, pneumonia, and pulmonary embolism.
The latest-diagnosed adverse event was surgical site infection (Figures 1, 2). Surgical site infection was actually the only adverse event with a rate of diagnosis during the first week that was lower than the rate of diagnosis later in the month (as can be seen by the inflection in the timing curve for surgical site infection in Figure 1). Mortality showed a relatively consistent rate of diagnosis throughout the entire first postoperative month. Other relatively late-diagnosed postoperative events, including sepsis, deep vein thrombosis, and urinary tract infection, showed varying degrees of decreased rate of diagnosis near the end of the first postoperative month. Of note, for the later-diagnosed adverse events, the estimated median and interquartile ranges (Figure 2) were presumably quite biased toward earlier diagnosis, as the 30-day follow-up period clearly failed to capture a large proportion of later-occurring adverse events (Figure 1).
Certain risk factors were independently associated with earlier occurrence of adverse events. Perhaps most strikingly, body mass index in the obese range was associated with substantially earlier occurrence of deep vein thrombosis (median of 5 vs 10 days). This finding suggests that clinical monitoring for deep vein thrombosis should be performed earlier in patients with greater body mass index. Also notable is the earlier occurrence of cardiac arrest and death among patients with end-stage renal disease than among those without. Patients with end-stage renal disease may have a greater risk for these adverse events immediately following the cardiac stresses of surgery.27 Similarly, such patients may be more prone to early electrolyte abnormalities and arrhythmia.
Continue to: In addition to its clinical implications, this study...
In addition to its clinical implications, this study informs about the interpretation of the many studies of adverse events following hip fracture procedures that have been conducted using retrospective data. Several such studies have relied on inpatient-only administrative databases.4,13,14,28-35 As clearly demonstrated in Figure 3, for most of the commonly studied adverse events, inpatient-only databases failed to capture a large proportion of adverse events occurring in the first postoperative month. This highlights a substantial limitation of this commonly published type of study that is often not emphasized in the literature.
There has also been an increase in the publication of studies of adverse events following a hip fracture surgery using the ACS-NSQIP data.3,13,14,17,18,21 As discussed, the ACS-NSQIP provides data on 30-days of follow-up. This relatively extended follow-up is often touted as a distinct advantage. However, this study demonstrates that even the 30-day follow-up afforded by the ACS-NSQIP is limited in its ability to enable investigation of the later-occurring adverse events (Figure 1). In particular, the rate of surgical site infection shows little sign of slowing by postoperative day 30. Similarly, the rates of mortality, sepsis, deep vein thrombosis, and urinary tract infection remain substantial.
This study does have limitations. First, as discussed, the duration of follow-up is a limitation of any ACS-NSQIP-based investigation, including this study. Second, the ACS-NSQIP does not capture relevant orthopedic-specific outcomes (eg, screw cutout). In addition, it could not be determined with certainty whether adverse events occurring on the final hospital day occurred prior to or following discharge. However, only a small proportion of most of the adverse events was diagnosed on the final hospital day. Finally, the ACS-NSQIP reports on days from the operation until diagnosis of the adverse event. Although some adverse events are probably diagnosed quickly after they have occurred (eg, myocardial infarction and cardiac arrest), other adverse events may have a delayed diagnosis (eg, surgical site infection may be identified days after its initial occurrence during a follow-up examination). Therefore, it is important to note the subtle distinction between occurrence and diagnosis throughout the article. This article reports on the timing of diagnosis, not actual occurrence.
CONCLUSION
The timing of postoperative adverse events has been understudied in the past. This may be due to an inability of standard single- or multi-institutional investigations to achieve sample sizes adequate to study the less commonly occurring adverse events. Using a relatively new prospective surgical registry, this study provides a far more detailed description of the timing of adverse events following surgery than was previously available. The authors anticipate that these data can be used to inform patient counseling, target clinical surveillance, and direct clinical research. The authors chose to study the timing of postoperative adverse events following geriatric hip fracture surgery because of the high rate of adverse events associated with the procedure. However, future ACS-NSQIP studies may involve characterization of the timing of adverse events following other orthopedic and non-orthopedic procedures.
This paper will be judged for the Resident Writer’s Award.
1. Schilling PL, Hallstrom BR, Birkmeyer JD, Carpenter JE. Prioritizing perioperative quality improvement in orthopaedic surgery. J Bone Joint Surg Am. 2010;92(9):1884-1889. doi:10.2106/jbjs.i.00735.
2. Forte ML, Virnig BA, Swiontkowski MF, et al. Ninety-day mortality after intertrochanteric hip fracture: does provider volume matter? J Bone Joint Surg Am. 2010;92(4):799-806. doi:10.2106/jbjs.h.01204.
3. Pugely AJ, Martin CT, Gao Y, Klocke NF, Callaghan JJ, Marsh JL. A risk calculator for short-term morbidity and mortality after hip fracture surgery. J Orthop Trauma.2014;28(2):63-69. doi:10.1097/BOT.0b013e3182a22744.
4. Bhattacharyya T, Iorio R, Healy WL. Rate of and risk factors for acute inpatient mortality after orthopaedic surgery. J Bone Joint Surg Am. 2002;84-a(4):562-572.
5. Eriksson BI, Lassen MR. Duration of prophylaxis against venous thromboembolism with fondaparinux after hip fracture surgery: a multicenter, randomized, placebo-controlled, double-blind study. Arch Intern Med. 2003;163(11):1337-1342. doi:10.1001/archinte.163.11.1337.
6. Handoll HH, Farrar MJ, McBirnie J, Tytherleigh-Strong G, Milne AA, Gillespie WJ. Heparin, low molecular weight heparin and physical methods for preventing deep vein thrombosis and pulmonary embolism following surgery for hip fractures. Cochrane Database Syst Rev.2002;(4):Cd000305. doi:10.1002/14651858.cd000305.
7. Avenell A, Handoll HH. Nutritional supplementation for hip fracture aftercare in the elderly. Cochrane Database Syst Rev. 2004;(1):Cd001880. doi:10.1002/14651858.CD001880.pub2.
8. Marcantonio ER, Flacker JM, Wright RJ, Resnick NM. Reducing delirium after hip fracture: a randomized trial. J Am Geriatr Soc. 2001;49(5):516-522. doi:10.1046/j.1532-5415.2001.49108.x.
9. Deschodt M, Braes T, Flamaing J, et al. Preventing delirium in older adults with recent hip fracture through multidisciplinary geriatric consultation. J Am Geriatr Soc. 2012;60(4):733-739. doi:10.1111/j.1532-5415.2012.03899.x.
10. Marcantonio ER, Palihnich K, Appleton P, Davis RB. Pilot randomized trial of donepezil hydrochloride for delirium after hip fracture. J Am Geriatr Soc. 2011;59 Suppl 2:S282-S288. doi:10.1111/j.1532-5415.2011.03691.x.
11. Parker MJ. Iron supplementation for anemia after hip fracture surgery: a randomized trial of 300 patients. J Bone Joint Surg Am. 2010;92(2):265-269. doi:10.2106/jbjs.i.00883.
12. Urwin SC, Parker MJ, Griffiths R. General versus regional anaesthesia for hip fracture surgery: a meta-analysis of randomized trials. Br J Anaesth. 2000;84(4):450-455. doi:10.1093/oxfordjournals.bja.a013468.
13. Bohl DD, Basques BA, Golinvaux NS, Baumgaertner MR, Grauer JN. Nationwide Inpatient Sample and National Surgical Quality Improvement Program give different results in hip fracture studies. Clin Orthop Relat Res. 2014;472(6):1672-1680. doi:10.1007/s11999-014-3559-0.
14. Bohl DD, Grauer JN, Leopold SS. Editor's spotlight/Take 5: nationwide inpatient sample and national surgical quality improvement program give different results in hip fracture studies. Clin Orthop Relat Res. 2014;472(6):1667-1671. doi:10.1007/s11999-014-3595-9.
15. Bohl DD, Russo GS, Basques BA, et al. Variations in data collection methods between national databases affect study results: a comparison of the nationwide inpatient sample and national surgical quality improvement program databases for lumbar spine fusion procedures. J Bone Joint Surg Am. 2014;96(23):e193. doi:10.2106/jbjs.m.01490.
16. Levin PE. Apples, oranges, and national databases: commentary on an article by Daniel D. Bohl, MPH, et al.: "Variations in data collection methods between national databases affect study results: a comparison of the nationwide inpatient sample and national surgical quality improvement program databases for lumbar spine fusion procedures.” J Bone Joint Surg Am. 2014;96(23):e198. doi:10.2106/jbjs.n.00890.
17. Basques BA, Bohl DD, Golinvaux NS, Leslie MP, Baumgaertner MR, Grauer JN. Postoperative length of stay and thirty-day readmission following geriatric hip fracture: an analysis of 8,434 patients. J Orthop Trauma. 2015;29(3):e115-e120. doi:10.1097/bot.0000000000000222.
18. Golinvaux NS, Bohl DD, Basques BA, Baumgaertner MR, Grauer JN. Diabetes confers little to no increased risk of postoperative complications after hip fracture surgery in geriatric patients. Clin Orthop Relat Res. 2015;473(3):1043-1051. doi:10.1007/s11999-014-3945-7.
19. Maciejewski ML, Radcliff TA, Henderson WG, et al. Determinants of postsurgical discharge setting for male hip fracture patients. J Rehabil Res Dev. 2013;50(9):1267-1276. doi:10.1682/jrrd.2013.02.0041.
20. Molina CS, Thakore RV, Blumer A, Obremskey WT, Sethi MK. Use of the National Surgical Quality Improvement Program in orthopaedic surgery. Clin Orthop Relat Res.2015;473(5):1574-1581. doi:10.1007/s11999-014-3597-7.
21. Bohl DD, Basques BA, Golinvaux NS, Miller CP, Baumgaertner MR, Grauer JN. Extramedullary compared with intramedullary implants for intertrochanteric hip fractures: thirty-day outcomes of 4432 procedures from the ACS NSQIP database. J Bone Joint Surg Am. 2014;96(22):1871-1877. doi:10.2106/jbjs.n.00041.
22. Alosh H, Riley LH 3rd, Skolasky RL. Insurance status, geography, race, and ethnicity as predictors of anterior cervical spine surgery rates and in-hospital mortality: an examination of United States trends from 1992 to 2005. Spine (Phila Pa 1976). 2009;34(18):1956-1962. doi:10.1097/BRS.0b013e3181ab930e.
23. Cahill KS, Chi JH, Day A, Claus EB. Prevalence, complications, and hospital charges associated with use of bone-morphogenetic proteins in spinal fusion procedures. JAMA.2009;302(1):58-66. doi:10.1001/jama.2009.956.
24. Ingraham AM, Richards KE, Hall BL, Ko CY. Quality improvement in surgery: the American College of Surgeons National Surgical Quality Improvement Program approach. Adv Surg. 2010;44(1):251-267. doi:10.1016/j.yasu.2010.05.003.
25. Shiloach M, Frencher SK Jr, Steeger JE, et al. Toward robust information: data quality and inter-rater reliability in the American College of Surgeons National Surgical Quality Improvement Program. J Am Coll Surg. 2010;210(1):6-16. doi:10.1016/j.jamcollsurg.2009.09.031.
26. ACS-NSQIP. Data Use Agreement. American College of Surgeons Web site. https://www.facs.org/quality-programs/acs-nsqip/participant-use/puf-form. Accessed September 20, 2018.
27. Blacher J, Guerin AP, Pannier B, Marchais SJ, London GM. Arterial calcifications, arterial stiffness, and cardiovascular risk in end-stage renal disease. Hypertension. 2001;38(4):938-942. doi:10.1161/hy1001.096358.
28. Browne JA, Cook C, Olson SA, Bolognesi MP. Resident duty-hour reform associated with increased morbidity following hip fracture. J Bone Joint Surg Am. 2009;91(9):2079-2085. doi:10.2106/jbjs.h.01240.
29. Browne JA, Pietrobon R, Olson SA. Hip fracture outcomes: does surgeon or hospital volume really matter? J Trauma. 2009;66(3):809-814. doi:10.1097/TA.0b013e31816166bb.
30. Menendez ME, Ring D. Failure to rescue after proximal femur fracture surgery. J Orthop Trauma. 2015;29(3):e96-e102. doi:10.1097/bot.0000000000000234.
31. Nikkel LE, Fox EJ, Black KP, Davis C, Andersen L, Hollenbeak CS. Impact of comorbidities on hospitalization costs following hip fracture. J Bone Joint Surg Am. 2012;94(1):9-17. doi:10.2106/jbjs.j.01077.
32. Anderson KL, Koval KJ, Spratt KF. Hip fracture outcome: is there a “July effect”? Am J Orthop. 2009;38(12):606-611.
33. Koval KJ, Rust CL, Spratt KF. The effect of hospital setting and teaching status on outcomes after hip fracture. Am J Orthop. 2011;40(1):19-28.
34. Bacon WE. Secular trends in hip fracture occurrence and survival: age and sex differences. J Aging Health. 1996;8(4):538-553. doi:10.1177/089826439600800404.
35. Orces CH. In-hospital hip fracture mortality trends in older adults: the National Hospital Discharge Survey, 1988-2007. J Am Geriatr Soc. 2013;61(12):2248-2249. doi:10.1111/jgs.12567.
TAKE-HOME POINTS
- The median postoperative day of diagnosis for myocardial infarction was 3, 3 for cardiac arrest requiring cardiopulmonary resuscitation, 3 for stroke, 4 for pneumonia, 4 for pulmonary embolism, 7 for urinary tract infection, 9 for deep vein thrombosis, 9 for sepsis, 11 for mortality, and 16 for surgical site infection.
- For the earliest diagnosed adverse events, the rate of adverse events had diminished by postoperative day 30; however, for the later diagnosed adverse events, the rate of adverse events remained high at postoperative day 30.
- The proportions of adverse events diagnosed prior to discharge were 81.0% for myocardial infarction, 77.8% for stroke, 76.1% for cardiac arrest requiring cardiopulmonary resuscitation, 71.9% for pulmonary embolism, 71.1% for pneumonia, 58.0% for urinary tract infection, 52.1% for sepsis, 46.9% for deep vein thrombosis, 44.3% for mortality, and 27.6% for surgical site infection.
- These results facilitate targeted clinical surveillance, guide patient counseling, and inform the duration of follow-up required in research studies.
- Clinicians should have the lowest threshold for testing for each adverse event during the time period of greatest risk.
Shoulder Arthroplasty in Patients with Rheumatoid Arthritis: A Population-Based Study Examining Utilization, Adverse Events, Length of Stay, and Cost
ABSTRACT
It has been suggested that the utilization of joint arthroplasty in patients with rheumatoid arthritis (RA) is decreasing; however, this observation is largely based upon evidence pertaining to lower-extremity joint arthroplasty. It remains unknown if these observed trends also hold true for shoulder arthroplasty. The purpose of this study is to utilize a nationally representative population database in the US to identify trends in the utilization of shoulder arthroplasty among patients with RA. Secondarily, we sought to determine the rate of early adverse events, length of stay, and hospitalization costs associated with RA patients undergoing shoulder arthroplasty and to compare these outcomes to those of patients without a diagnosis of RA undergoing shoulder arthroplasty. Using a large population database in the US, we determined the annual rates of shoulder arthroplasty (overall and individual) in RA patients between 2002 and 2011. Early adverse events, length of stay, and hospitalization costs were determined and compared with those of non-RA patients undergoing shoulder arthroplasty. Overall, we identified 332,593 patients who underwent shoulder arthroplasty between 2002 and 2011, of whom 17,883 patients (5.4%) had a diagnosis of RA. Over the study period, there was a significant increase in the utilization of shoulder arthroplasty in RA patients, particularly total shoulder arthroplasty. Over the same period, there was a significant increase in the number of RA patients who underwent shoulder arthroplasty with a diagnosis of rotator cuff disease. There were no significant differences in adverse events or mean hospitalization costs between RA and non-RA patients. Non-RA patients had a significantly shorter length of stay; however, the difference did not appear to be clinically significant. In conclusion, the utilization of shoulder arthroplasty in patients with RA significantly increased from 2002 to 2011, which may partly reflect a trend toward management of rotator cuff disease with arthroplasty rather than repair.
Continue to: It has been suggested...
It has been suggested that the utilization of total joint arthroplasty (TJA) in patients with rheumatoid arthritis (RA) is decreasing over time;1 however, this observation is largely based upon evidence pertaining to lower extremity TJA.2 It remains unknown if these observed trends also hold true for shoulder arthroplasty, whereby the utilization of shoulder arthroplasty in RA patients is not limited to the management of end-stage inflammatory arthropathy. In this study, we used a nationally representative population database in the US to identify trends in the utilization of shoulder arthroplasty among patients with RA. As a secondary objective, we sought to determine the rate of early adverse events, length of stay, and hospitalization costs associated with RA patients undergoing shoulder arthroplasty and compare these outcomes to those of patients without a diagnosis of RA undergoing shoulder arthroplasty. We hypothesize that the utilization of shoulder arthroplasty in RA patients would be decreasing, but adverse events, length of stay, and hospitalization costs would not differ between patients with and without RA undergoing shoulder arthroplasty.
METHODS
We conducted a retrospective cohort study using the Healthcare Cost and Utilization Project (HCUP) Nationwide Inpatient Sample (NIS) from 2002 to 2011.3 The NIS comprises a 20% stratified sample of all hospital discharges in the US. The NIS includes information about patient characteristics (age, sex, insurance status, and medical comorbidities) and hospitalization outcomes (adverse events, costs, and length of stay). The NIS allows identification of hospitalizations according to procedures and diagnoses using International Classification of Diseases, Ninth Revision, Clinical Modification (ICD-9-CM) codes. Given the anonymity of this study, it was exempt from Institutional Review Board ethics approval.
Hospitalizations were selected for the study based on ICD-9-CM procedural codes for hemiarthroplasty (81.81), anatomic total shoulder arthroplasty (TSA) (81.80), and reverse TSA (81.88). These patients were then stratified by an ICD-9-CM diagnosis of RA (714.X). We also utilized ICD-9-CM diagnosis codes to determine the presence of rotator cuff pathology at the time of shoulder arthroplasty (726.13, 727.61, 840.4) and to exclude patients with a history of trauma (812.X, 716.11, 733.8X). In a separate analysis, all patients in the NIS database with an ICD-9-CM diagnosis of RA were identified for each calendar year of the study, and a national estimate of RA patients was generated annually to assess overall and individual utilization rates of shoulder arthroplasty in this population (the national estimate served as the denominator).
Preoperative patient data withdrawn from the NIS included age, sex, insurance status, and medical comorbidities. An Elixhauser Comorbidity Index (ECI) was generated for each patient based on the presence of 29 comorbid conditions. The ECI was chosen because of its capacity to accurately predict mortality and represent the patient burden of comorbidities in similar administrative database studies.4-6
Early adverse events were also chosen based on ICD-9-CM diagnosis codes (Appendix A), and included the following: death, acute kidney injury, cardiac arrest, thromboembolic event, myocardial infarction, peripheral nerve injury, pneumonia, sepsis, stroke, surgical site infection, urinary tract infection, and wound dehiscence. The overall adverse event rate was defined as the occurrence of ≥1 of the above adverse events in a patient.
Appendix A. ICD-9-CM Codes Corresponding to Postoperative Adverse Events
Event | ICD-9-CM |
Acute kidney injury | 584.5-584.9 |
Cardiac arrest | 427.41, 427.5 |
Thromboembolic event | 453.2-453.4, 453.82-453.86, 415.1 |
Myocardial Infarction | 410.00-410.92 |
Peripheral nerve injury | 953.0-953.9 954.0-954.9, 955.0-955.9, 956.0-956.9 |
Pneumonia | 480.0-480.9, 481, 482.0-482.9, 483.0-483.8, 484.1-484.8, 485, 486 |
Sepsis | 038.0-038.9, 112.5, 785.52, 995.91, 995.92 |
Stroke | 430, 432, 433.01-434.91, 997.02 |
Surgical site infection | 998.51, 998.59, 996.67 |
Urinary tract infection | 599 |
Wound dehiscence | 998.30-998.33 |
Abbreviation: ICD-9-CM, International Classification of Diseases, Ninth Revision, Clinical Modification
Length of stay and total hospital charges were available for each patient. Length of stay represents the number of calendar days a patient stayed in the hospital. All hospital charges were converted to hospitalization costs using the HCUP Cost-to-Charge Ratio Files. All hospitalization costs were adjusted for inflation using the US Bureau of Labor statistics yearly inflation calculator to represent charges in the year 2011, which was the final and most recent year in this study.
Continue to: Statistical analysis...
STATISTICAL ANALYSIS
Statistical analyses were conducted using Stata version 13.1 (StataCorp, LP). All analyses took into account the complex survey design of the NIS. Discharge weights, strata, and cluster variables were included to correctly estimate variance and to produce national estimates from the stratified sample. Pearson’s chi-squared test was used to compare age, sex, ECI, and insurance status between RA and non-RA patients undergoing shoulder arthroplasty.
Bivariate and multivariate logistic regressions were subsequently used to compare the rates of adverse events between RA and non-RA patients undergoing shoulder arthroplasty (non-RA cases were used as the reference). Multivariate linear regressions were used to compare hospital length of stay and hospitalization costs between RA and non-RA patients undergoing shoulder arthroplasty. The multivariate regressions were adjusted for baseline differences in age, sex, ECI, and insurance status. Cochran-Armitage tests for trend were used to assess trends over time. All tests were 2-tailed, and the statistical difference was established at a 2-sided α level of 0.05 (P < .05).
RESULTS
Overall, we identified 332,593 patients who underwent shoulder arthroplasty in the US between 2002 and 2011, of which 17,883 patients (5.4%) had a diagnosis of RA. In comparison with non-RA patients undergoing shoulder arthroplasty, patients with RA at the time of shoulder arthroplasty were significantly younger (65.2 ± 12.5 years vs 68.4 ± 11.0 years, P < .001), included a significantly greater proportion of female patients (76.7% vs 53.8%, P < .001), and included a significantly higher proportion of patients with Medicaid insurance (3.6% vs 2.3%, P < .001). There were no significant differences in the mean ECI between patients with and without a diagnosis of RA (Table 1). As depicted in Table 1, there were significant differences in the utilization of specific shoulder arthroplasty types between patients with and without RA, whereby a significantly greater proportion of RA patients underwent hemiarthroplasty (HA) (31.6% vs 29.3%, P = .002) and reverse TSA (7.7% vs 6.6%, P = .002), whereas a significantly greater proportion of non-RA patients underwent anatomic SA (64.0% vs 60.8%, P = .002).
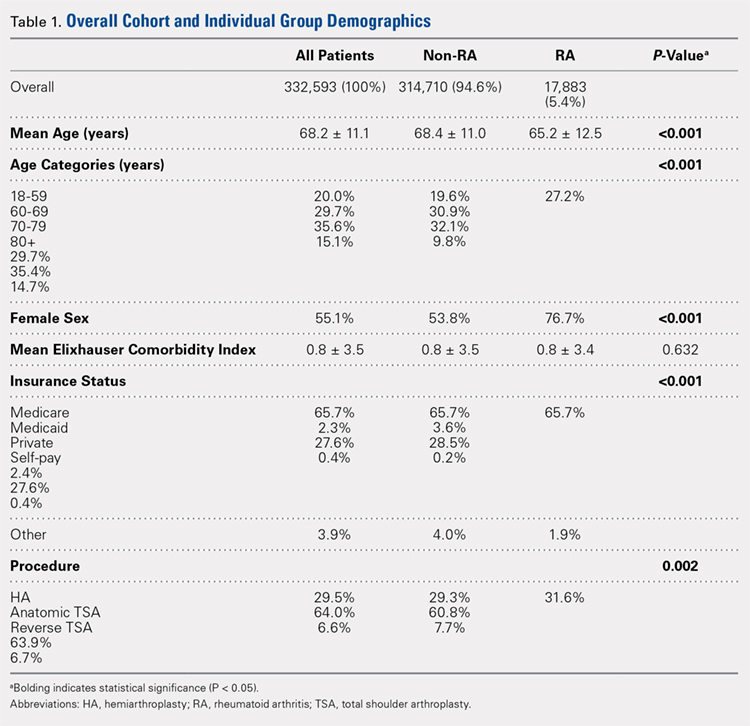
Over the study period from 2002 to 2011, there was a significant increase in the overall utilization of shoulder arthroplasty in RA patients, as indicated by both the absolute number and the proportion of patients with a diagnosis of RA (P < .001) (Table 2, Figure). More specifically, 0.39% of RA patients underwent shoulder arthroplasty in 2002, as compared with 0.58% of RA patients in 2011 (P < .001) (Table 2). With respect to specific arthroplasty types, there was an exponential rise in the utilization of reverse TSA beginning in 2010 and a corresponding decrease in the rates of both HA and anatomic TSA (Table 2, Figure). In addition to changes in shoulder arthroplasty utilization over time among RA patients, we also observed a significant increase in the number of RA patients undergoing shoulder arthroplasty with a corresponding diagnosis of rotator cuff disease (9.7% in 2002 to 15.2% in 2011, P < .001).
Table 2. The Annual Utilization of Shoulder Arthroplasty Among Patients with a Diagnosis of Rheumatoid Arthritis.
Proportion of RA patients |
| ||||
Year | Overall Rate of Shoulder Arthroplastya | HA | Anatomic TSA | Reverse TSA | |
2002 | 0.39 | 0.23 | 0.16 | 0 | |
2003 | 0.37 | 0.19 | 0.18 | 0 | |
2004 | 0.46 | 0.25 | 0.21 | 0 | |
2005 | 0.46 | 0.21 | 0.25 | 0 | |
2006 | 0.47 | 0.20 | 0.27 | 0 | |
2007 | 0.55 | 0.22 | 0.33 | 0 | |
2008 | 0.47 | 0.17 | 0.30 | 0 | |
2009 | 0.50 | 0.15 | 0.35 | 0 | |
2010 | 0.58 | 0.15 | 0.37 | 0.06 | |
2011 | 0.58 | 0.12 | 0.23 | 0.23 | |
Absolute number of RA patients |
| ||||
2002 | 1295 | 768 | 527 | 0 | |
2003 | 1247 | 650 | 597 | 0 | |
2004 | 1667 | 906 | 761 | 0 | |
2005 | 1722 | 776 | 946 | 0 | |
2006 | 1847 | 794 | 1053 | 0 | |
2007 | 2249 | 910 | 1339 | 0 | |
2008 | 2194 | 799 | 1395 | 0 | |
2009 | 2407 | 724 | 1683 | 0 | |
2010 | 2869 | 722 | 1857 | 290 | |
2011 | 3193 | 649 | 1261 | 1283 | |
aRate determined as number of RA patients undergoing shoulder arthroplasty compared to the number of patients with an RA diagnosis in the stated calendar year.
Abbreviations: HA, hemiarthroplasty; RA, rheumatoid arthritis; TSA, total shoulder arthroplasty.
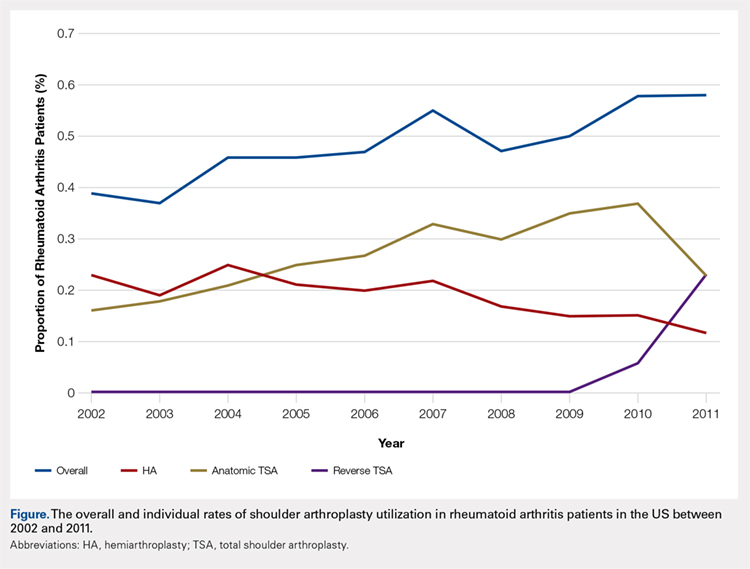
Continue to: Among patients with RA...
Among patients with RA undergoing shoulder arthroplasty, the overall rate of early adverse events was 3.12%, of which the most common early adverse events were urinary tract infections (1.8%), acute kidney injury (0.66%), and pneumonia (0.38%) (Table 3). As compared with patients without a diagnosis of RA undergoing shoulder arthroplasty, there were no significant differences in the overall and individual rates of early adverse events (Table 3).
Table 3. A Comparison of Early Adverse Events, Length of Stay, and Cost Between Patients With and Without Rheumatoid Arthritis (RA) Undergoing Shoulder Arthroplasty
Comparison of Early Adverse Event Rates |
| ||||
| Non-RA Patients | RA Patients | Multivariate Logistic Regression | ||
Odds Ratio | P-Value | ||||
Overall adverse event rate | 3.02% | 3.12% | 1.0 | 0.83 | |
Specific adverse event rate |
|
|
|
| |
Death | 0.08% | 0.05% | 0.9 | 0.91 | |
Acute kidney injury | 0.85% | 0.66% | 0.9 | 0.59 | |
Cardiac arrest | 0.05% | 0.05% | 1.3 | 0.70 | |
Thromboembolic event | 0.01% | 0.00% | - | - | |
Myocardial Infarction | 0.22% | 0.06% | 0.4 | 0.17 | |
Peripheral nerve injury | 0.08% | 0.11% | 1.5 | 0.45 | |
Pneumonia | 0.47% | 0.38% | 0.9 | 0.70 | |
Sepsis | 0.08% | 0.08% | 1.3 | 0.62 | |
Stroke | 0.07% | 0.05% | 0.9 | 0.93 | |
Surgical site infection | 0.09% | 0.13% | 1.4 | 0.52 | |
Urinary tract infection | 1.44% | 1.80% | 1.1 | 0.46 | |
Wound dehiscence | 0.01% | 0.05% | 3.6 | 0.09 | |
Comparison of Length of Stay and Hospital Charges | |||||
| Non-RA Patients (percent) | RA Patients (percent) | Multivariate Linear Regression | ||
Beta | P-Value | ||||
Length of staya | 2.3±2.0 | 2.4±1.6 | +0.1 | 0.002 | |
Hospitalization costb | 14,826±8,336 | 14,787±7,625 | +93 | 0.59 | |
aReported in days. bReported in 2011 US dollars, adjusted for inflation.
The mean length of stay following shoulder arthroplasty in RA patients was 2.4 ± 1.6 days, and the mean hospitalization cost was $14,787 ± $7625 (Table 3). As compared with non-RA patients undergoing shoulder arthroplasty, there were no significant differences in the mean hospitalization costs; however, non-RA patients had a significantly shorter length of stay by 0.1 days (P = .002) (Table 3).
DISCUSSION
In this study, we observed that the utilization of shoulder arthroplasty in patients with RA increased significantly in the decade from 2002 to 2011, largely related to a rise in TSA. Interestingly, we also observed a corresponding rise in the proportion of RA patients undergoing shoulder arthroplasty with a diagnosis of rotator cuff disease, and we believe that this may partly account for the recent increase in the use of the reverse TSA in this patient population. Additionally, we found shoulder arthroplasty in RA patients to be safe in the early postoperative period, with no significant increase in cost as compared with patients undergoing shoulder arthroplasty without a diagnosis of RA. Although we did observe a significant increase in length of stay among RA patients as compared with non-RA patients, the absolute difference was only 0.1 days, and given the aforementioned similarities in cost between RA and non-RA patients, we do not believe this difference to be clinically significant.
It has been theorized that the utilization of TJA in RA patients has been decreasing with improvements in medical management; however, this is largely based upon literature pertaining to lower extremity TJA.2 On the contrary, past research pertaining to the utilization of shoulder arthroplasty in RA patients has been highly variable. For instance, a Swedish study demonstrated a statistically significant decrease in admissions associated with RA-related upper limb surgery and a stable rate of shoulder arthroplasty between 1998 and 2004.7 Similarly, a Finnish study demonstrated that the annual incidence of primary joint arthroplasty in RA patients had declined from 1995 to 2010, with a greater decline for upper-limb arthroplasty as compared with lower-limb arthroplasty.8 Despite these European observations, Jain and colleagues9 reported an increasing rate of TSA among RA patients in the US between the years 1992 and 2005. In this study, we demonstrate a clear increase in the utilization of shoulder arthroplasty among RA patients between 2002 and 2011. What was most striking about our observation was that the rise in utilization appeared to be driven by an increase in TSA, whereas the utilization of HA decreased over time. This change in practice likely reflects several factors, including the multitude of studies that have demonstrated improved outcomes with anatomic TSA as compared with HA in RA patients.10-14
Perhaps the most interesting aspect of our data was the recent exponential rise in the utilization of the reverse TSA. Despite improved outcomes following TSA as compared with HA in RA patients, these outcomes all appear to be highly dependent upon the integrity of the rotator cuff.10 In fact, there is evidence that failure of the rotator cuff could be as high as 75% within 10 years of TSA in patients with RA,15 which ultimately could jeopardize the long-term durability of the TSA implant in this patient population.11 For this reason, interest in the reverse TSA for the RA patient population has increased since its introduction in the US in 2004;16 in fact, in RA patients with end-stage inflammatory arthropathy and a damaged rotator cuff, the reverse TSA has demonstrated excellent results.17-20 Based upon this evidence, it is not surprising that we found an exponential rise in the use of the reverse TSA since 2010, which corresponds to the introduction of an ICD-9 code for this implant.21 Prior to 2010, it is likely that many implanted reverse TSAs were coded as TSA, and for this reason, we believe that the observed rise in the utilization of TSA in RA patients prior to 2010 may have been partly fueled by an increase in the use of the reverse TSA. To further support this theory, there was a dramatic decrease in the use of anatomic TSA following 2010, and we believe this was related to increased awareness of the newly introduced reverse TSA code among surgeons.
Another consideration when examining the utilization of shoulder arthroplasty in RA patients is its versatility in managing different disease states, including rotator cuff disease. As has been documented in the literature, outcomes of rotator cuff repair in RA patients are discouraging.22 For this reason, it is reasonable for surgeons and patients with RA to consider alternatives to rotator cuff repair when nonoperative management has failed to provide adequate improvement in symptoms. One alternative may be shoulder arthroplasty, namely the reverse TSA. In this study, we observed a significant increase in the rate of diagnosis of rotator cuff disease among RA patients undergoing shoulder arthroplasty from 2002 to 2011 (9.7% in 2002 to 15.2% in 2011, P < .001), and it is our belief that the simultaneous increase in the diagnosis of rotator cuff disease and use of TSA is not coincidental. More specifically, there is likely an emerging trend among surgeons toward using the reverse TSA to manage rotator cuff tears in the RA population, rather than undertaking a rotator cuff repair that carries a high rate of failure. Going forward, there is a need to not only identify this trend more clearly but to also compare the outcomes between reverse TSA and rotator cuff repair in the management of rotator cuff tears in RA patients.
Continue to: In this study, we observed...
In this study, we observed that RA patients undergoing shoulder arthroplasty were significantly younger than non-RA patients undergoing shoulder arthroplasty. At first, this observation seems to counter recent literature suggesting that the age of patients with inflammatory arthropathy undergoing TJA is increasing over time;1 however, looking more closely at the data, it becomes clearer that the mean age we report is actually a relative increase as compared with past clinical studies pertaining to RA patients undergoing shoulder arthroplasty (mean ages of 47 years,23 55 years,24 60 years,10 and 62 years25). On the other hand, the continued existence of an age gap between RA and non-RA patients undergoing shoulder arthroplasty may be the result of several possible phenomena. First, this may reflect issues with patient access to and coverage of expensive biologic antirheumatic medication that would otherwise mitigate disease progression. For instance, the out-of-pocket expense for biologic medication through Medicaid and Medicare is substantial,26 which has direct implications on over two-thirds of our RA cohort. Second, it may be skewed by the proportion of RA patients who have previously been or continue to be poorly managed, enabling disease progression to end-stage arthropathy at a younger age. Ultimately, further investigation is needed to determine the reasons for this continued age disparity.
In comparing RA and non-RA patients undergoing shoulder arthroplasty, we did not find a significant difference in the overall nor the individual rates of early adverse events. This finding appears to be unique, as similar studies pertaining to total knee arthroplasty (TKA) demonstrated a significantly higher incidence of postoperative pneumonia and bleeding requiring transfusion among RA patients as compared with non-RA patients.27 In patients with RA being treated with biologic medication and undergoing shoulder arthroplasty, the frequent concern in the postoperative period is the integrity of the wound and the potential for infection.28 In this study, we did not find a significant difference in the rate of early infection, and although the difference in the rate of early wound dehiscence approached significance, it did not meet the threshold of 0.05 (P = .09). This finding is in keeping with the aforementioned NIS study pertaining to TKA, and we believe that it likely reflects the short duration of follow-up for patients in both studies. Given the nature of the database we utilized, we were only privy to complications that arose during the inpatient hospital stay, and it is likely that the clear majority of patients who develop a postoperative infection or wound dehiscence do so in the postoperative setting following discharge. A second concern regarding postoperative wound complications is the management of biologic medication in the perioperative period, which we cannot determine using this database. Despite all these limitations specific to this database, a past systematic review of reverse TSA in RA patients found a low rate of deep infection after reverse TSA in RA patients (3.3%),17 which was not higher than that after shoulder arthroplasty performed in non-RA patients.
A final demonstration from this study is that the hospital length of stay was significantly longer for RA patients than non-RA patients undergoing shoulder arthroplasty; however, given that the difference was only 0.1 days, and there was no significant difference in hospitalization cost, we are inclined to believe that statistical significance may not translate into clinical significance in this scenario. Ultimately, we do believe that length of stay is an important consideration in the current healthcare system, and given our finding that shoulder arthroplasty in the RA patient is safe in the early postoperative period, that a prolonged postoperative hospitalization is not warranted on the sole basis of a patient’s history of RA.
As with all studies using data from a search of an administrative database, such as the NIS database, this study has limitations. First, this type of research is limited by the reliability of both diagnosis and procedural coding. Although the NIS database has demonstrated high reliability,3 it is still possible that events may have been miscoded. Second, the tracking period for adverse events is limited to the inpatient hospital stay, which may be too short to detect certain postoperative complications. As such, the rates we report are likely underestimates of the true incidence of these complications, but this is true for both the RA and non-RA populations. Third, the comparisons we draw between RA and non-RA patients are limited to the scope of the NIS database and the available data; as such, we could not draw comparisons between preoperative disease stage, intraoperative findings, and postoperative course following hospital discharge. Lastly, our data are limited to a distinct period between 2002 and 2011 and may not reflect current practice. Ultimately, our findings may underestimate current trends in shoulder arthroplasty utilization among RA patients, particularly for the reverse TSA.
CONCLUSION
In this study, we found that the utilization of shoulder arthroplasty in patients with RA increased significantly from 2002 to 2011, largely related to a rise in the utilization of TSA. Similarly, we observed a rise in the proportion of RA patients undergoing shoulder arthroplasty with a corresponding diagnosis of rotator cuff disease, and we believe the increased utilization of shoulder arthroplasty among RA patients resulted from management of both end-stage inflammatory arthropathy and rotator cuff disease. Although we did not find a significant difference between RA and non-RA patients in the rates of early adverse events and overall hospitalization costs following shoulder arthroplasty, length of stay was significantly longer among RA patients; however, the absolute difference does not appear to be clinically significant.
- Mertelsmann-Voss C, Lyman S, Pan TJ, Goodman SM, Figgie MP, Mandl LA. US trends in rates of arthroplasty for inflammatory arthritis including rheumatoid arthritis, juvenile idiopathic arthritis, and spondyloarthritis. Arthritis Rheumatol. 2014;66(6):1432-1439. doi:10.1002/art.38384.
- Louie GH, Ward MM. Changes in the rates of joint surgery among patients with rheumatoid arthritis in California, 1983-2007. Ann Rheum Dis. 2010;69(5):868-871. doi:10.1136/ard.2009.112474.
- HCUP Nationwide Inpatient Sample (NIS) Healthcare Cost and Utilization Project (HCUP). Agency for Healthcare Research and Quality; 2002-2011.
- Elixhauser A, Steiner C, Harris DR, Coffey RM. Comorbidity measures for use with administrative data. Med Care. 1998;36(1):8-27. doi:10.1097/00005650-199801000-00004.
- Sharabiani MT, Aylin P, Bottle A. Systematic review of comorbidity indices for administrative data. Med Care. 2012;50(12):1109-1118. doi:10.1097/MLR.0b013e31825f64d0.
- van Walraven C, Austin PC, Jennings A, Quan H, Forster AJ. A modification of the Elixhauser comorbidity measures into a point system for hospital death using administrative data. Med Care. 2009;47(6):626-633. doi:10.1097/MLR.0b013e31819432e5.
- Weiss RJ, Ehlin A, Montgomery SM, Wick MC, Stark A, Wretenberg P. Decrease of RA-related orthopaedic surgery of the upper limbs between 1998 and 2004: data from 54,579 Swedish RA inpatients. Rheumatol Oxf. 2008 ;47(4):491-494. doi. 10.1093/rheumatology/ken009.
- Jämsen E, Virta LJ, Hakala M, Kauppi MJ, Malmivaara A, Lehto MU. The decline in joint replacement surgery in rheumatoid arthritis is associated with a concomitant increase in the intensity of anti-rheumatic therapy: a nationwide register-based study from 1995 through 2010. Acta Orthop. 2013;84(4):331-337. doi:10.3109/17453674.2013.810519.
- Jain A, Stein BE, Skolasky RL, Jones LC, Hungerford MW. Total joint arthroplasty in patients with rheumatoid arthritis: a United States experience from 1992 through 2005. J Arthroplasty. 2012;27(6):881-888. doi:10.1016/j.arth.2011.12.027.
- Barlow JD, Yuan BJ, Schleck CD, Harmsen WS, Cofield RH, Sperling JW. Shoulder arthroplasty for rheumatoid arthritis: 303 consecutive cases with minimum 5-year follow-up. J Shoulder Elbow Surg. 2014;23(6):791-799. doi:10.1016/j.jse.2013.09.016.
- Collins DN, Harryman DT, Wirth MA. Shoulder arthroplasty for the treatment of inflammatory arthritis. J Bone Joint Surg Am. 2004;86–A(11):2489-2496. doi:10.2106/00004623-200411000-00020.
- Rahme H, Mattsson P, Wikblad L, Larsson S. Cement and press-fit humeral stem fixation provides similar results in rheumatoid patients. Clin Orthop Relat Res. 2006;448:28-32. doi:10.1097/01.blo.0000224007.25636.85.
- Rozing PM, Nagels J, Rozing MP. Prognostic factors in arthroplasty in the rheumatoid shoulder. HSS J. 2011;7(1):29-36. doi:10.1007/s11420-010-9172-1.
- Sperling JW, Cofield RH, Schleck CD, Harmsen WS. Total shoulder arthroplasty versus hemiarthroplasty for rheumatoid arthritis of the shoulder: results of 303 consecutive cases. J Shoulder Elbow Surg. 2007;16(6):683-690. doi:10.1016/j.jse.2007.02.135.
- Khan A, Bunker TD, Kitson JB. Clinical and radiological follow-up of the Aequalis third-generation cemented total shoulder replacement: a minimum ten-year study. J Bone Joint Surg Br. 2009;91(12):1594-1600. doi:10.1302/0301-620X.91B12.22139.
- Guery J, Favard L, Sirveaux F, Oudet D, Mole D, Walch G. Reverse total shoulder arthroplasty: survivorship analysis of eighty replacements followed for five to ten years. J Bone Joint Surg Am. 2006;88(8):1742-1747. doi:10.2106/JBJS.E.00851.
- Gee ECA, Hanson EK, Saithna A. Reverse shoulder arthroplasty in rheumatoid arthritis: A systematic review. Open Orthop J. 2015;9:237-245. doi:10.2174/1874325001509010237.
- Holcomb JO, Hebert DJ, Mighell MA, et al. Reverse shoulder arthroplasty in patients with rheumatoid arthritis. J Shoulder Elbow Surg. 2010;19(7):1076-1084. doi:10.1016/j.jse.2009.11.049.
- Postacchini R, Carbone S, Canero G, Ripani M, Postacchini F. Reverse shoulder prosthesis in patients with rheumatoid arthritis: a systematic review. Int Orthop. 2016;40(5):965-973. doi:10.1007/s00264-015-2916-2.
- Rittmeister M, Kerschbaumer F. Grammont reverse total shoulder arthroplasty in patients with rheumatoid arthritis and nonreconstructible rotator cuff lesions. J Shoulder Elbow Surg. 2001;10(1):17-22. doi:10.1067/mse.2001.110515.
- American Medical Association. American Medical Association Web site. www.ama-assn.org/ama. Accessed January 15, 2016.
- Smith AM, Sperling JW, Cofield RH. Rotator cuff repair in patients with rheumatoid arthritis. J Bone Joint Surg. 2005;87(8):1782-1787. doi:10.2106/JBJS.D.02452.
- Betts HM, Abu-Rajab R, Nunn T, Brooksbank AJ. Total shoulder replacement in rheumatoid disease: a 16- to 23-year follow-up. J Bone Joint Surg Br. 2009;91(9):1197-1200. doi:10.1302/0301-620X.91B9.22035.
- Geervliet PC, Somford MP, Winia P, van den Bekerom MP. Long-term results of shoulder hemiarthroplasty in patients with rheumatoid arthritis. Orthopedics. 2015;38(1):e38-e42. doi:10.3928/01477447-20150105-58.
- Hettrich CM, Weldon E III, Boorman RS, Parsons M IV, Matsen FA III. Preoperative factors associated with improvements in shoulder function after humeral hemiarthroplasty. J Bone Joint Surg. 2004;86–A(7):1446-1451.
- Yazdany J, Dudley RA, Chen R, Lin GA, Tseng CW. Coverage for high-cost specialty drugs for rheumatoid arthritis in Medicare Part D. Arthritis Rheumatol. 2015;67(6):1474-1480. doi:10.1002/art.39079.
- Jauregui JJ, Kapadia BH, Dixit A, et al. Thirty-day complications in rheumatoid patients following total knee arthroplasty. Clin Rheumatol. 2016;35(3):595-600. doi:10.1007/s10067-015-3037-4.
- Trail IA, Nuttall D. The results of shoulder arthroplasty in patients with rheumatoid arthritis. J Bone Joint Surg Br. 2002;84(8):1121-1125. doi:10.1302/0301-620X.84B8.0841121
ABSTRACT
It has been suggested that the utilization of joint arthroplasty in patients with rheumatoid arthritis (RA) is decreasing; however, this observation is largely based upon evidence pertaining to lower-extremity joint arthroplasty. It remains unknown if these observed trends also hold true for shoulder arthroplasty. The purpose of this study is to utilize a nationally representative population database in the US to identify trends in the utilization of shoulder arthroplasty among patients with RA. Secondarily, we sought to determine the rate of early adverse events, length of stay, and hospitalization costs associated with RA patients undergoing shoulder arthroplasty and to compare these outcomes to those of patients without a diagnosis of RA undergoing shoulder arthroplasty. Using a large population database in the US, we determined the annual rates of shoulder arthroplasty (overall and individual) in RA patients between 2002 and 2011. Early adverse events, length of stay, and hospitalization costs were determined and compared with those of non-RA patients undergoing shoulder arthroplasty. Overall, we identified 332,593 patients who underwent shoulder arthroplasty between 2002 and 2011, of whom 17,883 patients (5.4%) had a diagnosis of RA. Over the study period, there was a significant increase in the utilization of shoulder arthroplasty in RA patients, particularly total shoulder arthroplasty. Over the same period, there was a significant increase in the number of RA patients who underwent shoulder arthroplasty with a diagnosis of rotator cuff disease. There were no significant differences in adverse events or mean hospitalization costs between RA and non-RA patients. Non-RA patients had a significantly shorter length of stay; however, the difference did not appear to be clinically significant. In conclusion, the utilization of shoulder arthroplasty in patients with RA significantly increased from 2002 to 2011, which may partly reflect a trend toward management of rotator cuff disease with arthroplasty rather than repair.
Continue to: It has been suggested...
It has been suggested that the utilization of total joint arthroplasty (TJA) in patients with rheumatoid arthritis (RA) is decreasing over time;1 however, this observation is largely based upon evidence pertaining to lower extremity TJA.2 It remains unknown if these observed trends also hold true for shoulder arthroplasty, whereby the utilization of shoulder arthroplasty in RA patients is not limited to the management of end-stage inflammatory arthropathy. In this study, we used a nationally representative population database in the US to identify trends in the utilization of shoulder arthroplasty among patients with RA. As a secondary objective, we sought to determine the rate of early adverse events, length of stay, and hospitalization costs associated with RA patients undergoing shoulder arthroplasty and compare these outcomes to those of patients without a diagnosis of RA undergoing shoulder arthroplasty. We hypothesize that the utilization of shoulder arthroplasty in RA patients would be decreasing, but adverse events, length of stay, and hospitalization costs would not differ between patients with and without RA undergoing shoulder arthroplasty.
METHODS
We conducted a retrospective cohort study using the Healthcare Cost and Utilization Project (HCUP) Nationwide Inpatient Sample (NIS) from 2002 to 2011.3 The NIS comprises a 20% stratified sample of all hospital discharges in the US. The NIS includes information about patient characteristics (age, sex, insurance status, and medical comorbidities) and hospitalization outcomes (adverse events, costs, and length of stay). The NIS allows identification of hospitalizations according to procedures and diagnoses using International Classification of Diseases, Ninth Revision, Clinical Modification (ICD-9-CM) codes. Given the anonymity of this study, it was exempt from Institutional Review Board ethics approval.
Hospitalizations were selected for the study based on ICD-9-CM procedural codes for hemiarthroplasty (81.81), anatomic total shoulder arthroplasty (TSA) (81.80), and reverse TSA (81.88). These patients were then stratified by an ICD-9-CM diagnosis of RA (714.X). We also utilized ICD-9-CM diagnosis codes to determine the presence of rotator cuff pathology at the time of shoulder arthroplasty (726.13, 727.61, 840.4) and to exclude patients with a history of trauma (812.X, 716.11, 733.8X). In a separate analysis, all patients in the NIS database with an ICD-9-CM diagnosis of RA were identified for each calendar year of the study, and a national estimate of RA patients was generated annually to assess overall and individual utilization rates of shoulder arthroplasty in this population (the national estimate served as the denominator).
Preoperative patient data withdrawn from the NIS included age, sex, insurance status, and medical comorbidities. An Elixhauser Comorbidity Index (ECI) was generated for each patient based on the presence of 29 comorbid conditions. The ECI was chosen because of its capacity to accurately predict mortality and represent the patient burden of comorbidities in similar administrative database studies.4-6
Early adverse events were also chosen based on ICD-9-CM diagnosis codes (Appendix A), and included the following: death, acute kidney injury, cardiac arrest, thromboembolic event, myocardial infarction, peripheral nerve injury, pneumonia, sepsis, stroke, surgical site infection, urinary tract infection, and wound dehiscence. The overall adverse event rate was defined as the occurrence of ≥1 of the above adverse events in a patient.
Appendix A. ICD-9-CM Codes Corresponding to Postoperative Adverse Events
Event | ICD-9-CM |
Acute kidney injury | 584.5-584.9 |
Cardiac arrest | 427.41, 427.5 |
Thromboembolic event | 453.2-453.4, 453.82-453.86, 415.1 |
Myocardial Infarction | 410.00-410.92 |
Peripheral nerve injury | 953.0-953.9 954.0-954.9, 955.0-955.9, 956.0-956.9 |
Pneumonia | 480.0-480.9, 481, 482.0-482.9, 483.0-483.8, 484.1-484.8, 485, 486 |
Sepsis | 038.0-038.9, 112.5, 785.52, 995.91, 995.92 |
Stroke | 430, 432, 433.01-434.91, 997.02 |
Surgical site infection | 998.51, 998.59, 996.67 |
Urinary tract infection | 599 |
Wound dehiscence | 998.30-998.33 |
Abbreviation: ICD-9-CM, International Classification of Diseases, Ninth Revision, Clinical Modification
Length of stay and total hospital charges were available for each patient. Length of stay represents the number of calendar days a patient stayed in the hospital. All hospital charges were converted to hospitalization costs using the HCUP Cost-to-Charge Ratio Files. All hospitalization costs were adjusted for inflation using the US Bureau of Labor statistics yearly inflation calculator to represent charges in the year 2011, which was the final and most recent year in this study.
Continue to: Statistical analysis...
STATISTICAL ANALYSIS
Statistical analyses were conducted using Stata version 13.1 (StataCorp, LP). All analyses took into account the complex survey design of the NIS. Discharge weights, strata, and cluster variables were included to correctly estimate variance and to produce national estimates from the stratified sample. Pearson’s chi-squared test was used to compare age, sex, ECI, and insurance status between RA and non-RA patients undergoing shoulder arthroplasty.
Bivariate and multivariate logistic regressions were subsequently used to compare the rates of adverse events between RA and non-RA patients undergoing shoulder arthroplasty (non-RA cases were used as the reference). Multivariate linear regressions were used to compare hospital length of stay and hospitalization costs between RA and non-RA patients undergoing shoulder arthroplasty. The multivariate regressions were adjusted for baseline differences in age, sex, ECI, and insurance status. Cochran-Armitage tests for trend were used to assess trends over time. All tests were 2-tailed, and the statistical difference was established at a 2-sided α level of 0.05 (P < .05).
RESULTS
Overall, we identified 332,593 patients who underwent shoulder arthroplasty in the US between 2002 and 2011, of which 17,883 patients (5.4%) had a diagnosis of RA. In comparison with non-RA patients undergoing shoulder arthroplasty, patients with RA at the time of shoulder arthroplasty were significantly younger (65.2 ± 12.5 years vs 68.4 ± 11.0 years, P < .001), included a significantly greater proportion of female patients (76.7% vs 53.8%, P < .001), and included a significantly higher proportion of patients with Medicaid insurance (3.6% vs 2.3%, P < .001). There were no significant differences in the mean ECI between patients with and without a diagnosis of RA (Table 1). As depicted in Table 1, there were significant differences in the utilization of specific shoulder arthroplasty types between patients with and without RA, whereby a significantly greater proportion of RA patients underwent hemiarthroplasty (HA) (31.6% vs 29.3%, P = .002) and reverse TSA (7.7% vs 6.6%, P = .002), whereas a significantly greater proportion of non-RA patients underwent anatomic SA (64.0% vs 60.8%, P = .002).
Over the study period from 2002 to 2011, there was a significant increase in the overall utilization of shoulder arthroplasty in RA patients, as indicated by both the absolute number and the proportion of patients with a diagnosis of RA (P < .001) (Table 2, Figure). More specifically, 0.39% of RA patients underwent shoulder arthroplasty in 2002, as compared with 0.58% of RA patients in 2011 (P < .001) (Table 2). With respect to specific arthroplasty types, there was an exponential rise in the utilization of reverse TSA beginning in 2010 and a corresponding decrease in the rates of both HA and anatomic TSA (Table 2, Figure). In addition to changes in shoulder arthroplasty utilization over time among RA patients, we also observed a significant increase in the number of RA patients undergoing shoulder arthroplasty with a corresponding diagnosis of rotator cuff disease (9.7% in 2002 to 15.2% in 2011, P < .001).
Table 2. The Annual Utilization of Shoulder Arthroplasty Among Patients with a Diagnosis of Rheumatoid Arthritis.
Proportion of RA patients |
| ||||
Year | Overall Rate of Shoulder Arthroplastya | HA | Anatomic TSA | Reverse TSA | |
2002 | 0.39 | 0.23 | 0.16 | 0 | |
2003 | 0.37 | 0.19 | 0.18 | 0 | |
2004 | 0.46 | 0.25 | 0.21 | 0 | |
2005 | 0.46 | 0.21 | 0.25 | 0 | |
2006 | 0.47 | 0.20 | 0.27 | 0 | |
2007 | 0.55 | 0.22 | 0.33 | 0 | |
2008 | 0.47 | 0.17 | 0.30 | 0 | |
2009 | 0.50 | 0.15 | 0.35 | 0 | |
2010 | 0.58 | 0.15 | 0.37 | 0.06 | |
2011 | 0.58 | 0.12 | 0.23 | 0.23 | |
Absolute number of RA patients |
| ||||
2002 | 1295 | 768 | 527 | 0 | |
2003 | 1247 | 650 | 597 | 0 | |
2004 | 1667 | 906 | 761 | 0 | |
2005 | 1722 | 776 | 946 | 0 | |
2006 | 1847 | 794 | 1053 | 0 | |
2007 | 2249 | 910 | 1339 | 0 | |
2008 | 2194 | 799 | 1395 | 0 | |
2009 | 2407 | 724 | 1683 | 0 | |
2010 | 2869 | 722 | 1857 | 290 | |
2011 | 3193 | 649 | 1261 | 1283 | |
aRate determined as number of RA patients undergoing shoulder arthroplasty compared to the number of patients with an RA diagnosis in the stated calendar year.
Abbreviations: HA, hemiarthroplasty; RA, rheumatoid arthritis; TSA, total shoulder arthroplasty.
Continue to: Among patients with RA...
Among patients with RA undergoing shoulder arthroplasty, the overall rate of early adverse events was 3.12%, of which the most common early adverse events were urinary tract infections (1.8%), acute kidney injury (0.66%), and pneumonia (0.38%) (Table 3). As compared with patients without a diagnosis of RA undergoing shoulder arthroplasty, there were no significant differences in the overall and individual rates of early adverse events (Table 3).
Table 3. A Comparison of Early Adverse Events, Length of Stay, and Cost Between Patients With and Without Rheumatoid Arthritis (RA) Undergoing Shoulder Arthroplasty
Comparison of Early Adverse Event Rates |
| ||||
| Non-RA Patients | RA Patients | Multivariate Logistic Regression | ||
Odds Ratio | P-Value | ||||
Overall adverse event rate | 3.02% | 3.12% | 1.0 | 0.83 | |
Specific adverse event rate |
|
|
|
| |
Death | 0.08% | 0.05% | 0.9 | 0.91 | |
Acute kidney injury | 0.85% | 0.66% | 0.9 | 0.59 | |
Cardiac arrest | 0.05% | 0.05% | 1.3 | 0.70 | |
Thromboembolic event | 0.01% | 0.00% | - | - | |
Myocardial Infarction | 0.22% | 0.06% | 0.4 | 0.17 | |
Peripheral nerve injury | 0.08% | 0.11% | 1.5 | 0.45 | |
Pneumonia | 0.47% | 0.38% | 0.9 | 0.70 | |
Sepsis | 0.08% | 0.08% | 1.3 | 0.62 | |
Stroke | 0.07% | 0.05% | 0.9 | 0.93 | |
Surgical site infection | 0.09% | 0.13% | 1.4 | 0.52 | |
Urinary tract infection | 1.44% | 1.80% | 1.1 | 0.46 | |
Wound dehiscence | 0.01% | 0.05% | 3.6 | 0.09 | |
Comparison of Length of Stay and Hospital Charges | |||||
| Non-RA Patients (percent) | RA Patients (percent) | Multivariate Linear Regression | ||
Beta | P-Value | ||||
Length of staya | 2.3±2.0 | 2.4±1.6 | +0.1 | 0.002 | |
Hospitalization costb | 14,826±8,336 | 14,787±7,625 | +93 | 0.59 | |
aReported in days. bReported in 2011 US dollars, adjusted for inflation.
The mean length of stay following shoulder arthroplasty in RA patients was 2.4 ± 1.6 days, and the mean hospitalization cost was $14,787 ± $7625 (Table 3). As compared with non-RA patients undergoing shoulder arthroplasty, there were no significant differences in the mean hospitalization costs; however, non-RA patients had a significantly shorter length of stay by 0.1 days (P = .002) (Table 3).
DISCUSSION
In this study, we observed that the utilization of shoulder arthroplasty in patients with RA increased significantly in the decade from 2002 to 2011, largely related to a rise in TSA. Interestingly, we also observed a corresponding rise in the proportion of RA patients undergoing shoulder arthroplasty with a diagnosis of rotator cuff disease, and we believe that this may partly account for the recent increase in the use of the reverse TSA in this patient population. Additionally, we found shoulder arthroplasty in RA patients to be safe in the early postoperative period, with no significant increase in cost as compared with patients undergoing shoulder arthroplasty without a diagnosis of RA. Although we did observe a significant increase in length of stay among RA patients as compared with non-RA patients, the absolute difference was only 0.1 days, and given the aforementioned similarities in cost between RA and non-RA patients, we do not believe this difference to be clinically significant.
It has been theorized that the utilization of TJA in RA patients has been decreasing with improvements in medical management; however, this is largely based upon literature pertaining to lower extremity TJA.2 On the contrary, past research pertaining to the utilization of shoulder arthroplasty in RA patients has been highly variable. For instance, a Swedish study demonstrated a statistically significant decrease in admissions associated with RA-related upper limb surgery and a stable rate of shoulder arthroplasty between 1998 and 2004.7 Similarly, a Finnish study demonstrated that the annual incidence of primary joint arthroplasty in RA patients had declined from 1995 to 2010, with a greater decline for upper-limb arthroplasty as compared with lower-limb arthroplasty.8 Despite these European observations, Jain and colleagues9 reported an increasing rate of TSA among RA patients in the US between the years 1992 and 2005. In this study, we demonstrate a clear increase in the utilization of shoulder arthroplasty among RA patients between 2002 and 2011. What was most striking about our observation was that the rise in utilization appeared to be driven by an increase in TSA, whereas the utilization of HA decreased over time. This change in practice likely reflects several factors, including the multitude of studies that have demonstrated improved outcomes with anatomic TSA as compared with HA in RA patients.10-14
Perhaps the most interesting aspect of our data was the recent exponential rise in the utilization of the reverse TSA. Despite improved outcomes following TSA as compared with HA in RA patients, these outcomes all appear to be highly dependent upon the integrity of the rotator cuff.10 In fact, there is evidence that failure of the rotator cuff could be as high as 75% within 10 years of TSA in patients with RA,15 which ultimately could jeopardize the long-term durability of the TSA implant in this patient population.11 For this reason, interest in the reverse TSA for the RA patient population has increased since its introduction in the US in 2004;16 in fact, in RA patients with end-stage inflammatory arthropathy and a damaged rotator cuff, the reverse TSA has demonstrated excellent results.17-20 Based upon this evidence, it is not surprising that we found an exponential rise in the use of the reverse TSA since 2010, which corresponds to the introduction of an ICD-9 code for this implant.21 Prior to 2010, it is likely that many implanted reverse TSAs were coded as TSA, and for this reason, we believe that the observed rise in the utilization of TSA in RA patients prior to 2010 may have been partly fueled by an increase in the use of the reverse TSA. To further support this theory, there was a dramatic decrease in the use of anatomic TSA following 2010, and we believe this was related to increased awareness of the newly introduced reverse TSA code among surgeons.
Another consideration when examining the utilization of shoulder arthroplasty in RA patients is its versatility in managing different disease states, including rotator cuff disease. As has been documented in the literature, outcomes of rotator cuff repair in RA patients are discouraging.22 For this reason, it is reasonable for surgeons and patients with RA to consider alternatives to rotator cuff repair when nonoperative management has failed to provide adequate improvement in symptoms. One alternative may be shoulder arthroplasty, namely the reverse TSA. In this study, we observed a significant increase in the rate of diagnosis of rotator cuff disease among RA patients undergoing shoulder arthroplasty from 2002 to 2011 (9.7% in 2002 to 15.2% in 2011, P < .001), and it is our belief that the simultaneous increase in the diagnosis of rotator cuff disease and use of TSA is not coincidental. More specifically, there is likely an emerging trend among surgeons toward using the reverse TSA to manage rotator cuff tears in the RA population, rather than undertaking a rotator cuff repair that carries a high rate of failure. Going forward, there is a need to not only identify this trend more clearly but to also compare the outcomes between reverse TSA and rotator cuff repair in the management of rotator cuff tears in RA patients.
Continue to: In this study, we observed...
In this study, we observed that RA patients undergoing shoulder arthroplasty were significantly younger than non-RA patients undergoing shoulder arthroplasty. At first, this observation seems to counter recent literature suggesting that the age of patients with inflammatory arthropathy undergoing TJA is increasing over time;1 however, looking more closely at the data, it becomes clearer that the mean age we report is actually a relative increase as compared with past clinical studies pertaining to RA patients undergoing shoulder arthroplasty (mean ages of 47 years,23 55 years,24 60 years,10 and 62 years25). On the other hand, the continued existence of an age gap between RA and non-RA patients undergoing shoulder arthroplasty may be the result of several possible phenomena. First, this may reflect issues with patient access to and coverage of expensive biologic antirheumatic medication that would otherwise mitigate disease progression. For instance, the out-of-pocket expense for biologic medication through Medicaid and Medicare is substantial,26 which has direct implications on over two-thirds of our RA cohort. Second, it may be skewed by the proportion of RA patients who have previously been or continue to be poorly managed, enabling disease progression to end-stage arthropathy at a younger age. Ultimately, further investigation is needed to determine the reasons for this continued age disparity.
In comparing RA and non-RA patients undergoing shoulder arthroplasty, we did not find a significant difference in the overall nor the individual rates of early adverse events. This finding appears to be unique, as similar studies pertaining to total knee arthroplasty (TKA) demonstrated a significantly higher incidence of postoperative pneumonia and bleeding requiring transfusion among RA patients as compared with non-RA patients.27 In patients with RA being treated with biologic medication and undergoing shoulder arthroplasty, the frequent concern in the postoperative period is the integrity of the wound and the potential for infection.28 In this study, we did not find a significant difference in the rate of early infection, and although the difference in the rate of early wound dehiscence approached significance, it did not meet the threshold of 0.05 (P = .09). This finding is in keeping with the aforementioned NIS study pertaining to TKA, and we believe that it likely reflects the short duration of follow-up for patients in both studies. Given the nature of the database we utilized, we were only privy to complications that arose during the inpatient hospital stay, and it is likely that the clear majority of patients who develop a postoperative infection or wound dehiscence do so in the postoperative setting following discharge. A second concern regarding postoperative wound complications is the management of biologic medication in the perioperative period, which we cannot determine using this database. Despite all these limitations specific to this database, a past systematic review of reverse TSA in RA patients found a low rate of deep infection after reverse TSA in RA patients (3.3%),17 which was not higher than that after shoulder arthroplasty performed in non-RA patients.
A final demonstration from this study is that the hospital length of stay was significantly longer for RA patients than non-RA patients undergoing shoulder arthroplasty; however, given that the difference was only 0.1 days, and there was no significant difference in hospitalization cost, we are inclined to believe that statistical significance may not translate into clinical significance in this scenario. Ultimately, we do believe that length of stay is an important consideration in the current healthcare system, and given our finding that shoulder arthroplasty in the RA patient is safe in the early postoperative period, that a prolonged postoperative hospitalization is not warranted on the sole basis of a patient’s history of RA.
As with all studies using data from a search of an administrative database, such as the NIS database, this study has limitations. First, this type of research is limited by the reliability of both diagnosis and procedural coding. Although the NIS database has demonstrated high reliability,3 it is still possible that events may have been miscoded. Second, the tracking period for adverse events is limited to the inpatient hospital stay, which may be too short to detect certain postoperative complications. As such, the rates we report are likely underestimates of the true incidence of these complications, but this is true for both the RA and non-RA populations. Third, the comparisons we draw between RA and non-RA patients are limited to the scope of the NIS database and the available data; as such, we could not draw comparisons between preoperative disease stage, intraoperative findings, and postoperative course following hospital discharge. Lastly, our data are limited to a distinct period between 2002 and 2011 and may not reflect current practice. Ultimately, our findings may underestimate current trends in shoulder arthroplasty utilization among RA patients, particularly for the reverse TSA.
CONCLUSION
In this study, we found that the utilization of shoulder arthroplasty in patients with RA increased significantly from 2002 to 2011, largely related to a rise in the utilization of TSA. Similarly, we observed a rise in the proportion of RA patients undergoing shoulder arthroplasty with a corresponding diagnosis of rotator cuff disease, and we believe the increased utilization of shoulder arthroplasty among RA patients resulted from management of both end-stage inflammatory arthropathy and rotator cuff disease. Although we did not find a significant difference between RA and non-RA patients in the rates of early adverse events and overall hospitalization costs following shoulder arthroplasty, length of stay was significantly longer among RA patients; however, the absolute difference does not appear to be clinically significant.
- Mertelsmann-Voss C, Lyman S, Pan TJ, Goodman SM, Figgie MP, Mandl LA. US trends in rates of arthroplasty for inflammatory arthritis including rheumatoid arthritis, juvenile idiopathic arthritis, and spondyloarthritis. Arthritis Rheumatol. 2014;66(6):1432-1439. doi:10.1002/art.38384.
- Louie GH, Ward MM. Changes in the rates of joint surgery among patients with rheumatoid arthritis in California, 1983-2007. Ann Rheum Dis. 2010;69(5):868-871. doi:10.1136/ard.2009.112474.
- HCUP Nationwide Inpatient Sample (NIS) Healthcare Cost and Utilization Project (HCUP). Agency for Healthcare Research and Quality; 2002-2011.
- Elixhauser A, Steiner C, Harris DR, Coffey RM. Comorbidity measures for use with administrative data. Med Care. 1998;36(1):8-27. doi:10.1097/00005650-199801000-00004.
- Sharabiani MT, Aylin P, Bottle A. Systematic review of comorbidity indices for administrative data. Med Care. 2012;50(12):1109-1118. doi:10.1097/MLR.0b013e31825f64d0.
- van Walraven C, Austin PC, Jennings A, Quan H, Forster AJ. A modification of the Elixhauser comorbidity measures into a point system for hospital death using administrative data. Med Care. 2009;47(6):626-633. doi:10.1097/MLR.0b013e31819432e5.
- Weiss RJ, Ehlin A, Montgomery SM, Wick MC, Stark A, Wretenberg P. Decrease of RA-related orthopaedic surgery of the upper limbs between 1998 and 2004: data from 54,579 Swedish RA inpatients. Rheumatol Oxf. 2008 ;47(4):491-494. doi. 10.1093/rheumatology/ken009.
- Jämsen E, Virta LJ, Hakala M, Kauppi MJ, Malmivaara A, Lehto MU. The decline in joint replacement surgery in rheumatoid arthritis is associated with a concomitant increase in the intensity of anti-rheumatic therapy: a nationwide register-based study from 1995 through 2010. Acta Orthop. 2013;84(4):331-337. doi:10.3109/17453674.2013.810519.
- Jain A, Stein BE, Skolasky RL, Jones LC, Hungerford MW. Total joint arthroplasty in patients with rheumatoid arthritis: a United States experience from 1992 through 2005. J Arthroplasty. 2012;27(6):881-888. doi:10.1016/j.arth.2011.12.027.
- Barlow JD, Yuan BJ, Schleck CD, Harmsen WS, Cofield RH, Sperling JW. Shoulder arthroplasty for rheumatoid arthritis: 303 consecutive cases with minimum 5-year follow-up. J Shoulder Elbow Surg. 2014;23(6):791-799. doi:10.1016/j.jse.2013.09.016.
- Collins DN, Harryman DT, Wirth MA. Shoulder arthroplasty for the treatment of inflammatory arthritis. J Bone Joint Surg Am. 2004;86–A(11):2489-2496. doi:10.2106/00004623-200411000-00020.
- Rahme H, Mattsson P, Wikblad L, Larsson S. Cement and press-fit humeral stem fixation provides similar results in rheumatoid patients. Clin Orthop Relat Res. 2006;448:28-32. doi:10.1097/01.blo.0000224007.25636.85.
- Rozing PM, Nagels J, Rozing MP. Prognostic factors in arthroplasty in the rheumatoid shoulder. HSS J. 2011;7(1):29-36. doi:10.1007/s11420-010-9172-1.
- Sperling JW, Cofield RH, Schleck CD, Harmsen WS. Total shoulder arthroplasty versus hemiarthroplasty for rheumatoid arthritis of the shoulder: results of 303 consecutive cases. J Shoulder Elbow Surg. 2007;16(6):683-690. doi:10.1016/j.jse.2007.02.135.
- Khan A, Bunker TD, Kitson JB. Clinical and radiological follow-up of the Aequalis third-generation cemented total shoulder replacement: a minimum ten-year study. J Bone Joint Surg Br. 2009;91(12):1594-1600. doi:10.1302/0301-620X.91B12.22139.
- Guery J, Favard L, Sirveaux F, Oudet D, Mole D, Walch G. Reverse total shoulder arthroplasty: survivorship analysis of eighty replacements followed for five to ten years. J Bone Joint Surg Am. 2006;88(8):1742-1747. doi:10.2106/JBJS.E.00851.
- Gee ECA, Hanson EK, Saithna A. Reverse shoulder arthroplasty in rheumatoid arthritis: A systematic review. Open Orthop J. 2015;9:237-245. doi:10.2174/1874325001509010237.
- Holcomb JO, Hebert DJ, Mighell MA, et al. Reverse shoulder arthroplasty in patients with rheumatoid arthritis. J Shoulder Elbow Surg. 2010;19(7):1076-1084. doi:10.1016/j.jse.2009.11.049.
- Postacchini R, Carbone S, Canero G, Ripani M, Postacchini F. Reverse shoulder prosthesis in patients with rheumatoid arthritis: a systematic review. Int Orthop. 2016;40(5):965-973. doi:10.1007/s00264-015-2916-2.
- Rittmeister M, Kerschbaumer F. Grammont reverse total shoulder arthroplasty in patients with rheumatoid arthritis and nonreconstructible rotator cuff lesions. J Shoulder Elbow Surg. 2001;10(1):17-22. doi:10.1067/mse.2001.110515.
- American Medical Association. American Medical Association Web site. www.ama-assn.org/ama. Accessed January 15, 2016.
- Smith AM, Sperling JW, Cofield RH. Rotator cuff repair in patients with rheumatoid arthritis. J Bone Joint Surg. 2005;87(8):1782-1787. doi:10.2106/JBJS.D.02452.
- Betts HM, Abu-Rajab R, Nunn T, Brooksbank AJ. Total shoulder replacement in rheumatoid disease: a 16- to 23-year follow-up. J Bone Joint Surg Br. 2009;91(9):1197-1200. doi:10.1302/0301-620X.91B9.22035.
- Geervliet PC, Somford MP, Winia P, van den Bekerom MP. Long-term results of shoulder hemiarthroplasty in patients with rheumatoid arthritis. Orthopedics. 2015;38(1):e38-e42. doi:10.3928/01477447-20150105-58.
- Hettrich CM, Weldon E III, Boorman RS, Parsons M IV, Matsen FA III. Preoperative factors associated with improvements in shoulder function after humeral hemiarthroplasty. J Bone Joint Surg. 2004;86–A(7):1446-1451.
- Yazdany J, Dudley RA, Chen R, Lin GA, Tseng CW. Coverage for high-cost specialty drugs for rheumatoid arthritis in Medicare Part D. Arthritis Rheumatol. 2015;67(6):1474-1480. doi:10.1002/art.39079.
- Jauregui JJ, Kapadia BH, Dixit A, et al. Thirty-day complications in rheumatoid patients following total knee arthroplasty. Clin Rheumatol. 2016;35(3):595-600. doi:10.1007/s10067-015-3037-4.
- Trail IA, Nuttall D. The results of shoulder arthroplasty in patients with rheumatoid arthritis. J Bone Joint Surg Br. 2002;84(8):1121-1125. doi:10.1302/0301-620X.84B8.0841121
TAKE-HOME POINTS
- There was a significant increase in the utilization of shoulder arthroplasty in RA patients, particularly TSA.
- There was a significant increase in the number of RA patients who underwent shoulder arthroplasty with a diagnosis of rotator cuff disease.
- There were no significant differences in adverse events or mean hospitalization costs between RA and non-RA patients.
- Non-RA patients had a significantly shorter length of stay.
- The utilization of shoulder arthroplasty in patients with RA significantly increased from 2002 to 2011, which may partly reflect a trend toward management of rotator cuff disease with arthroplasty rather than repair.
Severity Weighting of Postoperative Adverse Events in Orthopedic Surgery
Take-Home Points
- Studies of AEs after orthopedic surgery commonly use composite AE outcomes.
- These types of outcomes treat AEs with different clinical significance similarly.
- This study created a single severity-weighted outcome that can be used to characterize the overall severity of a given patient’s postoperative course.
- Future studies may benefit from using this new severity-weighted outcome score.
Recently there has been an increase in the use of national databases for orthopedic surgery research.1-4 Studies commonly compare rates of postoperative adverse events (AEs) across different demographic, comorbidity, and procedural characteristics.5-23 Their conclusions often highlight different modifiable and/or nonmodifiable risk factors associated with the occurrence of postoperative events.
The several dozen AEs that have been investigated range from very severe (eg, death, myocardial infarction, coma) to less severe (eg, urinary tract infection [UTI], anemia requiring blood transfusion). A common approach for these studies is to consider many AEs together in the same analysis, asking a question such as, “What are risk factors for the occurrence of ‘adverse events’ after spine surgery?” Such studies test for associations with the occurrence of “any adverse event,” the occurrence of any “serious adverse event,” or similar composite outcomes. How common this type of study has become is indicated by the fact that in 2013 and 2014, at least 12 such studies were published in Clinical Orthopaedics and Related Research and the Journal of Bone and Joint Surgery,5-14,21-23 and many more in other orthopedic journals.15-20 However, there is a problem in using this type of composite outcome to perform such analyses: AEs with highly varying degrees of severity have identical impacts on the outcome variable, changing it from negative (“no adverse event”) to positive (“at least one adverse event”). As a result, the system may treat a very severe AE such as death and a very minor AE such as UTI similarly. Even in studies that use the slightly more specific composite outcome of “serious adverse events,” death and a nonlethal thromboembolic event would be treated similarly. Failure to differentiate these AEs in terms of their clinical significance detracts from the clinical applicability of conclusions drawn from studies using these types of composite AE outcomes.
In one of many examples that can be considered, a retrospective cohort study compared general and spinal anesthesia used in total knee arthroplasty.10 The rate of any AEs was higher with general anesthesia than with spinal anesthesia (12.34% vs 10.72%; P = .003). However, the only 2 specific AEs that had statistically significant differences were anemia requiring blood transfusion (6.07% vs 5.02%; P = .009) and superficial surgical-site infection (SSI; 0.92% vs 0.68%; P < .001). These 2 AEs are of relatively low severity; nevertheless, because these AEs are common, their differences constituted the majority of the difference in the rate of any AEs. In contrast, differences in the more severe AEs, such as death (0.11% vs 0.22%; P > .05), septic shock (0.14% vs 0.12%; P > .05), and myocardial infarction (0.20% vs 0.20%; P > .05), were small and not statistically significant. Had more weight been given to these more severe events, the outcome of the study likely would have been “no difference.”
To address this shortcoming in orthopedic research methodology, we created a severity-weighted outcome score that can be used to determine the overall “severity” of any given patient’s postoperative course. We also tested this novel outcome score for correlation with procedure type and patient characteristics using orthopedic patients from the American College of Surgeons (ACS) National Surgical Quality Improvement Program (NSQIP). Our intention is for database investigators to be able to use this outcome score in place of the composite outcomes that are dominating this type of research.
Methods
Generation of Severity Weights
Our method is described generally as utility weighting, assigning value weights reflective of overall impact to differing outcome states.24 Parallel methods have been used to generate the disability weights used to determine disability-adjusted life years for the Global Burden of Disease project25 and many other areas of health, economic, and policy research.
All orthopedic faculty members at 2 geographically disparate, large US academic institutions were invited to participate in a severity-weighting exercise. Each surgeon who agreed to participate performed the exercise independently. 
- STEP 1: Please reorder the AE cards by your perception of “severity” for a patient experiencing that event after an orthopedic procedure.
- STEP 2: Once your cards are in order, please determine how many postoperative occurrences of each event you would “trade” for 1 patient experiencing postoperative death. Place this number of occurrences in the box in the upper right corner of each card.
- NOTES: As you consider each AE:
- Please consider an “average” occurrence of that AE, but note that in no case does the AE result in perioperative death.
- Please consider only the “severity” for the patient. (Do not consider the extent to which the event may be related to surgical error.)
- Please consider that the numbers you assign are relative to each other. Hence, if you would trade 20 of “event A” for 1 death, and if you would trade 40 of “event B” for 1 death, the implication is that you would trade 20 of “event A” for 40 of “event B.”
- You may readjust the order of your cards at any point.
Participants’ responses were recorded. For each number provided by each participant, the inverse (reciprocal) was taken and multiplied by 100%. This new number was taken to be the percentage severity of death that the given participant considered the given AE to embody. For example, as a hypothetical on one end of the spectrum, if a participant reported 1 (he/she would trade 1 AE X for 1 death), then the severity would be 1/1 × 100% = 100% of death, a very severe AE. Conversely, if a participant reported a very large number like 100,000 (he/she would trade 100,000 AEs X for 1 death), then the severity would be 1/100,000 × 100% = 0.001% of death, a very minor AE. More commonly, a participant will report a number like 25, which would translate to 4% of death (1/25 × 100% = 4%). For each AE, weights were then averaged across participants to derive a mean severity weight to be used to generate a novel composite outcome score.
Definition of Novel Composite Outcome Score
The novel composite outcome score would be expressed as a percentage to be interpreted as percentage severity of death, which we termed severity-weighted outcome relative to death (SWORD). For each patient, SWORD was defined as no AE (0%) or postoperative death (100%), with other AEs assigned mean severity weights based on faculty members’ survey responses. A patient with multiple AEs would be assigned the weight for the more severe AE. This method was chosen over summing the AE weights because in many cases the AEs were thought to overlap; hence, summing would be inappropriate. For example, generally a deep SSI would result in a return to the operating room, and one would not want to double-count this AE. Similarly, it would not make sense for a patient who died of a complication to have a SWORD of >100%, which would be the summing result.
Application to ACS-NSQIP Patients
ACS-NSQIP is a surgical registry that prospectively identifies patients undergoing major surgery at any of >500 institutions nationwide.26,27 Patients are characterized at baseline and are followed for AEs over the first 30 postoperative days. 
First, mean SWORD was calculated and reported for patients undergoing each of the 8 procedures. Analysis of variance (ANOVA) was used to test for associations of mean SWORD with type of procedure both before and after multivariate adjustment for demographics (sex; age in years, <40, 40-49, 50-59, 60-69, 70-79, 80-89, ≥90) and comorbidities (diabetes, hypertension, chronic obstructive pulmonary disease, exertional dyspnea, end-stage renal disease, congestive heart failure).
Second, patients undergoing the procedure with the highest mean SWORD (hip fracture surgery) were examined in depth. Among only these patients, multivariate ANOVA was used to test for associations of mean SWORD with the same demographics and comorbidities.
All statistical tests were 2-tailed. Significance was set at α = 0.05 (P < .05).
All 23 institution A faculty members (100%) and 24 (89%) of the 27 institution B faculty members completed the exercise. 
In the ACS-NSQIP database, 85,109 patients were identified on the basis of the initial inclusion criteria. 
Results
Figure 1 shows mean severity weights and standard errors generated from faculty responses. Mean (standard error) severity weight for UTI was 0.23% (0.08%); blood transfusion, 0.28% (0.09%); pneumonia, 0.55% (0.15%); hospital readmission, 0.59% (0.23%); wound dehiscence, 0.64% (0.17%); deep vein thrombosis, 0.64% (0.19%); superficial SSI, 0.68% (0.23%); return to operating room, 0.91% (0.29%); progressive renal insufficiency, 0.93% (0.27%); graft/prosthesis/flap failure, 1.20% (0.34%); unplanned intubation, 1.38% (0.53%); deep SSI, 1.45% (0.38%); failure to wean from ventilator, 1.45% (0.48%); organ/space SSI, 1.76% (0.46%); sepsis without shock, 1.77% (0.42%); peripheral nerve injury, 1.83% (0.47%); pulmonary embolism, 2.99% (0.76%); acute renal failure, 3.95% (0.85%); myocardial infarction, 4.16% (0.98%); septic shock, 7.17% (1.36%); stroke, 8.73% (1.74%); cardiac arrest requiring cardiopulmonary resuscitation, 9.97% (2.46%); and coma, 15.14% (3.04%).
Among ACS-NSQIP patients, mean SWORD ranged from 0.2% (elective anterior cervical decompression and fusion) to 6.0% (hip fracture surgery) (Figure 2). 
Discussion
The use of national databases in studies has become increasingly common in orthopedic surgery.1-4
The academic orthopedic surgeons who participated in our severity-weighting exercise thought the various AEs have markedly different severities. The least severe AE (UTI) was considered 0.23% as severe as postoperative death, with other events spanning the range up to 15.14% as severe as death. This wide range of severities demonstrates the problem with composite outcomes that implicitly consider all AEs similarly severe. Use of these markedly disparate weights in the development of SWORD enables this outcome to be more clinically applicable than outcomes such as “any adverse events.”
SWORD was highly associated with procedure type both before and after adjustment for demographics and comorbidities. Among patients undergoing the highest SWORD procedure (hip fracture surgery), SWORD was also associated with age, sex, and 4 of 6 tested comorbidities. Together, our findings show how SWORD is intended to be used in studies: to identify demographic, comorbidity, and procedural risk factors for an adverse postoperative course. We propose that researchers use our weighted outcome as their primary outcome—it is more meaningful than the simpler composite outcomes commonly used.
Outside orthopedic surgery, a small series of studies has addressed severity weighting of postoperative AEs.25,28-30 However, their approach was very different, as they were not designed to generate weights that could be transferred to future studies; rather, they simply compared severities of postoperative courses for patients within each individual study. In each study, a review of each original patient record was required, as the severity of each patient’s postoperative course was characterized according to the degree of any postoperative intervention—from no intervention to minor interventions such as placement of an intravenous catheter and major interventions such as endoscopic, radiologic, and surgical procedures. Only after the degree of intervention was defined could an outcome score be assigned to a given patient. However, databases do not depict the degree of intervention with nearly enough detail for this type of approach; they typically identify only occurrence or nonoccurrence of each event. Our work, which arose independently from this body of literature, enables an entirely different type of analysis. SWORD, which is not based on degree of intervention but on perceived severity of an “average” event, enables direct application of severity weights to large databases that store simple information on occurrence and nonoccurrence of specific AEs.
This study had several limitations. Most significantly, the generated severity weights were based on the surgeons’ subjective perceptions of severity, not on definitive assessments of the impacts of specific AEs on actual patients. We did not query the specialists who treat the complications or who present data on the costs and disabilities that may arise from these AEs. In addition, to develop our severity weighting scale, we queried faculty at only 2 institutions. A survey of surgeons throughout the United States would be more representative and would minimize selection bias. This is a potential research area. Another limitation is that scoring was subjective, based on surgeons’ perceptions of patients—in contrast to the Global Burden of Disease project, in which severity was based more objectively on epidemiologic data from >150 countries.
Orthopedic database research itself has often-noted limitations, including inability to sufficiently control for confounders, potential inaccuracies in data coding, limited follow-up, and lack of orthopedic-specific outcomes.1-4,31-33 However, this research also has much to offer, has increased tremendously over the past several years, and is expected to continue to expand. Many of the limitations of database studies cannot be entirely reversed. In providing a system for weighting postoperative AEs, our study fills a methodologic void. Future studies in orthopedics may benefit from using the severity-weighted outcome score presented here. Other fields with growth in database research may consider using similar methods to create severity-weighting systems of their own.
Am J Orthop. 2017;46(4):E235-E243. Copyright Frontline Medical Communications Inc. 2017. All rights reserved.
1. Bohl DD, Basques BA, Golinvaux NS, Baumgaertner MR, Grauer JN. Nationwide Inpatient Sample and National Surgical Quality Improvement Program give different results in hip fracture studies. Clin Orthop Relat Res. 2014;472(6):1672-1680.
2. Bohl DD, Russo GS, Basques BA, et al. Variations in data collection methods between national databases affect study results: a comparison of the Nationwide Inpatient Sample and National Surgical Quality Improvement Program databases for lumbar spine fusion procedures. J Bone Joint Surg Am. 2014;96(23):e193.
3. Bohl DD, Grauer JN, Leopold SS. Editor’s spotlight/Take 5: Nationwide Inpatient Sample and National Surgical Quality Improvement Program give different results in hip fracture studies. Clin Orthop Relat Res. 2014;472(6):1667-1671.
4. Levin PE. Apples, oranges, and national databases: commentary on an article by Daniel D. Bohl, MPH, et al.: “Variations in data collection methods between national databases affect study results: a comparison of the Nationwide Inpatient Sample and National Surgical Quality Improvement Program databases for lumbar spine fusion procedures.” J Bone Joint Surg Am. 2014;96(23):e198.
5. Duchman KR, Gao Y, Pugely AJ, Martin CT, Callaghan JJ. Differences in short-term complications between unicompartmental and total knee arthroplasty: a propensity score matched analysis. J Bone Joint Surg Am. 2014;96(16):1387-1394.
6. Edelstein AI, Lovecchio FC, Saha S, Hsu WK, Kim JY. Impact of resident involvement on orthopaedic surgery outcomes: an analysis of 30,628 patients from the American College of Surgeons National Surgical Quality Improvement Program database. J Bone Joint Surg Am. 2014;96(15):e131.
7. Belmont PJ Jr, Goodman GP, Waterman BR, Bader JO, Schoenfeld AJ. Thirty-day postoperative complications and mortality following total knee arthroplasty: incidence and risk factors among a national sample of 15,321 patients. J Bone Joint Surg Am. 2014;96(1):20-26.
8. Martin CT, Pugely AJ, Gao Y, Mendoza-Lattes S. Thirty-day morbidity after single-level anterior cervical discectomy and fusion: identification of risk factors and emphasis on the safety of outpatient procedures. J Bone Joint Surg Am. 2014;96(15):1288-1294.
9. Martin CT, Pugely AJ, Gao Y, Wolf BR. Risk factors for thirty-day morbidity and mortality following knee arthroscopy: a review of 12,271 patients from the National Surgical Quality Improvement Program database. J Bone Joint Surg Am. 2013;95(14):e98 1-10.
10. Pugely AJ, Martin CT, Gao Y, Mendoza-Lattes S, Callaghan JJ. Differences in short-term complications between spinal and general anesthesia for primary total knee arthroplasty. J Bone Joint Surg Am. 2013;95(3):193-199.
11. Odum SM, Springer BD. In-hospital complication rates and associated factors after simultaneous bilateral versus unilateral total knee arthroplasty. J Bone Joint Surg Am. 2014;96(13):1058-1065.
12. Yoshihara H, Yoneoka D. Trends in the incidence and in-hospital outcomes of elective major orthopaedic surgery in patients eighty years of age and older in the United States from 2000 to 2009. J Bone Joint Surg Am. 2014;96(14):1185-1191.
13. Lin CA, Kuo AC, Takemoto S. Comorbidities and perioperative complications in HIV-positive patients undergoing primary total hip and knee arthroplasty. J Bone Joint Surg Am. 2013;95(11):1028-1036.
14. Mednick RE, Alvi HM, Krishnan V, Lovecchio F, Manning DW. Factors affecting readmission rates following primary total hip arthroplasty. J Bone Joint Surg Am. 2014;96(14):1201-1209.
15. Pugely AJ, Martin CT, Gao Y, Ilgenfritz R, Weinstein SL. The incidence and risk factors for short-term morbidity and mortality in pediatric deformity spinal surgery: an analysis of the NSQIP pediatric database. Spine. 2014;39(15):1225-1234.
16. Haughom BD, Schairer WW, Hellman MD, Yi PH, Levine BR. Resident involvement does not influence complication after total hip arthroplasty: an analysis of 13,109 cases. J Arthroplasty. 2014;29(10):1919-1924.
17. Belmont PJ Jr, Goodman GP, Hamilton W, Waterman BR, Bader JO, Schoenfeld AJ. Morbidity and mortality in the thirty-day period following total hip arthroplasty: risk factors and incidence. J Arthroplasty. 2014;29(10):2025-2030.
18. Bohl DD, Fu MC, Golinvaux NS, Basques BA, Gruskay JA, Grauer JN. The “July effect” in primary total hip and knee arthroplasty: analysis of 21,434 cases from the ACS-NSQIP database. J Arthroplasty. 2014;29(7):1332-1338.
19. Bohl DD, Fu MC, Gruskay JA, Basques BA, Golinvaux NS, Grauer JN. “July effect” in elective spine surgery: analysis of the American College of Surgeons National Surgical Quality Improvement Program database. Spine. 2014;39(7):603-611.
20. Babu R, Thomas S, Hazzard MA, et al. Morbidity, mortality, and health care costs for patients undergoing spine surgery following the ACGME resident duty-hour reform: clinical article. J Neurosurg Spine. 2014;21(4):502-515.
21. Lovecchio F, Beal M, Kwasny M, Manning D. Do patients with insulin-dependent and noninsulin-dependent diabetes have different risks for complications after arthroplasty? Clin Orthop Relat Res. 2014;472(11):3570-3575.
22. Pugely AJ, Gao Y, Martin CT, Callagh JJ, Weinstein SL, Marsh JL. The effect of resident participation on short-term outcomes after orthopaedic surgery. Clin Orthop Relat Res. 2014;472(7):2290-2300.
23. Easterlin MC, Chang DG, Talamini M, Chang DC. Older age increases short-term surgical complications after primary knee arthroplasty. Clin Orthop Relat Res. 2013;471(8):2611-2620.
24. Morimoto T, Fukui T. Utilities measured by rating scale, time trade-off, and standard gamble: review and reference for health care professionals. J Epidemiology. 2002;12(2):160-178.
25. Salomon JA, Vos T, Hogan DR, et al. Common values in assessing health outcomes from disease and injury: disability weights measurement study for the Global Burden of Disease Study 2010. Lancet. 2012;380(9859):2129-2143.
26. American College of Surgeons National Surgical Quality Improvement Program. User Guide for the 2011 Participant Use Data File. https://www.facs.org/~/media/files/quality%20programs/nsqip/ug11.ashx. Published October 2012. Accessed December 1, 2013.
27. Molina CS, Thakore RV, Blumer A, Obremskey WT, Sethi MK. Use of the National Surgical Quality Improvement Program in orthopaedic surgery. Clin Orthop Relat Res. 2015;473(5):1574-1581.
28. Strasberg SM, Hall BL. Postoperative Morbidity Index: a quantitative measure of severity of postoperative complications. J Am Coll Surg. 2011;213(5):616-626.
29. Beilan J, Strakosha R, Palacios DA, Rosser CJ. The Postoperative Morbidity Index: a quantitative weighing of postoperative complications applied to urological procedures. BMC Urol. 2014;14:1.
30. Porembka MR, Hall BL, Hirbe M, Strasberg SM. Quantitative weighting of postoperative complications based on the Accordion Severity Grading System: demonstration of potential impact using the American College of Surgeons National Surgical Quality Improvement Program. J Am Coll Surg. 2010;210(3):286-298.
31. Golinvaux NS, Bohl DD, Basques BA, Fu MC, Gardner EC, Grauer JN. Limitations of administrative databases in spine research: a study in obesity. Spine J. 2014;14(12):2923-2928.
32. Golinvaux NS, Bohl DD, Basques BA, Grauer JN. Administrative database concerns: accuracy of International Classification of Diseases, Ninth Revision coding is poor for preoperative anemia in patients undergoing spinal fusion. Spine. 2014;39(24):2019-2023.
33. Bekkers S, Bot AG, Makarawung D, Neuhaus V, Ring D. The National Hospital Discharge Survey and Nationwide Inpatient Sample: the databases used affect results in THA research. Clin Orthop Relat Res. 2014;472(11):3441-3449.
Take-Home Points
- Studies of AEs after orthopedic surgery commonly use composite AE outcomes.
- These types of outcomes treat AEs with different clinical significance similarly.
- This study created a single severity-weighted outcome that can be used to characterize the overall severity of a given patient’s postoperative course.
- Future studies may benefit from using this new severity-weighted outcome score.
Recently there has been an increase in the use of national databases for orthopedic surgery research.1-4 Studies commonly compare rates of postoperative adverse events (AEs) across different demographic, comorbidity, and procedural characteristics.5-23 Their conclusions often highlight different modifiable and/or nonmodifiable risk factors associated with the occurrence of postoperative events.
The several dozen AEs that have been investigated range from very severe (eg, death, myocardial infarction, coma) to less severe (eg, urinary tract infection [UTI], anemia requiring blood transfusion). A common approach for these studies is to consider many AEs together in the same analysis, asking a question such as, “What are risk factors for the occurrence of ‘adverse events’ after spine surgery?” Such studies test for associations with the occurrence of “any adverse event,” the occurrence of any “serious adverse event,” or similar composite outcomes. How common this type of study has become is indicated by the fact that in 2013 and 2014, at least 12 such studies were published in Clinical Orthopaedics and Related Research and the Journal of Bone and Joint Surgery,5-14,21-23 and many more in other orthopedic journals.15-20 However, there is a problem in using this type of composite outcome to perform such analyses: AEs with highly varying degrees of severity have identical impacts on the outcome variable, changing it from negative (“no adverse event”) to positive (“at least one adverse event”). As a result, the system may treat a very severe AE such as death and a very minor AE such as UTI similarly. Even in studies that use the slightly more specific composite outcome of “serious adverse events,” death and a nonlethal thromboembolic event would be treated similarly. Failure to differentiate these AEs in terms of their clinical significance detracts from the clinical applicability of conclusions drawn from studies using these types of composite AE outcomes.
In one of many examples that can be considered, a retrospective cohort study compared general and spinal anesthesia used in total knee arthroplasty.10 The rate of any AEs was higher with general anesthesia than with spinal anesthesia (12.34% vs 10.72%; P = .003). However, the only 2 specific AEs that had statistically significant differences were anemia requiring blood transfusion (6.07% vs 5.02%; P = .009) and superficial surgical-site infection (SSI; 0.92% vs 0.68%; P < .001). These 2 AEs are of relatively low severity; nevertheless, because these AEs are common, their differences constituted the majority of the difference in the rate of any AEs. In contrast, differences in the more severe AEs, such as death (0.11% vs 0.22%; P > .05), septic shock (0.14% vs 0.12%; P > .05), and myocardial infarction (0.20% vs 0.20%; P > .05), were small and not statistically significant. Had more weight been given to these more severe events, the outcome of the study likely would have been “no difference.”
To address this shortcoming in orthopedic research methodology, we created a severity-weighted outcome score that can be used to determine the overall “severity” of any given patient’s postoperative course. We also tested this novel outcome score for correlation with procedure type and patient characteristics using orthopedic patients from the American College of Surgeons (ACS) National Surgical Quality Improvement Program (NSQIP). Our intention is for database investigators to be able to use this outcome score in place of the composite outcomes that are dominating this type of research.
Methods
Generation of Severity Weights
Our method is described generally as utility weighting, assigning value weights reflective of overall impact to differing outcome states.24 Parallel methods have been used to generate the disability weights used to determine disability-adjusted life years for the Global Burden of Disease project25 and many other areas of health, economic, and policy research.
All orthopedic faculty members at 2 geographically disparate, large US academic institutions were invited to participate in a severity-weighting exercise. Each surgeon who agreed to participate performed the exercise independently.
- STEP 1: Please reorder the AE cards by your perception of “severity” for a patient experiencing that event after an orthopedic procedure.
- STEP 2: Once your cards are in order, please determine how many postoperative occurrences of each event you would “trade” for 1 patient experiencing postoperative death. Place this number of occurrences in the box in the upper right corner of each card.
- NOTES: As you consider each AE:
- Please consider an “average” occurrence of that AE, but note that in no case does the AE result in perioperative death.
- Please consider only the “severity” for the patient. (Do not consider the extent to which the event may be related to surgical error.)
- Please consider that the numbers you assign are relative to each other. Hence, if you would trade 20 of “event A” for 1 death, and if you would trade 40 of “event B” for 1 death, the implication is that you would trade 20 of “event A” for 40 of “event B.”
- You may readjust the order of your cards at any point.
Participants’ responses were recorded. For each number provided by each participant, the inverse (reciprocal) was taken and multiplied by 100%. This new number was taken to be the percentage severity of death that the given participant considered the given AE to embody. For example, as a hypothetical on one end of the spectrum, if a participant reported 1 (he/she would trade 1 AE X for 1 death), then the severity would be 1/1 × 100% = 100% of death, a very severe AE. Conversely, if a participant reported a very large number like 100,000 (he/she would trade 100,000 AEs X for 1 death), then the severity would be 1/100,000 × 100% = 0.001% of death, a very minor AE. More commonly, a participant will report a number like 25, which would translate to 4% of death (1/25 × 100% = 4%). For each AE, weights were then averaged across participants to derive a mean severity weight to be used to generate a novel composite outcome score.
Definition of Novel Composite Outcome Score
The novel composite outcome score would be expressed as a percentage to be interpreted as percentage severity of death, which we termed severity-weighted outcome relative to death (SWORD). For each patient, SWORD was defined as no AE (0%) or postoperative death (100%), with other AEs assigned mean severity weights based on faculty members’ survey responses. A patient with multiple AEs would be assigned the weight for the more severe AE. This method was chosen over summing the AE weights because in many cases the AEs were thought to overlap; hence, summing would be inappropriate. For example, generally a deep SSI would result in a return to the operating room, and one would not want to double-count this AE. Similarly, it would not make sense for a patient who died of a complication to have a SWORD of >100%, which would be the summing result.
Application to ACS-NSQIP Patients
ACS-NSQIP is a surgical registry that prospectively identifies patients undergoing major surgery at any of >500 institutions nationwide.26,27 Patients are characterized at baseline and are followed for AEs over the first 30 postoperative days.
First, mean SWORD was calculated and reported for patients undergoing each of the 8 procedures. Analysis of variance (ANOVA) was used to test for associations of mean SWORD with type of procedure both before and after multivariate adjustment for demographics (sex; age in years, <40, 40-49, 50-59, 60-69, 70-79, 80-89, ≥90) and comorbidities (diabetes, hypertension, chronic obstructive pulmonary disease, exertional dyspnea, end-stage renal disease, congestive heart failure).
Second, patients undergoing the procedure with the highest mean SWORD (hip fracture surgery) were examined in depth. Among only these patients, multivariate ANOVA was used to test for associations of mean SWORD with the same demographics and comorbidities.
All statistical tests were 2-tailed. Significance was set at α = 0.05 (P < .05).
All 23 institution A faculty members (100%) and 24 (89%) of the 27 institution B faculty members completed the exercise.
In the ACS-NSQIP database, 85,109 patients were identified on the basis of the initial inclusion criteria.
Results
Figure 1 shows mean severity weights and standard errors generated from faculty responses. Mean (standard error) severity weight for UTI was 0.23% (0.08%); blood transfusion, 0.28% (0.09%); pneumonia, 0.55% (0.15%); hospital readmission, 0.59% (0.23%); wound dehiscence, 0.64% (0.17%); deep vein thrombosis, 0.64% (0.19%); superficial SSI, 0.68% (0.23%); return to operating room, 0.91% (0.29%); progressive renal insufficiency, 0.93% (0.27%); graft/prosthesis/flap failure, 1.20% (0.34%); unplanned intubation, 1.38% (0.53%); deep SSI, 1.45% (0.38%); failure to wean from ventilator, 1.45% (0.48%); organ/space SSI, 1.76% (0.46%); sepsis without shock, 1.77% (0.42%); peripheral nerve injury, 1.83% (0.47%); pulmonary embolism, 2.99% (0.76%); acute renal failure, 3.95% (0.85%); myocardial infarction, 4.16% (0.98%); septic shock, 7.17% (1.36%); stroke, 8.73% (1.74%); cardiac arrest requiring cardiopulmonary resuscitation, 9.97% (2.46%); and coma, 15.14% (3.04%).
Among ACS-NSQIP patients, mean SWORD ranged from 0.2% (elective anterior cervical decompression and fusion) to 6.0% (hip fracture surgery) (Figure 2).
Discussion
The use of national databases in studies has become increasingly common in orthopedic surgery.1-4
The academic orthopedic surgeons who participated in our severity-weighting exercise thought the various AEs have markedly different severities. The least severe AE (UTI) was considered 0.23% as severe as postoperative death, with other events spanning the range up to 15.14% as severe as death. This wide range of severities demonstrates the problem with composite outcomes that implicitly consider all AEs similarly severe. Use of these markedly disparate weights in the development of SWORD enables this outcome to be more clinically applicable than outcomes such as “any adverse events.”
SWORD was highly associated with procedure type both before and after adjustment for demographics and comorbidities. Among patients undergoing the highest SWORD procedure (hip fracture surgery), SWORD was also associated with age, sex, and 4 of 6 tested comorbidities. Together, our findings show how SWORD is intended to be used in studies: to identify demographic, comorbidity, and procedural risk factors for an adverse postoperative course. We propose that researchers use our weighted outcome as their primary outcome—it is more meaningful than the simpler composite outcomes commonly used.
Outside orthopedic surgery, a small series of studies has addressed severity weighting of postoperative AEs.25,28-30 However, their approach was very different, as they were not designed to generate weights that could be transferred to future studies; rather, they simply compared severities of postoperative courses for patients within each individual study. In each study, a review of each original patient record was required, as the severity of each patient’s postoperative course was characterized according to the degree of any postoperative intervention—from no intervention to minor interventions such as placement of an intravenous catheter and major interventions such as endoscopic, radiologic, and surgical procedures. Only after the degree of intervention was defined could an outcome score be assigned to a given patient. However, databases do not depict the degree of intervention with nearly enough detail for this type of approach; they typically identify only occurrence or nonoccurrence of each event. Our work, which arose independently from this body of literature, enables an entirely different type of analysis. SWORD, which is not based on degree of intervention but on perceived severity of an “average” event, enables direct application of severity weights to large databases that store simple information on occurrence and nonoccurrence of specific AEs.
This study had several limitations. Most significantly, the generated severity weights were based on the surgeons’ subjective perceptions of severity, not on definitive assessments of the impacts of specific AEs on actual patients. We did not query the specialists who treat the complications or who present data on the costs and disabilities that may arise from these AEs. In addition, to develop our severity weighting scale, we queried faculty at only 2 institutions. A survey of surgeons throughout the United States would be more representative and would minimize selection bias. This is a potential research area. Another limitation is that scoring was subjective, based on surgeons’ perceptions of patients—in contrast to the Global Burden of Disease project, in which severity was based more objectively on epidemiologic data from >150 countries.
Orthopedic database research itself has often-noted limitations, including inability to sufficiently control for confounders, potential inaccuracies in data coding, limited follow-up, and lack of orthopedic-specific outcomes.1-4,31-33 However, this research also has much to offer, has increased tremendously over the past several years, and is expected to continue to expand. Many of the limitations of database studies cannot be entirely reversed. In providing a system for weighting postoperative AEs, our study fills a methodologic void. Future studies in orthopedics may benefit from using the severity-weighted outcome score presented here. Other fields with growth in database research may consider using similar methods to create severity-weighting systems of their own.
Am J Orthop. 2017;46(4):E235-E243. Copyright Frontline Medical Communications Inc. 2017. All rights reserved.
1. Bohl DD, Basques BA, Golinvaux NS, Baumgaertner MR, Grauer JN. Nationwide Inpatient Sample and National Surgical Quality Improvement Program give different results in hip fracture studies. Clin Orthop Relat Res. 2014;472(6):1672-1680.
2. Bohl DD, Russo GS, Basques BA, et al. Variations in data collection methods between national databases affect study results: a comparison of the Nationwide Inpatient Sample and National Surgical Quality Improvement Program databases for lumbar spine fusion procedures. J Bone Joint Surg Am. 2014;96(23):e193.
3. Bohl DD, Grauer JN, Leopold SS. Editor’s spotlight/Take 5: Nationwide Inpatient Sample and National Surgical Quality Improvement Program give different results in hip fracture studies. Clin Orthop Relat Res. 2014;472(6):1667-1671.
4. Levin PE. Apples, oranges, and national databases: commentary on an article by Daniel D. Bohl, MPH, et al.: “Variations in data collection methods between national databases affect study results: a comparison of the Nationwide Inpatient Sample and National Surgical Quality Improvement Program databases for lumbar spine fusion procedures.” J Bone Joint Surg Am. 2014;96(23):e198.
5. Duchman KR, Gao Y, Pugely AJ, Martin CT, Callaghan JJ. Differences in short-term complications between unicompartmental and total knee arthroplasty: a propensity score matched analysis. J Bone Joint Surg Am. 2014;96(16):1387-1394.
6. Edelstein AI, Lovecchio FC, Saha S, Hsu WK, Kim JY. Impact of resident involvement on orthopaedic surgery outcomes: an analysis of 30,628 patients from the American College of Surgeons National Surgical Quality Improvement Program database. J Bone Joint Surg Am. 2014;96(15):e131.
7. Belmont PJ Jr, Goodman GP, Waterman BR, Bader JO, Schoenfeld AJ. Thirty-day postoperative complications and mortality following total knee arthroplasty: incidence and risk factors among a national sample of 15,321 patients. J Bone Joint Surg Am. 2014;96(1):20-26.
8. Martin CT, Pugely AJ, Gao Y, Mendoza-Lattes S. Thirty-day morbidity after single-level anterior cervical discectomy and fusion: identification of risk factors and emphasis on the safety of outpatient procedures. J Bone Joint Surg Am. 2014;96(15):1288-1294.
9. Martin CT, Pugely AJ, Gao Y, Wolf BR. Risk factors for thirty-day morbidity and mortality following knee arthroscopy: a review of 12,271 patients from the National Surgical Quality Improvement Program database. J Bone Joint Surg Am. 2013;95(14):e98 1-10.
10. Pugely AJ, Martin CT, Gao Y, Mendoza-Lattes S, Callaghan JJ. Differences in short-term complications between spinal and general anesthesia for primary total knee arthroplasty. J Bone Joint Surg Am. 2013;95(3):193-199.
11. Odum SM, Springer BD. In-hospital complication rates and associated factors after simultaneous bilateral versus unilateral total knee arthroplasty. J Bone Joint Surg Am. 2014;96(13):1058-1065.
12. Yoshihara H, Yoneoka D. Trends in the incidence and in-hospital outcomes of elective major orthopaedic surgery in patients eighty years of age and older in the United States from 2000 to 2009. J Bone Joint Surg Am. 2014;96(14):1185-1191.
13. Lin CA, Kuo AC, Takemoto S. Comorbidities and perioperative complications in HIV-positive patients undergoing primary total hip and knee arthroplasty. J Bone Joint Surg Am. 2013;95(11):1028-1036.
14. Mednick RE, Alvi HM, Krishnan V, Lovecchio F, Manning DW. Factors affecting readmission rates following primary total hip arthroplasty. J Bone Joint Surg Am. 2014;96(14):1201-1209.
15. Pugely AJ, Martin CT, Gao Y, Ilgenfritz R, Weinstein SL. The incidence and risk factors for short-term morbidity and mortality in pediatric deformity spinal surgery: an analysis of the NSQIP pediatric database. Spine. 2014;39(15):1225-1234.
16. Haughom BD, Schairer WW, Hellman MD, Yi PH, Levine BR. Resident involvement does not influence complication after total hip arthroplasty: an analysis of 13,109 cases. J Arthroplasty. 2014;29(10):1919-1924.
17. Belmont PJ Jr, Goodman GP, Hamilton W, Waterman BR, Bader JO, Schoenfeld AJ. Morbidity and mortality in the thirty-day period following total hip arthroplasty: risk factors and incidence. J Arthroplasty. 2014;29(10):2025-2030.
18. Bohl DD, Fu MC, Golinvaux NS, Basques BA, Gruskay JA, Grauer JN. The “July effect” in primary total hip and knee arthroplasty: analysis of 21,434 cases from the ACS-NSQIP database. J Arthroplasty. 2014;29(7):1332-1338.
19. Bohl DD, Fu MC, Gruskay JA, Basques BA, Golinvaux NS, Grauer JN. “July effect” in elective spine surgery: analysis of the American College of Surgeons National Surgical Quality Improvement Program database. Spine. 2014;39(7):603-611.
20. Babu R, Thomas S, Hazzard MA, et al. Morbidity, mortality, and health care costs for patients undergoing spine surgery following the ACGME resident duty-hour reform: clinical article. J Neurosurg Spine. 2014;21(4):502-515.
21. Lovecchio F, Beal M, Kwasny M, Manning D. Do patients with insulin-dependent and noninsulin-dependent diabetes have different risks for complications after arthroplasty? Clin Orthop Relat Res. 2014;472(11):3570-3575.
22. Pugely AJ, Gao Y, Martin CT, Callagh JJ, Weinstein SL, Marsh JL. The effect of resident participation on short-term outcomes after orthopaedic surgery. Clin Orthop Relat Res. 2014;472(7):2290-2300.
23. Easterlin MC, Chang DG, Talamini M, Chang DC. Older age increases short-term surgical complications after primary knee arthroplasty. Clin Orthop Relat Res. 2013;471(8):2611-2620.
24. Morimoto T, Fukui T. Utilities measured by rating scale, time trade-off, and standard gamble: review and reference for health care professionals. J Epidemiology. 2002;12(2):160-178.
25. Salomon JA, Vos T, Hogan DR, et al. Common values in assessing health outcomes from disease and injury: disability weights measurement study for the Global Burden of Disease Study 2010. Lancet. 2012;380(9859):2129-2143.
26. American College of Surgeons National Surgical Quality Improvement Program. User Guide for the 2011 Participant Use Data File. https://www.facs.org/~/media/files/quality%20programs/nsqip/ug11.ashx. Published October 2012. Accessed December 1, 2013.
27. Molina CS, Thakore RV, Blumer A, Obremskey WT, Sethi MK. Use of the National Surgical Quality Improvement Program in orthopaedic surgery. Clin Orthop Relat Res. 2015;473(5):1574-1581.
28. Strasberg SM, Hall BL. Postoperative Morbidity Index: a quantitative measure of severity of postoperative complications. J Am Coll Surg. 2011;213(5):616-626.
29. Beilan J, Strakosha R, Palacios DA, Rosser CJ. The Postoperative Morbidity Index: a quantitative weighing of postoperative complications applied to urological procedures. BMC Urol. 2014;14:1.
30. Porembka MR, Hall BL, Hirbe M, Strasberg SM. Quantitative weighting of postoperative complications based on the Accordion Severity Grading System: demonstration of potential impact using the American College of Surgeons National Surgical Quality Improvement Program. J Am Coll Surg. 2010;210(3):286-298.
31. Golinvaux NS, Bohl DD, Basques BA, Fu MC, Gardner EC, Grauer JN. Limitations of administrative databases in spine research: a study in obesity. Spine J. 2014;14(12):2923-2928.
32. Golinvaux NS, Bohl DD, Basques BA, Grauer JN. Administrative database concerns: accuracy of International Classification of Diseases, Ninth Revision coding is poor for preoperative anemia in patients undergoing spinal fusion. Spine. 2014;39(24):2019-2023.
33. Bekkers S, Bot AG, Makarawung D, Neuhaus V, Ring D. The National Hospital Discharge Survey and Nationwide Inpatient Sample: the databases used affect results in THA research. Clin Orthop Relat Res. 2014;472(11):3441-3449.
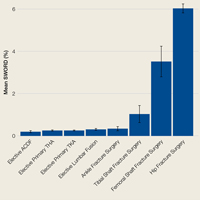
Does Preoperative Pneumonia Affect Complications of Geriatric Hip Fracture Surgery?
Take-Home Points
- The prevalence of preoperative pneumonia is 1.2% among hip fracture patients aged >65 years.
- Preoperative pneumonia is an independent risk factor for mortality and adverse events including renal failure, prolonged ventilator dependence, and prolonged altered mental status after geriatric hip fracture surgery.
- Underweight BMI (<18.5 kg/m2) was associated with higher mortality within 30 days among hip fracture patients admitted with pneumonia.
- The mortality rate normalized to that of patients without pneumonia within 2 weeks of hip fracture surgery.
- Time from admission to surgery was not associated with adverse events or mortality among hip fracture patients admitted with pneumonia.
Preoperative pneumonia remains relatively unexplored as a risk factor for adverse outcomes in geriatric hip fracture surgery. Dated studies report a 0.3% to 3.2% prevalence of “recent pneumonia” in patients presenting with hip fracture but provide neither a definition of pneumonia based on clinical criteria nor a subset analysis of outcomes in the pneumonia group.1-3 Although active pneumonia has been identified as a preoperative optimization target in the management guidelines for geriatric hip fracture,4 we are unaware of any studies that have reported on differences in demographics, comorbidities, delay to surgery, or adverse outcomes between hip fracture patients with and without preoperative pneumonia.
This paucity of information on the effect of preoperative pneumonia in the hip fracture population may be related to low prevalence of preoperative pneumonia and a cadre of variable definitions, which limit identification of a cohort of patients with preoperative pneumonia large enough from which to draw meaningful results. Database studies, especially those using surgical registries rather than administrative or reimbursement data, offer particular advantages for investigation of such rare clinical entities.5Medical care of patients with pneumonia alone is known to be facilitated by assessments of mortality risk from clinical and laboratory data. The modified British Thoracic Society rule/CURB-65 (confusion, urea, respiratory rate, blood pressure) score is strongly predictive of mortality in hospitalized adults with pneumonia (odds ratio [OR], 4.59; 95% confidence interval [CI], 1.42-14.85; P = .011) and may guide antibiotic therapy, laboratory investigations, and the decision to intubate in a patient with pneumonia.6-8 This score is predictive of adverse events (AEs), hospital length of stay, and use of intensive care services.6,7,9-13 We hypothesized that preoperative clinical indicators assessed by pneumonia severity scores as well as patient demographics and baseline comorbidities may also have prognostic value for risk of AEs in a cohort of geriatric hip fracture surgery patients with preoperative pneumonia.
In this article, we first describe the prevalence of preoperative pneumonia in geriatric hip fracture surgery patients as well as demographic and operative differences between patients with and without the disease. We then ask 3 questions: Is preoperative pneumonia an independent risk factor for mortality and adverse outcomes in geriatric hip fracture surgery? Is there a postoperative interval during which the unadjusted mortality rate is higher among patients with preoperative pneumonia? In patients with preoperative pneumonia, what are the predictors of morbidity and mortality?
Methods
Yale University’s Human Investigations Committee approved this retrospective cohort study, which used the American College of Surgeons (ACS) National Surgical Quality Improvement Program (NSQIP) database for the period 2005 to 2012. ACS-NSQIP is a prospective, multi-institutional outcomes program that collects data on preoperative comorbidities, intraoperative variables, and 30-day postoperative outcomes for patients undergoing surgical procedures in inpatient and outpatient settings.14
Unlike administrative databases, which are based on reimbursement data, ACS-NSQIP data are collected by trained surgical clinical reviewers for the purposes of quality improvement and clinical research, and data quality is ensured with routine auditing.15 The program has gained a high degree of respect as a powerful and valid data source in both general16 and orthopedic17 surgery literature. The database offers a particular advantage with respect to the study of preoperative pneumonia: Only patients with new or recently diagnosed pneumonia on antibiotic therapy who meet strict criteria for characteristic findings on chest radiography, clinical signs and symptoms of respiratory illness, and positive cultures are coded as having actively treated pneumonia at time of surgery.15
To identify hip fracture patients over the age of 65 years who underwent operative fixation of a hip fracture, we used Current Procedural Terminology (CPT) hip fracture codes, including 27235 (percutaneous screw fixation), 27236 or 27244 (plate-and-screw fixation), and 27245 (intramedullary device), as well as 27125 (hemiarthroplasty) and 27130 (arthroplasty) for patients with a postoperative International Classification of Disease, Ninth Revision (ICD-9) diagnosis code (820.x, 820.2x, or 820.8) consistent with acute hip fracture.18,19 Procedure type, anesthesia type, and delay from admission to surgery were captured for all procedures.
Preoperative demographics included age, sex, transfer origin, functional status, and body mass index (BMI) category. Binary comorbidities were classified as preoperative anemia (hematocrit, <0.41 for men, <0.36 for women), confusion, dyspnea at rest, uremia (blood urea nitrogen, >6.8 mmol/L), history of cardiovascular disease (congestive heart failure, myocardial infarction, percutaneous coronary intervention, angina pectoris, medically treated hypertension, peripheral vascular disease, or resting claudication), chronic obstructive pulmonary disease, diabetes, renal disease (renal failure or dialysis), and cigarette use in preceding 12 months.20,21 Although preoperative hypotension and respiratory rate are often considered in patients with pneumonia, these variables were not available from the ACS-NSQIP data.6,22Pearson χ2 test for categorical variables was used to compare baseline demographics and operative characteristics between patients with and without pneumonia, and Student t test was used to compare intervals from hospital admission to hip fracture surgery, surgery start to surgery stop, and surgery to discharge between patients with and without preoperative pneumonia.
Binary outcome measures were compared between patients with and without preoperative pneumonia. “Any AE” included any serious AE (SAE) or any minor AE. SAEs included death, acute renal failure, ventilator use >48 hours, unplanned intubation, septic shock, sepsis, return to operating room, coma >24 hours, cardiac arrest requiring cardiopulmonary resuscitation, myocardial infarction, thromboembolic event (deep vein thrombosis or pulmonary embolism), and stroke/cerebrovascular accident. Minor AEs included progressive renal insufficiency, urinary tract infection, organ/space infection, superficial surgical-site infection, deep surgical-site infection, and wound dehiscence. Other binary outcome measures included discharge destination and unplanned readmission within 30 days after hip fracture surgery.23Poisson regression with robust error variance as described by Zou24 was used to compare the rates of any, minor, and individual AEs, and any SAEs, between patients with and without pneumonia. Multivariate analysis accounted for the baseline variables in Table 1. AEs that occurred more than once in each group were included in the analyses.
Kaplan-Meier survival analysis was performed for postoperative mortality within 30 days. Within the preoperative pneumonia group, covariates from Table 1 were identified as predictors of any AE, SAE, or death within 30 days after hip fracture surgery by stepwise multivariate Poisson regression with robust error variance. When interval from admission to surgery was longer than 24, 48, 72, or 96 hours, it was also included as a covariate. Variables that did not show an association with AEs at the P < .20 level were not included in the final regression model. All analyses were performed with Stata/SE Version 12.0 statistical software (StataCorp).
Results
Of the 7128 geriatric hip fracture patients in this study, 82 (1.2%) had active pneumonia at time of surgery (Table 1). Age, BMI, preoperative uremia, history of cardiovascular disease, diabetes, renal disease, and smoking were similar between groups. In addition, there was no difference in anesthesia type or fixation procedure between the pneumonia and no-pneumonia groups. Patients with preoperative pneumonia differed significantly with respect to sex, transfer from facility, preoperative functional dependence, anemia, confusion, dyspnea at rest, and history of chronic obstructive pulmonary disease (Table 1).
Interval from admission to surgery was longer (P < .001) for geriatric hip fracture patients with preoperative pneumonia (mean, 6.8 days; 95% CI, 2.5-11.1 days) than for those without pneumonia (mean, 1.5 days; CI, 1.4-1.5 days). There was no difference (P = .124) in operative time between the pneumonia group (mean, 72.8 min; CI, 64.0-81.5 min) and the no-pneumonia group (mean, 66.1 min; CI, 61.2-67.0 min). Interval from surgery to discharge was longer (P < .001) for patients with preoperative pneumonia (mean, 10.1 days; CI, 6.9-13.4 days) than for those without pneumonia (mean, 6.3 days; CI, 6.1-6.4 days).
Adverse outcomes of geriatric hip fracture surgery are listed in Table 2. In the multivariate analysis, preoperative pneumonia was significantly associated with any AE (relative risk [RR]) = 1.44) and any SAE (RR = 1.79). 
Survival patterns diverged between patients with and without preoperative pneumonia (Figure). The unadjusted mortality rate was qualitatively higher in patients with preoperative pneumonia than in patients without pneumonia during the first days after hip fracture (slopes of unadjusted mortality curves in Figure). Of note, no patient under age 75 years with pneumonia at time of surgery died within the 30-day study period.
Among geriatric hip fracture patients with preoperative pneumonia, multivariate analyses revealed no significant association of any preoperative comorbidity with any AE or any SAE. Given the gravity of the death complication, however, death within 30 days after surgery was analyzed separately, and was found to be significantly associated (RR = 4.67) with being underweight (BMI, <18.5 kg/m2) (Table 3). Admission-to-surgery interval longer than 24, 48, 72, or 96 hours did not reach significance at the P < 0.2 level in the stepwise regressions and therefore was not associated with a higher or lower risk of any AE, SAE, or death.
Discussion
In the general US population, pneumonia accounts for 1.4% of deaths in people 65 years to 74 years old, 2.1% in people 75 years to 84 years, and 3.1% in people 85 years or older. In total, 3.4% of hospital inpatient deaths are attributed to pneumonia.25 In hospitalized general orthopedic surgical patients as well as hip fracture patients, pneumonia is strongly associated with increased mortality.26,27
We identified a preoperative pneumonia prevalence of 1.2%, which is comparable to the rates reported in the literature (0.3%-3.2%).1-3 To our knowledge, our study represents the largest series of patients with preoperative pneumonia at time of hip fracture repair, and the first to independently associate preoperative pneumonia with increased incidence of AEs, including death.
This study had its limitations. First, the ACS-NSQIP morbidity and mortality data, which are limited to the first 30 postoperative days, may be skewed because AEs that occurred after that interval are not captured. Second, coding of pneumonia in ACS-NSQIP does not convey specific information about the disease and its severity—infectious organism(s) responsible; acquisition setting (healthcare or community); treatment given, including antibiotic(s) selection, steroid use, dosing, and duration; and measures of treatment efficacy—limiting interpretation of the difference in delay to surgery. We cannot say whether the longer interval in patients with pneumonia reflects medical optimization, or whether the delay itself or any interventions during that time positively or negatively affected outcomes. In addition, despite using a large national database, we obtained a relatively small sample of patients (82) who had pneumonia before surgical hip fracture repair.
Multivariate analysis controlling for baseline demographics and comorbidities revealed that multiple SAEs were independently associated with preoperative pneumonia (overall SAE, RR = 1.79). Postoperative use of ventilator support for longer than 48 hours (RR = 6.48) and coma longer than 24 hours (RR = 7.31) are expected given the severity of pulmonary compromise in the study cohort.28,29 Acute renal failure (RR = 14.61) can occur in both hip fracture patients and community-acquired pneumonia patients and may be a multifactorial complication of the pulmonary infection, of the anesthesia, or of the surgical intervention in this cohort.30-32Unadjusted mortality in hip fracture takes months to a year to normalize to that of age-matched controls.32-34 In our series, the unadjusted death rate in the pneumonia cohort (Figure) was transiently elevated during the first weeks after surgery but then drew nearer the rate in the nondiseased hip fracture cohort by the end of the first month. Early death in the pneumonia group likely was multifactorial, potentially influenced by the increased burden of comorbidities in the pneumonia group at baseline, and the longer delay to surgery,35-38 as well as by the natural history of treated pneumonia in hospital patients, who, compared with age-matched hospitalized controls, also exhibit higher mortality during only the first 2 to 4 months of hospitalization for pneumonia.39 We regret that quality improvement strategies in the treatment of geriatric hip fracture surgery with pneumonia cannot be extrapolated from these results.
Similarly, the utility of BMI <18.5 kg/m2 as an actionable preoperative finding cannot be assessed from these results. However, we propose that underweight geriatric hip fracture patients with pneumonia may benefit from more aggressive preoperative optimization that does not delay surgery. Higher acuity of postoperative care, including more intensive nursing care and early coordination of care with respiratory therapists and medical comanagement teams, may also be beneficial.
Anesthesia type did not differ between patients with and without preoperative pneumonia and was not associated with AEs in patients with preoperative pneumonia. Consistent with our findings, multiple studies have reported no significant differences in short-term outcomes of hip fracture repair between general and spinal anesthesia, though no other study has compared the benefits of general and spinal anesthesia for patients with preoperative pneumonia.40-44 Although spinal anesthesia (relative to general anesthesia) has been reported to have benefits in hip and knee arthroplasty, these benefits appear not to translate to hip fracture repair.45-50 The results of the present study suggest that general and spinal anesthesia may be equivalent in terms of risk for the geriatric hip fracture patient with preoperative pneumonia.43,44Our attempt to evaluate the CURB-65 pneumonia severity score as a prognosticator of AEs was thwarted by the absence of required variables in the ACS-NSQIP dataset (confusion, uremia, dyspnea, and age were available; hypotension and blood pressure were not). In our analysis, we did include, individually, variables previously found to predict AEs in the medical pneumonia population (confusion, uremia, dyspnea at rest, anemia).9-11,32 However, these clinical findings are nonspecific in hip fracture patients, who may become anemic, confused, dyspneic, or uremic from a multitude of factors related to their injury and unrelated to pneumonia, including but not limited to hemorrhage, muscle damage, renal injury, and pulmonary embolism. It is not surprising that confusion, uremia, dyspnea at rest, and anemia were not individually predictive of AEs or death within 30 days after surgery in the cohort of geriatric hip fracture patients with pneumonia.
There is no literature that argues for or against delaying hip fracture surgery in geriatric hip fracture patients with pneumonia. The surgical delay observed in this population is ostensibly related to medical optimization of the pneumonia and/or underlying comorbidities. However, we did not find a morbidity or mortality detriment or benefit in delaying surgery by 1 to 4 days in this population. Delay of surgery is a poor covariate, given extensive confounding by medical management and preoperative optimizing of comorbid conditions (reflected in our independent variable and covariates) as well as institutional and surgeon variations in policy and behavior and other unaccounted influences. Although some authors have found no difference in mortality or major AEs between hip fracture patients who had a surgical delay and those who did not,31,51-53 other series and meta-analyses have suggested a mortality detriment in a surgical delay of more than 2 days36,54 or 4 days55 from admission. Given our data, we cannot recommend against immediate hip fracture repair in the subpopulation of geriatric hip fracture patients with pneumonia.
Our study findings suggest that preoperative pneumonia is a rare independent risk factor for AEs after hip fracture surgery in geriatric patients. Underweight BMI is predictive of death in geriatric hip fracture surgery patients who present with pneumonia, whereas early surgical repair appears not to be associated with adverse outcomes. Further investigation is warranted to determine if such patients benefit from specific preoperative and postoperative strategies for optimizing medical and surgical care based on these findings.
Am J Orthop. 2017;46(3):E177-E185. Copyright Frontline Medical Communications Inc. 2017. All rights reserved.
1. Sexson SB, Lehner JT. Factors affecting hip fracture mortality. J Orthop Trauma. 1987;1(4):298-305.
2. Mullen JO, Mullen NL. Hip fracture mortality: a prospective, multifactorial study to predict and minimize death risk. Clin Orthop Relat Res. 1992;(280):214-222.
3. Kenzora JE, McCarthy RE, Lowell JD, Sledge CB. Hip fracture mortality. Relation to age, treatment, preoperative illness, time of surgery, and complications. Clin Orthop Relat Res. 1984;(186):45-56.
4. Auron-Gomez M, Michota F. Medical management of hip fracture. Clin Geriatr Med. 2008;24(4):701-719.
5. Bohl DD, Basques BA, Golinvaux NS, Baumgaertner MR, Grauer JN. Nationwide Inpatient Sample and National Surgical Quality Improvement Program give different results in hip fracture studies. Clin Orthop Relat Res. 2014;472(6):1672-1680.
6. Lim WS, van der Eerden MM, Laing R, et al. Defining community acquired pneumonia severity on presentation to hospital: an international derivation and validation study. Thorax. 2003;58(5):377-382.
7. Myint PK, Kamath AV, Vowler SL, Maisey DN, Harrison BDW. The CURB (confusion, urea, respiratory rate and blood pressure) criteria in community-acquired pneumonia (CAP) in hospitalised elderly patients aged 65 years and over: a prospective observational cohort study. Age Ageing. 2005;34(1):75-77.
8. Wilkinson M, Woodhead MA. Guidelines for community-acquired pneumonia in the ICU. Curr Opin Crit Care. 2004;10(1):59-64.
9. Buising K, Thursky K, Black J, et al. A prospective comparison of severity scores for identifying patients with severe community acquired pneumonia: reconsidering what is meant by severe pneumonia. Thorax. 2006;61(5):419-424.
10. Ewig S, De Roux A, Bauer T, et al. Validation of predictive rules and indices of severity for community acquired pneumonia. Thorax. 2004;59(5):421-427.
11. Yandiola PP, Capelastegui A, Quintana J, et al. Prospective comparison of severity scores for predicting clinically relevant outcomes for patients hospitalized with community-acquired pneumonia. Chest. 2009;135(6):1572-1579.
12. Lim WS, Lewis S, Macfarlane JT. Severity prediction rules in community acquired pneumonia: a validation study. Thorax. 2000;55(3):219-223.
13. Bauer TT, Ewig S, Marre R, Suttorp N, Welte T; CAPNETZ Study Group. CRB‐65 predicts death from community‐acquired pneumonia. J Intern Med. 2006;260(1):93-101.
14. Khuri SF. The NSQIP: a new frontier in surgery. Surgery. 2005;138(5):837-843.
15. American College of Surgeons. User Guide for the 2012 ACS NSQIP Participant Use Data File: American College of Surgeons National Surgical Quality Improvement Program. https://www.facs.org/~/media/files/quality%20programs/nsqip/ug12.ashx. Published October 2013. Accessed October 8, 2014.
16. Ingraham AM, Richards KE, Hall BL, Ko CY. Quality improvement in surgery: the American College of Surgeons National Surgical Quality Improvement Program approach. Adv Surg. 2010;44(1):251-267.
17. Schilling PL, Hallstrom BR, Birkmeyer JD, Carpenter JE. Prioritizing perioperative quality improvement in orthopaedic surgery. J Bone Joint Surg Am. 2010;92(9):1884-1889.
18. Radcliff TA, Henderson WG, Stoner TJ, Khuri SF, Dohm M, Hutt E. Patient risk factors, operative care, and outcomes among older community-dwelling male veterans with hip fracture. J Bone Joint Surg Am. 2008;90(1):34-42.
19. Katzan I, Cebul R, Husak S, Dawson N, Baker D. The effect of pneumonia on mortality among patients hospitalized for acute stroke. Neurology. 2003;60(4):620-625.
20. Fisher MA, Matthei JD, Obirieze A, et al. Open reduction internal fixation versus hemiarthroplasty versus total hip arthroplasty in the elderly: a review of the National Surgical Quality Improvement Program database. J Surg Res. 2013;181(2):193-198.
21. Pugely AJ, Martin CT, Gao Y, Klocke NF, Callaghan JJ, Marsh JL. A risk calculator for short-term morbidity and mortality after hip fracture surgery. J Orthop Trauma. 2014;28(2):63-69.
22. Fine MJ, Smith MA, Carson CA, et al. Prognosis and outcomes of patients with community-acquired pneumonia: a meta-analysis. JAMA. 1996;275(2):134-141.
23. Donegan DJ, Gay AN, Baldwin K, Morales EE, Esterhai JL Jr, Mehta S. Use of medical comorbidities to predict complications after hip fracture surgery in the elderly. J Bone Joint Surg Am. 2010;92(4):807-813.
24. Zou G. A modified poisson regression approach to prospective studies with binary data. Am J Epidemiol. 2004:159(7):702-706.
25. Murphy SL, Xu J, Kochanek KD. Deaths: final data for 2010. Natl Vital Stat Rep. 20138;61(4):1-117.
26. Bhattacharyya T, Iorio R, Healy WL. Rate of and risk factors for acute inpatient mortality after orthopaedic surgery. J Bone Joint Surg Am. 2002;84(4):562-572.
27. Myers AH, Robinson EG, Van Natta ML, Michelson JD, Collins K, Baker SP. Hip fractures among the elderly: factors associated with in-hospital mortality. Am J Epidemiol. 1991;134(10):1128-1137.
28. Mandell LA, Wunderink RG, Anzueto A, et al; Infectious Diseases Society of America; American Thoracic Society. Infectious Diseases Society of America/American Thoracic Society consensus guidelines on the management of community-acquired pneumonia in adults. Clin Infect Dis. 2007;44(suppl 2):S27-S72.
29. Leroy O, Santre C, Beuscart C, et al. A five-year study of severe community-acquired pneumonia with emphasis on prognosis in patients admitted to an intensive care unit. Intensive Care Med. 1995;21(1):24-31.
30. Urwin S, Parker M, Griffiths R. General versus regional anaesthesia for hip fracture surgery: a meta-analysis of randomized trials. Br J Anaesth. 2000;84(4):450-455.
31. Orosz GM, Magaziner J, Hannan EL, et al. Association of timing of surgery for hip fracture and patient outcomes. JAMA. 2004;291(14):1738-1743.
32. Niederman MS, Mandell LA, Anzueto A, et al; American Thoracic Society. Guidelines for the management of adults with community-acquired pneumonia: diagnosis, assessment of severity, antimicrobial therapy, and prevention. Am J Respir Crit Care Med. 2001;163(7):1730-1754.
33. Koval KJ, Skovron ML, Aharonoff GB, Zuckerman JD. Predictors of functional recovery after hip fracture in the elderly. Clin Orthop Relat Res. 1998;(348):22-28.
34. Doruk H, Mas MR, Yildiz C, Sonmez A, Kýrdemir V. The effect of the timing of hip fracture surgery on the activity of daily living and mortality in elderly. Arch Gerontol Geriatr. 2004;39(2):179-185.
35. George GH, Patel S. Secondary prevention of hip fracture. Rheumatology. 2000;39(4):346-349.
36. Bottle A, Aylin P. Mortality associated with delay in operation after hip fracture: observational study. BMJ. 2006;332(7547):947-951.
37. Grimes JP, Gregory PM, Noveck H, Butler MS, Carson JL. The effects of time-to-surgery on mortality and morbidity in patients following hip fracture. Am J Med. 2002;112(9):702-709.
38. Simunovic N, Devereaux P, Sprague S, et al. Effect of early surgery after hip fracture on mortality and complications: systematic review and meta-analysis. CMAJ. 2010;182(15):1609-1616.
39. Kaplan V, Clermont G, Griffin MF, et al. Pneumonia: still the old man’s friend? Arch Intern Med. 2003;163(3):317-323.
40. Parker MJ, Handoll HH, Griffiths R. Anaesthesia for hip fracture surgery in adults. Cochrane Database Syst Rev. 2004;(4):CD000521.
41. Chakladar A, White SM. Cost estimates of spinal versus general anaesthesia for fractured neck of femur surgery. Anaesthesia. 2010;65(8):810-814.
42. White SM, Moppett IK, Griffiths R. Outcome by mode of anaesthesia for hip fracture surgery. An observational audit of 65 535 patients in a national dataset. Anaesthesia. 2014;69(3):224-230.
43. Gilbert TB, Hawkes WG, Hebel JR, et al. Spinal anesthesia versus general anesthesia for hip fracture repair: a longitudinal observation of 741 elderly patients during 2-year follow-up. Am J Orthop. 2000;29(1):25-35.
44. O’Hara DA, Duff A, Berlin JA, et al. The effect of anesthetic technique on postoperative outcomes in hip fracture repair. Anesthesiology. 2000;92(4):947-957.
45. Hole A, Terjesen T, Breivik H. Epidural versus general anaesthesia for total hip arthroplasty in elderly patients. Acta Anaesthesiol Scand. 1980;24(4):279-287.
46. Rashiq S, Finegan BA. The effect of spinal anesthesia on blood transfusion rate in total joint arthroplasty. Can J Surg. 2006;49(6):391-396.
47. Chang CC, Lin HC, Lin HW, Lin HC. Anesthetic management and surgical site infections in total hip or knee replacement: a population-based study. Anesthesiology. 2010;113(2):279-284.
48. Mauermann WJ, Shilling AM, Zuo Z. A comparison of neuraxial block versus general anesthesia for elective total hip replacement: a meta-analysis. Anesth Analg. 2006;103(4):1018-1025.
49. Hu S, Zhang ZY, Hua YQ, Li J, Cai ZD. A comparison of regional and general anaesthesia for total replacement of the hip or knee: a meta-analysis. J Bone Joint Surg Br. 2009;91(7):935-942.
50. Pugely AJ, Martin CT, Gao Y, Mendoza-Lattes S, Callaghan JJ. Differences in short-term complications between spinal and general anesthesia for primary total knee arthroplasty. J Bone Joint Surg Am. 2013;95(3):193-199.
51. Khan SK, Kalra S, Khanna A, Thiruvengada MM, Parker MJ. Timing of surgery for hip fractures: a systematic review of 52 published studies involving 291,413 patients. Injury. 2009;40(7):692-697.
52. Majumdar SR, Beaupre LA, Johnston DW, Dick DA, Cinats JG, Jiang HX. Lack of association between mortality and timing of surgical fixation in elderly patients with hip fracture: results of a retrospective population-based cohort study. Med Care. 2006;44(6):552-559.
53. Moran CG, Wenn RT, Sikand M, Taylor AM. Early mortality after hip fracture: is delay before surgery important? J Bone Joint Surg Am. 2005;87(3):483-489.
54. Shiga T, Wajima Zi, Ohe Y. Is operative delay associated with increased mortality of hip fracture patients? Systematic review, meta-analysis, and meta-regression. Can J Anesth. 2008;55(3):146-154.
55. Streubel P, Ricci W, Wong A, Gardner M. Mortality after distal femur fractures in elderly patients. Clin Orthop Relat Res. 2011;469(4):1188-1196.
Take-Home Points
- The prevalence of preoperative pneumonia is 1.2% among hip fracture patients aged >65 years.
- Preoperative pneumonia is an independent risk factor for mortality and adverse events including renal failure, prolonged ventilator dependence, and prolonged altered mental status after geriatric hip fracture surgery.
- Underweight BMI (<18.5 kg/m2) was associated with higher mortality within 30 days among hip fracture patients admitted with pneumonia.
- The mortality rate normalized to that of patients without pneumonia within 2 weeks of hip fracture surgery.
- Time from admission to surgery was not associated with adverse events or mortality among hip fracture patients admitted with pneumonia.
Preoperative pneumonia remains relatively unexplored as a risk factor for adverse outcomes in geriatric hip fracture surgery. Dated studies report a 0.3% to 3.2% prevalence of “recent pneumonia” in patients presenting with hip fracture but provide neither a definition of pneumonia based on clinical criteria nor a subset analysis of outcomes in the pneumonia group.1-3 Although active pneumonia has been identified as a preoperative optimization target in the management guidelines for geriatric hip fracture,4 we are unaware of any studies that have reported on differences in demographics, comorbidities, delay to surgery, or adverse outcomes between hip fracture patients with and without preoperative pneumonia.
This paucity of information on the effect of preoperative pneumonia in the hip fracture population may be related to low prevalence of preoperative pneumonia and a cadre of variable definitions, which limit identification of a cohort of patients with preoperative pneumonia large enough from which to draw meaningful results. Database studies, especially those using surgical registries rather than administrative or reimbursement data, offer particular advantages for investigation of such rare clinical entities.5Medical care of patients with pneumonia alone is known to be facilitated by assessments of mortality risk from clinical and laboratory data. The modified British Thoracic Society rule/CURB-65 (confusion, urea, respiratory rate, blood pressure) score is strongly predictive of mortality in hospitalized adults with pneumonia (odds ratio [OR], 4.59; 95% confidence interval [CI], 1.42-14.85; P = .011) and may guide antibiotic therapy, laboratory investigations, and the decision to intubate in a patient with pneumonia.6-8 This score is predictive of adverse events (AEs), hospital length of stay, and use of intensive care services.6,7,9-13 We hypothesized that preoperative clinical indicators assessed by pneumonia severity scores as well as patient demographics and baseline comorbidities may also have prognostic value for risk of AEs in a cohort of geriatric hip fracture surgery patients with preoperative pneumonia.
In this article, we first describe the prevalence of preoperative pneumonia in geriatric hip fracture surgery patients as well as demographic and operative differences between patients with and without the disease. We then ask 3 questions: Is preoperative pneumonia an independent risk factor for mortality and adverse outcomes in geriatric hip fracture surgery? Is there a postoperative interval during which the unadjusted mortality rate is higher among patients with preoperative pneumonia? In patients with preoperative pneumonia, what are the predictors of morbidity and mortality?
Methods
Yale University’s Human Investigations Committee approved this retrospective cohort study, which used the American College of Surgeons (ACS) National Surgical Quality Improvement Program (NSQIP) database for the period 2005 to 2012. ACS-NSQIP is a prospective, multi-institutional outcomes program that collects data on preoperative comorbidities, intraoperative variables, and 30-day postoperative outcomes for patients undergoing surgical procedures in inpatient and outpatient settings.14
Unlike administrative databases, which are based on reimbursement data, ACS-NSQIP data are collected by trained surgical clinical reviewers for the purposes of quality improvement and clinical research, and data quality is ensured with routine auditing.15 The program has gained a high degree of respect as a powerful and valid data source in both general16 and orthopedic17 surgery literature. The database offers a particular advantage with respect to the study of preoperative pneumonia: Only patients with new or recently diagnosed pneumonia on antibiotic therapy who meet strict criteria for characteristic findings on chest radiography, clinical signs and symptoms of respiratory illness, and positive cultures are coded as having actively treated pneumonia at time of surgery.15
To identify hip fracture patients over the age of 65 years who underwent operative fixation of a hip fracture, we used Current Procedural Terminology (CPT) hip fracture codes, including 27235 (percutaneous screw fixation), 27236 or 27244 (plate-and-screw fixation), and 27245 (intramedullary device), as well as 27125 (hemiarthroplasty) and 27130 (arthroplasty) for patients with a postoperative International Classification of Disease, Ninth Revision (ICD-9) diagnosis code (820.x, 820.2x, or 820.8) consistent with acute hip fracture.18,19 Procedure type, anesthesia type, and delay from admission to surgery were captured for all procedures.
Preoperative demographics included age, sex, transfer origin, functional status, and body mass index (BMI) category. Binary comorbidities were classified as preoperative anemia (hematocrit, <0.41 for men, <0.36 for women), confusion, dyspnea at rest, uremia (blood urea nitrogen, >6.8 mmol/L), history of cardiovascular disease (congestive heart failure, myocardial infarction, percutaneous coronary intervention, angina pectoris, medically treated hypertension, peripheral vascular disease, or resting claudication), chronic obstructive pulmonary disease, diabetes, renal disease (renal failure or dialysis), and cigarette use in preceding 12 months.20,21 Although preoperative hypotension and respiratory rate are often considered in patients with pneumonia, these variables were not available from the ACS-NSQIP data.6,22Pearson χ2 test for categorical variables was used to compare baseline demographics and operative characteristics between patients with and without pneumonia, and Student t test was used to compare intervals from hospital admission to hip fracture surgery, surgery start to surgery stop, and surgery to discharge between patients with and without preoperative pneumonia.
Binary outcome measures were compared between patients with and without preoperative pneumonia. “Any AE” included any serious AE (SAE) or any minor AE. SAEs included death, acute renal failure, ventilator use >48 hours, unplanned intubation, septic shock, sepsis, return to operating room, coma >24 hours, cardiac arrest requiring cardiopulmonary resuscitation, myocardial infarction, thromboembolic event (deep vein thrombosis or pulmonary embolism), and stroke/cerebrovascular accident. Minor AEs included progressive renal insufficiency, urinary tract infection, organ/space infection, superficial surgical-site infection, deep surgical-site infection, and wound dehiscence. Other binary outcome measures included discharge destination and unplanned readmission within 30 days after hip fracture surgery.23Poisson regression with robust error variance as described by Zou24 was used to compare the rates of any, minor, and individual AEs, and any SAEs, between patients with and without pneumonia. Multivariate analysis accounted for the baseline variables in Table 1. AEs that occurred more than once in each group were included in the analyses.
Kaplan-Meier survival analysis was performed for postoperative mortality within 30 days. Within the preoperative pneumonia group, covariates from Table 1 were identified as predictors of any AE, SAE, or death within 30 days after hip fracture surgery by stepwise multivariate Poisson regression with robust error variance. When interval from admission to surgery was longer than 24, 48, 72, or 96 hours, it was also included as a covariate. Variables that did not show an association with AEs at the P < .20 level were not included in the final regression model. All analyses were performed with Stata/SE Version 12.0 statistical software (StataCorp).
Results
Of the 7128 geriatric hip fracture patients in this study, 82 (1.2%) had active pneumonia at time of surgery (Table 1). Age, BMI, preoperative uremia, history of cardiovascular disease, diabetes, renal disease, and smoking were similar between groups. In addition, there was no difference in anesthesia type or fixation procedure between the pneumonia and no-pneumonia groups. Patients with preoperative pneumonia differed significantly with respect to sex, transfer from facility, preoperative functional dependence, anemia, confusion, dyspnea at rest, and history of chronic obstructive pulmonary disease (Table 1).
Interval from admission to surgery was longer (P < .001) for geriatric hip fracture patients with preoperative pneumonia (mean, 6.8 days; 95% CI, 2.5-11.1 days) than for those without pneumonia (mean, 1.5 days; CI, 1.4-1.5 days). There was no difference (P = .124) in operative time between the pneumonia group (mean, 72.8 min; CI, 64.0-81.5 min) and the no-pneumonia group (mean, 66.1 min; CI, 61.2-67.0 min). Interval from surgery to discharge was longer (P < .001) for patients with preoperative pneumonia (mean, 10.1 days; CI, 6.9-13.4 days) than for those without pneumonia (mean, 6.3 days; CI, 6.1-6.4 days).
Adverse outcomes of geriatric hip fracture surgery are listed in Table 2. In the multivariate analysis, preoperative pneumonia was significantly associated with any AE (relative risk [RR]) = 1.44) and any SAE (RR = 1.79).
Survival patterns diverged between patients with and without preoperative pneumonia (Figure). The unadjusted mortality rate was qualitatively higher in patients with preoperative pneumonia than in patients without pneumonia during the first days after hip fracture (slopes of unadjusted mortality curves in Figure). Of note, no patient under age 75 years with pneumonia at time of surgery died within the 30-day study period.
Among geriatric hip fracture patients with preoperative pneumonia, multivariate analyses revealed no significant association of any preoperative comorbidity with any AE or any SAE. Given the gravity of the death complication, however, death within 30 days after surgery was analyzed separately, and was found to be significantly associated (RR = 4.67) with being underweight (BMI, <18.5 kg/m2) (Table 3). Admission-to-surgery interval longer than 24, 48, 72, or 96 hours did not reach significance at the P < 0.2 level in the stepwise regressions and therefore was not associated with a higher or lower risk of any AE, SAE, or death.
Discussion
In the general US population, pneumonia accounts for 1.4% of deaths in people 65 years to 74 years old, 2.1% in people 75 years to 84 years, and 3.1% in people 85 years or older. In total, 3.4% of hospital inpatient deaths are attributed to pneumonia.25 In hospitalized general orthopedic surgical patients as well as hip fracture patients, pneumonia is strongly associated with increased mortality.26,27
We identified a preoperative pneumonia prevalence of 1.2%, which is comparable to the rates reported in the literature (0.3%-3.2%).1-3 To our knowledge, our study represents the largest series of patients with preoperative pneumonia at time of hip fracture repair, and the first to independently associate preoperative pneumonia with increased incidence of AEs, including death.
This study had its limitations. First, the ACS-NSQIP morbidity and mortality data, which are limited to the first 30 postoperative days, may be skewed because AEs that occurred after that interval are not captured. Second, coding of pneumonia in ACS-NSQIP does not convey specific information about the disease and its severity—infectious organism(s) responsible; acquisition setting (healthcare or community); treatment given, including antibiotic(s) selection, steroid use, dosing, and duration; and measures of treatment efficacy—limiting interpretation of the difference in delay to surgery. We cannot say whether the longer interval in patients with pneumonia reflects medical optimization, or whether the delay itself or any interventions during that time positively or negatively affected outcomes. In addition, despite using a large national database, we obtained a relatively small sample of patients (82) who had pneumonia before surgical hip fracture repair.
Multivariate analysis controlling for baseline demographics and comorbidities revealed that multiple SAEs were independently associated with preoperative pneumonia (overall SAE, RR = 1.79). Postoperative use of ventilator support for longer than 48 hours (RR = 6.48) and coma longer than 24 hours (RR = 7.31) are expected given the severity of pulmonary compromise in the study cohort.28,29 Acute renal failure (RR = 14.61) can occur in both hip fracture patients and community-acquired pneumonia patients and may be a multifactorial complication of the pulmonary infection, of the anesthesia, or of the surgical intervention in this cohort.30-32Unadjusted mortality in hip fracture takes months to a year to normalize to that of age-matched controls.32-34 In our series, the unadjusted death rate in the pneumonia cohort (Figure) was transiently elevated during the first weeks after surgery but then drew nearer the rate in the nondiseased hip fracture cohort by the end of the first month. Early death in the pneumonia group likely was multifactorial, potentially influenced by the increased burden of comorbidities in the pneumonia group at baseline, and the longer delay to surgery,35-38 as well as by the natural history of treated pneumonia in hospital patients, who, compared with age-matched hospitalized controls, also exhibit higher mortality during only the first 2 to 4 months of hospitalization for pneumonia.39 We regret that quality improvement strategies in the treatment of geriatric hip fracture surgery with pneumonia cannot be extrapolated from these results.
Similarly, the utility of BMI <18.5 kg/m2 as an actionable preoperative finding cannot be assessed from these results. However, we propose that underweight geriatric hip fracture patients with pneumonia may benefit from more aggressive preoperative optimization that does not delay surgery. Higher acuity of postoperative care, including more intensive nursing care and early coordination of care with respiratory therapists and medical comanagement teams, may also be beneficial.
Anesthesia type did not differ between patients with and without preoperative pneumonia and was not associated with AEs in patients with preoperative pneumonia. Consistent with our findings, multiple studies have reported no significant differences in short-term outcomes of hip fracture repair between general and spinal anesthesia, though no other study has compared the benefits of general and spinal anesthesia for patients with preoperative pneumonia.40-44 Although spinal anesthesia (relative to general anesthesia) has been reported to have benefits in hip and knee arthroplasty, these benefits appear not to translate to hip fracture repair.45-50 The results of the present study suggest that general and spinal anesthesia may be equivalent in terms of risk for the geriatric hip fracture patient with preoperative pneumonia.43,44Our attempt to evaluate the CURB-65 pneumonia severity score as a prognosticator of AEs was thwarted by the absence of required variables in the ACS-NSQIP dataset (confusion, uremia, dyspnea, and age were available; hypotension and blood pressure were not). In our analysis, we did include, individually, variables previously found to predict AEs in the medical pneumonia population (confusion, uremia, dyspnea at rest, anemia).9-11,32 However, these clinical findings are nonspecific in hip fracture patients, who may become anemic, confused, dyspneic, or uremic from a multitude of factors related to their injury and unrelated to pneumonia, including but not limited to hemorrhage, muscle damage, renal injury, and pulmonary embolism. It is not surprising that confusion, uremia, dyspnea at rest, and anemia were not individually predictive of AEs or death within 30 days after surgery in the cohort of geriatric hip fracture patients with pneumonia.
There is no literature that argues for or against delaying hip fracture surgery in geriatric hip fracture patients with pneumonia. The surgical delay observed in this population is ostensibly related to medical optimization of the pneumonia and/or underlying comorbidities. However, we did not find a morbidity or mortality detriment or benefit in delaying surgery by 1 to 4 days in this population. Delay of surgery is a poor covariate, given extensive confounding by medical management and preoperative optimizing of comorbid conditions (reflected in our independent variable and covariates) as well as institutional and surgeon variations in policy and behavior and other unaccounted influences. Although some authors have found no difference in mortality or major AEs between hip fracture patients who had a surgical delay and those who did not,31,51-53 other series and meta-analyses have suggested a mortality detriment in a surgical delay of more than 2 days36,54 or 4 days55 from admission. Given our data, we cannot recommend against immediate hip fracture repair in the subpopulation of geriatric hip fracture patients with pneumonia.
Our study findings suggest that preoperative pneumonia is a rare independent risk factor for AEs after hip fracture surgery in geriatric patients. Underweight BMI is predictive of death in geriatric hip fracture surgery patients who present with pneumonia, whereas early surgical repair appears not to be associated with adverse outcomes. Further investigation is warranted to determine if such patients benefit from specific preoperative and postoperative strategies for optimizing medical and surgical care based on these findings.
Am J Orthop. 2017;46(3):E177-E185. Copyright Frontline Medical Communications Inc. 2017. All rights reserved.
1. Sexson SB, Lehner JT. Factors affecting hip fracture mortality. J Orthop Trauma. 1987;1(4):298-305.
2. Mullen JO, Mullen NL. Hip fracture mortality: a prospective, multifactorial study to predict and minimize death risk. Clin Orthop Relat Res. 1992;(280):214-222.
3. Kenzora JE, McCarthy RE, Lowell JD, Sledge CB. Hip fracture mortality. Relation to age, treatment, preoperative illness, time of surgery, and complications. Clin Orthop Relat Res. 1984;(186):45-56.
4. Auron-Gomez M, Michota F. Medical management of hip fracture. Clin Geriatr Med. 2008;24(4):701-719.
5. Bohl DD, Basques BA, Golinvaux NS, Baumgaertner MR, Grauer JN. Nationwide Inpatient Sample and National Surgical Quality Improvement Program give different results in hip fracture studies. Clin Orthop Relat Res. 2014;472(6):1672-1680.
6. Lim WS, van der Eerden MM, Laing R, et al. Defining community acquired pneumonia severity on presentation to hospital: an international derivation and validation study. Thorax. 2003;58(5):377-382.
7. Myint PK, Kamath AV, Vowler SL, Maisey DN, Harrison BDW. The CURB (confusion, urea, respiratory rate and blood pressure) criteria in community-acquired pneumonia (CAP) in hospitalised elderly patients aged 65 years and over: a prospective observational cohort study. Age Ageing. 2005;34(1):75-77.
8. Wilkinson M, Woodhead MA. Guidelines for community-acquired pneumonia in the ICU. Curr Opin Crit Care. 2004;10(1):59-64.
9. Buising K, Thursky K, Black J, et al. A prospective comparison of severity scores for identifying patients with severe community acquired pneumonia: reconsidering what is meant by severe pneumonia. Thorax. 2006;61(5):419-424.
10. Ewig S, De Roux A, Bauer T, et al. Validation of predictive rules and indices of severity for community acquired pneumonia. Thorax. 2004;59(5):421-427.
11. Yandiola PP, Capelastegui A, Quintana J, et al. Prospective comparison of severity scores for predicting clinically relevant outcomes for patients hospitalized with community-acquired pneumonia. Chest. 2009;135(6):1572-1579.
12. Lim WS, Lewis S, Macfarlane JT. Severity prediction rules in community acquired pneumonia: a validation study. Thorax. 2000;55(3):219-223.
13. Bauer TT, Ewig S, Marre R, Suttorp N, Welte T; CAPNETZ Study Group. CRB‐65 predicts death from community‐acquired pneumonia. J Intern Med. 2006;260(1):93-101.
14. Khuri SF. The NSQIP: a new frontier in surgery. Surgery. 2005;138(5):837-843.
15. American College of Surgeons. User Guide for the 2012 ACS NSQIP Participant Use Data File: American College of Surgeons National Surgical Quality Improvement Program. https://www.facs.org/~/media/files/quality%20programs/nsqip/ug12.ashx. Published October 2013. Accessed October 8, 2014.
16. Ingraham AM, Richards KE, Hall BL, Ko CY. Quality improvement in surgery: the American College of Surgeons National Surgical Quality Improvement Program approach. Adv Surg. 2010;44(1):251-267.
17. Schilling PL, Hallstrom BR, Birkmeyer JD, Carpenter JE. Prioritizing perioperative quality improvement in orthopaedic surgery. J Bone Joint Surg Am. 2010;92(9):1884-1889.
18. Radcliff TA, Henderson WG, Stoner TJ, Khuri SF, Dohm M, Hutt E. Patient risk factors, operative care, and outcomes among older community-dwelling male veterans with hip fracture. J Bone Joint Surg Am. 2008;90(1):34-42.
19. Katzan I, Cebul R, Husak S, Dawson N, Baker D. The effect of pneumonia on mortality among patients hospitalized for acute stroke. Neurology. 2003;60(4):620-625.
20. Fisher MA, Matthei JD, Obirieze A, et al. Open reduction internal fixation versus hemiarthroplasty versus total hip arthroplasty in the elderly: a review of the National Surgical Quality Improvement Program database. J Surg Res. 2013;181(2):193-198.
21. Pugely AJ, Martin CT, Gao Y, Klocke NF, Callaghan JJ, Marsh JL. A risk calculator for short-term morbidity and mortality after hip fracture surgery. J Orthop Trauma. 2014;28(2):63-69.
22. Fine MJ, Smith MA, Carson CA, et al. Prognosis and outcomes of patients with community-acquired pneumonia: a meta-analysis. JAMA. 1996;275(2):134-141.
23. Donegan DJ, Gay AN, Baldwin K, Morales EE, Esterhai JL Jr, Mehta S. Use of medical comorbidities to predict complications after hip fracture surgery in the elderly. J Bone Joint Surg Am. 2010;92(4):807-813.
24. Zou G. A modified poisson regression approach to prospective studies with binary data. Am J Epidemiol. 2004:159(7):702-706.
25. Murphy SL, Xu J, Kochanek KD. Deaths: final data for 2010. Natl Vital Stat Rep. 20138;61(4):1-117.
26. Bhattacharyya T, Iorio R, Healy WL. Rate of and risk factors for acute inpatient mortality after orthopaedic surgery. J Bone Joint Surg Am. 2002;84(4):562-572.
27. Myers AH, Robinson EG, Van Natta ML, Michelson JD, Collins K, Baker SP. Hip fractures among the elderly: factors associated with in-hospital mortality. Am J Epidemiol. 1991;134(10):1128-1137.
28. Mandell LA, Wunderink RG, Anzueto A, et al; Infectious Diseases Society of America; American Thoracic Society. Infectious Diseases Society of America/American Thoracic Society consensus guidelines on the management of community-acquired pneumonia in adults. Clin Infect Dis. 2007;44(suppl 2):S27-S72.
29. Leroy O, Santre C, Beuscart C, et al. A five-year study of severe community-acquired pneumonia with emphasis on prognosis in patients admitted to an intensive care unit. Intensive Care Med. 1995;21(1):24-31.
30. Urwin S, Parker M, Griffiths R. General versus regional anaesthesia for hip fracture surgery: a meta-analysis of randomized trials. Br J Anaesth. 2000;84(4):450-455.
31. Orosz GM, Magaziner J, Hannan EL, et al. Association of timing of surgery for hip fracture and patient outcomes. JAMA. 2004;291(14):1738-1743.
32. Niederman MS, Mandell LA, Anzueto A, et al; American Thoracic Society. Guidelines for the management of adults with community-acquired pneumonia: diagnosis, assessment of severity, antimicrobial therapy, and prevention. Am J Respir Crit Care Med. 2001;163(7):1730-1754.
33. Koval KJ, Skovron ML, Aharonoff GB, Zuckerman JD. Predictors of functional recovery after hip fracture in the elderly. Clin Orthop Relat Res. 1998;(348):22-28.
34. Doruk H, Mas MR, Yildiz C, Sonmez A, Kýrdemir V. The effect of the timing of hip fracture surgery on the activity of daily living and mortality in elderly. Arch Gerontol Geriatr. 2004;39(2):179-185.
35. George GH, Patel S. Secondary prevention of hip fracture. Rheumatology. 2000;39(4):346-349.
36. Bottle A, Aylin P. Mortality associated with delay in operation after hip fracture: observational study. BMJ. 2006;332(7547):947-951.
37. Grimes JP, Gregory PM, Noveck H, Butler MS, Carson JL. The effects of time-to-surgery on mortality and morbidity in patients following hip fracture. Am J Med. 2002;112(9):702-709.
38. Simunovic N, Devereaux P, Sprague S, et al. Effect of early surgery after hip fracture on mortality and complications: systematic review and meta-analysis. CMAJ. 2010;182(15):1609-1616.
39. Kaplan V, Clermont G, Griffin MF, et al. Pneumonia: still the old man’s friend? Arch Intern Med. 2003;163(3):317-323.
40. Parker MJ, Handoll HH, Griffiths R. Anaesthesia for hip fracture surgery in adults. Cochrane Database Syst Rev. 2004;(4):CD000521.
41. Chakladar A, White SM. Cost estimates of spinal versus general anaesthesia for fractured neck of femur surgery. Anaesthesia. 2010;65(8):810-814.
42. White SM, Moppett IK, Griffiths R. Outcome by mode of anaesthesia for hip fracture surgery. An observational audit of 65 535 patients in a national dataset. Anaesthesia. 2014;69(3):224-230.
43. Gilbert TB, Hawkes WG, Hebel JR, et al. Spinal anesthesia versus general anesthesia for hip fracture repair: a longitudinal observation of 741 elderly patients during 2-year follow-up. Am J Orthop. 2000;29(1):25-35.
44. O’Hara DA, Duff A, Berlin JA, et al. The effect of anesthetic technique on postoperative outcomes in hip fracture repair. Anesthesiology. 2000;92(4):947-957.
45. Hole A, Terjesen T, Breivik H. Epidural versus general anaesthesia for total hip arthroplasty in elderly patients. Acta Anaesthesiol Scand. 1980;24(4):279-287.
46. Rashiq S, Finegan BA. The effect of spinal anesthesia on blood transfusion rate in total joint arthroplasty. Can J Surg. 2006;49(6):391-396.
47. Chang CC, Lin HC, Lin HW, Lin HC. Anesthetic management and surgical site infections in total hip or knee replacement: a population-based study. Anesthesiology. 2010;113(2):279-284.
48. Mauermann WJ, Shilling AM, Zuo Z. A comparison of neuraxial block versus general anesthesia for elective total hip replacement: a meta-analysis. Anesth Analg. 2006;103(4):1018-1025.
49. Hu S, Zhang ZY, Hua YQ, Li J, Cai ZD. A comparison of regional and general anaesthesia for total replacement of the hip or knee: a meta-analysis. J Bone Joint Surg Br. 2009;91(7):935-942.
50. Pugely AJ, Martin CT, Gao Y, Mendoza-Lattes S, Callaghan JJ. Differences in short-term complications between spinal and general anesthesia for primary total knee arthroplasty. J Bone Joint Surg Am. 2013;95(3):193-199.
51. Khan SK, Kalra S, Khanna A, Thiruvengada MM, Parker MJ. Timing of surgery for hip fractures: a systematic review of 52 published studies involving 291,413 patients. Injury. 2009;40(7):692-697.
52. Majumdar SR, Beaupre LA, Johnston DW, Dick DA, Cinats JG, Jiang HX. Lack of association between mortality and timing of surgical fixation in elderly patients with hip fracture: results of a retrospective population-based cohort study. Med Care. 2006;44(6):552-559.
53. Moran CG, Wenn RT, Sikand M, Taylor AM. Early mortality after hip fracture: is delay before surgery important? J Bone Joint Surg Am. 2005;87(3):483-489.
54. Shiga T, Wajima Zi, Ohe Y. Is operative delay associated with increased mortality of hip fracture patients? Systematic review, meta-analysis, and meta-regression. Can J Anesth. 2008;55(3):146-154.
55. Streubel P, Ricci W, Wong A, Gardner M. Mortality after distal femur fractures in elderly patients. Clin Orthop Relat Res. 2011;469(4):1188-1196.
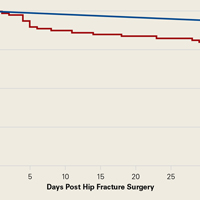
Electronic Health Record Implementation Is Associated With a Negligible Change in Outpatient Volume and Billing
Take-Home Points
- With EHR implementation there are small changes in the level of billing coding.
- Although these changes may be statistically significant they are relatively minor.
- In the general internal medicine department, level 4 coding increased by 1.2% while level 3 coding decreased by 0.5%.
- In the orthopedics department, level 4 coding increased by 3.3% while level 3 coding decreased by 3.1%.
- Reports in the lay media regarding dramatic up-coding after EHR implementation may be misleading.
The Health Information Technology for Economic and Clinical Health (HITECH) Act, which was signed into law in 2009, mandated that hospitals that care for Medicare patients either begin using electronic health records (EHRs) or pay a nontrivial penalty.1 By now, the majority of orthopedic surgeons have implemented EHRs in their practices.2 Despite ongoing debate in the orthopedic literature,3 EHRs are expected to improve coordination of care, reduce duplicate testing, and reduce costs over the long term as healthcare insurance coverage is extended to millions more Americans.
In early coverage, however, media reported that EHR implementation at some hospitals was correlated with substantial increases in Medicare payments.4 Journalists suggested the billion dollars more paid by Medicare to hospitals in 2010 than in 2005 were partly attributable to up-coding facilitated by EHRs.5 The secretary of the Department of Health and Human Services (DHHS) and the attorney general of the Department of Justice also weighed in on this controversy by expressing their concerns in a letter to the presidents of 5 hospital associations.6 The inspector general of DHHS also published a report critical of Medicare officials’ oversight of EHRs.7Responding to the critical reception of EHR implementations, investigators studied the validity of the early reports and anecdotes. Some initial reports cited the emergency department (ED) as an area at high risk for using the convenience of EHRs to up-code visits.5 The DHHS Office of the Inspector General noted that, between 2001 and 2010, the proportion of claims for lower reimbursement categories of American Medical Association Current Procedural Terminology (CPT) codes decreased while the proportion for higher-paid billing codes increased for all visit types.8 Addressing these concerns, the American Hospital Association9 issued a brief that noted that any observed coding increases were more likely attributable to more ED use by Medicare patients and increased average illness severity. In a thoughtful perspective, Pitts10 conceded that, though utilization and illness severity may explain part of the trend, the trend may also be related to technological innovations and changes in culture and practice style in the ED.
Because these studies and reports variously suggested that EHR implementation affects patient volume and up-coding, and because none of the reports specifically addressed orthopedics, we conducted a study to determine whether any significant up-coding or change in patient volumes occurred around the time of EHR implementation in ambulatory practices at our academic medical center. In a recent national study, Adler-Milstein and Jha11 compared billing data of hospitals that adopted EHRs and hospitals that did not. Although both groups showed increased billing trends, the increases were not significantly different between the EHR adopters and nonadopters. To more effectively control for the confounding differences between groups of EHR adopters and nonadopters, we studied individual departments during EHR implementation at our institution.
Methods
In 2011, our academic medical center began the transition to EHRs (Epic). We examined our center’s trends in patient volumes and billing coding around the time of the transition in the outpatient practice of the general internal medicine (GIM) department (EHR transition, October 2011) and the outpatient practice of the orthopedics department (EHR transition, March 2012). These departments were chosen because they are representative of a GIM practice and a subspecialty practice, and because a recent study found that GIM practitioners and orthopedic surgeons were among those specialists who used EHRs the most.12
After this study was approved by our Human Investigations Committee, we began using CPT codes to identify all outpatient visits (new, consultation, and return) on a monthly basis. We compared the volume of patient visits and the billing coding level in the GIM and orthopedics departments before and after EHR implementation. Pearson χ2 test was used when appropriate, and statistical analyses were performed with SPSS for Windows Version 16.0.
Results
In the GIM department, mean monthly volume of patient visits in the 12 months before EHR implementation was similar to that in the 12 months afterward (613 vs 587; P = .439). Even when normalized for changes in provider availability (maternity leave), the decrease in volume of patient visits after EHR implementation in the GIM department was not significant (6.9%; P = .107). Likewise, in the orthopedics department, mean monthly volume of patient visits in the 17 months before EHR implementation was similar to that in the 7 months afterward (2157 vs 2317; P = .156). In fact, patient volumes remained constant during the EHR transition (Figure 1).
EHR implementation brought small changes in billing coding levels. In the GIM department, the largest change was a 1.2% increase in level 4 billing coding—an increase accompanied by a 0.5% decrease in level 3 coding. 
Discussion
It is remarkable that the volumes of patient visits in the GIM and orthopedics departments at our academic center were not affected by EHR implementation. 
Rather than reduce scheduling during the EHR transition, surgeons in our practice either added or lengthened clinic sessions, and the level of ancillary staffing was adjusted accordingly. As staffing costs at any given time are multifactorial and vary widely, estimating the cost of these staffing changes during the EHR transition is difficult. We should note that extending ancillary staff hours during the transition very likely increased costs, and it is unclear whether they were higher or lower than the costs that would have been incurred had we reduced scheduling or tried some combination of these strategies.
Although billing coding levels changed with EHR implementation, the changes were small. In the GIM department, level 4 CPT coded visits as percentages of all visits increased to 59.5% from 58.3%, and level 5 visits increased to 6.2% from 6.0%; in the orthopedics department, level 4 visits increased to 40.2% from 37.1%, and level 5 visits increased to 5.5% from 3.8% (Table). The 1.2% and 0.2% absolute increases in level 4 and level 5 visits in the GIM department represent 2.1% and 3.3% relative increases in level 4 and level 5 visits, and the 3.3% and 1.7% absolute increases in the orthopedics department represent 8.4% and 44.7% relative increases in level 4 and level 5 visits after EHR implementation.
Although the absolute increases in level 4 and level 5 visits were relatively minor, popular media have raised the alarm about 43% and 82% relative increases in level 5 visits after EHR implementation in some hospitals’ EDs.4 Although our orthopedics department showed a 44.7% relative increase in level 5 visits after EHR implementation, this represented an increase of only 1.7% of patient visits overall. Our findings therefore indicate that lay media reports could be misleading. Nevertheless, the small changes we found were statistically significant.
One explanation for these small changes is that EHRs facilitate better documentation of services provided. Therefore, what seem to be billing coding changes could be more accurate reports of high-level care that is the same as before. In addition, because of meaningful use mandates that coincided with the requirement to implement EHRs, additional data elements are now being consistently collected and reviewed (these may not necessarily have been collected and reviewed before). In some patient encounters, these additional data elements may have contributed to higher levels of service, and this effect could be especially apparent in EDs.
Some have suggested a potential for large-scale up-coding during EHR transitions. Others have contended that coding level increases are a consequence of a time-intensive data entry process, collection and review of additional data, and more accurate reporting of services already being provided. We are not convinced that large coding changes are attributable solely to EHR implementation, as the changes at our center have been relatively small.
Nevertheless, minor coding level changes could translate to large changes in healthcare costs when scaled nationally. Although causes may be innocuous, any increases in national healthcare costs are concerning in our time of limited budgets and scrutinized healthcare utilization.
This study had its limitations. First, including billing data from only 2 departments at a single center may limit the generalizability of findings. However, we specifically selected a GIM department and a specialty (orthopedics) department in an attempt to capture a representative sample of practices. Another limitation is that we investigated billing codes over only 2 years, around the implementation of EHRs in these departments, and therefore may have captured only short-term changes. However, as patient volumes and billing are subject to many factors, including staffing changes (eg, new partners, new hires, retirements, other departures), we attempted to limit the effect of confounding variables by limiting the period of analysis.
Overall, changes in patient volume and coded level of service during EHR implementation at our institution were relatively small. Although the trend toward higher billing coding levels was statistically significant, these 0.2% and 1.7% increases in level 5 coding hardly deserve the negative attention from lay media. These small increases are unlikely caused by intentional up-coding, and more likely reflect better documentation of an already high level of care. We hope these findings allay the concern that up-coding increased dramatically with EHR implementation.
Am J Orthop. 2017;46(3):E172-E176. Copyright Frontline Medical Communications Inc. 2017. All rights reserved.
1. Centers for Medicare & Medicaid Services. Electronic health records (EHR) incentive programs. http://www.cms.gov/Regulations-and-Guidance/Legislation/EHRIncentivePrograms. Accessed February 5, 2015.
2. American Academy of Orthopaedic Surgeons Practice Management Committee. EMR: A Primer for Orthopaedic Surgeons. 2nd ed. Rosemont, IL: American Academy of Orthopaedic Surgeons; 2010.
3. Ries MD. Electronic medical records: friends or foes? Clin Orthop Relat Res. 2014;472(1):16-21.
4. Abelson R. Medicare is faulted on shift to electronic records. New York Times. November 29, 2012;B1. http://www.nytimes.com/2012/11/29/business/medicare-is-faulted-in-electronic-medical-records-conversion.html. Accessed February 5, 2015.
5. Abelson R, Creswell J, Palmer G. Medicare bills rise as records turn electronic. New York Times. September 22, 2012;A1. http://www.nytimes.com/2012/09/22/business/medicare-billing-rises-at-hospitals-with-electronic-records.html. Accessed February 5, 2015.
6. Carlson J. Warning bell. Potential for fraud through use of EHRs draws federal scrutiny. Mod Healthc. 2012;42(40):8-9.
7. Levinson DR. Early assessment finds that CMS faces obstacles in overseeing the Medicare EHR Incentive Program. Dept of Health and Human Services, Office of Inspector General website. https://oig.hss.gov/oei/reports/oei-05-11-00250.pdf. Publication OEI-05-11-00250. Published November 2012. Accessed February 5, 2015.
8. Levinson DR. Coding trends of Medicare evaluation and management services. Dept of Health and Human Services, Office of Inspector General website. https://oig.hhs.gov/oei/reports/oei-04-10-00180.pdf. Publication OEI-04-10-00180. Published May 2012. Accessed February 5, 2015.
9. American Hospital Association. Sicker, more complex patients are driving up intensity of ED care [issue brief]. http://www.aha.org/content/13/13issuebrief-ed.pdf. Published May 2, 2013. Accessed February 5, 2015.
10. Pitts SR. Higher-complexity ED billing codes—sicker patients, more intensive practice, or improper payments? N Engl J Med. 2012;367(26):2465-2467.
11. Adler-Milstein J, Jha AK. No evidence found that hospitals are using new electronic health records to increase Medicare reimbursements. Health Aff (Millwood). 2014;33(7):1271-1277.
12. Kokkonen EW, Davis SA, Lin HC, Dabade TS, Feldman SR, Fleischer AB Jr. Use of electronic medical records differs by specialty and office settings. J Am Med Inform Assoc. 2013;20(e1):e33-e38.
13. Samaan ZM, Klein MD, Mansour ME, DeWitt TG. The impact of the electronic health record on an academic pediatric primary care center. J Ambul Care Manage. 2009;32(3):180-187.
Take-Home Points
- With EHR implementation there are small changes in the level of billing coding.
- Although these changes may be statistically significant they are relatively minor.
- In the general internal medicine department, level 4 coding increased by 1.2% while level 3 coding decreased by 0.5%.
- In the orthopedics department, level 4 coding increased by 3.3% while level 3 coding decreased by 3.1%.
- Reports in the lay media regarding dramatic up-coding after EHR implementation may be misleading.
The Health Information Technology for Economic and Clinical Health (HITECH) Act, which was signed into law in 2009, mandated that hospitals that care for Medicare patients either begin using electronic health records (EHRs) or pay a nontrivial penalty.1 By now, the majority of orthopedic surgeons have implemented EHRs in their practices.2 Despite ongoing debate in the orthopedic literature,3 EHRs are expected to improve coordination of care, reduce duplicate testing, and reduce costs over the long term as healthcare insurance coverage is extended to millions more Americans.
In early coverage, however, media reported that EHR implementation at some hospitals was correlated with substantial increases in Medicare payments.4 Journalists suggested the billion dollars more paid by Medicare to hospitals in 2010 than in 2005 were partly attributable to up-coding facilitated by EHRs.5 The secretary of the Department of Health and Human Services (DHHS) and the attorney general of the Department of Justice also weighed in on this controversy by expressing their concerns in a letter to the presidents of 5 hospital associations.6 The inspector general of DHHS also published a report critical of Medicare officials’ oversight of EHRs.7Responding to the critical reception of EHR implementations, investigators studied the validity of the early reports and anecdotes. Some initial reports cited the emergency department (ED) as an area at high risk for using the convenience of EHRs to up-code visits.5 The DHHS Office of the Inspector General noted that, between 2001 and 2010, the proportion of claims for lower reimbursement categories of American Medical Association Current Procedural Terminology (CPT) codes decreased while the proportion for higher-paid billing codes increased for all visit types.8 Addressing these concerns, the American Hospital Association9 issued a brief that noted that any observed coding increases were more likely attributable to more ED use by Medicare patients and increased average illness severity. In a thoughtful perspective, Pitts10 conceded that, though utilization and illness severity may explain part of the trend, the trend may also be related to technological innovations and changes in culture and practice style in the ED.
Because these studies and reports variously suggested that EHR implementation affects patient volume and up-coding, and because none of the reports specifically addressed orthopedics, we conducted a study to determine whether any significant up-coding or change in patient volumes occurred around the time of EHR implementation in ambulatory practices at our academic medical center. In a recent national study, Adler-Milstein and Jha11 compared billing data of hospitals that adopted EHRs and hospitals that did not. Although both groups showed increased billing trends, the increases were not significantly different between the EHR adopters and nonadopters. To more effectively control for the confounding differences between groups of EHR adopters and nonadopters, we studied individual departments during EHR implementation at our institution.
Methods
In 2011, our academic medical center began the transition to EHRs (Epic). We examined our center’s trends in patient volumes and billing coding around the time of the transition in the outpatient practice of the general internal medicine (GIM) department (EHR transition, October 2011) and the outpatient practice of the orthopedics department (EHR transition, March 2012). These departments were chosen because they are representative of a GIM practice and a subspecialty practice, and because a recent study found that GIM practitioners and orthopedic surgeons were among those specialists who used EHRs the most.12
After this study was approved by our Human Investigations Committee, we began using CPT codes to identify all outpatient visits (new, consultation, and return) on a monthly basis. We compared the volume of patient visits and the billing coding level in the GIM and orthopedics departments before and after EHR implementation. Pearson χ2 test was used when appropriate, and statistical analyses were performed with SPSS for Windows Version 16.0.
Results
In the GIM department, mean monthly volume of patient visits in the 12 months before EHR implementation was similar to that in the 12 months afterward (613 vs 587; P = .439). Even when normalized for changes in provider availability (maternity leave), the decrease in volume of patient visits after EHR implementation in the GIM department was not significant (6.9%; P = .107). Likewise, in the orthopedics department, mean monthly volume of patient visits in the 17 months before EHR implementation was similar to that in the 7 months afterward (2157 vs 2317; P = .156). In fact, patient volumes remained constant during the EHR transition (Figure 1).
EHR implementation brought small changes in billing coding levels. In the GIM department, the largest change was a 1.2% increase in level 4 billing coding—an increase accompanied by a 0.5% decrease in level 3 coding.
Discussion
It is remarkable that the volumes of patient visits in the GIM and orthopedics departments at our academic center were not affected by EHR implementation.
Rather than reduce scheduling during the EHR transition, surgeons in our practice either added or lengthened clinic sessions, and the level of ancillary staffing was adjusted accordingly. As staffing costs at any given time are multifactorial and vary widely, estimating the cost of these staffing changes during the EHR transition is difficult. We should note that extending ancillary staff hours during the transition very likely increased costs, and it is unclear whether they were higher or lower than the costs that would have been incurred had we reduced scheduling or tried some combination of these strategies.
Although billing coding levels changed with EHR implementation, the changes were small. In the GIM department, level 4 CPT coded visits as percentages of all visits increased to 59.5% from 58.3%, and level 5 visits increased to 6.2% from 6.0%; in the orthopedics department, level 4 visits increased to 40.2% from 37.1%, and level 5 visits increased to 5.5% from 3.8% (Table). The 1.2% and 0.2% absolute increases in level 4 and level 5 visits in the GIM department represent 2.1% and 3.3% relative increases in level 4 and level 5 visits, and the 3.3% and 1.7% absolute increases in the orthopedics department represent 8.4% and 44.7% relative increases in level 4 and level 5 visits after EHR implementation.
Although the absolute increases in level 4 and level 5 visits were relatively minor, popular media have raised the alarm about 43% and 82% relative increases in level 5 visits after EHR implementation in some hospitals’ EDs.4 Although our orthopedics department showed a 44.7% relative increase in level 5 visits after EHR implementation, this represented an increase of only 1.7% of patient visits overall. Our findings therefore indicate that lay media reports could be misleading. Nevertheless, the small changes we found were statistically significant.
One explanation for these small changes is that EHRs facilitate better documentation of services provided. Therefore, what seem to be billing coding changes could be more accurate reports of high-level care that is the same as before. In addition, because of meaningful use mandates that coincided with the requirement to implement EHRs, additional data elements are now being consistently collected and reviewed (these may not necessarily have been collected and reviewed before). In some patient encounters, these additional data elements may have contributed to higher levels of service, and this effect could be especially apparent in EDs.
Some have suggested a potential for large-scale up-coding during EHR transitions. Others have contended that coding level increases are a consequence of a time-intensive data entry process, collection and review of additional data, and more accurate reporting of services already being provided. We are not convinced that large coding changes are attributable solely to EHR implementation, as the changes at our center have been relatively small.
Nevertheless, minor coding level changes could translate to large changes in healthcare costs when scaled nationally. Although causes may be innocuous, any increases in national healthcare costs are concerning in our time of limited budgets and scrutinized healthcare utilization.
This study had its limitations. First, including billing data from only 2 departments at a single center may limit the generalizability of findings. However, we specifically selected a GIM department and a specialty (orthopedics) department in an attempt to capture a representative sample of practices. Another limitation is that we investigated billing codes over only 2 years, around the implementation of EHRs in these departments, and therefore may have captured only short-term changes. However, as patient volumes and billing are subject to many factors, including staffing changes (eg, new partners, new hires, retirements, other departures), we attempted to limit the effect of confounding variables by limiting the period of analysis.
Overall, changes in patient volume and coded level of service during EHR implementation at our institution were relatively small. Although the trend toward higher billing coding levels was statistically significant, these 0.2% and 1.7% increases in level 5 coding hardly deserve the negative attention from lay media. These small increases are unlikely caused by intentional up-coding, and more likely reflect better documentation of an already high level of care. We hope these findings allay the concern that up-coding increased dramatically with EHR implementation.
Am J Orthop. 2017;46(3):E172-E176. Copyright Frontline Medical Communications Inc. 2017. All rights reserved.
1. Centers for Medicare & Medicaid Services. Electronic health records (EHR) incentive programs. http://www.cms.gov/Regulations-and-Guidance/Legislation/EHRIncentivePrograms. Accessed February 5, 2015.
2. American Academy of Orthopaedic Surgeons Practice Management Committee. EMR: A Primer for Orthopaedic Surgeons. 2nd ed. Rosemont, IL: American Academy of Orthopaedic Surgeons; 2010.
3. Ries MD. Electronic medical records: friends or foes? Clin Orthop Relat Res. 2014;472(1):16-21.
4. Abelson R. Medicare is faulted on shift to electronic records. New York Times. November 29, 2012;B1. http://www.nytimes.com/2012/11/29/business/medicare-is-faulted-in-electronic-medical-records-conversion.html. Accessed February 5, 2015.
5. Abelson R, Creswell J, Palmer G. Medicare bills rise as records turn electronic. New York Times. September 22, 2012;A1. http://www.nytimes.com/2012/09/22/business/medicare-billing-rises-at-hospitals-with-electronic-records.html. Accessed February 5, 2015.
6. Carlson J. Warning bell. Potential for fraud through use of EHRs draws federal scrutiny. Mod Healthc. 2012;42(40):8-9.
7. Levinson DR. Early assessment finds that CMS faces obstacles in overseeing the Medicare EHR Incentive Program. Dept of Health and Human Services, Office of Inspector General website. https://oig.hss.gov/oei/reports/oei-05-11-00250.pdf. Publication OEI-05-11-00250. Published November 2012. Accessed February 5, 2015.
8. Levinson DR. Coding trends of Medicare evaluation and management services. Dept of Health and Human Services, Office of Inspector General website. https://oig.hhs.gov/oei/reports/oei-04-10-00180.pdf. Publication OEI-04-10-00180. Published May 2012. Accessed February 5, 2015.
9. American Hospital Association. Sicker, more complex patients are driving up intensity of ED care [issue brief]. http://www.aha.org/content/13/13issuebrief-ed.pdf. Published May 2, 2013. Accessed February 5, 2015.
10. Pitts SR. Higher-complexity ED billing codes—sicker patients, more intensive practice, or improper payments? N Engl J Med. 2012;367(26):2465-2467.
11. Adler-Milstein J, Jha AK. No evidence found that hospitals are using new electronic health records to increase Medicare reimbursements. Health Aff (Millwood). 2014;33(7):1271-1277.
12. Kokkonen EW, Davis SA, Lin HC, Dabade TS, Feldman SR, Fleischer AB Jr. Use of electronic medical records differs by specialty and office settings. J Am Med Inform Assoc. 2013;20(e1):e33-e38.
13. Samaan ZM, Klein MD, Mansour ME, DeWitt TG. The impact of the electronic health record on an academic pediatric primary care center. J Ambul Care Manage. 2009;32(3):180-187.
Superior Mesenteric Artery Syndrome as a Complication of Scoliosis Surgery
Take-Home Points
- Adolescent growth spurt, height-to-weight ratio, and perioperative weight loss are risk factors associated with SMA syndrome following pediatric spine surgery.
- Must recognize nonspecific symptoms such as abdominal pain, tenderness, distention, bilious or projectile vomiting, hypoactive bowel sounds, and anorexia postoperatively.
- Complications of SMA syndrome can potentially lead to aspiration pneumonia, acute gastric rupture, or cardiovascular collapse and death.
Superior mesenteric artery (SMA) syndrome resulting from surgical treatment of scoliosis has been recognized in the medical literature since 1752.1 Throughout the literature, SMA syndrome variably has been referred to as cast syndrome, Wilkie syndrome, arteriomesenteric duodenal obstruction, and chronic duodenal ileus.2 We now recognize numerous etiologies of SMA syndrome, as several sources can externally compress the duodenum. Classic acute symptoms of bowel obstruction include bilious vomiting, nausea, and epigastric pain. Chronic manifestations of SMA syndrome may include weight loss and decreased appetite. Our literature review revealed that adolescent growth spurt, height-to-weight ratio, and perioperative weight loss are risk factors associated with SMA syndrome after pediatric spine surgery.
We report the case of a 14-year-old boy who developed SMA syndrome after undergoing scoliosis surgery. The patient and his mother provided written informed consent for print and electronic publication of this case report.
Case Report
A 14-year-old boy with a history of idiopathic scoliosis presented to Cohen Children’s Hospital (Long Island Jewish Medical Center) with bilious vomiting that had persisted for 7 days after posterior T9–L4 fusion with instrumentation. 


Discussion
SMA syndrome is attributed to the anatomical orientation of the third part of the duodenum, which passes between the aorta and the SMA (Figure 4). 
Adolescents are particularly vulnerable to this condition. Faster adolescent bone growth relative to visceral growth is accompanied by a decrease in SMA angle.3 Occasionally, body casts are used after surgery to immobilize the vertebrae and augment healing. Cast syndrome occurs when pressure from a body cast causes a bowel obstruction secondary to spinal hyperextension and amplified spinal lordosis.2 This finding, dating to the 19th century, was reported by Willet4 when a patient died 48 hours after application of a body cast. In 1950, the term cast syndrome was coined after a motorcyclist’s injuries were treated with a hip spica cast and the patient died of cardiovascular collapse secondary to persistent vomiting.5
Table 1 summarizes various evaluation, diagnosis, and treatment algorithms designed to optimize nutrition and weight in patients developing signs and symptoms of SMA syndrome after posterior spinal instrumentation and fusion for adolescent idiopathic scoliosis (AIS). 

The third unique feature in this case is electrocardiogram findings. Although some cases briefly discussed electrolyte abnormalities, none presented evidence that these abnormalities caused cardiac changes.6,16,18 The overall clinical significance of the QT prolongation in our patient’s case is unknown, as this finding was improved with correction of the electrolyte abnormalities and appropriate fluid replenishment.
Early recognition of nonspecific symptoms (eg, abdominal pain, tenderness, distension, bilious or projectile vomiting, hypoactive bowel sounds, anorexia) plays a key role in preventing severe morbidity and mortality from SMA syndrome after scoliosis surgery. Although many patients present in the semiclassic obstructed pattern, notable reasons for diagnostic delay include normal appetite and bowel sounds.3 For example, SMA syndrome may be misdiagnosed as stomach flu because of unfamiliarity with disease diagnosis and management.20 Complications of SMA syndrome can potentially lead to aspiration pneumonia, acute gastric rupture, and cardiovascular collapse and death.
Am J Orthop. 2017;46(2):E124-E130. Copyright Frontline Medical Communications Inc. 2017. All rights reserved.
1. Evarts CM, Winter RB, Hall JE. Vascular compression of the duodenum associated with the treatment of scoliosis. Review of the literature and report of eighteen cases. J Bone Joint Surg Am. 1971;53(3):431-444.
2. Zhu ZZ, Qiu Y. Superior mesenteric artery syndrome following scoliosis surgery: its risk indicators and treatment strategy. World J Gastroenterol. 2005;11(21):3307-3310.
3. Hutchinson DT, Bassett GS. Superior mesenteric artery syndrome in pediatric orthopedic patients. Clin Orthop Relat Res. 1990;(250):250-257.
4. Willet A. Fatal vomiting following application of plaster-of-Paris bandage in case of spinal curvature. St Barth Hosp Rep. 1878;14:333-335.
5. Dorph MH. The cast syndrome; review of the literature and report of a case. N Engl J Med. 1950;243(12):440-442.
6. Lam DJ, Lee JZ, Chua JH, Lee YT, Lim KB. Superior mesenteric artery syndrome following surgery for adolescent idiopathic scoliosis: a case series, review of the literature, and an algorithm for management. J Pediatr Orthop B. 2014;23(4):312-318.
7. Tsirikos AI, Anakwe RE, Baker AD. Late presentation of superior mesenteric artery syndrome following scoliosis surgery: a case report. J Med Case Rep. 2008;2:9.
8. Akin JT Jr, Skandalakis JE, Gray SW. The anatomic basis of vascular compression of the duodenum. Surg Clin North Am. 1974;54(6):1361-1370.
9. Amy BW, Priebe CJ Jr, King A. Superior mesenteric artery syndrome associated with scoliosis treated by a modified Ladd procedure. J Pediatr Orthop. 1985;5(3):361-363.
10. Richardson WS, Surowiec WJ. Laparoscopic repair of superior mesenteric artery syndrome. Am J Surg. 2001;181(4):377-378.
11. Lenke LG, Betz RR, Harms J, et al. Adolescent idiopathic scoliosis: a new classification to determine extent of spinal arthrodesis. J Bone Joint Surg Am. 2001;83(8):1169-1181.
12. Braun SV, Hedden DM, Howard AW. Superior mesenteric artery syndrome following spinal deformity correction. J Bone Joint Surg Am. 2006;88(10):2252-2257.
13. Smith BG, Hakim-Zargar M, Thomson JD. Low body mass index: a risk factor for superior mesenteric artery syndrome in adolescents undergoing spinal fusion for scoliosis. J Spinal Disord Tech. 2009;22(2):144-148.
14. Pan CH, Tzeng ST, Chen CS, Chen PQ. Superior mesenteric artery syndrome complicating staged corrective surgery for scoliosis. J Formos Med Assoc. 2007;106(2 suppl):S37-S45.
15. Kennedy RH, Cooper MJ. An unusually severe case of the cast syndrome. Postgrad Med J. 1983;59(694):539-540.
16. Keskin M, Akgül T, Bayraktar A, Dikici F, Balik E. Superior mesenteric artery syndrome: an infrequent complication of scoliosis surgery. Case Rep Surg. 2014;2014:263431.
17. Amarawickrama H, Harikrishnan A, Krijgsman B. Superior mesenteric artery syndrome in a young girl following spinal surgery for scoliosis. Br J Hosp Med. 2005;66(12):700-701.
18. Crowther MA, Webb PJ, Eyre-Brook IA. Superior mesenteric artery syndrome following surgery for scoliosis. Spine. 2002;27(24):E528-E533.
19. Moskovich R, Cheong-Leen P. Vascular compression of the duodenum. J R Soc Med. 1986;79(8):465-467.
20. Shah MA, Albright MB, Vogt MT, Moreland MS. Superior mesenteric artery syndrome in scoliosis surgery: weight percentile for height as an indicator of risk. J Pediatr Orthop. 2003;23(5):665-668.
Take-Home Points
- Adolescent growth spurt, height-to-weight ratio, and perioperative weight loss are risk factors associated with SMA syndrome following pediatric spine surgery.
- Must recognize nonspecific symptoms such as abdominal pain, tenderness, distention, bilious or projectile vomiting, hypoactive bowel sounds, and anorexia postoperatively.
- Complications of SMA syndrome can potentially lead to aspiration pneumonia, acute gastric rupture, or cardiovascular collapse and death.
Superior mesenteric artery (SMA) syndrome resulting from surgical treatment of scoliosis has been recognized in the medical literature since 1752.1 Throughout the literature, SMA syndrome variably has been referred to as cast syndrome, Wilkie syndrome, arteriomesenteric duodenal obstruction, and chronic duodenal ileus.2 We now recognize numerous etiologies of SMA syndrome, as several sources can externally compress the duodenum. Classic acute symptoms of bowel obstruction include bilious vomiting, nausea, and epigastric pain. Chronic manifestations of SMA syndrome may include weight loss and decreased appetite. Our literature review revealed that adolescent growth spurt, height-to-weight ratio, and perioperative weight loss are risk factors associated with SMA syndrome after pediatric spine surgery.
We report the case of a 14-year-old boy who developed SMA syndrome after undergoing scoliosis surgery. The patient and his mother provided written informed consent for print and electronic publication of this case report.
Case Report
A 14-year-old boy with a history of idiopathic scoliosis presented to Cohen Children’s Hospital (Long Island Jewish Medical Center) with bilious vomiting that had persisted for 7 days after posterior T9–L4 fusion with instrumentation.
Discussion
SMA syndrome is attributed to the anatomical orientation of the third part of the duodenum, which passes between the aorta and the SMA (Figure 4).
Adolescents are particularly vulnerable to this condition. Faster adolescent bone growth relative to visceral growth is accompanied by a decrease in SMA angle.3 Occasionally, body casts are used after surgery to immobilize the vertebrae and augment healing. Cast syndrome occurs when pressure from a body cast causes a bowel obstruction secondary to spinal hyperextension and amplified spinal lordosis.2 This finding, dating to the 19th century, was reported by Willet4 when a patient died 48 hours after application of a body cast. In 1950, the term cast syndrome was coined after a motorcyclist’s injuries were treated with a hip spica cast and the patient died of cardiovascular collapse secondary to persistent vomiting.5
Table 1 summarizes various evaluation, diagnosis, and treatment algorithms designed to optimize nutrition and weight in patients developing signs and symptoms of SMA syndrome after posterior spinal instrumentation and fusion for adolescent idiopathic scoliosis (AIS).
The third unique feature in this case is electrocardiogram findings. Although some cases briefly discussed electrolyte abnormalities, none presented evidence that these abnormalities caused cardiac changes.6,16,18 The overall clinical significance of the QT prolongation in our patient’s case is unknown, as this finding was improved with correction of the electrolyte abnormalities and appropriate fluid replenishment.
Early recognition of nonspecific symptoms (eg, abdominal pain, tenderness, distension, bilious or projectile vomiting, hypoactive bowel sounds, anorexia) plays a key role in preventing severe morbidity and mortality from SMA syndrome after scoliosis surgery. Although many patients present in the semiclassic obstructed pattern, notable reasons for diagnostic delay include normal appetite and bowel sounds.3 For example, SMA syndrome may be misdiagnosed as stomach flu because of unfamiliarity with disease diagnosis and management.20 Complications of SMA syndrome can potentially lead to aspiration pneumonia, acute gastric rupture, and cardiovascular collapse and death.
Am J Orthop. 2017;46(2):E124-E130. Copyright Frontline Medical Communications Inc. 2017. All rights reserved.
1. Evarts CM, Winter RB, Hall JE. Vascular compression of the duodenum associated with the treatment of scoliosis. Review of the literature and report of eighteen cases. J Bone Joint Surg Am. 1971;53(3):431-444.
2. Zhu ZZ, Qiu Y. Superior mesenteric artery syndrome following scoliosis surgery: its risk indicators and treatment strategy. World J Gastroenterol. 2005;11(21):3307-3310.
3. Hutchinson DT, Bassett GS. Superior mesenteric artery syndrome in pediatric orthopedic patients. Clin Orthop Relat Res. 1990;(250):250-257.
4. Willet A. Fatal vomiting following application of plaster-of-Paris bandage in case of spinal curvature. St Barth Hosp Rep. 1878;14:333-335.
5. Dorph MH. The cast syndrome; review of the literature and report of a case. N Engl J Med. 1950;243(12):440-442.
6. Lam DJ, Lee JZ, Chua JH, Lee YT, Lim KB. Superior mesenteric artery syndrome following surgery for adolescent idiopathic scoliosis: a case series, review of the literature, and an algorithm for management. J Pediatr Orthop B. 2014;23(4):312-318.
7. Tsirikos AI, Anakwe RE, Baker AD. Late presentation of superior mesenteric artery syndrome following scoliosis surgery: a case report. J Med Case Rep. 2008;2:9.
8. Akin JT Jr, Skandalakis JE, Gray SW. The anatomic basis of vascular compression of the duodenum. Surg Clin North Am. 1974;54(6):1361-1370.
9. Amy BW, Priebe CJ Jr, King A. Superior mesenteric artery syndrome associated with scoliosis treated by a modified Ladd procedure. J Pediatr Orthop. 1985;5(3):361-363.
10. Richardson WS, Surowiec WJ. Laparoscopic repair of superior mesenteric artery syndrome. Am J Surg. 2001;181(4):377-378.
11. Lenke LG, Betz RR, Harms J, et al. Adolescent idiopathic scoliosis: a new classification to determine extent of spinal arthrodesis. J Bone Joint Surg Am. 2001;83(8):1169-1181.
12. Braun SV, Hedden DM, Howard AW. Superior mesenteric artery syndrome following spinal deformity correction. J Bone Joint Surg Am. 2006;88(10):2252-2257.
13. Smith BG, Hakim-Zargar M, Thomson JD. Low body mass index: a risk factor for superior mesenteric artery syndrome in adolescents undergoing spinal fusion for scoliosis. J Spinal Disord Tech. 2009;22(2):144-148.
14. Pan CH, Tzeng ST, Chen CS, Chen PQ. Superior mesenteric artery syndrome complicating staged corrective surgery for scoliosis. J Formos Med Assoc. 2007;106(2 suppl):S37-S45.
15. Kennedy RH, Cooper MJ. An unusually severe case of the cast syndrome. Postgrad Med J. 1983;59(694):539-540.
16. Keskin M, Akgül T, Bayraktar A, Dikici F, Balik E. Superior mesenteric artery syndrome: an infrequent complication of scoliosis surgery. Case Rep Surg. 2014;2014:263431.
17. Amarawickrama H, Harikrishnan A, Krijgsman B. Superior mesenteric artery syndrome in a young girl following spinal surgery for scoliosis. Br J Hosp Med. 2005;66(12):700-701.
18. Crowther MA, Webb PJ, Eyre-Brook IA. Superior mesenteric artery syndrome following surgery for scoliosis. Spine. 2002;27(24):E528-E533.
19. Moskovich R, Cheong-Leen P. Vascular compression of the duodenum. J R Soc Med. 1986;79(8):465-467.
20. Shah MA, Albright MB, Vogt MT, Moreland MS. Superior mesenteric artery syndrome in scoliosis surgery: weight percentile for height as an indicator of risk. J Pediatr Orthop. 2003;23(5):665-668.