User login
Treatment of Diabetes in Emergency Dept.
Current consensus guidelines from the American Diabetes Association and the American Association of Clinical Endocrinologists recommend the use of insulin‐based treatment protocols for most hospitalized patients with hyperglycemia.1 For noncritically ill patients, it is recommended to target a fasting blood glucose (BG) < 140 mg/dL and a random BG < 180‐200 mg/dL, without excess hypoglycemia. Prior studies recommended using a basal‐bolus insulin protocol that specifies starting doses and parameters for dose adjustment, applied by well‐educated teams of physicians and nurses.27 We have shown that insulin detemir given as a once‐daily basal injection coupled with rapid‐acting insulin aspart with meals is an effective regimen for managing hyperglycemia in hospitalized patients with type 2 diabetes.7 We and others have shown that once‐daily basal insulin mealtime rapid‐acting insulin is significantly more effective than sliding‐scale regular insulin in the hospital setting.6, 8
The majority of patients admitted to general medical units are first evaluated in the emergency department (ED), and significant hyperglycemia is not uncommon in ED patients. However, protocols for the treatment of hyperglycemia in the ED have not been widely implemented. Ginde et al studied 160 ED patients with a history of diabetes and BG > 200 mg/dL and found that although 73% were admitted to the hospital, only 31% were treated with insulin, and only 18% had a diagnosis of diabetes charted.9 A recent survey of 152 residents and attendings in 3 academic EDs found that only 32% would give insulin for a BG > 200 mg/dL, 59% for a BG > 250 mg/dL, and 91% for a BG > 300 mg/dL to ED patients with known diabetes.10 We completed a preliminary study of a novel protocol for the administration of subcutaneous insulin aspart in the ED at Rush University in 2008.11 We found that the mean BG was significantly lowered during an ED stay, from 333 to 158 mg/dL, and that the protocol was easily adopted by ED staff, with a low rate of hypoglycemia. Historically, only 35% of hyperglycemic patients with diabetes received insulin in our ED.11 Reasons for limited ED management of hyperglycemia may include presence of more critical issues, time and resource restriction, unfamiliarity with glycemic targets, and concerns regarding hypoglycemia.9, 10
In the current study we focused on 3 questions:
Could we further reduce the risk of hypoglycemia by modifying our original Rush ED insulin protocol? We reduced insulin aspart from 0.1 to 0.05 units/kg for BG 200‐299 mg/dL, from 0.15 to 0.1 units/kg for BG 300‐399 mg/dL, and from 0.2 to 0.15 units/kg for BG 400 mg/dL.
Could we couple our ED insulin aspart protocol with prompt initiation of a detemir‐aspart protocol in those patients who were subsequently admitted to general medical units from the ED?
Would the hospital length of stay, mean BG, and incidence of hypoglycemia be improved by the use of 2 back‐to‐back subcutaneous insulin protocols in a randomized clinical trial compared with the usual care provided in the ED and general medical inpatient units?
Research Design and Methods
From May 2008 through June 2009, patients presenting to the Rush University Medical Center ED with a history of type 2 diabetes and an initial point‐of‐care BG 200 mg/dL were randomized to an intervention group (INT) or to a usual care group (UC) after giving informed consent. Inclusion criteria for the study were: ages 18‐80 years, history of type 2 diabetes for at least 3 months, and prior therapy with dietary management, oral agents, or insulin. Patients were excluded if subsequently found to have diabetic ketoacidosis, hyperosmolar nonketotic syndrome, or critical illness requiring intensive care unit admission/direct surgical intervention. Other exclusion criteria included a positive pregnancy test or an inability to give informed consent secondary to acute drug or alcohol intoxication or active mental illness. Patients with clinically significant liver disease, with ALT or AST > 3 times the upper limit of normal, or with a history of end‐stage renal disease requiring dialysis were also excluded because of their increased risk of hypoglycemia, as they have required a more conservative insulin regimen. Similarly, we excluded patients with a history of type 1 diabetes because our aspart algorithm for the ED had only been tested in a type 2 diabetes population, and we did not want to disrupt the insulin regimen of type 1 diabetes patients, usually glargine‐based or an insulin pump.
The study consisted of 2 phases. Patients randomized to INT or UC in phase 1 stayed in their respective groups through phase 2. After informed consent was obtained by the study staff, implementation of the protocol was carried out by the ED staff. ED nurses were trained in the study protocol. During phase 1, INT patients received subcutaneous aspart every 2 hours while in the ED if BG was > 200 mg/dL. Aspart dosing per protocol was limited to 2 doses. Uncommonly, when a third dose of aspart was needed, physician input was requested. Aspart dosing was weight‐ and BG level based (0.05 units/kg for BG 200‐299 mg/dL, 0.1 units/kg for BG 300‐399 mg/dL, or 0.15 units/kg for BG 400mg/dL; see Supporting Appendix Fig. 1). Regardless of BG level, the ED aspart protocol was discontinued on patient discharge home or admission to the hospital. UC patients received treatment for hyperglycemia at the discretion of their ED physicians. INT subjects who required hospital admission were transitioned to basal‐bolus insulin therapy with detemir and aspart, receiving their first dose of detemir in the ED. Detemir dosing was weight‐based (0.3 units/kg) if the patient was not on home insulin or based on the patient's home dose of insulin (same dose for detemir, unit‐for‐unit conversion from glargine to detemir, or 80% of total NPH dose). If a patient received basal insulin prior to arrival, the first dose of detemir was held until 12 hours after the last dose of NPH or until 20 hours after the last dose of glargine or detemir. We found from our preliminary study that inadvertent overlaps in long‐acting insulin were one cause of hypoglycemia. We compared differences between groups in the final ED BG level, frequency of hypoglycemia, and ED length of stay (LOS).
Patients subsequently admitted to the hospital entered phase 2. During phase 2, INT patients had detemir and premeal aspart titrated by study staff using a predefined protocol (see Supporting Appendix Fig. 2). Detemir was given once daily, 24 hours after the initial ED dose. UC patients had their diabetes managed by medical house staff teams. House staff members have been educated on the Rush inpatient insulin protocol on which the INT protocol was based. The Rush inpatient diabetes protocol is implemented via a single computerized order set in which all patients should receive mealtime insulin using aspart and a basal insulin (glargine or detemir or NPH). We compared differences between groups in the mean admission BG level, mean daily BG level, mean BG level before each meal, hospital LOS, and frequency of hypoglycemic events. Moderate hypoglycemia was defined as a BG between 50 and 69 mg/dL, and severe hypoglycemia was defined as a BG < 50 mg/dL. We also compared the frequency of BG < 60 mg/dL.
The Rush University Medical Center institutional review board approved the study. Statistical analysis was done using SPSS version 11.0. The Student t test was used to determine any significant difference in BG means between the INT and UC groups. The Fisher's exact test or the chi‐square test was used to determine any difference in proportions of hypoglycemic events between INT and UC patients.
Results
Phase 1: Emergency Department
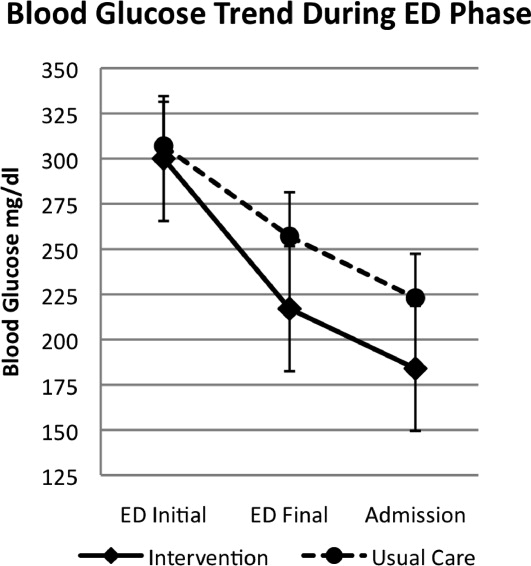
A total of 176 patients were randomized: 87 to the INT group and 89 to the UC group. Baseline characteristics were similar between groups (Table 1). Mean initial ED BG was similar: 300 70 mg/dL for INT patients and 307 82 mg/dL for UC patients. During phase 1, all INT patients were treated with aspart every 2 hours if BG > 200 mg/dL until discharge home or admission to the hospital. They received an initial mean insulin dose of 0.08 0.04 units/kg of subscutaneous aspart. Twenty‐five percent of INT patients received a second dose of aspart, and 3% received a third dose. For UC patients, only 55% received insulin therapy. Aspart was used for all UC patients who received insulin. Of those in the UC group who received insulin, 11% received a second dose for persistent hyperglycemia; none received a third dose. The mean initial ED BG for UC patients who received insulin was 358 73 mg/dL, and they received an initial mean dose of 0.11 0.05 units/kg. UC patients who did not receive insulin had a lower mean initial ED BG, 241 35 mg/dL. The mean final ED BG was 217 71 mg/dL for the INT group and 257 89 mg/dL for the UC group (P < .01; Fig. 1). The mean ED LOS was 30 minutes longer in the INT group (P = .06; Table 1). Sixty INT patients (69%) and 61 UC patients (69%) were admitted to the hospital. Fifty‐six percent of INT patients received the first dose of detemir based on their home insulin dose, and 44% received a weight‐based dose per protocol.

| Intervention (n = 87) | Usual Care (n = 89) | Significance | |
|---|---|---|---|
| |||
| Age (y) | 55 13 | 55 13 | |
| Sex (% male) | 48 | 39 | |
| BMI (kg/m2) | 34 9 | 33 9 | |
| Ethnicity (%) | |||
| African American | 58 | 66 | |
| Hispanic | 24 | 19 | |
| White | 15 | 11 | |
| Other | 3 | 4 | |
| Duration of diabetes (y) | 13 9 | 12 10 | |
| HA1C | 10.4 2.2 | 9.8 2.6 | |
| Insulin treatment at home (%) | 56 | 62 | |
| Presenting complaint/diagnosis (%) | |||
| Cardiac | 20 | 23 | |
| Gastrointestinal | 30 | 23 | |
| Hyperglycemia | 13 | 18 | |
| Infection | 9 | 11 | |
| Initial ED blood glucose (mg/dL) | 300 70 | 307 82 | |
| Final ED blood glucose (mg/dL) | 217 71 | 256 89 | P < .01 |
| ED length of stay (h) | 5.4 1.7 | 4.9 1.9 | P = .06 |
| Patients treated with insulin in ED (%) | 100 | 54 | |
| Initial dose of SQ aspart (units) | 7.9 4.2 | 9.5 4 | |
| ED patients admitted (%) | 69 | 69 | |
| Admission blood glucose (mg/dL) | 184 70 | 224 93 | P < .01 |
| Treatment of hyperglycemia in hospital (%) | |||
| Detemir aspart insulin | 100 | 7 | |
| Glargine aspart insulin | 0 | 36 | |
| NPH aspart insulin | 0 | 34 | |
| Oral agents | 0 | 8 | |
| None | 0 | 15 | |
| Hospital length of stay (days) | 2.7 2.0 | 3.1 1.9 | P = .58 |
Phase 2: Inpatient Setting
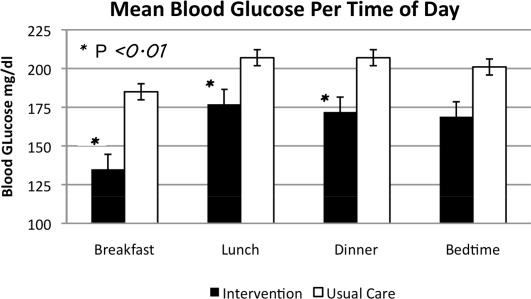
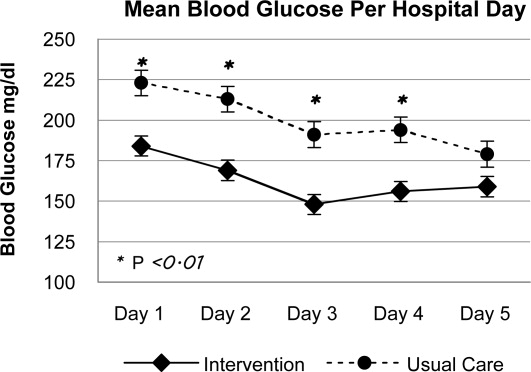
In phase 2, mean admission BG was significantly lower in the INT group (184 70 mg/dL) than in the UC group (223 93 mg/dL), P < .01, as a result of aspart given in the ED. The day 1 mean fasting BG for INT patients was 148 54 mg/dL, significantly lower than the day 1 mean fasting BG for UC patients: 212 81 mg/dL (P < .01). The mean fasting BG for the entire hospitalization was significantly lower for INT patients, 135 48 mg/dL, than for UC patients, 185 72 mg/dL (P < .01). During phase 2, all INT patients had detemir and aspart titrated daily per protocol. Treatment of UC patients was as follows: 78.5% with insulin, 8.2% with oral agents, and 11.5% did not receive medication for hyperglycemia. Of those in the UC group who received insulin, 36.0% were treated with lantus/aspart or detemir/aspart, 34.4% with NPH/aspart, 6.5% with lantus or detemir alone, and 1.6% with aspart alone. Overall, 76.9% of UC received basal insulin, and 70.4% received nutritional insulin. Only 47% of UC patients had insulin adjusted on a daily basis despite persistent hyperglycemia. Significant differences were also seen between INT and UC patients in mean prelunch and predinner BG levels, but not in mean bedtime BG level (Fig. 2). Mean daily BG levels for the initial 5 days of inpatient stay were significantly lower in the INT group (P < .01), except for day 5, when only 21 patients remained in the study (Fig. 3). Patient‐day weighted mean glucose was 163 39 mg/dL for INT patients versus 202 39 mg/dL for UC patients (P < .01). On admission, day 1 mean insulin total daily dose (TDD) was 0.65 0.26 units/kg for INT patients and 0.52 0.29 units/kg for UC patients. The final mean TDD was 0.75 0.35 units/kg for INT patients and 0.61 0.38 units/kg for UC patients. Mean hospital LOS was 9.6 hours shorter for INT patients (2.7 2 days) than for UC patients (3.1 1.9 days), P = .58.
Patient Safety: Frequency of Hypoglycemia
The frequency of hypoglycemia is shown in Table 2. During the ED phase, 3 UC patients (3.4%) had a BG < 50 mg/dL, and 2 INT patients (2.3%) had a BG of 67 mg/dL.
| Blood Glucose | Emergency Department (Number of Episodes) | Significance | Inpatient Phase (Patient Stays) | Significance | ||
|---|---|---|---|---|---|---|
| Usual Care | Intervention | Usual Care | Intervention | |||
| < 50 mg/dL | 3 | 0 | P = .50 | 6 | 1 | P = .11 |
| < 60 mg/dL | 3 | 0 | P = .50 | 7 | 8 | P = .98 |
| 5069 mg/dL | 0 | 2 | P = .23 | 6 | 12 | P = .20 |
During the hospital phase, INT patients had 4.3% of patient‐days and UC had 4.5% of patient‐days with any BG < 70 mg/dL. During 12 patient‐stays (20%) in the INT group there was an episode of moderate hypoglycemia, and during 1 patient‐stay (1.7%) there was an episode of severe hypoglycemia. During 6 patient‐stays (9.8%) in the UC group there was an episode of moderate hypoglycemia, and during 6 patient‐stays (9.8%) there was an episode of severe hypoglycemia (Table 2). The odds ratio (OR) for moderate hypoglycemia in the INT group compared with the UC group was 1.93 (95% CI, 0.7‐5.29), but for severe hypoglycemia the OR was 0.15 (95% CI, 0.018‐1.33). Moderate and severe hypoglycemic events in the UC group were split evenly between patients treated with glargine/detemir‐aspart and those treated with NPH‐aspart.
Discussion
This is the first randomized trial comparing the Rush Emergency Department Hyperglycemia Intervention (REDHI) protocol with usual care for the treatment of hyperglycemia in the ED. We believe this may be the first trial to initiate subcutaneous basal insulin therapy in the ED at the time of hospital admission. Initiation of our protocol for type 2 diabetic patients with BG > 200 mg/dL resulted in lower final ED and admission BGs compared with those in the UC group. Although a higher mean initial ED BG of 358 73 mg/dL was required to prompt initiation of insulin therapy for UC patients, 3 experienced severe hypoglycemia. By following the REDHI protocol, ED nurses avoided BG < 50 mg/dL in INT patients. Our first version of the REDHI protocol dosed more insulin than our current version, and we saw excess hypoglycemia.11 With a reduced dosing formula, there was less lowering of BG, but we eliminated all BG < 60 mg/dL. There was a trend toward an increased ED LOS in INT patients compared with UC patients. This may be because of delays in the administration of insulin or the requirement for a final BG check prior to discharge from the ED for INT patients. However, we did not receive feedback from ED nursing that either factor was a significant issue.
During phase 2, we observed improved glycemic control in INT, likely due to two factors: early initiation of basal insulin and protocol driven daily titration of both basal and mealtime insulin. We achieved a mean fasting BG of 148 54 mg/dL in INT the morning after the ED dose of detemir. BG levels in both groups continued to improve each day, but since the admission BG for INT was lower, this group maintained significantly lower BG levels throughout most of the hospitalization. There were also significant differences between groups at different times of day. Basal doses for INT patients were adjusted daily per fasting BG. Scheduled mealtime doses were based on the basal dose; each mealtime aspart dose was a third of the basal detemir dose. Therefore, patients who required larger doses for certain meals may have received less aspart than needed. This may explain why fasting BG control was better than BG control later in the day.
Current Rush guidelines recommend the same insulin doses as those that our intervention used, but patients in the UC group were less likely to have insulin titrated daily. Cook et al found that clinical inertia, or failure of health care providers to initiate or intensify therapy when indicated, is a common problem among medical residents treating inpatients with insulin.15 Reasons for clinical inertia may include unawareness of inpatient glycemic targets, lack of training or confidence in titrating insulin, and concerns regarding hypoglycemia. Our study shows that this is still an operative issue, even after residents have participated in multiple small‐group educational sessions. Details of the Rush inpatient insulin protocol are also on pocket cards distributed to residents. However, fewer than half of UC patients had insulin adjusted appropriately for persistent hyperglycemia. This may be one explanation for the improved control seen in the INT group and underscores the importance of daily dose titrations based on a uniform protocol.
During phase 2, despite improved glycemic control in INT, there was no significant difference in rates of hypoglycemia between the groups. The number of patient‐stays with moderate hypoglycemia was more in the INT group than in the UC group, 12 versus 6, respectively, but not statistically different (P = .20). There was a trend toward fewer patient‐stays with severe hypoglycemia in the INT group than in the UC group, 1 versus 6, respectively (P = .11).
Other studies have described improved inpatient glycemic control without excess hypoglycemia. In the RABBIT 2 trial, institution of a glargine‐glulisine insulin protocol, TTD of 0.4‐5 units/kg, among insulin‐naive inpatients resulted in a mean fasting BG of 147 36 mg/dL and a mean hospital BG of 166 32 mg/dL, with 3% of patient‐stays having a BG < 60 mg/dL.6 In a second trial, detemir‐aspart was compared with NPH‐aspart TTD of 0.4‐5 units/kg.7 Both groups achieved a similar mean fasting BG of 146 mg/dL and a mean hospital BG of 157 mg/dL. However, the rate of hypoglycemia was higher: 29% of patient‐stays overall. In our study, we achieved a mean fasting BG of 135 48 mg/dL and a mean hospital BG of 163 40 mg/dL in the INT group, using a mean initial TTD of 0.65 0.23 units/kg. The frequency of hypoglycemia in this trial, 22% of INT patient‐stays and 20% of UC patient‐stays, was less than that in Umpierrez et al,7 despite a lower mean fasting BG in our current trial. Maynard et al found 16% of patient‐stays and 3% of patient‐days had an episode of BG < 60 mg/dL in a trial of glarginerapid‐acting insulin (0.4‐5 units/kg TTD).12 Schnipper et al found that 6.1% of patient‐days had an episode of BG < 60 mg/dL using either glargine or NPH and a rapid‐acting insulin, TTD 0.6 units/kg.13 Our hypoglycemia rates were higher; however, we defined hypoglycemia as BG < 70 mg/dL, as suggested by the ADA workgroup.14 If we use a cutoff of < 60 mg/dL for hypoglycemia, it occurred in 13.3% of patient‐stays and 4.3% of patient‐days in the INT group, comparable to that in previous studies.
Our study has several limitations. First, this was a single‐center study, and our ED protocol should be tested in other ED settings, both academic and community. Second, although there were trends toward lower rates of severe hypoglycemia in the INT group, the study was underpowered to detect possible significant differences. Third, although ED nurses implemented the study protocol, study staff closely monitored nurses to ensure adherence. Therefore, it is difficult to speculate on protocol adherence under normal circumstances. Successful implementation requires ongoing nursing and medical staff education. A fourth limitation is the absence of patients with type 1 diabetes.
In conclusion we demonstrated that weight‐based subcutaneous aspart insulin therapy begun in the ED, coupled with prompt initiation of a detemir‐aspart insulin protocol, results in rapid correction of hyperglycemia and improved inpatient glycemic control without increasing hypoglycemia. Diabetes is a common comorbidity in patients presenting to the ED that is not uniformly addressed. These patients may present with uncontrolled hyperglycemia or diabetes‐related infections, and prompt, efficacious glucose control is important. The nurse‐driven Rush ED hyperglycemia protocol ensures that hyperglycemia is safely addressed, allowing the ED physician to address more critical issues. By initiating basal insulin in the ED, our protocol allows for a prompt and smooth transition to a basal‐bolus insulin regimen for the inpatient setting.
- ,,, et al.American Association of Clinical Endocrinologists and American Diabetes Association Consensus Statement on Inpatient Glycemic Control.Diabetes Care.2009;32:1119–1131.
- ,,, et al.Management of diabetes and hyperglycemia in hospitals.Diabetes Care.2004;27:553–591.
- ,,,Eliminating inpatient sliding scale insulin: a re‐education project with medical house staff.Diabetes Care.2008;28:1008–1011.
- ,,, et al.Reduction of surgical mortality and morbidity in diabetic patients undergoing cardiac surgery with a combined intravenous and subcutaneous insulin glucose management strategy.Diabetes Care.2007;30:823–828.
- ,,.Comparison of once daily glargine insulin with twice‐daily NPH/Regular insulin for control of hyperglycemia in inpatients after cardiovascular surgery.Diabetes Technol Ther.2006;8:609–616.
- ,,, et al.Randomized study of basal‐bolus insulin therapy in the inpatient management of patients with type 2 diabetes (RABBIT 2 trial).Diabetes Care.2007;30:2181–2186.
- ,,, et al.Comparison of inpatient insulin regimens with detemir plus aspart versus neutral protamine Hagedorn plus regular in medical patients with type 2 diabetes.J Clin Endocrinol Metab.2009;94:564–569.
- ,,,.Once daily insulin glargine vs. six hourly sliding scale regular insulin for control of hyperglycemia after bariatric surgery: a randomized clinical trial.Endocr Pract.2007;13:225–231.
- ,,.Limited communication and management of emergency department hyperglycemia in hospitalized patients.J Hosp Med.2009;4:44–49.
- ,,,.Multicenter survey of emergency physician management and referral for hyperglycemia.J Emerg Med.2010;38:264–272.
- ,,,,Impact of a nurse‐driven subcutaneous insulin protocol: Rush Emergency Department Hyperglycemia Intervention (REDHI).J Emerg Med.2008 [Epub ahead of print].
- ,,,,.Improved inpatient use of basal insulin, reduced hypoglycemia, and improved glycemic control: effect of structured subcutaneous insulin orders and an insulin management algorithm.J Hosp Med.2009;4:3–15.
- ,,,.Effects of a subcutaneous insulin protocol, clinical education, and computerized order set on the quality of inpatient management of hyperglycemia: results of a clinical trial.J Hosp Med.2009;4:16–27.
- ADA Workgroup on Hypoglycemia.Defining and reporting hypoglycemia in diabetes.Diabetes Care.2005;28:1245–1249.
- ,, et al.Diabetes care in hospitalized noncritically ill patients: More evidence for clinical inertia and negative therapeutic momentum.J Hosp Med.2007;2:203–211.
Current consensus guidelines from the American Diabetes Association and the American Association of Clinical Endocrinologists recommend the use of insulin‐based treatment protocols for most hospitalized patients with hyperglycemia.1 For noncritically ill patients, it is recommended to target a fasting blood glucose (BG) < 140 mg/dL and a random BG < 180‐200 mg/dL, without excess hypoglycemia. Prior studies recommended using a basal‐bolus insulin protocol that specifies starting doses and parameters for dose adjustment, applied by well‐educated teams of physicians and nurses.27 We have shown that insulin detemir given as a once‐daily basal injection coupled with rapid‐acting insulin aspart with meals is an effective regimen for managing hyperglycemia in hospitalized patients with type 2 diabetes.7 We and others have shown that once‐daily basal insulin mealtime rapid‐acting insulin is significantly more effective than sliding‐scale regular insulin in the hospital setting.6, 8
The majority of patients admitted to general medical units are first evaluated in the emergency department (ED), and significant hyperglycemia is not uncommon in ED patients. However, protocols for the treatment of hyperglycemia in the ED have not been widely implemented. Ginde et al studied 160 ED patients with a history of diabetes and BG > 200 mg/dL and found that although 73% were admitted to the hospital, only 31% were treated with insulin, and only 18% had a diagnosis of diabetes charted.9 A recent survey of 152 residents and attendings in 3 academic EDs found that only 32% would give insulin for a BG > 200 mg/dL, 59% for a BG > 250 mg/dL, and 91% for a BG > 300 mg/dL to ED patients with known diabetes.10 We completed a preliminary study of a novel protocol for the administration of subcutaneous insulin aspart in the ED at Rush University in 2008.11 We found that the mean BG was significantly lowered during an ED stay, from 333 to 158 mg/dL, and that the protocol was easily adopted by ED staff, with a low rate of hypoglycemia. Historically, only 35% of hyperglycemic patients with diabetes received insulin in our ED.11 Reasons for limited ED management of hyperglycemia may include presence of more critical issues, time and resource restriction, unfamiliarity with glycemic targets, and concerns regarding hypoglycemia.9, 10
In the current study we focused on 3 questions:
Could we further reduce the risk of hypoglycemia by modifying our original Rush ED insulin protocol? We reduced insulin aspart from 0.1 to 0.05 units/kg for BG 200‐299 mg/dL, from 0.15 to 0.1 units/kg for BG 300‐399 mg/dL, and from 0.2 to 0.15 units/kg for BG 400 mg/dL.
Could we couple our ED insulin aspart protocol with prompt initiation of a detemir‐aspart protocol in those patients who were subsequently admitted to general medical units from the ED?
Would the hospital length of stay, mean BG, and incidence of hypoglycemia be improved by the use of 2 back‐to‐back subcutaneous insulin protocols in a randomized clinical trial compared with the usual care provided in the ED and general medical inpatient units?
Research Design and Methods
From May 2008 through June 2009, patients presenting to the Rush University Medical Center ED with a history of type 2 diabetes and an initial point‐of‐care BG 200 mg/dL were randomized to an intervention group (INT) or to a usual care group (UC) after giving informed consent. Inclusion criteria for the study were: ages 18‐80 years, history of type 2 diabetes for at least 3 months, and prior therapy with dietary management, oral agents, or insulin. Patients were excluded if subsequently found to have diabetic ketoacidosis, hyperosmolar nonketotic syndrome, or critical illness requiring intensive care unit admission/direct surgical intervention. Other exclusion criteria included a positive pregnancy test or an inability to give informed consent secondary to acute drug or alcohol intoxication or active mental illness. Patients with clinically significant liver disease, with ALT or AST > 3 times the upper limit of normal, or with a history of end‐stage renal disease requiring dialysis were also excluded because of their increased risk of hypoglycemia, as they have required a more conservative insulin regimen. Similarly, we excluded patients with a history of type 1 diabetes because our aspart algorithm for the ED had only been tested in a type 2 diabetes population, and we did not want to disrupt the insulin regimen of type 1 diabetes patients, usually glargine‐based or an insulin pump.
The study consisted of 2 phases. Patients randomized to INT or UC in phase 1 stayed in their respective groups through phase 2. After informed consent was obtained by the study staff, implementation of the protocol was carried out by the ED staff. ED nurses were trained in the study protocol. During phase 1, INT patients received subcutaneous aspart every 2 hours while in the ED if BG was > 200 mg/dL. Aspart dosing per protocol was limited to 2 doses. Uncommonly, when a third dose of aspart was needed, physician input was requested. Aspart dosing was weight‐ and BG level based (0.05 units/kg for BG 200‐299 mg/dL, 0.1 units/kg for BG 300‐399 mg/dL, or 0.15 units/kg for BG 400mg/dL; see Supporting Appendix Fig. 1). Regardless of BG level, the ED aspart protocol was discontinued on patient discharge home or admission to the hospital. UC patients received treatment for hyperglycemia at the discretion of their ED physicians. INT subjects who required hospital admission were transitioned to basal‐bolus insulin therapy with detemir and aspart, receiving their first dose of detemir in the ED. Detemir dosing was weight‐based (0.3 units/kg) if the patient was not on home insulin or based on the patient's home dose of insulin (same dose for detemir, unit‐for‐unit conversion from glargine to detemir, or 80% of total NPH dose). If a patient received basal insulin prior to arrival, the first dose of detemir was held until 12 hours after the last dose of NPH or until 20 hours after the last dose of glargine or detemir. We found from our preliminary study that inadvertent overlaps in long‐acting insulin were one cause of hypoglycemia. We compared differences between groups in the final ED BG level, frequency of hypoglycemia, and ED length of stay (LOS).
Patients subsequently admitted to the hospital entered phase 2. During phase 2, INT patients had detemir and premeal aspart titrated by study staff using a predefined protocol (see Supporting Appendix Fig. 2). Detemir was given once daily, 24 hours after the initial ED dose. UC patients had their diabetes managed by medical house staff teams. House staff members have been educated on the Rush inpatient insulin protocol on which the INT protocol was based. The Rush inpatient diabetes protocol is implemented via a single computerized order set in which all patients should receive mealtime insulin using aspart and a basal insulin (glargine or detemir or NPH). We compared differences between groups in the mean admission BG level, mean daily BG level, mean BG level before each meal, hospital LOS, and frequency of hypoglycemic events. Moderate hypoglycemia was defined as a BG between 50 and 69 mg/dL, and severe hypoglycemia was defined as a BG < 50 mg/dL. We also compared the frequency of BG < 60 mg/dL.
The Rush University Medical Center institutional review board approved the study. Statistical analysis was done using SPSS version 11.0. The Student t test was used to determine any significant difference in BG means between the INT and UC groups. The Fisher's exact test or the chi‐square test was used to determine any difference in proportions of hypoglycemic events between INT and UC patients.
Results
Phase 1: Emergency Department
A total of 176 patients were randomized: 87 to the INT group and 89 to the UC group. Baseline characteristics were similar between groups (Table 1). Mean initial ED BG was similar: 300 70 mg/dL for INT patients and 307 82 mg/dL for UC patients. During phase 1, all INT patients were treated with aspart every 2 hours if BG > 200 mg/dL until discharge home or admission to the hospital. They received an initial mean insulin dose of 0.08 0.04 units/kg of subscutaneous aspart. Twenty‐five percent of INT patients received a second dose of aspart, and 3% received a third dose. For UC patients, only 55% received insulin therapy. Aspart was used for all UC patients who received insulin. Of those in the UC group who received insulin, 11% received a second dose for persistent hyperglycemia; none received a third dose. The mean initial ED BG for UC patients who received insulin was 358 73 mg/dL, and they received an initial mean dose of 0.11 0.05 units/kg. UC patients who did not receive insulin had a lower mean initial ED BG, 241 35 mg/dL. The mean final ED BG was 217 71 mg/dL for the INT group and 257 89 mg/dL for the UC group (P < .01; Fig. 1). The mean ED LOS was 30 minutes longer in the INT group (P = .06; Table 1). Sixty INT patients (69%) and 61 UC patients (69%) were admitted to the hospital. Fifty‐six percent of INT patients received the first dose of detemir based on their home insulin dose, and 44% received a weight‐based dose per protocol.
| Intervention (n = 87) | Usual Care (n = 89) | Significance | |
|---|---|---|---|
| |||
| Age (y) | 55 13 | 55 13 | |
| Sex (% male) | 48 | 39 | |
| BMI (kg/m2) | 34 9 | 33 9 | |
| Ethnicity (%) | |||
| African American | 58 | 66 | |
| Hispanic | 24 | 19 | |
| White | 15 | 11 | |
| Other | 3 | 4 | |
| Duration of diabetes (y) | 13 9 | 12 10 | |
| HA1C | 10.4 2.2 | 9.8 2.6 | |
| Insulin treatment at home (%) | 56 | 62 | |
| Presenting complaint/diagnosis (%) | |||
| Cardiac | 20 | 23 | |
| Gastrointestinal | 30 | 23 | |
| Hyperglycemia | 13 | 18 | |
| Infection | 9 | 11 | |
| Initial ED blood glucose (mg/dL) | 300 70 | 307 82 | |
| Final ED blood glucose (mg/dL) | 217 71 | 256 89 | P < .01 |
| ED length of stay (h) | 5.4 1.7 | 4.9 1.9 | P = .06 |
| Patients treated with insulin in ED (%) | 100 | 54 | |
| Initial dose of SQ aspart (units) | 7.9 4.2 | 9.5 4 | |
| ED patients admitted (%) | 69 | 69 | |
| Admission blood glucose (mg/dL) | 184 70 | 224 93 | P < .01 |
| Treatment of hyperglycemia in hospital (%) | |||
| Detemir aspart insulin | 100 | 7 | |
| Glargine aspart insulin | 0 | 36 | |
| NPH aspart insulin | 0 | 34 | |
| Oral agents | 0 | 8 | |
| None | 0 | 15 | |
| Hospital length of stay (days) | 2.7 2.0 | 3.1 1.9 | P = .58 |
Phase 2: Inpatient Setting
In phase 2, mean admission BG was significantly lower in the INT group (184 70 mg/dL) than in the UC group (223 93 mg/dL), P < .01, as a result of aspart given in the ED. The day 1 mean fasting BG for INT patients was 148 54 mg/dL, significantly lower than the day 1 mean fasting BG for UC patients: 212 81 mg/dL (P < .01). The mean fasting BG for the entire hospitalization was significantly lower for INT patients, 135 48 mg/dL, than for UC patients, 185 72 mg/dL (P < .01). During phase 2, all INT patients had detemir and aspart titrated daily per protocol. Treatment of UC patients was as follows: 78.5% with insulin, 8.2% with oral agents, and 11.5% did not receive medication for hyperglycemia. Of those in the UC group who received insulin, 36.0% were treated with lantus/aspart or detemir/aspart, 34.4% with NPH/aspart, 6.5% with lantus or detemir alone, and 1.6% with aspart alone. Overall, 76.9% of UC received basal insulin, and 70.4% received nutritional insulin. Only 47% of UC patients had insulin adjusted on a daily basis despite persistent hyperglycemia. Significant differences were also seen between INT and UC patients in mean prelunch and predinner BG levels, but not in mean bedtime BG level (Fig. 2). Mean daily BG levels for the initial 5 days of inpatient stay were significantly lower in the INT group (P < .01), except for day 5, when only 21 patients remained in the study (Fig. 3). Patient‐day weighted mean glucose was 163 39 mg/dL for INT patients versus 202 39 mg/dL for UC patients (P < .01). On admission, day 1 mean insulin total daily dose (TDD) was 0.65 0.26 units/kg for INT patients and 0.52 0.29 units/kg for UC patients. The final mean TDD was 0.75 0.35 units/kg for INT patients and 0.61 0.38 units/kg for UC patients. Mean hospital LOS was 9.6 hours shorter for INT patients (2.7 2 days) than for UC patients (3.1 1.9 days), P = .58.
Patient Safety: Frequency of Hypoglycemia
The frequency of hypoglycemia is shown in Table 2. During the ED phase, 3 UC patients (3.4%) had a BG < 50 mg/dL, and 2 INT patients (2.3%) had a BG of 67 mg/dL.
| Blood Glucose | Emergency Department (Number of Episodes) | Significance | Inpatient Phase (Patient Stays) | Significance | ||
|---|---|---|---|---|---|---|
| Usual Care | Intervention | Usual Care | Intervention | |||
| < 50 mg/dL | 3 | 0 | P = .50 | 6 | 1 | P = .11 |
| < 60 mg/dL | 3 | 0 | P = .50 | 7 | 8 | P = .98 |
| 5069 mg/dL | 0 | 2 | P = .23 | 6 | 12 | P = .20 |
During the hospital phase, INT patients had 4.3% of patient‐days and UC had 4.5% of patient‐days with any BG < 70 mg/dL. During 12 patient‐stays (20%) in the INT group there was an episode of moderate hypoglycemia, and during 1 patient‐stay (1.7%) there was an episode of severe hypoglycemia. During 6 patient‐stays (9.8%) in the UC group there was an episode of moderate hypoglycemia, and during 6 patient‐stays (9.8%) there was an episode of severe hypoglycemia (Table 2). The odds ratio (OR) for moderate hypoglycemia in the INT group compared with the UC group was 1.93 (95% CI, 0.7‐5.29), but for severe hypoglycemia the OR was 0.15 (95% CI, 0.018‐1.33). Moderate and severe hypoglycemic events in the UC group were split evenly between patients treated with glargine/detemir‐aspart and those treated with NPH‐aspart.
Discussion
This is the first randomized trial comparing the Rush Emergency Department Hyperglycemia Intervention (REDHI) protocol with usual care for the treatment of hyperglycemia in the ED. We believe this may be the first trial to initiate subcutaneous basal insulin therapy in the ED at the time of hospital admission. Initiation of our protocol for type 2 diabetic patients with BG > 200 mg/dL resulted in lower final ED and admission BGs compared with those in the UC group. Although a higher mean initial ED BG of 358 73 mg/dL was required to prompt initiation of insulin therapy for UC patients, 3 experienced severe hypoglycemia. By following the REDHI protocol, ED nurses avoided BG < 50 mg/dL in INT patients. Our first version of the REDHI protocol dosed more insulin than our current version, and we saw excess hypoglycemia.11 With a reduced dosing formula, there was less lowering of BG, but we eliminated all BG < 60 mg/dL. There was a trend toward an increased ED LOS in INT patients compared with UC patients. This may be because of delays in the administration of insulin or the requirement for a final BG check prior to discharge from the ED for INT patients. However, we did not receive feedback from ED nursing that either factor was a significant issue.
During phase 2, we observed improved glycemic control in INT, likely due to two factors: early initiation of basal insulin and protocol driven daily titration of both basal and mealtime insulin. We achieved a mean fasting BG of 148 54 mg/dL in INT the morning after the ED dose of detemir. BG levels in both groups continued to improve each day, but since the admission BG for INT was lower, this group maintained significantly lower BG levels throughout most of the hospitalization. There were also significant differences between groups at different times of day. Basal doses for INT patients were adjusted daily per fasting BG. Scheduled mealtime doses were based on the basal dose; each mealtime aspart dose was a third of the basal detemir dose. Therefore, patients who required larger doses for certain meals may have received less aspart than needed. This may explain why fasting BG control was better than BG control later in the day.
Current Rush guidelines recommend the same insulin doses as those that our intervention used, but patients in the UC group were less likely to have insulin titrated daily. Cook et al found that clinical inertia, or failure of health care providers to initiate or intensify therapy when indicated, is a common problem among medical residents treating inpatients with insulin.15 Reasons for clinical inertia may include unawareness of inpatient glycemic targets, lack of training or confidence in titrating insulin, and concerns regarding hypoglycemia. Our study shows that this is still an operative issue, even after residents have participated in multiple small‐group educational sessions. Details of the Rush inpatient insulin protocol are also on pocket cards distributed to residents. However, fewer than half of UC patients had insulin adjusted appropriately for persistent hyperglycemia. This may be one explanation for the improved control seen in the INT group and underscores the importance of daily dose titrations based on a uniform protocol.
During phase 2, despite improved glycemic control in INT, there was no significant difference in rates of hypoglycemia between the groups. The number of patient‐stays with moderate hypoglycemia was more in the INT group than in the UC group, 12 versus 6, respectively, but not statistically different (P = .20). There was a trend toward fewer patient‐stays with severe hypoglycemia in the INT group than in the UC group, 1 versus 6, respectively (P = .11).
Other studies have described improved inpatient glycemic control without excess hypoglycemia. In the RABBIT 2 trial, institution of a glargine‐glulisine insulin protocol, TTD of 0.4‐5 units/kg, among insulin‐naive inpatients resulted in a mean fasting BG of 147 36 mg/dL and a mean hospital BG of 166 32 mg/dL, with 3% of patient‐stays having a BG < 60 mg/dL.6 In a second trial, detemir‐aspart was compared with NPH‐aspart TTD of 0.4‐5 units/kg.7 Both groups achieved a similar mean fasting BG of 146 mg/dL and a mean hospital BG of 157 mg/dL. However, the rate of hypoglycemia was higher: 29% of patient‐stays overall. In our study, we achieved a mean fasting BG of 135 48 mg/dL and a mean hospital BG of 163 40 mg/dL in the INT group, using a mean initial TTD of 0.65 0.23 units/kg. The frequency of hypoglycemia in this trial, 22% of INT patient‐stays and 20% of UC patient‐stays, was less than that in Umpierrez et al,7 despite a lower mean fasting BG in our current trial. Maynard et al found 16% of patient‐stays and 3% of patient‐days had an episode of BG < 60 mg/dL in a trial of glarginerapid‐acting insulin (0.4‐5 units/kg TTD).12 Schnipper et al found that 6.1% of patient‐days had an episode of BG < 60 mg/dL using either glargine or NPH and a rapid‐acting insulin, TTD 0.6 units/kg.13 Our hypoglycemia rates were higher; however, we defined hypoglycemia as BG < 70 mg/dL, as suggested by the ADA workgroup.14 If we use a cutoff of < 60 mg/dL for hypoglycemia, it occurred in 13.3% of patient‐stays and 4.3% of patient‐days in the INT group, comparable to that in previous studies.
Our study has several limitations. First, this was a single‐center study, and our ED protocol should be tested in other ED settings, both academic and community. Second, although there were trends toward lower rates of severe hypoglycemia in the INT group, the study was underpowered to detect possible significant differences. Third, although ED nurses implemented the study protocol, study staff closely monitored nurses to ensure adherence. Therefore, it is difficult to speculate on protocol adherence under normal circumstances. Successful implementation requires ongoing nursing and medical staff education. A fourth limitation is the absence of patients with type 1 diabetes.
In conclusion we demonstrated that weight‐based subcutaneous aspart insulin therapy begun in the ED, coupled with prompt initiation of a detemir‐aspart insulin protocol, results in rapid correction of hyperglycemia and improved inpatient glycemic control without increasing hypoglycemia. Diabetes is a common comorbidity in patients presenting to the ED that is not uniformly addressed. These patients may present with uncontrolled hyperglycemia or diabetes‐related infections, and prompt, efficacious glucose control is important. The nurse‐driven Rush ED hyperglycemia protocol ensures that hyperglycemia is safely addressed, allowing the ED physician to address more critical issues. By initiating basal insulin in the ED, our protocol allows for a prompt and smooth transition to a basal‐bolus insulin regimen for the inpatient setting.
- ,,, et al.American Association of Clinical Endocrinologists and American Diabetes Association Consensus Statement on Inpatient Glycemic Control.Diabetes Care.2009;32:1119–1131.
- ,,, et al.Management of diabetes and hyperglycemia in hospitals.Diabetes Care.2004;27:553–591.
- ,,,Eliminating inpatient sliding scale insulin: a re‐education project with medical house staff.Diabetes Care.2008;28:1008–1011.
- ,,, et al.Reduction of surgical mortality and morbidity in diabetic patients undergoing cardiac surgery with a combined intravenous and subcutaneous insulin glucose management strategy.Diabetes Care.2007;30:823–828.
- ,,.Comparison of once daily glargine insulin with twice‐daily NPH/Regular insulin for control of hyperglycemia in inpatients after cardiovascular surgery.Diabetes Technol Ther.2006;8:609–616.
- ,,, et al.Randomized study of basal‐bolus insulin therapy in the inpatient management of patients with type 2 diabetes (RABBIT 2 trial).Diabetes Care.2007;30:2181–2186.
- ,,, et al.Comparison of inpatient insulin regimens with detemir plus aspart versus neutral protamine Hagedorn plus regular in medical patients with type 2 diabetes.J Clin Endocrinol Metab.2009;94:564–569.
- ,,,.Once daily insulin glargine vs. six hourly sliding scale regular insulin for control of hyperglycemia after bariatric surgery: a randomized clinical trial.Endocr Pract.2007;13:225–231.
- ,,.Limited communication and management of emergency department hyperglycemia in hospitalized patients.J Hosp Med.2009;4:44–49.
- ,,,.Multicenter survey of emergency physician management and referral for hyperglycemia.J Emerg Med.2010;38:264–272.
- ,,,,Impact of a nurse‐driven subcutaneous insulin protocol: Rush Emergency Department Hyperglycemia Intervention (REDHI).J Emerg Med.2008 [Epub ahead of print].
- ,,,,.Improved inpatient use of basal insulin, reduced hypoglycemia, and improved glycemic control: effect of structured subcutaneous insulin orders and an insulin management algorithm.J Hosp Med.2009;4:3–15.
- ,,,.Effects of a subcutaneous insulin protocol, clinical education, and computerized order set on the quality of inpatient management of hyperglycemia: results of a clinical trial.J Hosp Med.2009;4:16–27.
- ADA Workgroup on Hypoglycemia.Defining and reporting hypoglycemia in diabetes.Diabetes Care.2005;28:1245–1249.
- ,, et al.Diabetes care in hospitalized noncritically ill patients: More evidence for clinical inertia and negative therapeutic momentum.J Hosp Med.2007;2:203–211.
Copyright © 2010 Society of Hospital Medicine
Glycemic Control in Academic Hospitals
Hyperglycemia is a common occurrence in hospitalized patients, with and without a prior diagnosis of diabetes mellitus.13 Estimates of prevalence of diabetes mellitus in hospitalized adult patients range from 12% to 25%.4 Hyperglycemia is a strong predictor of adverse clinical outcome in a range of diseases such as acute stroke, congestive heart failure, community‐acquired pneumonia, and acute myocardial infarction.58 Hyperglycemia is also a risk factor for surgical infection in patients undergoing cardiac surgery.9, 10 A landmark prospective randomized controlled clinical trial by van den Berghe et al.11 demonstrated that tight glucose control (target blood glucose level 80110 mg/dL) with intravenous insulin in critically ill surgical patients led to dramatic reductions in acute renal failure, critical illness polyneuropathy, hospital mortality, and bloodstream infection. Other clinical studies have demonstrated that glycemic control with intravenous insulin improves clinical outcomes and reduces length of stay in patients with diabetes undergoing cardiac surgery.12, 13
Based upon these findings, the American College of Endocrinology (ACE) published recommendations in 2004 for hospital diabetes and metabolic control.14 Similar recommendations for hospital glycemic control have been included in the American Diabetes Association (ADA) guidelines since 2005.15 There is now emerging consensus that use of continuous insulin infusion given through a standardized protocol is the standard of care to control hyperglycemia in critically ill patients.1618 Likewise, use of specific hospital insulin regimens that include basal and short‐acting insulin with appropriate bedside glucose monitoring and avoiding use of sliding scale short‐acting insulin alone has become recognized as the most effective approach for glucose management in hospitalized patients not requiring intravenous insulin.4, 1921
The University HealthSystem Consortium (UHC) is an alliance of 97 academic health centers and 153 of their associated hospitals that conducts benchmarking studies on clinical and operational topics with member academic medical centers and develops new programs to improve quality of care, patient safety, and operational, clinical, and financial performance. In late 2004, UHC launched the Glycemic Control Benchmarking Project to determine the current status of glycemic control in adult patients admitted to academic medical centers, types of treatment employed to control glucose, and operational measures and practices of care for glycemic control in the hospital setting. The goal of the project was to describe contemporary glucose management for the purpose of identifying best practices. The information was later shared with each participating medical center to allow them to better align care delivery with ADA and ACE guidelines. Thirty‐seven academic medical centers agreed to participate and submit patient level data as well as an operational survey of current policies and practices for hospital glycemic control. This report summarizes the key findings from retrospective analyses of hospital and patient‐level data and describes contemporary management of hyperglycemia in academic medical centers.
PATIENTS AND METHODS
To be eligible for the study, hospital patients at each participating medical center had to be 18 years of age, have a 72‐hour or longer length of stay, and be admitted with 1 or more of the following Diagnostic‐related group (DRG) codes: 89 (simple pneumonia/ pleurisy), 109 (coronary artery bypass grafting without catheterization), 127 (heart failure and shock), 143 (chest pain), 209 (joint/limb procedure), 316 (renal failure), 478 (other vascular procedures), or 527 (percutaneous intervention with drug eluting stent without acute myocardial infarction). The DRG codes were selected from analysis of the UHC Clinical Data Base because they were the most common adult medical and surgical admission codes that included diabetes as a secondary diagnosis for academic medical centers and were believed to best represent the majority of hospital admissions. Each participating medical center received a secure electronic listing of their eligible patients discharged between July 1, 2004 and September 30, 2004 from the UHC Clinical Data Base. Each center identified data extractors who were trained via teleconference and received technical and content support by UHC staff. The data were collected by chart review and submitted electronically to UHC from February to April 2005.
For each medical center, patients were screened in reverse chronological order proceeding back in time until the minimum number of 50 eligible cases was obtained or until all potential cases were screened. Although 50 cases was the recommended minimum sample size per site, each medical center was encouraged to submit as many eligible cases as possible. The median number of cases submitted by site was 50 (interquartile range [IQR], 4251). Cases were entered into the study if they met the eligibility criteria and at least one of the following inclusion criteria: (1) two consecutive blood glucose readings >180 mg/dL within a 24hour period, or (2) insulin treatment at any time during the hospitalization. Exclusion criteria included history of pancreatic transplant, pregnancy at time of admission, hospice or palliative care during hospital admission, and patients who received insulin for a reason other than blood glucose control (ie, hyperkalemia). Early in the data collection, DRG 209 was dropped from potential screening due to the low yield of meeting screening criteria for blood glucose readings. Of the 315 cases screened for DRG 209 only 44 met all inclusion criteria and remain in the study population.
A maximum of 3 consecutive days of blood glucose (BG) readings were collected for each patient, referred to as measurement day 1, measurement day 2, and measurement day 3. Measurement day 1 is defined as the day the first of 2 consecutive blood glucose levels >180 mg/dL occurred during the hospitalization or as the first day insulin was administered during the hospitalization, whichever came first; 40.6% of patients had the day of admission as their first measurement day. Glucose measurements were recorded by hour for each measurement day as available, and if more than 1 glucose value was available within a particular hour, only the first result was recorded. Both bedside and laboratory serum glucose values were utilized, and glycosylated hemoglobin (A1C) values were included if they were recorded during the hospitalization or within 30 days prior to admission;22 95.7% of patients had BG results reported for all 3 measurement days. We defined estimated 6 AM glucose for each subject as: the 6 AM glucose if it was available; otherwise the average of the 5 AM and 7 AM glucose values if at least 1 of them was available; otherwise the average of the 4 AM and 8 AM glucose values if at least 1 of them was available. Relevant demographics, medical history, hospitalization details, type and route of insulin administration, and discharge data were also collected. For subcutaneous insulin administration, use of regular, lispro, or aspart insulin was classified as short‐acting insulin; use of neutral protamine Hagedorn (NPH), ultralente, or glargine insulin was classified as long‐acting insulin. For analysis of glycemic control measures, patient‐days in which location or glucose data were not recorded were excluded from analysis. For the analysis comparing subcutaneous versus intravenous insulin treatment on glucose control, patients who received a combination of therapy with subcutaneous and intravenous insulin on the same measurement day were excluded from the analysis (44 patients on day 1, 96 on day 2, and 47 on day 3). For this retrospective analysis, UHC provided a deidentified data set to the authors. The study protocol was reviewed by the Vanderbilt University Institutional Review Board and deemed to be nonhuman subject research since the data set contained no personal or institutional identifiers. Therefore, no informed consent of subjects was required.
Measures of glucose control (median glucose and estimated 6 AM glucose) were analyzed by patient‐day,23 and were compared by a Wilcoxon rank sum test or an analysis of variance, as indicated. P values <0.05 were considered significant. To compare effects of intravenous (IV) insulin, subcutaneous long‐acting short‐acting insulin, and subcutaneous short‐acting insulin use alone on glycemic control, mixed effects linear regression modeling for median glucose and mixed effects logistic regression modeling for hyperglycemia and hypoglycemia were used to adjust for fixed effects of age, gender, diabetes status, all patient refined diagnosis related groups (APR‐DRG) severity of illness score, outpatient diabetes treatment, patient location, admission diagnosis, and random effect of hospital site. Separate regression models were performed for measurement days 2 and 3. Statistical analyses were performed with Stata version 8 (Stata Corporation, College Station, TX), R version 2.1.0 (R Foundation for Statistical Computing, Vienna, Austria;
RESULTS
Thirty‐seven US academic medical centers from 24 states contributed to the analysis. A total of 4,367 cases meeting age, length of stay, and DRG criteria were screened for inclusion in the study; 2,649 (60.7%) screened cases were excluded due to failure to meet inclusion criteria (51%) or presence of exclusionary conditions (9.7%); 1,718 (39.3%) screened cases met all criteria and were included in this analysis. Patient characteristics are summarized in Table 1. A majority of patients (79%) had a documented history of diabetes, and most of these were classified as type 2 diabetes in the hospital record. Of the patients who were classified as having diabetes on admission, 50.8% were on some form of outpatient insulin therapy with or without oral diabetes agents. Patients with a diagnosis of diabetes had a median admission glucose of 158 mg/dL (IQR, 118221), which was significantly higher than the median admission glucose of 119 mg/dL (IQR, 100160) for patients without diabetes (P < 0.001, rank‐sum test).
| |
| n | 1718 |
| Age (years), median (IQR) | 65 (5674) |
| Male | 928 (54) |
| Female | 790 (46) |
| Admission glucose (mg/dL) | 149 (111207) |
| Race/Ethnicity | |
| White | 1048 (61.0) |
| Black | 480 (27.9) |
| Hispanic | 67 (3.9) |
| Other | 123 (7.2) |
| Diabetes history | 1358 (79.0) |
| Type 2 diabetes mellitus | 996 (58.0) |
| Type 1 diabetes mellitus | 128 (7.5) |
| Unspecified/other diabetes mellitus | 234 (13.6) |
| No history of diabetes mellitus | 360 (21.0) |
| Outpatient diabetes treatment | |
| Insulin only | 522 (30.4) |
| Oral agents only | 505 (29.4) |
| Insulin and oral agents | 168 (9.8) |
| No drug therapy | 137 (8.0) |
| Not documented | 26 (1.5) |
| Hospitalization DRG | |
| 127 Heart failure | 443 (25.8) |
| 109 Coronary artery bypass grafting | 389 (22.6) |
| 316 Renal failure | 251 (14.6) |
| 478 Other vascular procedure | 195 (11.4) |
| 89 Pneumonia | 186 (10.8) |
| 527 Percutaneous intervention with stent | 136 (7.9) |
| 143 Chest pain | 74 (4.3) |
| 209 Joint/limb procedure | 44 (2.6) |
| Primary insurer | |
| Medicare | 961 (56.0) |
| Private/commercial | 392 (22.8) |
| Medicaid | 200 (11.6) |
| Government | 88 (5.1) |
| Self‐pay | 67 (3.9) |
| Other/unknown | 10 (0.6) |
To determine overall glycemic control for the cohort, median glucose was calculated for each patient, stratified by diabetes status and location for each measurement day (Table 2). Patient‐days with a location of emergency department (96 patients on day 1, 6 on day 2, and 2 on day 3) and two patients whose location was not defined were excluded from the analysis. Overall, median glucose declined from measurement day 1 to day 3. For patients with diabetes, median glucose was significantly lower in the intensive care unit (ICU) compared to the general ward or intermediate care for measurement days 1 and 2, but not day 3. This difference was more pronounced in patients without diabetes, with median glucose significantly lower in the ICU for all 3 measurement days compared to other locations. As expected, median glucose was lower for patients without diabetes compared to patients with diabetes for all measurement days and locations. Hyperglycemia was common; 867 of 1,718 (50%) patients had at least 1 glucose measurement 180 mg/dL on both days 2 and 3; 18% of all patients had a median glucose 180 mg/dL on all 3 measurement days. Daily 6 AM glucose was the summary glycemic control measure in the clinical trial by van den Berghe et al.,11 with goal glucose of 80 to 110 mg/dL in the intensive treatment group. Since the glycemic target of the American College of Endocrinology Position Statement is <110 mg/dL (based largely on van den Berghe et al.11) we also calculated estimated 6 AM glucose for ICU patient‐days to determine the proportion of patients attaining this target.14 Estimated 6 AM glucose was lower in ICU patients without diabetes compared to those with diabetes. For patients with diabetes, only 20% of patients in the ICU had an estimated 6 AM glucose 110 mg/dL on measurement day 2, and only 24% on day 3. For patients without diabetes, 27% and 25% had an estimated 6 AM glucose 110 mg/dL on days 2 and 3, respectively.
| Measurement by Location | |||
|---|---|---|---|
| Day 1 | Day 2 | Day 3 | |
| |||
| Patients with diabetes | |||
| Estimated 6 AM glucose (mg/dL) | |||
| Intensive care unit | 153.0 (119.0204.0) | 148.0 (118.0183.0) | 144.0 (113.0191.0) |
| n | 167 | 231 | 161 |
| Median glucose (mg/dL) | |||
| General floor | 186.0 (151.0229.0) | 163.0 (131.0210.0) | 161.0 (127.0203.4) |
| n | 681 | 757 | 758 |
| Intermediate care | 193.0 (155.3233.8) | 170.0 (137.0215.5) | 169.0 (137.9215.6) |
| n | 291 | 333 | 348 |
| Intensive care unit | 177.5 (149.6213.6) | 152.5 (128.3187.0) | 156.5 (124.5194.3) |
| n | 294 | 247 | 175 |
| P value* | 0.038 | <0.001 | 0.068 |
| Patients without diabetes | |||
| Estimated 6 AM glucose (mg/dL) | |||
| Intensive care unit | 133.0 (104.5174.0) | 134.0 (109.0169.0) | 128.0 (111.5151.3) |
| n | 98 | 157 | 80 |
| Median glucose (mg/dL) | |||
| General floor | 179.0 (149.5209.5) | 161.3 (131.4188.3) | 143.5 (122.0170.0) |
| n | 91 | 96 | 133 |
| Intermediate care | 168.3 (138.1193.8) | 137.0 (119.8161.5) | 129.3 (116.3145.5) |
| n | 46 | 71 | 86 |
| Intensive care unit | 153.8 (132.9188.8) | 136.5 (120.0157.0) | 129.0 (116.0143.8) |
| n | 218 | 186 | 106 |
| P value* | <0.001 | <0.001 | <0.001 |
For the overall cohort, insulin was the most common treatment for hyperglycemia, with 84.6% of all patients receiving some form of insulin therapy on the second measurement day. On the second day, 30.8% received short‐acting subcutaneous insulin only, 8.2% received intravenous insulin infusion, 22.5% received both short‐acting and long‐acting subcutaneous insulin, 3.9% received oral agents, 23% received some combination of insulin therapies and/or oral agents, and 11.9% received no treatment. To determine the effect of intravenous versus subcutaneous insulin treatment on glycemic control, we compared patients by insulin treatment and location for each measurement day (Table 3). Intravenous insulin was used predominantly in the ICU, and was associated with significantly lower median glucose compared to subcutaneous insulin in both locations for all 3 measurement days. As expected, the average number of glucose measures per patient was significantly higher for those receiving intravenous insulin. Intravenous insulin use in the ICU was associated with a significantly lower number of patients with hyperglycemia, defined as the number who had 1 or more glucose values 180 mg/dL during a given measurement day. Of note, intravenous insulin use in the ICU was associated with a significantly higher proportion of patients who had hypoglycemia (defined as the number of patients who had one or more glucose values <70 mg/dL) compared to subcutaneous insulin only on measurement day 1 (8.1% versus 2.9%; P = 0.021), but not on days 2 (12.7% versus 8.0%; P > 0.05) or 3 (12.7% versus 7.8%; P > 0.05). Severe hypoglycemia, defined as a blood glucose recording <50 mg/dL,24 was rare, and occurred in only 2.8% of all patient days. On measurement day 1, 34 patients had a total of 49 severe hypoglycemic events; on day 2, 54 patients had 68 severe hypoglycemic events; on day 3, 54 patients had 68 severe hypoglycemic events. Only 3 patients had severe hypoglycemic events on all 3 measurement days. Analysis of severe hypoglycemia events stratified by intravenous versus subcutaneous insulin did not show any significant differences for any of the 3 measurement days (data not shown).
| Location/Day | Outcome | Intravenous Insulin | Subcutaneous Insulin | P Value* |
|---|---|---|---|---|
| ||||
| Intensive Care Unit, Day 1 | Patient's glucose, median (mg/dL) | 148.0 | 183.0 | <0.001 |
| Interquartile range | 128.0178.0 | 154.8211.0 | ||
| Hypoglycemic patients, n (%) | 16 (8.1) | 6 (2.9) | 0.021 | |
| Hyperglycemic patients, n (%) | 130 (66.0) | 175 (85.0) | <0.001 | |
| Average glucose measures/patient | 8.4 | 4.8 | <0.001 | |
| Patients, n | 197 | 206 | ||
| Intermediate/General Ward, Day 1 | Patient's glucose, median (mg/dL) | 152.0 | 186.5 | <0.001 |
| Interquartile range | 131.0164.5 | 150.0230.0 | ||
| Hypoglycemic patients, n (%) | 1 (4.1) | 71 (7.4) | ns | |
| Hyperglycemic patients, n (%) | 18 (78.3) | 808 (83.9) | ns | |
| Average glucose measures/patient | 9.7 | 3.8 | <0.001 | |
| Patients, n | 23 | 962 | ||
| Intensive Care Unit, Day 2 | Patient's glucose, median (mg/dL) | 124.8 | 159.8 | <0.001 |
| Interquartile range | 110.4140.5 | 138.6197.4 | ||
| Hypoglycemic patients, n (%) | 15 (12.7) | 14 (8.0) | ns | |
| Hyperglycemic patients, n (%) | 53 (44.9) | 135 (76.7) | <0.001 | |
| Average glucose measures/patient | 12.5 | 5.3 | <0.001 | |
| Patients, n | 118 | 176 | ||
| Intermediate/General Ward, Day 2 | Patient's glucose, median (mg/dL) | 136.0 | 168.8 | <0.001 |
| Interquartile range | 116.0168.0 | 136.1215.5 | ||
| Hypoglycemic patients, n (%) | 2 (6.7) | 113 (11.3) | ns | |
| Hyperglycemic patients, n (%) | 18 (60.0) | 784 (78.6) | 0.015 | |
| Average glucose measures/patient | 11.0 | 4.6 | <0.001 | |
| Patients, n | 30 | 996 | ||
| Intensive Care Unit, Day 3 | Patient's glucose, median (mg/dL) | 123.5 | 171.0 | <0.001 |
| Interquartile range | 110.0137.1 | 137.3198.5 | ||
| Hypoglycemic patients, n (%) | 7 (12.7) | 11 (7.8) | ns | |
| Hyperglycemic patients, n (%) | 24 (43.6) | 101 (71.1) | <0.001 | |
| Average glucose measures/patient | 11.4 | 4.8 | <0.001 | |
| Patients, n | 54 | 141 | ||
| Intermediate/General Ward, Day 3 | Patient's glucose, median (mg/dL) | 129.8 | 166.0 | <0.001 |
| Interquartile range | 120.5142.3 | 131.5208.0 | ||
| Hypoglycemic patients, n (%) | 3 (13.6) | 104 (9.8) | ns | |
| Hyperglycemic patients, n (%) | 13 (59.1) | 773 (72.7) | ns | |
| Average glucose measures/patient | 10.3 | 4.3 | <0.001 | |
| Patients, n | 22 | 1,055 | ||
We hypothesized that use of subcutaneous long‐acting (basal) insulin (with or without short‐acting insulin) would be associated with superior glucose control compared to use of subcutaneous short‐acting insulin (sliding scale and/or scheduled prandial insulin) alone. We performed an exploratory multivariate regression analysis to compare the effect of IV insulin, long acting subcutaneous insulin short acting insulin, or short acting subcutaneous insulin alone on median glucose, hyperglycemic events (glucose 180 mg/dL), and hypoglycemic events (glucose <70 mg/dL) for days 2 and 3 (Table 4). Compared to short‐acting subcutaneous insulin alone, use of IV insulin but not long‐acting subcutaneous insulin was predictive of lower median glucose for days 2 and 3. Use of long‐acting subcutaneous insulin was not associated with significantly lower odds of hyperglycemic events for days 2 and 3, but was associated with higher odds of hypoglycemic events on day 2 (odds ratio [OR], 1.8; P = 0.01) when compared to short‐acting subcutaneous insulin alone.
| Glucose Control Measure | Intravenous Insulin Infusion | Long‐Acting Subcutaneous Insulin |
|---|---|---|
| ||
| Median glucose | ||
| Day 2, n = 1,297 | 32.0 (45.4 to 18.5); P < 0.001* | 5.1 (13.8 to 3.6); P = 0.25* |
| Day 3, n = 1,251 | 33.0 (48.9 to 17); P < 0.001* | 3.4 (5.2 to 11.9); P = 0.44* |
| Patient has 1 hyperglycemic event | ||
| Day 2, n = 1,298 | 0.4 (0.20.6); P < 0.001 | 0.7 (0.51.1); P = 0.11 |
| Day 3, n = 1,261 | 0.6 (0.31.1); P = 0.11 | 0.8 (0.61.1); P = 0.24 |
| Patient has 1 hypoglycemic event | ||
| Day 2, n = 1,298 | 2.1 (1.04.7); P = 0.07 | 1.8 (1.22.9); P = 0.010 |
| Day 3, n = 1,261 | 4.0 (1.69.8); P = 0.003 | 1.4 (0.92.3); P = 0.13 |
We measured the performance of recommended hospital diabetes care practices (A1C assessment, documentation of diabetes history in the hospital record, admission laboratory glucose assessment, bedside glucose monitoring, recommended insulin therapy)14, 15 for all study patients, and also stratified performance by hospital (Table 5); 98.6% of all patients with a diagnosis of diabetes had physician documentation of their diabetes status recorded in the hospital record, and there was consistently high performance of this by hospital (Table 5); 77% of all patients with a history of diabetes had a laboratory blood glucose result recorded within 8 hours of hospital admission, and 81.3% of patients with a history of diabetes had blood glucose monitored at least 4 times on measurement day 2. Performance by hospital (Table 5) varied widely for glucose monitoring (range, 56.5%95.5% of patients by hospital) and admission laboratory glucose assessment (range, 39.0%97.1% of patients by hospital).
| Diabetes Care Measure | Mean Hospital Performance (%) | Standard Deviation (%) | Range (%) |
|---|---|---|---|
| |||
| Physician documentation of diabetes history in medical record | 98.8 | 2.1 | 91.5100 |
| A1C assessment documented for diabetes patients (measured during hospitalization or within 30 days prior to admission) | 33.7 | 15.4 | 3.162.9 |
| Laboratory glucose assessment within 8 hours of hospital presentation for diabetes patients | 77.0 | 13.4 | 39.097.1 |
| Blood glucose monitoring at least 4 times on second measurement day for diabetes patients | 81.6 | 10.8 | 56.595.5 |
| Percentage of patients receiving insulin therapy who were given short and long‐acting insulin OR IV insulin infusion OR insulin pump therapy on second measurement day | 44.9 | 14.3 | 12.176.5 |
Of all patients, 31% had A1C measurement recorded during their hospitalization or within 30 days prior to admission. There was wide variation in hospital performance of A1C assessment in patients with diabetes (Table 5). Patients with a diagnosis of diabetes had a median A1C of 7.4% (IQR, 6.4%8.9%; n = 473), and those without a diagnosis of diabetes had a median A1C of 5.9% (IQR, 5.6%6.4%; n = 70). Of the patients with a history of diabetes who had A1C recorded, 59% had a value >7%. Of the patients without a history of diabetes who had A1C recorded, 43% had a value >6.0%, suggesting previously undiagnosed diabetes.25
We found wide variation among hospitals (range, 12.1%76.5%) in use of recommended regimens of insulin therapy, defined as short‐acting and long‐acting subcutaneous insulin or IV insulin infusion or insulin pump therapy on second measurement day. Endocrine/diabetes consultation was infrequent, only 9% of all patients were evaluated by an endocrinologist or diabetologist at any time during the hospitalization.
DISCUSSION
In this retrospective analysis of hospitalized patients who had 2 consecutive blood glucose values 180 mg/dL and/or received insulin therapy, hyperglycemia was common and hypoglycemia was infrequent. Use of intravenous insulin was associated with better glucose control, and did not increase the frequency of severe hypoglycemic events (glucose <50 mg/dL). The majority of patients with a history of diabetes had physician documentation in the hospital chart, laboratory serum glucose obtained within 8 hours of hospital admission, and at least 4 blood glucose determinations on the second measurement day.
Only 35% of patients with diabetes had an A1C measurement and of these almost 60% had an A1C level >7%. Though the A1C may not greatly affect acute glucose management in the hospital setting, it does identify patients that may require intensification of diabetes therapy at hospital discharge and coordination of outpatient follow‐up. A report of a UHC clinical benchmarking project of ambulatory diabetes care in academic medical centers demonstrated high rates of diagnostic testing, but only 34% of patients were at the A1C goal, and only 40% of patients above the A1C goal had adjustment of their diabetes regimen at their last clinic visit.26 In a retrospective study of patients with diabetes mellitus admitted to an academic teaching hospital, only 20% of discharges indicated a plan for diabetes follow‐up.27 Thus, intensification of antihyperglycemic therapy and formulation of a diabetes follow‐up plan on hospital discharge in those patients with A1C >7% represents an opportunity to improve glycemic control in the ambulatory setting. Also, measurement of A1C can be used for diabetes case‐finding in hospitalized patients with hyperglycemia.25 Previously unrecognized diabetes is a common finding in patients admitted with cardiovascular disease. In a study of patients admitted with myocardial infarction, 25% were found to have previously undiagnosed diabetes.28 Hospital patients with hyperglycemia but without a prior diagnosis of diabetes who have an elevation of A1C >6.0% can be identified as at‐risk for diabetes and postdischarge glucose evaluation can be arranged.
The target of maintaining all glucose values 180 mg/dL recommended in the 20052007 American Diabetes Association guidelines for hospital diabetes management was not commonly achieved, with over 70% of patients who received subcutaneous insulin therapy having 1 or more glucose values >180 on all 3 measurement days, regardless of patient location.15 The target of maintaining critically ill patients as close to 110 mg/dL as possible was also difficult to achieve, with only 25% of ICU patients having an estimated 6 AM glucose <110 mg/dL on measurement day 3. A prospective cohort study of 107 inpatients with diabetes at Brigham and Women's Hospital showed a 76% prevalence of patients with at least one BG >180 mg/dL.29 In that study, 90% of patients had a sliding‐scale order, 36% received an oral diabetes agent, and 43% received basal insulin at some time during hospitalization. A recently published analysis by Wexler et al.30 compiled data of hospitalized patients with diabetes from an earlier 2003 UHC Diabetes Benchmarking Project (n = 274) and patients from 15 not‐for‐profit member hospitals of VHA, Incorporated (n = 725) to examine the prevalence of hyperglycemia and hypoglycemia. Hyperglycemia (defined as a single BG value >200 mg/dL) was common, occurring in 77% of patients in the UHC cohort and 76% in the VHA, Inc. cohort. This was comparable to our findings that 76.7% of ICU patients and 78.6% of ward patients treated with subcutaneous insulin had 1 or more BG values 180 mg/dL on measurement day 2. Wexler et al.30 also determined that use of basal insulin was associated with a higher prevalence of hyperglycemia and hypoglycemia in their study. Our regression analysis finding that long‐acting (basal) insulin use was not associated with improvement in glycemic control is consistent with the findings of the aforementioned study. There are a number of potential explanations for this: (1) underdosing of basal insulin or lack of adequate prandial insulin coverage for nutritional intake; (2) lack of effective titration in response to hyperglycemia; and (3) variation in the ordering and administration of basal insulin at different hospital sites.
Use of both manual and computerized IV insulin protocols has been shown to provide effective glucose control in critically ill patients.1618 Though intravenous insulin use was associated with better overall glucose control in our study; only about 50% of ICU patients received it on measurement day 1. A recent prospective randomized clinical trial demonstrated superior glycemic control in noncritically ill hospitalized patients with type 2 diabetes with basal/bolus insulin therapy compared to sliding scale insulin alone.31 Use of basal/bolus insulin regimens as part of a comprehensive hospital diabetes management program has been shown to improve glycemic control in an academic medical center.20 Therefore, we do not believe that our regression analysis findings invalidate the concept of basal/bolus insulin for inpatients with hyperglycemia, but rather indicate the need for more research into subcutaneous insulin regimens and hospital care practices that lead to improved glucose control. We found wide variation in hospital use of basal/bolus insulin regimens. Overall only 22.5% of all patients on the second measurement day received both short‐acting and long‐acting subcutaneous insulin, compared to 30.8% who received short‐acting subcutaneous insulin only. A recent consensus statement on inpatient glycemic control by the American College of Endocrinology and American Diabetes Association highlighted the systematic barriers to improved glycemic control in hospitals, such as inadequate knowledge of diabetes management techniques, fear of hypoglycemia, and skepticism about benefits of tighter glucose control.32
There are some important limitations to this study. The data are retrospective and only a limited number of hospital days and clinical variables could be assessed for each patient. As indicated in Table 3, there were significant differences in the frequency of glucose measurement depending on treatment, which can potentially bias estimated prevalence of hyperglycemia and hypoglycemia. We did not have a practical method to assess nutritional status or the adequacy of insulin dosing over time for each patient. We also could not assess the association of glycemic control on clinical outcomes such as hospital mortality or infection rates. Since this study was exclusively in academic medical centers, the generalization of findings to community‐based medical centers may be limited. The risk‐benefit of tight glycemic control in medical ICU patients based on clinical trial evidence has been unclear, and there is not broad agreement among clinicians on the recommended target for glycemic control in this group.3335 When we analyzed glycemic control in ICU patients we did not have a practical method to control for type of ICU and variations in individual ICU glycemic control targets. We recognize that the 2004 American College of Endocrinology recommendation of maintaining glucose 110 mg/dL may not be appropriate for all critically ill patients.14 Finally, clinical trial data are lacking on the effect of tight glucose control on major clinical outcomes for noncritically ill hospital patients. This has led to significant controversy regarding glycemic targets for different subgroups of hospitalized patients.34, 36
In summary, we found a high prevalence of persistent hyperglycemia in this large cohort of hospitalized patients, and hypoglycemia was infrequent. Use of IV insulin was associated with improvement in glycemic control, but was used in less than half of ICU patients. There was wide variation in hospital performance of recommended diabetes care measures. Opportunities to improve care in academic medical centers include expanded use of intravenous and subcutaneous basal/bolus insulin protocols and increased frequency of A1C testing.
- ,,, et al.Effects of admission hyperglycemia on mortality and costs in acute ischemic stroke.Neurology.2002;59:67–71.
- ,,,,,.Hyperglycemia: an independent marker of in‐hospital mortality in patients with undiagnosed diabetes.J Clin Endocrinol Metab.2002;87:978–982.
- ,,,,.Unrecognized diabetes among hospitalized patients.Diabetes Care.1998;21:246–249.
- ,,, et al.Management of diabetes and hyperglycemia in hospitals.Diabetes Care.2004;27:553–591.
- ,,.Admission plasma glucose. Independent risk factor for long‐term prognosis after myocardial infarction even in nondiabetic patients.Diabetes Care.1999;22:1827–1831.
- ,,,,.Stress hyperglycemia and prognosis of stroke in nondiabetic and diabetic patients: a systematic overview.Stroke.2001;32:2426–2432.
- ,,,.Stress hyperglycaemia and increased risk of death after myocardial infarction in patients with and without diabetes: a systematic overview.Lancet.2000;355:773–778.
- ,,,,,.The relation between hyperglycemia and outcomes in 2,471 patients admitted to the hospital with community‐acquired pneumonia.Diabetes Care.2005;28:810–815.
- ,,, et al.Modifiable risk factors associated with deep sternal site infection after coronary artery bypass grafting.J Thorac Cardiovasc Surg.2000;119:108–114.
- ,,,,.The association of diabetes and glucose control with surgical‐site infections among cardiothoracic surgery patients.Infect Control Hosp Epidemiol.2001;22:607–612.
- ,,, et al.Intensive insulin therapy in the critically ill patients.N Engl J Med.2001;345:1359–1367.
- ,,,,,.Tight glycemic control in diabetic coronary artery bypass graft patients improves perioperative outcomes and decreases recurrent ischemic events.Circulation.2004;109:1497–1502.
- ,,.Effect of hyperglycemia and continuous intravenous insulin infusions on outcomes of cardiac surgical procedures: the Portland Diabetic Project.Endocr Pract.2004;10(Suppl 2):21–33.
- ,,, et al.American College of Endocrinology position statement on inpatient diabetes and metabolic control.Endocr Pract.2004;10(Suppl 2):4–9.
- American Diabetes Association.Standards of medical care in diabetes.Diabetes Care.2005;28(Suppl 1):S4–S36.
- ,,, et al.Implementation of a safe and effective insulin infusion protocol in a medical intensive care unit.Diabetes Care.2004;27:461–467.
- ,,,,.Use of a computerized guideline for glucose regulation in the intensive care unit improved both guideline adherence and glucose regulation.J Am Med Inform Assoc.2005;12:172–180.
- ,,, et al.Computer‐based insulin infusion protocol improves glycemia control over manual protocol.J Am Med Inform Assoc.2007;14:278–287.
- ,,,,.Management of diabetes mellitus in hospitalized patients: efficiency and effectiveness of sliding‐scale insulin therapy.Pharmacotherapy.2006;26:1421–1432.
- ,,,.Eliminating inpatient sliding‐scale insulin: a reeducation project with medical house staff.Diabetes Care.2005;28:1008–1011.
- ,,.70/30 insulin algorithm versus sliding scale insulin.Ann Pharmacother.2005;39:1606–1610.
- ,,,.Glucose measurement: confounding issues in setting targets for inpatient management.Diabetes Care.2007;30:403–409.
- ,,, et al.“Glucometrics”—assessing the quality of inpatient glucose management.Diabetes Technol Ther.2006;8:560–569.
- American Diabetes Association.Hospital admission guidelines for diabetes.Diabetes Care.2004;27(Suppl 1):S103.
- ,,,,,,.Utility of HbA(1c) levels for diabetes case finding in hospitalized patients with hyperglycemia.Diabetes Care.2003;26:1064–1068.
- ,,.Quality of diabetes care in U.S. academic medical centers: low rates of medical regimen change.Diabetes Care.2005;28:337–442.
- ,,, et al.Diabetes care in the hospital: is there clinical inertia?J Hosp Med.2006;1:151–160.
- ,,, et al.Glucose metabolism in patients with acute myocardial infarction and no previous diagnosis of diabetes mellitus: a prospective study.Lancet.2002;359:2140–2144.
- ,,,,.Inpatient management of diabetes and hyperglycemia among general medicine patients at a large teaching hospital.J Hosp Med.2006;1:145–150.
- ,,,,.Prevalence of hyper‐ and hypoglycemia among inpatients with diabetes: a national survey of 44 U.S. hospitals.Diabetes Care.2007;30:367–369.
- ,,, et al.Randomized study of basal‐bolus insulin therapy in the inpatient management of patients with type 2 diabetes (RABBIT 2 trial).Diabetes Care.2007;30:2181–2186.
- The ACE/ADA Task Force on Inpatient Diabetes.American College of Endocrinology and American Diabetes Association Consensus Statement on Inpatient Diabetes and Glycemic Control: a call to action.Diabetes Care.2006;29:1955–1962.
- ,,, et al.Intensive insulin therapy in the medical ICU.N Engl J Med.2006;354:449–461.
- ,,.Tight blood glucose control with insulin in the ICU: facts and controversies.Chest.2007;132:268–278.
- ,,, et al.Intensive insulin therapy and pentastarch resuscitation in severe sepsis.NEngl J Med.2008;358:125–139.
- ,.Counterpoint: Inpatient glucose management: a premature call to arms?Diabetes Care.2005;28:976–979.
Hyperglycemia is a common occurrence in hospitalized patients, with and without a prior diagnosis of diabetes mellitus.13 Estimates of prevalence of diabetes mellitus in hospitalized adult patients range from 12% to 25%.4 Hyperglycemia is a strong predictor of adverse clinical outcome in a range of diseases such as acute stroke, congestive heart failure, community‐acquired pneumonia, and acute myocardial infarction.58 Hyperglycemia is also a risk factor for surgical infection in patients undergoing cardiac surgery.9, 10 A landmark prospective randomized controlled clinical trial by van den Berghe et al.11 demonstrated that tight glucose control (target blood glucose level 80110 mg/dL) with intravenous insulin in critically ill surgical patients led to dramatic reductions in acute renal failure, critical illness polyneuropathy, hospital mortality, and bloodstream infection. Other clinical studies have demonstrated that glycemic control with intravenous insulin improves clinical outcomes and reduces length of stay in patients with diabetes undergoing cardiac surgery.12, 13
Based upon these findings, the American College of Endocrinology (ACE) published recommendations in 2004 for hospital diabetes and metabolic control.14 Similar recommendations for hospital glycemic control have been included in the American Diabetes Association (ADA) guidelines since 2005.15 There is now emerging consensus that use of continuous insulin infusion given through a standardized protocol is the standard of care to control hyperglycemia in critically ill patients.1618 Likewise, use of specific hospital insulin regimens that include basal and short‐acting insulin with appropriate bedside glucose monitoring and avoiding use of sliding scale short‐acting insulin alone has become recognized as the most effective approach for glucose management in hospitalized patients not requiring intravenous insulin.4, 1921
The University HealthSystem Consortium (UHC) is an alliance of 97 academic health centers and 153 of their associated hospitals that conducts benchmarking studies on clinical and operational topics with member academic medical centers and develops new programs to improve quality of care, patient safety, and operational, clinical, and financial performance. In late 2004, UHC launched the Glycemic Control Benchmarking Project to determine the current status of glycemic control in adult patients admitted to academic medical centers, types of treatment employed to control glucose, and operational measures and practices of care for glycemic control in the hospital setting. The goal of the project was to describe contemporary glucose management for the purpose of identifying best practices. The information was later shared with each participating medical center to allow them to better align care delivery with ADA and ACE guidelines. Thirty‐seven academic medical centers agreed to participate and submit patient level data as well as an operational survey of current policies and practices for hospital glycemic control. This report summarizes the key findings from retrospective analyses of hospital and patient‐level data and describes contemporary management of hyperglycemia in academic medical centers.
PATIENTS AND METHODS
To be eligible for the study, hospital patients at each participating medical center had to be 18 years of age, have a 72‐hour or longer length of stay, and be admitted with 1 or more of the following Diagnostic‐related group (DRG) codes: 89 (simple pneumonia/ pleurisy), 109 (coronary artery bypass grafting without catheterization), 127 (heart failure and shock), 143 (chest pain), 209 (joint/limb procedure), 316 (renal failure), 478 (other vascular procedures), or 527 (percutaneous intervention with drug eluting stent without acute myocardial infarction). The DRG codes were selected from analysis of the UHC Clinical Data Base because they were the most common adult medical and surgical admission codes that included diabetes as a secondary diagnosis for academic medical centers and were believed to best represent the majority of hospital admissions. Each participating medical center received a secure electronic listing of their eligible patients discharged between July 1, 2004 and September 30, 2004 from the UHC Clinical Data Base. Each center identified data extractors who were trained via teleconference and received technical and content support by UHC staff. The data were collected by chart review and submitted electronically to UHC from February to April 2005.
For each medical center, patients were screened in reverse chronological order proceeding back in time until the minimum number of 50 eligible cases was obtained or until all potential cases were screened. Although 50 cases was the recommended minimum sample size per site, each medical center was encouraged to submit as many eligible cases as possible. The median number of cases submitted by site was 50 (interquartile range [IQR], 4251). Cases were entered into the study if they met the eligibility criteria and at least one of the following inclusion criteria: (1) two consecutive blood glucose readings >180 mg/dL within a 24hour period, or (2) insulin treatment at any time during the hospitalization. Exclusion criteria included history of pancreatic transplant, pregnancy at time of admission, hospice or palliative care during hospital admission, and patients who received insulin for a reason other than blood glucose control (ie, hyperkalemia). Early in the data collection, DRG 209 was dropped from potential screening due to the low yield of meeting screening criteria for blood glucose readings. Of the 315 cases screened for DRG 209 only 44 met all inclusion criteria and remain in the study population.
A maximum of 3 consecutive days of blood glucose (BG) readings were collected for each patient, referred to as measurement day 1, measurement day 2, and measurement day 3. Measurement day 1 is defined as the day the first of 2 consecutive blood glucose levels >180 mg/dL occurred during the hospitalization or as the first day insulin was administered during the hospitalization, whichever came first; 40.6% of patients had the day of admission as their first measurement day. Glucose measurements were recorded by hour for each measurement day as available, and if more than 1 glucose value was available within a particular hour, only the first result was recorded. Both bedside and laboratory serum glucose values were utilized, and glycosylated hemoglobin (A1C) values were included if they were recorded during the hospitalization or within 30 days prior to admission;22 95.7% of patients had BG results reported for all 3 measurement days. We defined estimated 6 AM glucose for each subject as: the 6 AM glucose if it was available; otherwise the average of the 5 AM and 7 AM glucose values if at least 1 of them was available; otherwise the average of the 4 AM and 8 AM glucose values if at least 1 of them was available. Relevant demographics, medical history, hospitalization details, type and route of insulin administration, and discharge data were also collected. For subcutaneous insulin administration, use of regular, lispro, or aspart insulin was classified as short‐acting insulin; use of neutral protamine Hagedorn (NPH), ultralente, or glargine insulin was classified as long‐acting insulin. For analysis of glycemic control measures, patient‐days in which location or glucose data were not recorded were excluded from analysis. For the analysis comparing subcutaneous versus intravenous insulin treatment on glucose control, patients who received a combination of therapy with subcutaneous and intravenous insulin on the same measurement day were excluded from the analysis (44 patients on day 1, 96 on day 2, and 47 on day 3). For this retrospective analysis, UHC provided a deidentified data set to the authors. The study protocol was reviewed by the Vanderbilt University Institutional Review Board and deemed to be nonhuman subject research since the data set contained no personal or institutional identifiers. Therefore, no informed consent of subjects was required.
Measures of glucose control (median glucose and estimated 6 AM glucose) were analyzed by patient‐day,23 and were compared by a Wilcoxon rank sum test or an analysis of variance, as indicated. P values <0.05 were considered significant. To compare effects of intravenous (IV) insulin, subcutaneous long‐acting short‐acting insulin, and subcutaneous short‐acting insulin use alone on glycemic control, mixed effects linear regression modeling for median glucose and mixed effects logistic regression modeling for hyperglycemia and hypoglycemia were used to adjust for fixed effects of age, gender, diabetes status, all patient refined diagnosis related groups (APR‐DRG) severity of illness score, outpatient diabetes treatment, patient location, admission diagnosis, and random effect of hospital site. Separate regression models were performed for measurement days 2 and 3. Statistical analyses were performed with Stata version 8 (Stata Corporation, College Station, TX), R version 2.1.0 (R Foundation for Statistical Computing, Vienna, Austria;
RESULTS
Thirty‐seven US academic medical centers from 24 states contributed to the analysis. A total of 4,367 cases meeting age, length of stay, and DRG criteria were screened for inclusion in the study; 2,649 (60.7%) screened cases were excluded due to failure to meet inclusion criteria (51%) or presence of exclusionary conditions (9.7%); 1,718 (39.3%) screened cases met all criteria and were included in this analysis. Patient characteristics are summarized in Table 1. A majority of patients (79%) had a documented history of diabetes, and most of these were classified as type 2 diabetes in the hospital record. Of the patients who were classified as having diabetes on admission, 50.8% were on some form of outpatient insulin therapy with or without oral diabetes agents. Patients with a diagnosis of diabetes had a median admission glucose of 158 mg/dL (IQR, 118221), which was significantly higher than the median admission glucose of 119 mg/dL (IQR, 100160) for patients without diabetes (P < 0.001, rank‐sum test).
| |
| n | 1718 |
| Age (years), median (IQR) | 65 (5674) |
| Male | 928 (54) |
| Female | 790 (46) |
| Admission glucose (mg/dL) | 149 (111207) |
| Race/Ethnicity | |
| White | 1048 (61.0) |
| Black | 480 (27.9) |
| Hispanic | 67 (3.9) |
| Other | 123 (7.2) |
| Diabetes history | 1358 (79.0) |
| Type 2 diabetes mellitus | 996 (58.0) |
| Type 1 diabetes mellitus | 128 (7.5) |
| Unspecified/other diabetes mellitus | 234 (13.6) |
| No history of diabetes mellitus | 360 (21.0) |
| Outpatient diabetes treatment | |
| Insulin only | 522 (30.4) |
| Oral agents only | 505 (29.4) |
| Insulin and oral agents | 168 (9.8) |
| No drug therapy | 137 (8.0) |
| Not documented | 26 (1.5) |
| Hospitalization DRG | |
| 127 Heart failure | 443 (25.8) |
| 109 Coronary artery bypass grafting | 389 (22.6) |
| 316 Renal failure | 251 (14.6) |
| 478 Other vascular procedure | 195 (11.4) |
| 89 Pneumonia | 186 (10.8) |
| 527 Percutaneous intervention with stent | 136 (7.9) |
| 143 Chest pain | 74 (4.3) |
| 209 Joint/limb procedure | 44 (2.6) |
| Primary insurer | |
| Medicare | 961 (56.0) |
| Private/commercial | 392 (22.8) |
| Medicaid | 200 (11.6) |
| Government | 88 (5.1) |
| Self‐pay | 67 (3.9) |
| Other/unknown | 10 (0.6) |
To determine overall glycemic control for the cohort, median glucose was calculated for each patient, stratified by diabetes status and location for each measurement day (Table 2). Patient‐days with a location of emergency department (96 patients on day 1, 6 on day 2, and 2 on day 3) and two patients whose location was not defined were excluded from the analysis. Overall, median glucose declined from measurement day 1 to day 3. For patients with diabetes, median glucose was significantly lower in the intensive care unit (ICU) compared to the general ward or intermediate care for measurement days 1 and 2, but not day 3. This difference was more pronounced in patients without diabetes, with median glucose significantly lower in the ICU for all 3 measurement days compared to other locations. As expected, median glucose was lower for patients without diabetes compared to patients with diabetes for all measurement days and locations. Hyperglycemia was common; 867 of 1,718 (50%) patients had at least 1 glucose measurement 180 mg/dL on both days 2 and 3; 18% of all patients had a median glucose 180 mg/dL on all 3 measurement days. Daily 6 AM glucose was the summary glycemic control measure in the clinical trial by van den Berghe et al.,11 with goal glucose of 80 to 110 mg/dL in the intensive treatment group. Since the glycemic target of the American College of Endocrinology Position Statement is <110 mg/dL (based largely on van den Berghe et al.11) we also calculated estimated 6 AM glucose for ICU patient‐days to determine the proportion of patients attaining this target.14 Estimated 6 AM glucose was lower in ICU patients without diabetes compared to those with diabetes. For patients with diabetes, only 20% of patients in the ICU had an estimated 6 AM glucose 110 mg/dL on measurement day 2, and only 24% on day 3. For patients without diabetes, 27% and 25% had an estimated 6 AM glucose 110 mg/dL on days 2 and 3, respectively.
| Measurement by Location | |||
|---|---|---|---|
| Day 1 | Day 2 | Day 3 | |
| |||
| Patients with diabetes | |||
| Estimated 6 AM glucose (mg/dL) | |||
| Intensive care unit | 153.0 (119.0204.0) | 148.0 (118.0183.0) | 144.0 (113.0191.0) |
| n | 167 | 231 | 161 |
| Median glucose (mg/dL) | |||
| General floor | 186.0 (151.0229.0) | 163.0 (131.0210.0) | 161.0 (127.0203.4) |
| n | 681 | 757 | 758 |
| Intermediate care | 193.0 (155.3233.8) | 170.0 (137.0215.5) | 169.0 (137.9215.6) |
| n | 291 | 333 | 348 |
| Intensive care unit | 177.5 (149.6213.6) | 152.5 (128.3187.0) | 156.5 (124.5194.3) |
| n | 294 | 247 | 175 |
| P value* | 0.038 | <0.001 | 0.068 |
| Patients without diabetes | |||
| Estimated 6 AM glucose (mg/dL) | |||
| Intensive care unit | 133.0 (104.5174.0) | 134.0 (109.0169.0) | 128.0 (111.5151.3) |
| n | 98 | 157 | 80 |
| Median glucose (mg/dL) | |||
| General floor | 179.0 (149.5209.5) | 161.3 (131.4188.3) | 143.5 (122.0170.0) |
| n | 91 | 96 | 133 |
| Intermediate care | 168.3 (138.1193.8) | 137.0 (119.8161.5) | 129.3 (116.3145.5) |
| n | 46 | 71 | 86 |
| Intensive care unit | 153.8 (132.9188.8) | 136.5 (120.0157.0) | 129.0 (116.0143.8) |
| n | 218 | 186 | 106 |
| P value* | <0.001 | <0.001 | <0.001 |
For the overall cohort, insulin was the most common treatment for hyperglycemia, with 84.6% of all patients receiving some form of insulin therapy on the second measurement day. On the second day, 30.8% received short‐acting subcutaneous insulin only, 8.2% received intravenous insulin infusion, 22.5% received both short‐acting and long‐acting subcutaneous insulin, 3.9% received oral agents, 23% received some combination of insulin therapies and/or oral agents, and 11.9% received no treatment. To determine the effect of intravenous versus subcutaneous insulin treatment on glycemic control, we compared patients by insulin treatment and location for each measurement day (Table 3). Intravenous insulin was used predominantly in the ICU, and was associated with significantly lower median glucose compared to subcutaneous insulin in both locations for all 3 measurement days. As expected, the average number of glucose measures per patient was significantly higher for those receiving intravenous insulin. Intravenous insulin use in the ICU was associated with a significantly lower number of patients with hyperglycemia, defined as the number who had 1 or more glucose values 180 mg/dL during a given measurement day. Of note, intravenous insulin use in the ICU was associated with a significantly higher proportion of patients who had hypoglycemia (defined as the number of patients who had one or more glucose values <70 mg/dL) compared to subcutaneous insulin only on measurement day 1 (8.1% versus 2.9%; P = 0.021), but not on days 2 (12.7% versus 8.0%; P > 0.05) or 3 (12.7% versus 7.8%; P > 0.05). Severe hypoglycemia, defined as a blood glucose recording <50 mg/dL,24 was rare, and occurred in only 2.8% of all patient days. On measurement day 1, 34 patients had a total of 49 severe hypoglycemic events; on day 2, 54 patients had 68 severe hypoglycemic events; on day 3, 54 patients had 68 severe hypoglycemic events. Only 3 patients had severe hypoglycemic events on all 3 measurement days. Analysis of severe hypoglycemia events stratified by intravenous versus subcutaneous insulin did not show any significant differences for any of the 3 measurement days (data not shown).
| Location/Day | Outcome | Intravenous Insulin | Subcutaneous Insulin | P Value* |
|---|---|---|---|---|
| ||||
| Intensive Care Unit, Day 1 | Patient's glucose, median (mg/dL) | 148.0 | 183.0 | <0.001 |
| Interquartile range | 128.0178.0 | 154.8211.0 | ||
| Hypoglycemic patients, n (%) | 16 (8.1) | 6 (2.9) | 0.021 | |
| Hyperglycemic patients, n (%) | 130 (66.0) | 175 (85.0) | <0.001 | |
| Average glucose measures/patient | 8.4 | 4.8 | <0.001 | |
| Patients, n | 197 | 206 | ||
| Intermediate/General Ward, Day 1 | Patient's glucose, median (mg/dL) | 152.0 | 186.5 | <0.001 |
| Interquartile range | 131.0164.5 | 150.0230.0 | ||
| Hypoglycemic patients, n (%) | 1 (4.1) | 71 (7.4) | ns | |
| Hyperglycemic patients, n (%) | 18 (78.3) | 808 (83.9) | ns | |
| Average glucose measures/patient | 9.7 | 3.8 | <0.001 | |
| Patients, n | 23 | 962 | ||
| Intensive Care Unit, Day 2 | Patient's glucose, median (mg/dL) | 124.8 | 159.8 | <0.001 |
| Interquartile range | 110.4140.5 | 138.6197.4 | ||
| Hypoglycemic patients, n (%) | 15 (12.7) | 14 (8.0) | ns | |
| Hyperglycemic patients, n (%) | 53 (44.9) | 135 (76.7) | <0.001 | |
| Average glucose measures/patient | 12.5 | 5.3 | <0.001 | |
| Patients, n | 118 | 176 | ||
| Intermediate/General Ward, Day 2 | Patient's glucose, median (mg/dL) | 136.0 | 168.8 | <0.001 |
| Interquartile range | 116.0168.0 | 136.1215.5 | ||
| Hypoglycemic patients, n (%) | 2 (6.7) | 113 (11.3) | ns | |
| Hyperglycemic patients, n (%) | 18 (60.0) | 784 (78.6) | 0.015 | |
| Average glucose measures/patient | 11.0 | 4.6 | <0.001 | |
| Patients, n | 30 | 996 | ||
| Intensive Care Unit, Day 3 | Patient's glucose, median (mg/dL) | 123.5 | 171.0 | <0.001 |
| Interquartile range | 110.0137.1 | 137.3198.5 | ||
| Hypoglycemic patients, n (%) | 7 (12.7) | 11 (7.8) | ns | |
| Hyperglycemic patients, n (%) | 24 (43.6) | 101 (71.1) | <0.001 | |
| Average glucose measures/patient | 11.4 | 4.8 | <0.001 | |
| Patients, n | 54 | 141 | ||
| Intermediate/General Ward, Day 3 | Patient's glucose, median (mg/dL) | 129.8 | 166.0 | <0.001 |
| Interquartile range | 120.5142.3 | 131.5208.0 | ||
| Hypoglycemic patients, n (%) | 3 (13.6) | 104 (9.8) | ns | |
| Hyperglycemic patients, n (%) | 13 (59.1) | 773 (72.7) | ns | |
| Average glucose measures/patient | 10.3 | 4.3 | <0.001 | |
| Patients, n | 22 | 1,055 | ||
We hypothesized that use of subcutaneous long‐acting (basal) insulin (with or without short‐acting insulin) would be associated with superior glucose control compared to use of subcutaneous short‐acting insulin (sliding scale and/or scheduled prandial insulin) alone. We performed an exploratory multivariate regression analysis to compare the effect of IV insulin, long acting subcutaneous insulin short acting insulin, or short acting subcutaneous insulin alone on median glucose, hyperglycemic events (glucose 180 mg/dL), and hypoglycemic events (glucose <70 mg/dL) for days 2 and 3 (Table 4). Compared to short‐acting subcutaneous insulin alone, use of IV insulin but not long‐acting subcutaneous insulin was predictive of lower median glucose for days 2 and 3. Use of long‐acting subcutaneous insulin was not associated with significantly lower odds of hyperglycemic events for days 2 and 3, but was associated with higher odds of hypoglycemic events on day 2 (odds ratio [OR], 1.8; P = 0.01) when compared to short‐acting subcutaneous insulin alone.
| Glucose Control Measure | Intravenous Insulin Infusion | Long‐Acting Subcutaneous Insulin |
|---|---|---|
| ||
| Median glucose | ||
| Day 2, n = 1,297 | 32.0 (45.4 to 18.5); P < 0.001* | 5.1 (13.8 to 3.6); P = 0.25* |
| Day 3, n = 1,251 | 33.0 (48.9 to 17); P < 0.001* | 3.4 (5.2 to 11.9); P = 0.44* |
| Patient has 1 hyperglycemic event | ||
| Day 2, n = 1,298 | 0.4 (0.20.6); P < 0.001 | 0.7 (0.51.1); P = 0.11 |
| Day 3, n = 1,261 | 0.6 (0.31.1); P = 0.11 | 0.8 (0.61.1); P = 0.24 |
| Patient has 1 hypoglycemic event | ||
| Day 2, n = 1,298 | 2.1 (1.04.7); P = 0.07 | 1.8 (1.22.9); P = 0.010 |
| Day 3, n = 1,261 | 4.0 (1.69.8); P = 0.003 | 1.4 (0.92.3); P = 0.13 |
We measured the performance of recommended hospital diabetes care practices (A1C assessment, documentation of diabetes history in the hospital record, admission laboratory glucose assessment, bedside glucose monitoring, recommended insulin therapy)14, 15 for all study patients, and also stratified performance by hospital (Table 5); 98.6% of all patients with a diagnosis of diabetes had physician documentation of their diabetes status recorded in the hospital record, and there was consistently high performance of this by hospital (Table 5); 77% of all patients with a history of diabetes had a laboratory blood glucose result recorded within 8 hours of hospital admission, and 81.3% of patients with a history of diabetes had blood glucose monitored at least 4 times on measurement day 2. Performance by hospital (Table 5) varied widely for glucose monitoring (range, 56.5%95.5% of patients by hospital) and admission laboratory glucose assessment (range, 39.0%97.1% of patients by hospital).
| Diabetes Care Measure | Mean Hospital Performance (%) | Standard Deviation (%) | Range (%) |
|---|---|---|---|
| |||
| Physician documentation of diabetes history in medical record | 98.8 | 2.1 | 91.5100 |
| A1C assessment documented for diabetes patients (measured during hospitalization or within 30 days prior to admission) | 33.7 | 15.4 | 3.162.9 |
| Laboratory glucose assessment within 8 hours of hospital presentation for diabetes patients | 77.0 | 13.4 | 39.097.1 |
| Blood glucose monitoring at least 4 times on second measurement day for diabetes patients | 81.6 | 10.8 | 56.595.5 |
| Percentage of patients receiving insulin therapy who were given short and long‐acting insulin OR IV insulin infusion OR insulin pump therapy on second measurement day | 44.9 | 14.3 | 12.176.5 |
Of all patients, 31% had A1C measurement recorded during their hospitalization or within 30 days prior to admission. There was wide variation in hospital performance of A1C assessment in patients with diabetes (Table 5). Patients with a diagnosis of diabetes had a median A1C of 7.4% (IQR, 6.4%8.9%; n = 473), and those without a diagnosis of diabetes had a median A1C of 5.9% (IQR, 5.6%6.4%; n = 70). Of the patients with a history of diabetes who had A1C recorded, 59% had a value >7%. Of the patients without a history of diabetes who had A1C recorded, 43% had a value >6.0%, suggesting previously undiagnosed diabetes.25
We found wide variation among hospitals (range, 12.1%76.5%) in use of recommended regimens of insulin therapy, defined as short‐acting and long‐acting subcutaneous insulin or IV insulin infusion or insulin pump therapy on second measurement day. Endocrine/diabetes consultation was infrequent, only 9% of all patients were evaluated by an endocrinologist or diabetologist at any time during the hospitalization.
DISCUSSION
In this retrospective analysis of hospitalized patients who had 2 consecutive blood glucose values 180 mg/dL and/or received insulin therapy, hyperglycemia was common and hypoglycemia was infrequent. Use of intravenous insulin was associated with better glucose control, and did not increase the frequency of severe hypoglycemic events (glucose <50 mg/dL). The majority of patients with a history of diabetes had physician documentation in the hospital chart, laboratory serum glucose obtained within 8 hours of hospital admission, and at least 4 blood glucose determinations on the second measurement day.
Only 35% of patients with diabetes had an A1C measurement and of these almost 60% had an A1C level >7%. Though the A1C may not greatly affect acute glucose management in the hospital setting, it does identify patients that may require intensification of diabetes therapy at hospital discharge and coordination of outpatient follow‐up. A report of a UHC clinical benchmarking project of ambulatory diabetes care in academic medical centers demonstrated high rates of diagnostic testing, but only 34% of patients were at the A1C goal, and only 40% of patients above the A1C goal had adjustment of their diabetes regimen at their last clinic visit.26 In a retrospective study of patients with diabetes mellitus admitted to an academic teaching hospital, only 20% of discharges indicated a plan for diabetes follow‐up.27 Thus, intensification of antihyperglycemic therapy and formulation of a diabetes follow‐up plan on hospital discharge in those patients with A1C >7% represents an opportunity to improve glycemic control in the ambulatory setting. Also, measurement of A1C can be used for diabetes case‐finding in hospitalized patients with hyperglycemia.25 Previously unrecognized diabetes is a common finding in patients admitted with cardiovascular disease. In a study of patients admitted with myocardial infarction, 25% were found to have previously undiagnosed diabetes.28 Hospital patients with hyperglycemia but without a prior diagnosis of diabetes who have an elevation of A1C >6.0% can be identified as at‐risk for diabetes and postdischarge glucose evaluation can be arranged.
The target of maintaining all glucose values 180 mg/dL recommended in the 20052007 American Diabetes Association guidelines for hospital diabetes management was not commonly achieved, with over 70% of patients who received subcutaneous insulin therapy having 1 or more glucose values >180 on all 3 measurement days, regardless of patient location.15 The target of maintaining critically ill patients as close to 110 mg/dL as possible was also difficult to achieve, with only 25% of ICU patients having an estimated 6 AM glucose <110 mg/dL on measurement day 3. A prospective cohort study of 107 inpatients with diabetes at Brigham and Women's Hospital showed a 76% prevalence of patients with at least one BG >180 mg/dL.29 In that study, 90% of patients had a sliding‐scale order, 36% received an oral diabetes agent, and 43% received basal insulin at some time during hospitalization. A recently published analysis by Wexler et al.30 compiled data of hospitalized patients with diabetes from an earlier 2003 UHC Diabetes Benchmarking Project (n = 274) and patients from 15 not‐for‐profit member hospitals of VHA, Incorporated (n = 725) to examine the prevalence of hyperglycemia and hypoglycemia. Hyperglycemia (defined as a single BG value >200 mg/dL) was common, occurring in 77% of patients in the UHC cohort and 76% in the VHA, Inc. cohort. This was comparable to our findings that 76.7% of ICU patients and 78.6% of ward patients treated with subcutaneous insulin had 1 or more BG values 180 mg/dL on measurement day 2. Wexler et al.30 also determined that use of basal insulin was associated with a higher prevalence of hyperglycemia and hypoglycemia in their study. Our regression analysis finding that long‐acting (basal) insulin use was not associated with improvement in glycemic control is consistent with the findings of the aforementioned study. There are a number of potential explanations for this: (1) underdosing of basal insulin or lack of adequate prandial insulin coverage for nutritional intake; (2) lack of effective titration in response to hyperglycemia; and (3) variation in the ordering and administration of basal insulin at different hospital sites.
Use of both manual and computerized IV insulin protocols has been shown to provide effective glucose control in critically ill patients.1618 Though intravenous insulin use was associated with better overall glucose control in our study; only about 50% of ICU patients received it on measurement day 1. A recent prospective randomized clinical trial demonstrated superior glycemic control in noncritically ill hospitalized patients with type 2 diabetes with basal/bolus insulin therapy compared to sliding scale insulin alone.31 Use of basal/bolus insulin regimens as part of a comprehensive hospital diabetes management program has been shown to improve glycemic control in an academic medical center.20 Therefore, we do not believe that our regression analysis findings invalidate the concept of basal/bolus insulin for inpatients with hyperglycemia, but rather indicate the need for more research into subcutaneous insulin regimens and hospital care practices that lead to improved glucose control. We found wide variation in hospital use of basal/bolus insulin regimens. Overall only 22.5% of all patients on the second measurement day received both short‐acting and long‐acting subcutaneous insulin, compared to 30.8% who received short‐acting subcutaneous insulin only. A recent consensus statement on inpatient glycemic control by the American College of Endocrinology and American Diabetes Association highlighted the systematic barriers to improved glycemic control in hospitals, such as inadequate knowledge of diabetes management techniques, fear of hypoglycemia, and skepticism about benefits of tighter glucose control.32
There are some important limitations to this study. The data are retrospective and only a limited number of hospital days and clinical variables could be assessed for each patient. As indicated in Table 3, there were significant differences in the frequency of glucose measurement depending on treatment, which can potentially bias estimated prevalence of hyperglycemia and hypoglycemia. We did not have a practical method to assess nutritional status or the adequacy of insulin dosing over time for each patient. We also could not assess the association of glycemic control on clinical outcomes such as hospital mortality or infection rates. Since this study was exclusively in academic medical centers, the generalization of findings to community‐based medical centers may be limited. The risk‐benefit of tight glycemic control in medical ICU patients based on clinical trial evidence has been unclear, and there is not broad agreement among clinicians on the recommended target for glycemic control in this group.3335 When we analyzed glycemic control in ICU patients we did not have a practical method to control for type of ICU and variations in individual ICU glycemic control targets. We recognize that the 2004 American College of Endocrinology recommendation of maintaining glucose 110 mg/dL may not be appropriate for all critically ill patients.14 Finally, clinical trial data are lacking on the effect of tight glucose control on major clinical outcomes for noncritically ill hospital patients. This has led to significant controversy regarding glycemic targets for different subgroups of hospitalized patients.34, 36
In summary, we found a high prevalence of persistent hyperglycemia in this large cohort of hospitalized patients, and hypoglycemia was infrequent. Use of IV insulin was associated with improvement in glycemic control, but was used in less than half of ICU patients. There was wide variation in hospital performance of recommended diabetes care measures. Opportunities to improve care in academic medical centers include expanded use of intravenous and subcutaneous basal/bolus insulin protocols and increased frequency of A1C testing.
- ,,, et al.Effects of admission hyperglycemia on mortality and costs in acute ischemic stroke.Neurology.2002;59:67–71.
- ,,,,,.Hyperglycemia: an independent marker of in‐hospital mortality in patients with undiagnosed diabetes.J Clin Endocrinol Metab.2002;87:978–982.
- ,,,,.Unrecognized diabetes among hospitalized patients.Diabetes Care.1998;21:246–249.
- ,,, et al.Management of diabetes and hyperglycemia in hospitals.Diabetes Care.2004;27:553–591.
- ,,.Admission plasma glucose. Independent risk factor for long‐term prognosis after myocardial infarction even in nondiabetic patients.Diabetes Care.1999;22:1827–1831.
- ,,,,.Stress hyperglycemia and prognosis of stroke in nondiabetic and diabetic patients: a systematic overview.Stroke.2001;32:2426–2432.
- ,,,.Stress hyperglycaemia and increased risk of death after myocardial infarction in patients with and without diabetes: a systematic overview.Lancet.2000;355:773–778.
- ,,,,,.The relation between hyperglycemia and outcomes in 2,471 patients admitted to the hospital with community‐acquired pneumonia.Diabetes Care.2005;28:810–815.
- ,,, et al.Modifiable risk factors associated with deep sternal site infection after coronary artery bypass grafting.J Thorac Cardiovasc Surg.2000;119:108–114.
- ,,,,.The association of diabetes and glucose control with surgical‐site infections among cardiothoracic surgery patients.Infect Control Hosp Epidemiol.2001;22:607–612.
- ,,, et al.Intensive insulin therapy in the critically ill patients.N Engl J Med.2001;345:1359–1367.
- ,,,,,.Tight glycemic control in diabetic coronary artery bypass graft patients improves perioperative outcomes and decreases recurrent ischemic events.Circulation.2004;109:1497–1502.
- ,,.Effect of hyperglycemia and continuous intravenous insulin infusions on outcomes of cardiac surgical procedures: the Portland Diabetic Project.Endocr Pract.2004;10(Suppl 2):21–33.
- ,,, et al.American College of Endocrinology position statement on inpatient diabetes and metabolic control.Endocr Pract.2004;10(Suppl 2):4–9.
- American Diabetes Association.Standards of medical care in diabetes.Diabetes Care.2005;28(Suppl 1):S4–S36.
- ,,, et al.Implementation of a safe and effective insulin infusion protocol in a medical intensive care unit.Diabetes Care.2004;27:461–467.
- ,,,,.Use of a computerized guideline for glucose regulation in the intensive care unit improved both guideline adherence and glucose regulation.J Am Med Inform Assoc.2005;12:172–180.
- ,,, et al.Computer‐based insulin infusion protocol improves glycemia control over manual protocol.J Am Med Inform Assoc.2007;14:278–287.
- ,,,,.Management of diabetes mellitus in hospitalized patients: efficiency and effectiveness of sliding‐scale insulin therapy.Pharmacotherapy.2006;26:1421–1432.
- ,,,.Eliminating inpatient sliding‐scale insulin: a reeducation project with medical house staff.Diabetes Care.2005;28:1008–1011.
- ,,.70/30 insulin algorithm versus sliding scale insulin.Ann Pharmacother.2005;39:1606–1610.
- ,,,.Glucose measurement: confounding issues in setting targets for inpatient management.Diabetes Care.2007;30:403–409.
- ,,, et al.“Glucometrics”—assessing the quality of inpatient glucose management.Diabetes Technol Ther.2006;8:560–569.
- American Diabetes Association.Hospital admission guidelines for diabetes.Diabetes Care.2004;27(Suppl 1):S103.
- ,,,,,,.Utility of HbA(1c) levels for diabetes case finding in hospitalized patients with hyperglycemia.Diabetes Care.2003;26:1064–1068.
- ,,.Quality of diabetes care in U.S. academic medical centers: low rates of medical regimen change.Diabetes Care.2005;28:337–442.
- ,,, et al.Diabetes care in the hospital: is there clinical inertia?J Hosp Med.2006;1:151–160.
- ,,, et al.Glucose metabolism in patients with acute myocardial infarction and no previous diagnosis of diabetes mellitus: a prospective study.Lancet.2002;359:2140–2144.
- ,,,,.Inpatient management of diabetes and hyperglycemia among general medicine patients at a large teaching hospital.J Hosp Med.2006;1:145–150.
- ,,,,.Prevalence of hyper‐ and hypoglycemia among inpatients with diabetes: a national survey of 44 U.S. hospitals.Diabetes Care.2007;30:367–369.
- ,,, et al.Randomized study of basal‐bolus insulin therapy in the inpatient management of patients with type 2 diabetes (RABBIT 2 trial).Diabetes Care.2007;30:2181–2186.
- The ACE/ADA Task Force on Inpatient Diabetes.American College of Endocrinology and American Diabetes Association Consensus Statement on Inpatient Diabetes and Glycemic Control: a call to action.Diabetes Care.2006;29:1955–1962.
- ,,, et al.Intensive insulin therapy in the medical ICU.N Engl J Med.2006;354:449–461.
- ,,.Tight blood glucose control with insulin in the ICU: facts and controversies.Chest.2007;132:268–278.
- ,,, et al.Intensive insulin therapy and pentastarch resuscitation in severe sepsis.NEngl J Med.2008;358:125–139.
- ,.Counterpoint: Inpatient glucose management: a premature call to arms?Diabetes Care.2005;28:976–979.
Copyright © 2009 Society of Hospital Medicine