User login
Medical ICU Insulin Infusion Protocols
Observational studies in hospitalized patients with and without diabetes indicate that hyperglycemia is a predictor of poor clinical outcome and mortality.14 Early randomized controlled trials of intensified insulin therapy in patients with surgical and medical acute critical illness reported a reduction on the risk of multiorgan failure and systemic infections,35 as well as short‐ and long‐term mortality.1, 4 Recent randomized controlled trials, however, have failed to confirm the previously suggested benefits of intensive glucose control,6 and the large multicenter normoglycaemia in intensive care evaluation and survival using glucose algorithm regulation (NICE‐SUGAR) study reported an absolute increase in mortality rate with intensive glucose control.7 In addition, intensified insulin therapy in critically‐ill patients has been shown to be associated with a higher rate of severe hypoglycemic events than less aggressive glycemic control protocols.710 These results have led to a heightened interest in improving the quality and safety of the management of diabetes and hyperglycemia in the hospital.
The use of intravenous continuous insulin infusion (CII) is the preferred route of insulin administration for the management of hyperglycemia in the critical care setting.1, 11 Numerous examples of successful CII algorithms in achieving glycemic control are reported in the literature.4, 5, 12 Traditionally, order forms to titrate drip to achieve a target blood glucose (BG) range using an established algorithm or by the application of mathematical rules have been used in clinical practice. Recently, computer‐based algorithms aiming to direct the nursing staff adjusting insulin infusion rate have become commercially available.13, 14 It is not known, however, if computer‐based algorithms are superior to standard paper form‐based protocols in achieving glucose control and in reducing hypoglycemic events in critically‐ill patients. Accordingly, this multicenter randomized study aimed to determine differences in glycemic control and hypoglycemic events between treatment with a computer‐guided CII device and a standard column‐based paper algorithm in critically‐ill patients in the medical intensive care unit (ICU).
Research Design and Methods
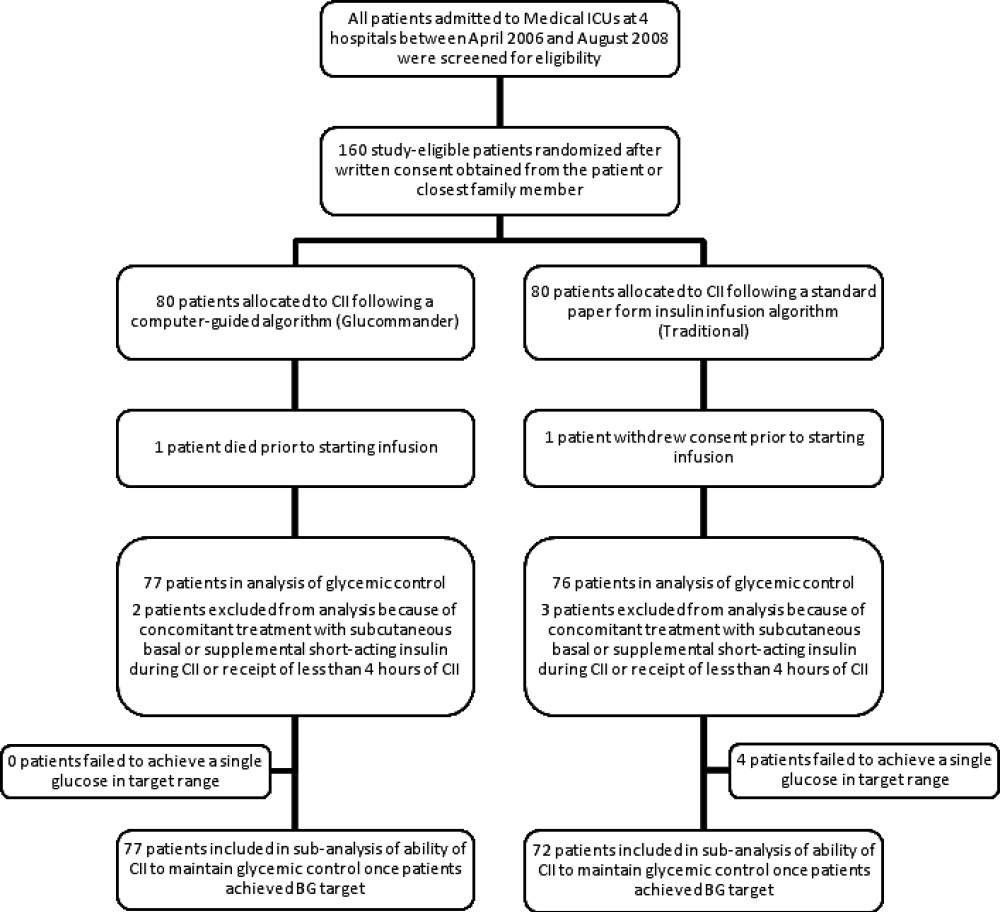
In this multicenter, prospective, open‐label randomized study, 160 adult patients admitted to a medical ICU with new hyperglycemia or with a known history of diabetes treated with diet, insulin therapy or with any combination of oral antidiabetic agents were enrolled after written informed consent had been obtained from the patient or closest family member (Figure 1). Patients with known history of diabetes had 2 BG readings >120 mg/dL while subjects without a history of diabetes had 2 BG readings >140 mg/dL prior to enrollment. We excluded patients with acute hyperglycemic crises such as diabetic ketoacidosis (DKA) and hyperosmolar hyperglycemic state,15 patients with severely impaired renal function (serum creatinine 3.5 mg/dL), dementia, and pregnancy. This study was conducted at 4 hospital centers including Grady Memorial Hospital, Emory University Hospital, and Piedmont Hospital in Atlanta, Georgia and the Regional Medical Center in Memphis, Tennessee.

Patients were randomized using a computer randomization table to receive CII following a computer‐guided algorithm (Glucommander) or CII following a standard paper form insulin infusion algorithm. Both protocols used glulisine (Apidra) insulin and targeted a BG between 80 mg/dL and 120 mg/dL. Insulin management was directed by the specific assigned protocol and was carried out daily by the nursing staff and by members of the internal medicine residency program. The ICU physician and primary care team decided on the treatment for all other medical problem(s) for which patients were admitted. Data were collected during CII up to the first 10 days of ICU stay.
Standard and Computer‐Based CII Algorithms
The standard paper algorithm was adapted from a protocol initially published by Markovitz et al.16 (Supporting Information Appendix). The algorithm is divided into four columns based on empirically determined insulin sensitivity. The first algorithm column was for the most insulin‐sensitive patients, and the fourth algorithm column was for the most insulin resistant patients. The majority of patients started in the algorithm 1 column. Insulin‐resistant patients, such as those receiving glucocorticoids or receiving >80 units of insulin per day as outpatients, started in the algorithm 2 column. The insulin infusion rate was determined by the patient's BG level and was measured hourly until the patient was stable and within the target range. If BG targets were not achieved and the BG had not decreased by at least 60 mg/dL in the preceding hour, the patient was moved to the next column.
The characteristics and use of the Glucommander algorithm have been reported previously.13 In brief, this computer‐guided insulin algorithm directs the administration of intravenous insulin in response to BG measurement at the patient's bedside. In this study, the Glucommander program was loaded into a PalmOne (Zire 31, Tungsten E2 by Palm Inc.) handheld personal digital assistant (PDA) device. During the infusion, the nurse entered BG levels into the system and the computer recommended the insulin infusion rate and a variable time to check the next glucose testing. An alarm prompted the scheduled glucose check. The insulin infusion followed the formula: Insulin/Hour = Multiplier (BG 60). The initial multiplier or insulin sensitivity factor was 0.02. The Glucommander was programmed to adjust the multiplier to achieve and maintain target glucose.
Prior to the beginning of the study, the nursing staff at all institutions was instructed on the use of the Glucommander and paper form protocol. The insulin drip adjustment was carried out by ICU nurses in each hospital. Study investigators and coordinators rounded daily on study patients and were available for consultation and collecting data but were not involved in insulin adjustment based on the protocol.
Clinical Outcome Measures
The primary outcome of the study was to determine differences in glycemic control as measured by mean daily BG concentration between treatment groups. Secondary outcomes include differences between groups in number of hypoglycemic events (BG <60 mg/dL and <40 mg/dL), time to first glucose in target range, amount of insulin treatment (units/kg/hour), number and frequency of glucose measurements, length of stay (LOS) in the ICU and hospital, number of hyperglycemic episodes (BG >200 mg/dL), and mortality rate.
BG Monitoring
Capillary BG measurement in the standard paper protocol was performed hourly until it was within goal range for 4 hours and then every 2 hours for the duration of the infusion. Glucose measurements in the Glucommander arm were requested by the device at intervals that ranged from 20 minutes to 2 hours. The Glucommander software determined the interval between measurements based on the stability of the BG levels of the patient. The insulin infusion rate adjustment was based on the current glucose value and the slope of the glucose curve. The Glucommander alarmed at the appropriate interval to remind the nurse to check and enter the new BG value. If the BG was decreasing faster than expected, the program called for repeat BG measurements more frequently for insulin drip adjustment. If the BG was within target range for 4 consecutive readings, the Glucommander alarmed for repeat BG every 2 hours.
Laboratory Assays
Plasma glucose and glycosylated hemoglobin (HbA1c) were measured on admission. Complete blood count and complete metabolic profile were measured on admission and as otherwise determined by the treating physician.
Statistical Analysis
All data in the text, table and figures are expressed as mean standard deviation. Comparison between groups was carried out by nonparametric two‐sample Wilcoxon tests for continuous variables and chi‐square tests (or Fisher's exact tests) for categorical variables. Cochran‐Mantel‐Haenszel (CMH) or CMH exact tests were further used to adjust for site difference. Repeated measures analyses were conducted to model the probability of BG <60 mg/dL or BG<40 mg/dL based on generalized linear model with AR(1) within‐subject correlation structure. A P value <0.05 is considered as significant. We expected differences in mean BG concentration 30 mg/dL between groups. Assuming 2‐tailed alpha of 0.05, a standard deviation of approximately 40, and a one‐to‐one allocation and no subject attrition, 80 patients per treatment group were thought to be sufficient to achieve 80% power for group mean comparisons. Statistical significance was defined as a type 1 error of 0.05. Statistical analysis was performed using the SAS 9.2.
Results
The admission characteristics and clinical outcomes of interest of the study patients are shown in Table 1. A total of 160 adult patients admitted to a medical ICU with new hyperglycemia (47%) or with a known history of diabetes (53%) were randomized into the study. Of them, 7 patients were excluded due to withdrawal of consent, treatment with subcutaneous basal or supplemental short‐acting insulin during CII, or receiving less than 4 hours of CII. There were no differences in the mean age, gender, race, history of diabetes, or primary admitting diagnosis between treatment groups. The most common admitting diagnosis categories included pulmonary (22.1%), cardiovascular (21.4%), infectious (20.0%), and central nervous system (16.6%) disorders.
| Glucommander (# patients = 77) | Standard (# patients = 76) | P Value | |
|---|---|---|---|
| |||
| Age (years) | 57.8 11.0 | 58.5 13.4 | NS |
| Gender (M/F), % | 57.1/42.9 | 51.3/46.7 | NS |
| Race (W/B/H), % | 25.0/69.6/1.8 | 28.9/67.3/3.9 | NS |
| BMI (Kg/m2) | 31.6 10.4 | 30.5 8.1 | NS |
| Primary admitting diagnosis: | |||
| Cardiovascular, % | 24.7 | 18.1 | NS |
| Pulmonary, % | 24.7 | 19.4 | NS |
| Infection, % | 16.4 | 23.6 | NS |
| Cerebro‐vascular, % | 4.1 | 4.2 | NS |
| Renal, % | 1.4 | 1.4 | NS |
| Apache score | 13.4 6.1 | 16.0 8.3 | NS |
| History of diabetes, % | 53.3 | 54.3 | NS |
| Hemoglobin A1c (%) | 7.2 1.9 | 6.8 1.4 | NS |
| DM patients | 7.9 2.2 | 7.3 1.6 | NS |
| Non‐DM patients | 6.2 0.7 | 6.0 0.7 | NS |
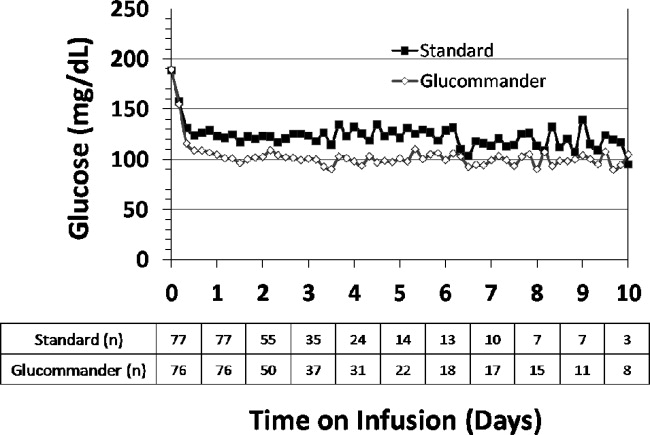
The mean admission glucose concentration for study patients was 190.6 58.2 mg/dL and the mean A1C was 7.0 1.7%. Glycemic control parameters achieved with the CII protocols are listed in Table 2. At the start of CII, the mean BG value was similar for the Glucommander and paper protocols (189.7 64.8 mg/dL and 188.4 54.8 mg/dL, P = 0.419). The mean time to reach the BG target was shorter in the Glucommander group (4.8 2.8 vs. 7.8 9.1 hours, P < 0.001). The Glucommander group had a lower mean glucose value during insulin infusion (115.5 20.7 vs. 131.0 24.6 mg/dL, P < 0.001) and once at target goal, in a lower mean BG values (103.3 8.8 vs. 117.3 16.5 mg/dL, P < 0.001) than the standard algorithm (Figure 2). The mean inpatient BG difference between treatment groups was 15.5 mg/dL (P < 0.001), with a mean daily BG difference ranging from 17.4 mg/dL to 24.4 mg/dL less for the Glucommander group during days 2 to 6 of therapy (P < 0.01).
| Glucommander (# patients = 77) | Standard (# patients = 76) | Mean Difference (CI) or P Value | |
|---|---|---|---|
| |||
| Initial glucose (mg/dL) | 189.7 64.8 | 188.3 54.8 | 1.333 (17.701, 20.367) |
| Median (range) duration of CII (hours) | 46 (12‐240) | 47 (5‐240) | 12.939 (34.630, 8,752) |
| Insulin infusion rate (units/Kg/hour) | 0.035 0.024 | 0.028 0.021 | 0.006 (0.002, 0.014) |
| Time to achieve target BG of 80‐120 mg/dL (hours) | 4.8 2.8 | 7.8 9.1 | 3.0 (5.2, 0.9) |
| Mean BG maintained once target achieved (mg/dL) | 103.3 8.8 | 117.3 16.5 | 14.0 (18.210, 9.774) |
| % of BG tests within target range | 71.0 17.0% | 51.3 19.7% | 19.6 (13.7, 25.5) |
| Mild hypoglycemia, <60 mg/dL, n (% patients) | 33 (42.9) | 23 (31.9) | NS |
| Severe hypoglycemia, <40 mg/dL, n (% patients) | 3 (3.9) | 4 (5.6) | NS |
| Hyperglycemia, >200 mg/dL, n (% patients) | 9 (11.7) | 18 (25.0) | 0.054 |
The Glucommander algorithm was associated with tighter glycemic control and less glucose variability than the standard paper form protocol. Once patients achieved BG target, on average 71.1% of BG readings in the Glucommander and 51.3% in the standard group remained within the 80 mg/dL to 120 mg/dL target range (P < 0.001). In addition, the Glucommander was associated with a significantly lower rate of severe hyperglycemia during insulin infusion. The number of patients with 1 or more episodes of BG >200 mg/dL (11.7% vs. 25%, P = 0.057 before adjusting for potential site difference and P = 0.034 after adjusting for site difference) were less in the Glucommander group than in the standard paper regimen. In addition, 4 of these patients in spite of being on the highest insulin delivery column failed to achieve glucoses <180 and had an average in‐hospital glucose level of 204.5 32.2 mg/dL. These patients were transitioned to the Glucommander arm and withdrawn from the study. All episodes of hypoglycemia occurred after the patients achieved 1 glucose measurement within the target range. The number of patients who experienced one or more BG <40 mg/dL and <60 mg/dL was 3.9% and 42.9% in the Glucommander and 5.6% and 31.9% in the standard regimen, respectively (both, P = not significant [NS]). Similar results were obtained when site effect was accommodated (both, P = NS). Based on repeated measures analyses, the probabilities of BG reading <40 mg/dL or <60 mg/dL were not significantly different between groups (P = 0.969, P = 0.084) after accounting for within‐patient correlations with or without adjusting for time effect. None of these episodes resulted in seizures or were otherwise judged to be associated with deterioration of clinical status.
The mean insulin infusion rate was slightly higher in the Glucommander regimen but the difference was not statistically significant between groups. Patients treated with the Glucommander protocol received a mean infusion rate of 0.035 0.024 unit/kg/hour for a total of 2.85 1.93 units per hour, and those treated with the paper protocol received a 0.028 0.021 units/kg/hour for a total of 2.50 2.28 units per hour, P = 0.12 and P = 0.09, respectively.
The numbers of BG measurements were similar between the Glucommander and standard paper algorithms (44.2 39.8 and 41.2 34.5 respectively, P = NS) with the number of glucose testing per patient ranging from 6 to 175 in the Glucommander and 3 to 168 in the standard group. Similarly, when normalized to the duration of insulin infusion, the frequency of BG monitoring was not different with the protocols (0.68 0.18 and 0.62 0.22 tests/hour respectively, P = NS).
Compared to the standard paper insulin infusion algorithm, patients treated with the Glucommander device had a similar mean ICU LOS (13.4 13.8 vs. 8.5 7.6 days, P = 0.145), mean hospital LOS (17.5 15.0 days vs. 23.9 26.3 days, P = 0.704) and hospital mortality (26.0% vs. 21.9%, P = 0.561).
Discussion
This study is the first to compare the safety and efficacy of a CII via a computer‐guided algorithm and a standard paper form protocol in nonsurgical patients in the ICU. Both treatment algorithms resulted in significant improvement in glycemic control with the Glucommander achieving glycemic glucose target in a shorter time of treatment, a lower mean glucose concentration, and in greater percentage of glucose measurements maintained within target range, without an increased risk of severe hypoglycemia compared to the standard paper protocol.
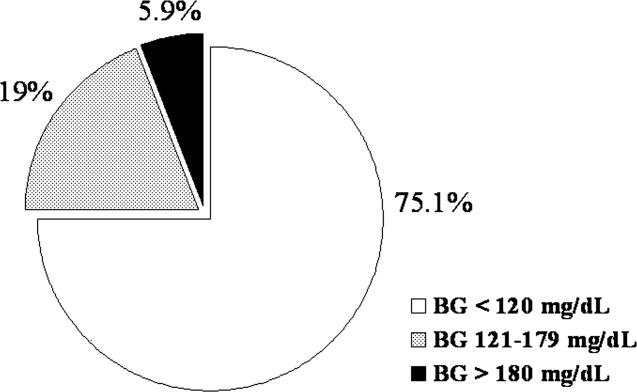
Hyperglycemia in hospitalized patients is a common, serious, and costly health care problem. Evidence from observational and interventional studies indicate that hyperglycemia in critical illness is associated with an increased risk of complications and mortality.25 There is ongoing debate, however, about the optimal glucose level in hospitalized patients with critical illness. Although, several cohort studies as well as early randomized trials in ICU patients reported that intensified insulin treatment to achieve a target glucose between 80 mg/dL to 110 mg/dL reported a reduction in short‐term and long‐term mortality and rates of multiorgan failure and systemic infections compared with conventionally treated patients.3, 4, 17 More recent randomized controlled trials and meta‐analyses, however, have shown that this low BG target has been difficult to achieve without increasing the risk for severe hypoglycemia.710 In addition, recent multicenter trials have failed to show significant improvement in clinical outcome or have even shown increased mortality risk with intensive glycemic control.610 Based on these reports, the American Association of Clinical Endocrinologist (AACE) and American Diabetes Association (ADA) task force on inpatient glycemic control recommended different glycemic targets in the ICU setting. Current guidelines suggest targeting a BG level between 140 mg/dL and 180 mg/dL (7.8 and 10.0 mmol/L) for the majority of ICU patients and a lower glucose targets between 110 mg/dL and 140 mg/dL (6.1 and 7.8 mmol/L) in selected ICU patients (ie, centers with extensive experience and appropriate nursing support, cardiac surgical patients, patients with stable glycemic control without hypoglycemia). Glucose targets >180 mg/dL or <110 mg/dL are no longer recommended in ICU patients.
The rate of severe hypoglycemic events (<40 mg/dL) observed in both arms of our trial was significantly lower than those reported in recent international trials of intensive glycemic control.3, 4, 8 The overall rate of severe hypoglycemic events in international trials ranged between 5% to 28.6%.3, 4, 7, 8, 18, 19 In this trial, the number of patients with severe hypoglycemia was 3.9% in the computer‐based and 5.6% in the standard paper algorithm. Repeated measures analyses show the probabilities of BG readings <40 mg/dL were similar and not significantly different between groups (P = 0.969). We observed, however, a high rate of mild hypoglycemic events in patients treated with both insulin algorithms. The number of patients with BG <60 mg/dL was 42.9% in the Glucommander and 31.9% in the standard (P = NS). Minimizing the rate of hypoglycemia events is of major importance in hospitalized patients because it has been shown that hypoglycemia may be an independent risk factor of poor clinical outcome and mortality.20 Hypoglycemia may increase the risk of ventricular arrhythmias, in part due to the prolongation QT interval21 and can impair cerebral glucose metabolism resulting in brain metabolic dysfunction, as suggested by recent clinical studies.22 Moreover, insulin‐induced hypoglycemia is also associated with increased proinflammatory cytokines (tumor necrosis factor [TNF]‐alpha, interleukin [IL]‐1beta, IL‐6, and IL‐8) and oxidative stress23 that correlate with elevations of counterregulatory hormones (catecholamines, cortisol).
The Glucommander was associated with lower glycemic variability and with a higher percentage of BG readings within target range than patients treated with the standard paper form regimen. The clinical importance of the degree of variability and rapidity of fluctuations in glucose levels in critically ill patients is a topic of recent interest. Glycemic variability has been identified as a strong independent contributor to the risk of mortality in critically ill and surgical patients.24 Low levels of glycemic variability (standard deviation [SD] <10 mg/dL or 10‐20 mg/dL) have been shown to have a statistically significant lower risk of mortality, even after adjustment for severity of illness. Further studies are needed to determine benefits on clinical outcomes from the more consistent BG control from computer‐based titration protocols.
We acknowledge the following limitations in this multicenter open label study. First, this study was conducted in the medical ICU and excluded postsurgical patients and subjects expected to undergo a major surgical procedure during the hospital stay. Although a recent meta‐analysis9 of 26 studies involving 13,567 patients reported no benefits in the general ICU population, it found a favorable effect of intensive glycemic control on mortality in surgical ICU patients (relative risk [RR], 0.63; confidence interval [CI], 0.44‐0.91). We also excluded patients with severe renal insufficiency and patients with a history of hyperglycemic crises. In addition, our study was not powered to demonstrate differences in mortality or clinical outcome between treatment groups, and the BG targets used in this study were lower than glycemic targets recently recommended by the AACE and ADA inpatient glycemic control task force.25 Raising the BG targets is likely to reduce or prevent the rate of mild and severe hypoglycemic events in the ICU.
In conclusion, the computer‐guided algorithm resulted in a more rapid and tighter glycemic control with a similar rate of hypoglycemic events than the standard paper form protocol in medical ICU patients. Our study suggests that, both treatment algorithms are appropriate alternatives for the management of hyperglycemia in critically ill patients, and the choice depends on a physician's preferences, cost considerations, and the availability of the computer guided algorithm. Large randomized clinical trials are needed to test the impact of the new AACE/ADA recommended BG targets in reducing hypoglycemic events, hospital complications, and hospital mortality in critically ill patients in the ICU.
- ,,, et al.Management of diabetes and hyperglycemia in hospitals.Diabetes Care.2004;27:553–597.
- ,,,,,.Hyperglycemia: an independent marker of in‐hospital mortality in patients with undiagnosed diabetes.J Clin Endocrinol Metab.2002;87:978–982.
- ,,, et al.Intensive insulin therapy in the medical ICU.N Engl J Med.2006;354:449–461.
- ,,, et al.Intensive insulin therapy in the critically ill patients.N Engl J Med.2001;345:1359–1367.
- ,,, et al.Continuous insulin infusion reduces mortality in patients with diabetes undergoing coronary artery bypass grafting.J Thorac Cardiovasc Surg.2003;125:1007–1021.
- ,,, et al.Intensive insulin therapy and mortality among critically ill patients: a meta‐analysis including NICE‐SUGAR study data.CMAJ.2009;180:821–827.
- ,,, et al.Intensive versus conventional glucose control in critically ill patients.N Engl J Med.2009;360:1283–1297.
- ,,, et al.Intensive insulin therapy and pentastarch resuscitation in severe sepsis.N Engl J Med.2008;358:125–139.
- ,,, et al.Strict glycaemic control in patients hospitalised in a mixed medical and surgical intensive care unit: a randomised clinical trial.Crit Care.2008;12:R120.
- ,.Tight glucose control and hypoglycemia.Crit Care Med.2008;36:1391; author reply 1391–1392.
- ,.ICU care for patients with diabetes.Curr Opin Endocrinol Diabetes Obes.2004;11:75–81.
- ,,, et al.Implementation of a safe and effective insulin infusion protocol in a medical intensive care unit.Diabetes Care.2004;27:461–467.
- ,,.Glucommander: a computer‐directed intravenous insulin system shown to be safe, simple, and effective in 120,618 h of operation.Diabetes Care.2005;28:2418–2423.
- ,,, et al.Utilization of a computerized intravenous insulin infusion program to control blood glucose in the intensive care unit.Diabetes Technol Ther.2007;9:232–240.
- ,,, et al.Hyperglycemic crises in diabetes.Diabetes Care.2004;27Suppl 1:S94–S102.
- ,,, et al.Description and evaluation of a glycemic management protocol for patients with diabetes undergoing heart surgery.Endocr Pract.2002;8:10–18.
- ,,.Evidence for strict inpatient blood glucose control: time to revise glycemic goals in hospitalized patients.Metabolism.2008;57:116–120.
- ,,, et al.Intensive versus conventional insulin therapy: a randomized controlled trial in medical and surgical critically ill patients.Crit Care Med.2008;36:3190–3197.
- ,,.Benefits and risks of tight glucose control in critically ill adults: a meta‐analysis.JAMA.2008;300:933–944.
- ,.Severe hypoglycemia in critically ill patients: risk factors and outcomes.Crit Care Med.2007;35:2262–2267.
- ,,, et al.Evaluation and management of adult hypoglycemic disorders: an Endocrine Society Clinical Practice Guideline.J Clin Endocrinol Metab.2009;94:709–728.
- ,,, et al.Impact of tight glycemic control on cerebral glucose metabolism after severe brain injury: a microdialysis study.Crit Care Med.2008;36:3233–3238.
- ,,, et al.Proinflammatory cytokines in response to insulin‐induced hypoglycemic stress in healthy subjects.Metabolism.2009;58:443–448.
- ,,, et al.Blood glucose variability is associated with mortality in the surgical intensive care unit.Am Surg.2008;74:679–685; discussion685.
- ,,, et al.American Association of Clinical Endocrinologists and American Diabetes Association consensus statement on inpatient glycemic control.Diabetes Care.2009;32:1119–1131.
Observational studies in hospitalized patients with and without diabetes indicate that hyperglycemia is a predictor of poor clinical outcome and mortality.14 Early randomized controlled trials of intensified insulin therapy in patients with surgical and medical acute critical illness reported a reduction on the risk of multiorgan failure and systemic infections,35 as well as short‐ and long‐term mortality.1, 4 Recent randomized controlled trials, however, have failed to confirm the previously suggested benefits of intensive glucose control,6 and the large multicenter normoglycaemia in intensive care evaluation and survival using glucose algorithm regulation (NICE‐SUGAR) study reported an absolute increase in mortality rate with intensive glucose control.7 In addition, intensified insulin therapy in critically‐ill patients has been shown to be associated with a higher rate of severe hypoglycemic events than less aggressive glycemic control protocols.710 These results have led to a heightened interest in improving the quality and safety of the management of diabetes and hyperglycemia in the hospital.
The use of intravenous continuous insulin infusion (CII) is the preferred route of insulin administration for the management of hyperglycemia in the critical care setting.1, 11 Numerous examples of successful CII algorithms in achieving glycemic control are reported in the literature.4, 5, 12 Traditionally, order forms to titrate drip to achieve a target blood glucose (BG) range using an established algorithm or by the application of mathematical rules have been used in clinical practice. Recently, computer‐based algorithms aiming to direct the nursing staff adjusting insulin infusion rate have become commercially available.13, 14 It is not known, however, if computer‐based algorithms are superior to standard paper form‐based protocols in achieving glucose control and in reducing hypoglycemic events in critically‐ill patients. Accordingly, this multicenter randomized study aimed to determine differences in glycemic control and hypoglycemic events between treatment with a computer‐guided CII device and a standard column‐based paper algorithm in critically‐ill patients in the medical intensive care unit (ICU).
Research Design and Methods
In this multicenter, prospective, open‐label randomized study, 160 adult patients admitted to a medical ICU with new hyperglycemia or with a known history of diabetes treated with diet, insulin therapy or with any combination of oral antidiabetic agents were enrolled after written informed consent had been obtained from the patient or closest family member (Figure 1). Patients with known history of diabetes had 2 BG readings >120 mg/dL while subjects without a history of diabetes had 2 BG readings >140 mg/dL prior to enrollment. We excluded patients with acute hyperglycemic crises such as diabetic ketoacidosis (DKA) and hyperosmolar hyperglycemic state,15 patients with severely impaired renal function (serum creatinine 3.5 mg/dL), dementia, and pregnancy. This study was conducted at 4 hospital centers including Grady Memorial Hospital, Emory University Hospital, and Piedmont Hospital in Atlanta, Georgia and the Regional Medical Center in Memphis, Tennessee.
Patients were randomized using a computer randomization table to receive CII following a computer‐guided algorithm (Glucommander) or CII following a standard paper form insulin infusion algorithm. Both protocols used glulisine (Apidra) insulin and targeted a BG between 80 mg/dL and 120 mg/dL. Insulin management was directed by the specific assigned protocol and was carried out daily by the nursing staff and by members of the internal medicine residency program. The ICU physician and primary care team decided on the treatment for all other medical problem(s) for which patients were admitted. Data were collected during CII up to the first 10 days of ICU stay.
Standard and Computer‐Based CII Algorithms
The standard paper algorithm was adapted from a protocol initially published by Markovitz et al.16 (Supporting Information Appendix). The algorithm is divided into four columns based on empirically determined insulin sensitivity. The first algorithm column was for the most insulin‐sensitive patients, and the fourth algorithm column was for the most insulin resistant patients. The majority of patients started in the algorithm 1 column. Insulin‐resistant patients, such as those receiving glucocorticoids or receiving >80 units of insulin per day as outpatients, started in the algorithm 2 column. The insulin infusion rate was determined by the patient's BG level and was measured hourly until the patient was stable and within the target range. If BG targets were not achieved and the BG had not decreased by at least 60 mg/dL in the preceding hour, the patient was moved to the next column.
The characteristics and use of the Glucommander algorithm have been reported previously.13 In brief, this computer‐guided insulin algorithm directs the administration of intravenous insulin in response to BG measurement at the patient's bedside. In this study, the Glucommander program was loaded into a PalmOne (Zire 31, Tungsten E2 by Palm Inc.) handheld personal digital assistant (PDA) device. During the infusion, the nurse entered BG levels into the system and the computer recommended the insulin infusion rate and a variable time to check the next glucose testing. An alarm prompted the scheduled glucose check. The insulin infusion followed the formula: Insulin/Hour = Multiplier (BG 60). The initial multiplier or insulin sensitivity factor was 0.02. The Glucommander was programmed to adjust the multiplier to achieve and maintain target glucose.
Prior to the beginning of the study, the nursing staff at all institutions was instructed on the use of the Glucommander and paper form protocol. The insulin drip adjustment was carried out by ICU nurses in each hospital. Study investigators and coordinators rounded daily on study patients and were available for consultation and collecting data but were not involved in insulin adjustment based on the protocol.
Clinical Outcome Measures
The primary outcome of the study was to determine differences in glycemic control as measured by mean daily BG concentration between treatment groups. Secondary outcomes include differences between groups in number of hypoglycemic events (BG <60 mg/dL and <40 mg/dL), time to first glucose in target range, amount of insulin treatment (units/kg/hour), number and frequency of glucose measurements, length of stay (LOS) in the ICU and hospital, number of hyperglycemic episodes (BG >200 mg/dL), and mortality rate.
BG Monitoring
Capillary BG measurement in the standard paper protocol was performed hourly until it was within goal range for 4 hours and then every 2 hours for the duration of the infusion. Glucose measurements in the Glucommander arm were requested by the device at intervals that ranged from 20 minutes to 2 hours. The Glucommander software determined the interval between measurements based on the stability of the BG levels of the patient. The insulin infusion rate adjustment was based on the current glucose value and the slope of the glucose curve. The Glucommander alarmed at the appropriate interval to remind the nurse to check and enter the new BG value. If the BG was decreasing faster than expected, the program called for repeat BG measurements more frequently for insulin drip adjustment. If the BG was within target range for 4 consecutive readings, the Glucommander alarmed for repeat BG every 2 hours.
Laboratory Assays
Plasma glucose and glycosylated hemoglobin (HbA1c) were measured on admission. Complete blood count and complete metabolic profile were measured on admission and as otherwise determined by the treating physician.
Statistical Analysis
All data in the text, table and figures are expressed as mean standard deviation. Comparison between groups was carried out by nonparametric two‐sample Wilcoxon tests for continuous variables and chi‐square tests (or Fisher's exact tests) for categorical variables. Cochran‐Mantel‐Haenszel (CMH) or CMH exact tests were further used to adjust for site difference. Repeated measures analyses were conducted to model the probability of BG <60 mg/dL or BG<40 mg/dL based on generalized linear model with AR(1) within‐subject correlation structure. A P value <0.05 is considered as significant. We expected differences in mean BG concentration 30 mg/dL between groups. Assuming 2‐tailed alpha of 0.05, a standard deviation of approximately 40, and a one‐to‐one allocation and no subject attrition, 80 patients per treatment group were thought to be sufficient to achieve 80% power for group mean comparisons. Statistical significance was defined as a type 1 error of 0.05. Statistical analysis was performed using the SAS 9.2.
Results
The admission characteristics and clinical outcomes of interest of the study patients are shown in Table 1. A total of 160 adult patients admitted to a medical ICU with new hyperglycemia (47%) or with a known history of diabetes (53%) were randomized into the study. Of them, 7 patients were excluded due to withdrawal of consent, treatment with subcutaneous basal or supplemental short‐acting insulin during CII, or receiving less than 4 hours of CII. There were no differences in the mean age, gender, race, history of diabetes, or primary admitting diagnosis between treatment groups. The most common admitting diagnosis categories included pulmonary (22.1%), cardiovascular (21.4%), infectious (20.0%), and central nervous system (16.6%) disorders.
| Glucommander (# patients = 77) | Standard (# patients = 76) | P Value | |
|---|---|---|---|
| |||
| Age (years) | 57.8 11.0 | 58.5 13.4 | NS |
| Gender (M/F), % | 57.1/42.9 | 51.3/46.7 | NS |
| Race (W/B/H), % | 25.0/69.6/1.8 | 28.9/67.3/3.9 | NS |
| BMI (Kg/m2) | 31.6 10.4 | 30.5 8.1 | NS |
| Primary admitting diagnosis: | |||
| Cardiovascular, % | 24.7 | 18.1 | NS |
| Pulmonary, % | 24.7 | 19.4 | NS |
| Infection, % | 16.4 | 23.6 | NS |
| Cerebro‐vascular, % | 4.1 | 4.2 | NS |
| Renal, % | 1.4 | 1.4 | NS |
| Apache score | 13.4 6.1 | 16.0 8.3 | NS |
| History of diabetes, % | 53.3 | 54.3 | NS |
| Hemoglobin A1c (%) | 7.2 1.9 | 6.8 1.4 | NS |
| DM patients | 7.9 2.2 | 7.3 1.6 | NS |
| Non‐DM patients | 6.2 0.7 | 6.0 0.7 | NS |
The mean admission glucose concentration for study patients was 190.6 58.2 mg/dL and the mean A1C was 7.0 1.7%. Glycemic control parameters achieved with the CII protocols are listed in Table 2. At the start of CII, the mean BG value was similar for the Glucommander and paper protocols (189.7 64.8 mg/dL and 188.4 54.8 mg/dL, P = 0.419). The mean time to reach the BG target was shorter in the Glucommander group (4.8 2.8 vs. 7.8 9.1 hours, P < 0.001). The Glucommander group had a lower mean glucose value during insulin infusion (115.5 20.7 vs. 131.0 24.6 mg/dL, P < 0.001) and once at target goal, in a lower mean BG values (103.3 8.8 vs. 117.3 16.5 mg/dL, P < 0.001) than the standard algorithm (Figure 2). The mean inpatient BG difference between treatment groups was 15.5 mg/dL (P < 0.001), with a mean daily BG difference ranging from 17.4 mg/dL to 24.4 mg/dL less for the Glucommander group during days 2 to 6 of therapy (P < 0.01).
| Glucommander (# patients = 77) | Standard (# patients = 76) | Mean Difference (CI) or P Value | |
|---|---|---|---|
| |||
| Initial glucose (mg/dL) | 189.7 64.8 | 188.3 54.8 | 1.333 (17.701, 20.367) |
| Median (range) duration of CII (hours) | 46 (12‐240) | 47 (5‐240) | 12.939 (34.630, 8,752) |
| Insulin infusion rate (units/Kg/hour) | 0.035 0.024 | 0.028 0.021 | 0.006 (0.002, 0.014) |
| Time to achieve target BG of 80‐120 mg/dL (hours) | 4.8 2.8 | 7.8 9.1 | 3.0 (5.2, 0.9) |
| Mean BG maintained once target achieved (mg/dL) | 103.3 8.8 | 117.3 16.5 | 14.0 (18.210, 9.774) |
| % of BG tests within target range | 71.0 17.0% | 51.3 19.7% | 19.6 (13.7, 25.5) |
| Mild hypoglycemia, <60 mg/dL, n (% patients) | 33 (42.9) | 23 (31.9) | NS |
| Severe hypoglycemia, <40 mg/dL, n (% patients) | 3 (3.9) | 4 (5.6) | NS |
| Hyperglycemia, >200 mg/dL, n (% patients) | 9 (11.7) | 18 (25.0) | 0.054 |
The Glucommander algorithm was associated with tighter glycemic control and less glucose variability than the standard paper form protocol. Once patients achieved BG target, on average 71.1% of BG readings in the Glucommander and 51.3% in the standard group remained within the 80 mg/dL to 120 mg/dL target range (P < 0.001). In addition, the Glucommander was associated with a significantly lower rate of severe hyperglycemia during insulin infusion. The number of patients with 1 or more episodes of BG >200 mg/dL (11.7% vs. 25%, P = 0.057 before adjusting for potential site difference and P = 0.034 after adjusting for site difference) were less in the Glucommander group than in the standard paper regimen. In addition, 4 of these patients in spite of being on the highest insulin delivery column failed to achieve glucoses <180 and had an average in‐hospital glucose level of 204.5 32.2 mg/dL. These patients were transitioned to the Glucommander arm and withdrawn from the study. All episodes of hypoglycemia occurred after the patients achieved 1 glucose measurement within the target range. The number of patients who experienced one or more BG <40 mg/dL and <60 mg/dL was 3.9% and 42.9% in the Glucommander and 5.6% and 31.9% in the standard regimen, respectively (both, P = not significant [NS]). Similar results were obtained when site effect was accommodated (both, P = NS). Based on repeated measures analyses, the probabilities of BG reading <40 mg/dL or <60 mg/dL were not significantly different between groups (P = 0.969, P = 0.084) after accounting for within‐patient correlations with or without adjusting for time effect. None of these episodes resulted in seizures or were otherwise judged to be associated with deterioration of clinical status.
The mean insulin infusion rate was slightly higher in the Glucommander regimen but the difference was not statistically significant between groups. Patients treated with the Glucommander protocol received a mean infusion rate of 0.035 0.024 unit/kg/hour for a total of 2.85 1.93 units per hour, and those treated with the paper protocol received a 0.028 0.021 units/kg/hour for a total of 2.50 2.28 units per hour, P = 0.12 and P = 0.09, respectively.
The numbers of BG measurements were similar between the Glucommander and standard paper algorithms (44.2 39.8 and 41.2 34.5 respectively, P = NS) with the number of glucose testing per patient ranging from 6 to 175 in the Glucommander and 3 to 168 in the standard group. Similarly, when normalized to the duration of insulin infusion, the frequency of BG monitoring was not different with the protocols (0.68 0.18 and 0.62 0.22 tests/hour respectively, P = NS).
Compared to the standard paper insulin infusion algorithm, patients treated with the Glucommander device had a similar mean ICU LOS (13.4 13.8 vs. 8.5 7.6 days, P = 0.145), mean hospital LOS (17.5 15.0 days vs. 23.9 26.3 days, P = 0.704) and hospital mortality (26.0% vs. 21.9%, P = 0.561).
Discussion
This study is the first to compare the safety and efficacy of a CII via a computer‐guided algorithm and a standard paper form protocol in nonsurgical patients in the ICU. Both treatment algorithms resulted in significant improvement in glycemic control with the Glucommander achieving glycemic glucose target in a shorter time of treatment, a lower mean glucose concentration, and in greater percentage of glucose measurements maintained within target range, without an increased risk of severe hypoglycemia compared to the standard paper protocol.
Hyperglycemia in hospitalized patients is a common, serious, and costly health care problem. Evidence from observational and interventional studies indicate that hyperglycemia in critical illness is associated with an increased risk of complications and mortality.25 There is ongoing debate, however, about the optimal glucose level in hospitalized patients with critical illness. Although, several cohort studies as well as early randomized trials in ICU patients reported that intensified insulin treatment to achieve a target glucose between 80 mg/dL to 110 mg/dL reported a reduction in short‐term and long‐term mortality and rates of multiorgan failure and systemic infections compared with conventionally treated patients.3, 4, 17 More recent randomized controlled trials and meta‐analyses, however, have shown that this low BG target has been difficult to achieve without increasing the risk for severe hypoglycemia.710 In addition, recent multicenter trials have failed to show significant improvement in clinical outcome or have even shown increased mortality risk with intensive glycemic control.610 Based on these reports, the American Association of Clinical Endocrinologist (AACE) and American Diabetes Association (ADA) task force on inpatient glycemic control recommended different glycemic targets in the ICU setting. Current guidelines suggest targeting a BG level between 140 mg/dL and 180 mg/dL (7.8 and 10.0 mmol/L) for the majority of ICU patients and a lower glucose targets between 110 mg/dL and 140 mg/dL (6.1 and 7.8 mmol/L) in selected ICU patients (ie, centers with extensive experience and appropriate nursing support, cardiac surgical patients, patients with stable glycemic control without hypoglycemia). Glucose targets >180 mg/dL or <110 mg/dL are no longer recommended in ICU patients.
The rate of severe hypoglycemic events (<40 mg/dL) observed in both arms of our trial was significantly lower than those reported in recent international trials of intensive glycemic control.3, 4, 8 The overall rate of severe hypoglycemic events in international trials ranged between 5% to 28.6%.3, 4, 7, 8, 18, 19 In this trial, the number of patients with severe hypoglycemia was 3.9% in the computer‐based and 5.6% in the standard paper algorithm. Repeated measures analyses show the probabilities of BG readings <40 mg/dL were similar and not significantly different between groups (P = 0.969). We observed, however, a high rate of mild hypoglycemic events in patients treated with both insulin algorithms. The number of patients with BG <60 mg/dL was 42.9% in the Glucommander and 31.9% in the standard (P = NS). Minimizing the rate of hypoglycemia events is of major importance in hospitalized patients because it has been shown that hypoglycemia may be an independent risk factor of poor clinical outcome and mortality.20 Hypoglycemia may increase the risk of ventricular arrhythmias, in part due to the prolongation QT interval21 and can impair cerebral glucose metabolism resulting in brain metabolic dysfunction, as suggested by recent clinical studies.22 Moreover, insulin‐induced hypoglycemia is also associated with increased proinflammatory cytokines (tumor necrosis factor [TNF]‐alpha, interleukin [IL]‐1beta, IL‐6, and IL‐8) and oxidative stress23 that correlate with elevations of counterregulatory hormones (catecholamines, cortisol).
The Glucommander was associated with lower glycemic variability and with a higher percentage of BG readings within target range than patients treated with the standard paper form regimen. The clinical importance of the degree of variability and rapidity of fluctuations in glucose levels in critically ill patients is a topic of recent interest. Glycemic variability has been identified as a strong independent contributor to the risk of mortality in critically ill and surgical patients.24 Low levels of glycemic variability (standard deviation [SD] <10 mg/dL or 10‐20 mg/dL) have been shown to have a statistically significant lower risk of mortality, even after adjustment for severity of illness. Further studies are needed to determine benefits on clinical outcomes from the more consistent BG control from computer‐based titration protocols.
We acknowledge the following limitations in this multicenter open label study. First, this study was conducted in the medical ICU and excluded postsurgical patients and subjects expected to undergo a major surgical procedure during the hospital stay. Although a recent meta‐analysis9 of 26 studies involving 13,567 patients reported no benefits in the general ICU population, it found a favorable effect of intensive glycemic control on mortality in surgical ICU patients (relative risk [RR], 0.63; confidence interval [CI], 0.44‐0.91). We also excluded patients with severe renal insufficiency and patients with a history of hyperglycemic crises. In addition, our study was not powered to demonstrate differences in mortality or clinical outcome between treatment groups, and the BG targets used in this study were lower than glycemic targets recently recommended by the AACE and ADA inpatient glycemic control task force.25 Raising the BG targets is likely to reduce or prevent the rate of mild and severe hypoglycemic events in the ICU.
In conclusion, the computer‐guided algorithm resulted in a more rapid and tighter glycemic control with a similar rate of hypoglycemic events than the standard paper form protocol in medical ICU patients. Our study suggests that, both treatment algorithms are appropriate alternatives for the management of hyperglycemia in critically ill patients, and the choice depends on a physician's preferences, cost considerations, and the availability of the computer guided algorithm. Large randomized clinical trials are needed to test the impact of the new AACE/ADA recommended BG targets in reducing hypoglycemic events, hospital complications, and hospital mortality in critically ill patients in the ICU.
- ,,, et al.Management of diabetes and hyperglycemia in hospitals.Diabetes Care.2004;27:553–597.
- ,,,,,.Hyperglycemia: an independent marker of in‐hospital mortality in patients with undiagnosed diabetes.J Clin Endocrinol Metab.2002;87:978–982.
- ,,, et al.Intensive insulin therapy in the medical ICU.N Engl J Med.2006;354:449–461.
- ,,, et al.Intensive insulin therapy in the critically ill patients.N Engl J Med.2001;345:1359–1367.
- ,,, et al.Continuous insulin infusion reduces mortality in patients with diabetes undergoing coronary artery bypass grafting.J Thorac Cardiovasc Surg.2003;125:1007–1021.
- ,,, et al.Intensive insulin therapy and mortality among critically ill patients: a meta‐analysis including NICE‐SUGAR study data.CMAJ.2009;180:821–827.
- ,,, et al.Intensive versus conventional glucose control in critically ill patients.N Engl J Med.2009;360:1283–1297.
- ,,, et al.Intensive insulin therapy and pentastarch resuscitation in severe sepsis.N Engl J Med.2008;358:125–139.
- ,,, et al.Strict glycaemic control in patients hospitalised in a mixed medical and surgical intensive care unit: a randomised clinical trial.Crit Care.2008;12:R120.
- ,.Tight glucose control and hypoglycemia.Crit Care Med.2008;36:1391; author reply 1391–1392.
- ,.ICU care for patients with diabetes.Curr Opin Endocrinol Diabetes Obes.2004;11:75–81.
- ,,, et al.Implementation of a safe and effective insulin infusion protocol in a medical intensive care unit.Diabetes Care.2004;27:461–467.
- ,,.Glucommander: a computer‐directed intravenous insulin system shown to be safe, simple, and effective in 120,618 h of operation.Diabetes Care.2005;28:2418–2423.
- ,,, et al.Utilization of a computerized intravenous insulin infusion program to control blood glucose in the intensive care unit.Diabetes Technol Ther.2007;9:232–240.
- ,,, et al.Hyperglycemic crises in diabetes.Diabetes Care.2004;27Suppl 1:S94–S102.
- ,,, et al.Description and evaluation of a glycemic management protocol for patients with diabetes undergoing heart surgery.Endocr Pract.2002;8:10–18.
- ,,.Evidence for strict inpatient blood glucose control: time to revise glycemic goals in hospitalized patients.Metabolism.2008;57:116–120.
- ,,, et al.Intensive versus conventional insulin therapy: a randomized controlled trial in medical and surgical critically ill patients.Crit Care Med.2008;36:3190–3197.
- ,,.Benefits and risks of tight glucose control in critically ill adults: a meta‐analysis.JAMA.2008;300:933–944.
- ,.Severe hypoglycemia in critically ill patients: risk factors and outcomes.Crit Care Med.2007;35:2262–2267.
- ,,, et al.Evaluation and management of adult hypoglycemic disorders: an Endocrine Society Clinical Practice Guideline.J Clin Endocrinol Metab.2009;94:709–728.
- ,,, et al.Impact of tight glycemic control on cerebral glucose metabolism after severe brain injury: a microdialysis study.Crit Care Med.2008;36:3233–3238.
- ,,, et al.Proinflammatory cytokines in response to insulin‐induced hypoglycemic stress in healthy subjects.Metabolism.2009;58:443–448.
- ,,, et al.Blood glucose variability is associated with mortality in the surgical intensive care unit.Am Surg.2008;74:679–685; discussion685.
- ,,, et al.American Association of Clinical Endocrinologists and American Diabetes Association consensus statement on inpatient glycemic control.Diabetes Care.2009;32:1119–1131.
Copyright © 2010 Society of Hospital Medicine
Insulin Infusion in the Non‐ICU Setting
Increasing evidence suggests that in hospitalized adult patients with and without diabetes, hyperglycemia is associated with increased risk of complications, prolonged length of hospitalization, and death.15 Past studies have shown that intensive glucose control in the intensive care unit (ICU) with continuous insulin infusion (CII) improves clinical outcomes by reducing the risk of multiorgan failure, systemic infection, and mortality. Effective management of hyperglycemia, an independent marker of poor outcome,1, 3, 6 is also associated with a decreased length of ICU and hospital stay79 and decreased total hospitalization cost.10 Based on several observational and interventional studies, improved control of blood glucose (BG) has been recommended for most adult patients with critical illness.2, 6, 11
Detrimental effects of hyperglycemia on outcome are not limited to patients in the ICU setting and CII has increasingly been used in non‐ICU settings. In such patients, the presence of hyperglycemia has been associated with prolonged hospital stay, infection, disability after hospital discharge, and death.1, 3, 6 In general medicine and surgery services, however, hyperglycemia is frequently overlooked and inadequately addressed. Numerous reports have shown that sliding scale regular insulin (SSRI) continues to be the most common insulin prescribed regimen in the non‐ICU setting.12 This regimen is challenged by limited and variable efficacy and continued concern for hypoglycemia13; thus, a more structured, target‐driven protocol such as scheduled SC insulin or a CII protocol could facilitate glycemic control in the non‐ICU setting. Recently, we reported that a scheduled regimen using basal‐bolus insulin subcutaneously was safe, effective, and superior to SSRI in controlling BG levels in hospitalized subjects with type 2 diabetes. As in many institutions in the United States, we have used CII protocols as an alternative to subcutaneous (SC) insulin for the management of persistent hyperglycemia in non‐ICU areas during the past 10 years, particularly during the postoperative period, transplant recipients, or patients transferred from the ICU. There is, however, no clinical evidence regarding the safety, efficacy, or outcomes with the use of CII in the non‐ICU setting. Accordingly, we analyzed our experience on the efficacy and safety of CII in the management of hyperglycemia in general medicine and surgical services.
Research Design and Methods
This retrospective chart analysis was conducted in adult patients >18 years of age who were consecutively admitted to the general medical and surgical wards between July 1, 2004 and June 30, 2005 at Emory University Hospital, a 579‐bed tertiary care facility staffed exclusively by Emory University School of Medicine faculty members and residents. The CII protocol, employing regular insulin (Novolin‐R Novo Nordisk Pharmaceuticals, Princeton, NJ) with a very short half‐life, in this study is a dynamic protocol14 that has been available at all nursing stations at Emory Hospital for the past decade (Table 1). The insulin rate is calculated using the formula (BG 60) (multiplier) = units of insulin per hour. The multiplier is a value used to denote the degree of insulin sensitivity based on glucose pattern and response to insulin. The multiplier typically starts at a value of 0.02 and is adjusted by the nurse as needed to achieve target BG levels based on bedside capillary glucose measurements. Blood glucose levels were checked every 1 to 2 hours by the nursing staff (nurse:patient ratio = 1:5) according to the protocol.
| ||
| Date (mm/dd/yyyy): | Time: | Allergies: NKA |
| 1. Begin this protocol and IV fluids on ____/____/____ at __________ (time). Discontinue previous insulin orders when this protocol is started. | ||
| 2. Bedside BG monitoring q 1 h until patient is within target range two consecutive readings, and then obtain BG q 2 h. If the BG falls above or below the targeted range, resume q 1 h readings. (If using A‐line specimen, please use consistently while patient on drip). | ||
| 3. If initial BG >150 mg/dL give Regular Insulin bolus: Dose _____ units. (Dose 0.1 units/kg body weight) | ||
| 4. Insulin drip: 125 units of Regular Insulin in 250 mL 0.9% saline (1 mL of solution = 0.5 units of Insulin). | ||
| 5. Target BG Range on Insulin Drip: _____ mg/dL to _____ mg/dL (Suggested target 80‐100 for ICU patients)* | ||
| For each BG value, recalculate drip rate and disregard previous rate of infusion. | ||
| Calculate Insulin Drip rate: (BG 60) ________ (multiplier) = units of Insulin per hour ( 2 to determine cc/hour) (Typical starting multiplier 0.02 but varies by insulin sensitivity) | ||
| Adjusting Multiplier: | ||
| BG > Target Range: Increase multiplier by 0.01 | ||
| BG within Target Range: No change in multiplier | ||
| BG < Target Range: Decrease multiplier by 0.01 | ||
| 6. Treating Hypoglycemia: | ||
| 6a. BG 60‐80: Give D50W using formula: (100 BG) 0.3 = mL D50W IV Push. Adjust multiplier per protocol above | ||
| 6b. BG <60: Give D50W using formula: (100 BG) 0.3 = mL D50W IV Push | ||
| Decrease insulin drip to 50% of current infusion rate | ||
| Recheck BG in 30 minutes | ||
| BG >80: Decrease multiplier by 0.01 and then return to Step 5 formula | ||
| BG 60‐80: Repeat step 6a | ||
| BG <60: Notify MD and repeat Step 6b | ||
| 7. Continuous IV fluids ______________________ at ____________ mL/hour. (Consider changing to dextrose‐based fluids when BG <250) | ||
| 8. Additional Orders: | ||
Of 1404 patients treated with CII during the hospital stay, 1191 patients received CII in the ICU and 213 patients received CII in non‐ICU areas. The final analysis included a total of 200 non‐ICU patient records after excluding 13 patients with diabetic ketoacidosis, incomplete documentation of glycemic records, or with duration of CII for less than 3 hours. Data collected included demographics, medical history, admission diagnoses, inpatient medications, inpatient laboratory values, bedside BG measurements, insulin doses used, nutrition status during CII, length of stay, disposition at discharge, and mortality rate. Nutrition status was defined in 3 ways: (1) nil per os or nothing by mouth (NPO); (2) oral nutrition (PO‐regular or PO‐liquid); and (3) tube feeds or total parenteral nutrition (TF/TPN). Data collection was limited to the first 10 days of CII use. This study was approved by the Institutional Review Board at Emory University.
The primary aim of the study was to determine the efficacy (mean daily BG levels) and safety (number of hyperglycemic [200 mg/dL] and hypoglycemic [60 mg/dL] events) during CII. We also determined the presence of potential risk factors associated with hypoglycemic and hyperglycemic events (age, body mass index [BMI], nutrition status, renal function, corticosteroid therapy, and use of enteral and parenteral nutrition) during CII.
Statistical Analysis
Two‐sample Wilcoxon tests and analysis of variance (ANOVA) were used to compare continuous variables. Levine's test for homogeneity of variances and log transformations were used when necessary. For categorical variables, chi square (2) analysis was used. Multivariate regression analyses controlling for age, gender, race, history of diabetes mellitus (DM), BMI, Cockcroft‐Gault estimated glomerular filtration rate (GFR), steroid use, nutrition status (via oral route vs. NPO), and number of BG tests were performed based on repeated measures linear models or linear models and were used to determine the influence of demographic and clinical characteristics on the risk of hypoglycemia, hyperglycemia, mortality, and length of stay. Model building followed the backward selection procedure. All data are expressed as mean standard deviation. Statistical significance was defined as P < 0.05.
Statistical Analysis Software (SAS), version 9.1 (SAS Institute, Inc., Cary, NC), was used to perform the statistical analysis.
Results
The cohort of 200 patients consisted of 54% males and 46% females, 53% Caucasian, 37% Black, with a mean age of 52 16 years (Table 2). Forty‐five percent of patients were admitted to the general medicine service and the remaining 55% were admitted to the surgical service for admission diagnoses that included cardiovascular disorders, trauma/surgery gastrointestinal disorders, renal disorders, and infection.
| |
| Age (years) | 52 16 |
| Gender (M/F) | 108/92 |
| Race (W/B/H/O) | 106/74//3/17 |
| Admitting service, Medical/Surgical (%/%) | 45/55 |
| BMI (kg/m2) | 28.4 7.1 |
| Known diabetes/new onset (%/%) | 90/11 |
| Admission blood glucose (mg/dL) | 325 235 |
| A1c (%) | 9.1 3 |
| CrCl (mL/minute) | 59.5 44 |
| On steroids (%) | 82 (41%) |
| Insulin drip duration (hours) | 41.6 37 |
| LOS (days) | 10 9 |
The primary indication for CII was poor glycemic control in 93.4% of patients. Forty‐one percent of subjects were receiving corticosteroids and 16% were continued on the insulin drip after transferring from an ICU. Nearly 90% of subjects had a history of diabetes and 11% were diagnosed with new‐onset diabetes. The mean admission BG concentration was 325 235 mg/dL (mean SD) and the mean A1c in 121 subjects in whom it was measured was 9.1 3%. The mean BG prior to the initiation of CII (323 184) was similar to the admission BG.
Of the 173 subjects that had well‐documented glycemic goals, the BG targeted during CII was 150 mg/dL in 85% of patients while the remaining subjects had a target BG goal that ranged from 70 to 250 mg/dL. The most commonly prescribed BG target goals were 80 to 110 mg/dL (41.6%), 80 to 120 mg/dL (13.9%), and 100 to 150 mg/dL (5.8%).
BG improved rapidly after the initiation of CII. BG on the first day of CII was 182 71 mg/dL; day 2: 142 42 mg/dL; day 3: 131 38 mg/dL; and day 4: 132 43 in response to receiving an average of 84 66 units/day, 71 61 units/day, 70 61 units/day, and 64 29 units/day, respectively (Table 3). Irrespective of the target BG goal, 67% of patients reached BG levels of 150 mg/dL by 48 hours of CII initiation. The duration of CII ranged between 4 and 240 hours, with an average of 41.6 hours and a median of 28 hours. The average insulin infusion rate during CII was 4.29 2.99 units/hour and the mean amount of insulin required to attain glycemic goals was 1.96 1.88 units/kg/day.
| Mean Daily Blood Glucose (mg/dL*) | Mean Daily IV Insulin Dose (units/day) | |
|---|---|---|
| ||
| Preinfusion | 323 184 | N/A |
| Day 1 | 182 71 | 84 66 |
| Day 2 | 142 42 | 71 61 |
| Day 3 | 131 38 | 70 61 |
| Day 4 | 132 43 | 64 29 |
During CII, 48% and 35% of patients had at least 1 episode of hyperglycemia (BG >200 mg/dL) on the second and third day of CII, respectively. Hypoglycemia (BG <60 mg/dL) was noted at least once in 22% of the cohort (day 1: 11%; day 2: 16%; and day 3: 14%); however, severe hypoglycemia (BG <40 mg/dL) only occurred in 5% of subjects. During the CII, 37% of patients experienced a BG <70 mg/dL. When BG targets were stratified (<120 mg/dL vs. 120‐180 mg/dL vs. >180 mg/dL), we found no significant association between the target BG goal and the frequency of hypoglycemic or hyperglycemic events during CII. None of the episodes of hypoglycemia were associated with significant or permanent complications.
The analysis of collected variables for influence on glycemic control (ie, BMI, age, corticosteroid use, renal function, and nutrition status) revealed that subjects with a creatinine level >1.5 mg/dL may have an increased risk of hyperglycemia (BG >200 mg/dL) (P = 0.047) but not hypoglycemia. The analysis also found that younger patients (51 16 years) were more likely to have episodes of hyperglycemia than older patients (57 13 years) (P = 0.027). Hospital length of stay and mortality rate (3%) were not associated with the rate of hyperglycemic or hypoglycemic events.
Eighty‐two percent of patients received nutrition support at some point while on the CII: 48% PO‐regular diet; 14% PO‐liquid diet; and 20% TF/TPN. Due to the titration of nutrition from NPO at CII initiation to PO, NPO status was analyzed in a time‐dependent fashion. Thus, among patients on CII on day 1, day 2, day 3, day 4, and days 510; 34.0%, 26.3%, 11.3%, 12.5%, and 10.5%, respectively, were NPO.
As compared to subjects maintained NPO, subjects that received oral nutrition while on CII had an increased rate of hyperglycemic events (BG >200 mg/dL: 86% vs. 76%, P = 0.19; >300 mg/dL: 57% vs. 53%, P = 0.69; >400 mg/dL: 32% vs. 21%, P = 0.22) and a decreased rate of hypoglycemic events (BG <70 mg/dL: 33% vs. 41%, P = 0.39; BG <60 mg/dL: 20% vs. 26%, P = 0.49; and BG <40 mg/dL: 4% vs. 6%, P = 0.65). The multivariate regression analyses, however, which considered age, gender, race, BMI, renal function, steroid use, history of diabetes, and number of BG tests, showed that nutrition status during CII was associated with increased frequency of hyperglycemic (P = 0.042) and hypoglycemic events (P = 0.086). As compared to NPO, oral intake (PO‐regular or PO‐liquid) was associated with a significantly increased frequency of hyperglycemic (P = 0.012) and hypoglycemic events (P = 0.035). Patients treated with TPN had lower BG values than those not on TPN. Although we observed no increased number of hypoglycemic events, TPN‐treated subjects had higher mortality than non‐TPN treated subjects (P < 0.001).
Discussion
Our study aimed to determine the safety and efficacy of CII in non‐critically‐ill patients with persistent hyperglycemia in general medicine and surgical services. We observed that the use of CII was effective in controlling hyperglycemia, with two‐thirds of patients achieving their target BG 150 mg/dL by 48 hours of insulin infusion. The rate of hypoglycemic events with the use of CII in non‐ICU patients was similar to that reported in recent ICU trials with intensive glycemic control7, 8, 15, 16 and is comparable to that reported in studies using SC insulin therapy in non‐ICU settings.17, 18 The number of hypoglycemic and hyperglycemic events was significantly higher in patients allowed to eat compared to those patients kept NPO during CII. There is substantial observational evidence linking hyperglycemia in hospitalized patients (with and without diabetes) to poor outcomes. There is ongoing debate, however, about the optimal level of BG in hospitalized patients. Early cohort studies as well as randomized controlled trials (RCTs) suggest that intensive treatment of hyperglycemia reduces length of hospital and ICU stay, multiorgan failure and systemic infections, and mortality.7, 9 These positive reports led the American Diabetes Association (ADA) and American Association of Clinical Endocrinologists (AACE) to recommend tight glycemic control (target of 80‐110 mg/dL) in critical care units. Recent multicenter controlled trials, however, have not been able to reproduce these results and in fact, have reported an increased risk of severe hypoglycemia and mortality in ICU patients in association with tight glycemic control.15, 16, 19 New glycemic targets call for more reasonable, achievable, and safer glycemic targets20, 21 in patients receiving CII in the ICU setting. The recent ADA/AACE Inpatient Task Force now recommends against aggressive BG targets of <110 mg/dL for patients in the ICU, and suggests maintaining glucose levels between 140 and 180 mg/dL during insulin therapy. However, lower targets between 110 and 140 mg/dL, while not evidence‐based, may be acceptable in a subset of patients as long as these levels can be achieved safely by a well‐trained staff.
There are no RCTs examining the effect of intensive glycemic control on outcomes or the optimal glycemic target in hospitalized patients outside the ICU setting. However, several observational studies point to a strong association between hyperglycemia and poor clinical outcomes, including prolonged hospital stay, infection, disability after hospital discharge, and death.1, 3, 5 Despite the paucity of randomized controlled trials on general medical‐surgical floors, a premeal BG target of <140 mg/dL with random BG <180 mg/dL are recommended as long as this target can be safely achieved.21
Our study indicates that the use of CII in the non‐ICU setting is effective in improving glycemic control. After the first day of CII, the mean glucose level was within the recommended BG target of <180 mg/dL for patients treated with CII in the ICU. Moreover, the mean daily BG level during CII was lower than those recently reported with the use of SC basal‐bolus and insulin neutral protamine hagedorn (NPH) and regular insulin combinations in non‐ICU settings.17, 18 In the Randomized Study of Basal Bolus Insulin Therapy in the Inpatient Management of Patients with Type 2 Diabetes (RABBIT 2) trial, a study that compared the efficacy and safety of an SC basal‐bolus to a sliding scale insulin regimen, showed that 66% and 38% of patients, respectively, reached a target BG of <140 mg/dL.17 The Comparison of Inpatient Insulin Regimens: DEtemir plus Aspart vs. NPH plus regular in Medical Patients with Type 2 Diabetes (DEAN Trial) trial reported daily mean BG levels after the first day of 160 38 mg/dL and 158 51 mg/dL in the detemir/aspart and NPH/regular group, respectively with an achieved BG target of <140 mg/dL in 45% of patients in the detemir/aspart and in 48% in the NPH/regular18; whereas in this study we observed that most patients reached the target BG goal by 48 hours of the CII regimen.
Increasing evidence indicates that inpatient hypoglycemia is associated with short‐term and long‐term adverse outcomes.22, 23 The incidence of severe hypoglycemia (<40 mg/dL) with intensified glycemic control has ranged between 9.8% and 19%7, 15 vs. <5% in conventional treatment. In the present study, 35% of patients experienced a BG <70 mg/dL, 22% had a BG <60 mg/dL, and 5% of patients had a BG <40 mg/dL. The lower rate of hypoglycemic events with the use of CII in the non‐ICU setting observed in this study is likely the result of a more relaxed glycemic target of 80 to 150 mg/dL for the majority of subjects, as well as fewer severe comorbidities compared to patients in the ICU, where the presence of sepsis or hepatic, adrenal, or renal failure increase the risk of hypoglycemia.2224
Multivariate analyses adjusted for age, gender, race, BMI, renal function, steroid use, history of diabetes, and number of BG tests showed that nutrition status during CII was an important factor associated with increased frequency of hyperglycemic and hypoglycemic events. Compared to subjects maintained NPO, subjects who received oral intake while on CII had a significantly increased rate of hyperglycemic and hypoglycemic events. The increased risk of hypoglycemia for those allowed to eat is expected as the protocol would mandate an increase in the CII rate in response to the prandial BG increase but does not make provisions for BG assessments or CII adjustments in relationship to the meal. These results indicate that in stable patients who are ready to start eating, CII should be stopped and transitioned to SC insulin regimen. In patients who may benefit from the continued use of CII (eg, patients requiring multistep procedures/surgeries), treatment with CII could be continued with supplemental mealtime insulin (intravenous [IV] or SC).
CII may be useful in cases of patients with persistent hyperglycemia despite scheduled SC insulin regimen; in patients where rapid glycemic control may be warranted in order to decrease the risk of increased inflammation and vascular dysfunction in acute coronary syndromes; and to enhance wound healing status post surgical procedures. Other clinical scenarios in which CII may be preferred and no ICU bed is required include cases of new‐onset diabetes with significant hyperglycemia (BG >300 mg/dL), type 1 diabetes poorly controlled with SC insulin, uncontrolled gestational diabetes, parenteral nutrition use, perioperative states, or the use of high‐dose steroids or chemotherapy.
Our findings are limited by the retrospective nature of our study and the evaluation of patients in a single university medical center. Selection bias should be considered in the interpretation of the results since each index case was selected by the attending physician to be treated with CII as opposed to another regimen for inpatient glycemic control. The selection bias, however, may be limited by the fact that the subjects in this study placed on CII seemed to be similar to those in the general hospital population. A previous pilot study from a different academic institution, however, reported that implementing CII protocols in non‐ICU patients is safe and improved glycemic control without increasing hypoglycemia.25 In addition, because most subjects in this study had a history of diabetes prior to admission, these results may not be generalizable to populations with stress‐induced hyperglycemia.
In summary, our study indicates that a CII regimen is an effective option for the management of patients with persistent hyperglycemia in the non‐critical care setting. Most patients achieved and remained within targeted BG levels during CII. The overall rate of hypoglycemic events was similar to that reported in recent randomized clinical trials in the ICU and with SC insulin therapy. The frequency of hypoglycemic and hyperglycemic events was significantly increased in patients allowed to eat during CII suggesting that CII should be stopped and patients should be transitioned to an SC insulin regimen once oral intake is initiated. Future prospective, randomized studies are needed to compare the efficacy and safety of CII protocols to SC insulin protocols in the management of patients with persistent hyperglycemia in the non‐ICU setting.
- ,,,,,.Hyperglycemia: an independent marker of in‐hospital mortality in patients with undiagnosed diabetes.J Clin Endocrinol Metab.2002;87(3):978–982.
- ,,, et al.Outcome benefit of intensive insulin therapy in the critically ill: insulin dose versus glycemic control.Crit Care Med.2003;31(2):359–366.
- ,,, et al.Early postoperative glucose control predicts nosocomial infection rate in diabetic patients.JPEN J Parenter Enteral Nutr.1998;22(2):77–81.
- ,,, et al.Randomized trial of insulin‐glucose infusion followed by subcutaneous insulin treatment in diabetic patients with acute myocardial infarction (DIGAMI study): effects on mortality at 1 year.J Am Coll Cardiol.1995;26(1):57–65.
- ,,,.Glucose control and mortality in critically ill patients.JAMA.2003;290(15):2041–2047.
- ,,, et al.Management of diabetes and hyperglycemia in hospitals.Diabetes Care.2004;27(2):553–597.
- ,,, et al.Intensive insulin therapy in the medical ICU.N Engl J Med.2006;354(5):449–461.
- ,,, et al.Intensive insulin therapy in the critically ill patients.N Engl J Med.2001;345(19):1359–1367.
- ,,, et al.Continuous insulin infusion reduces mortality in patients with diabetes undergoing coronary artery bypass grafting.J Thorac Cardiovasc Surg.2003;125(5):1007–1021.
- ,.Cost analysis of intensive glycemic control in critically ill adult patients.Chest.2006;129(3):644–650.
- ,,, et al.Intensive versus conventional glucose control in critically ill patients.N Engl J Med.2009;360(13):1283–1297.
- ,,, et al.Implementation of a safe and effective insulin infusion protocol in a medical intensive care unit.Diabetes Care.2004;27(2):461–467.
- ,,.Glycemic control and sliding scale insulin use in medical inpatients with diabetes mellitus.Arch Intern Med.1997;157(5):545–552.
- .Diabetes Dek Professional Edition.Eatonton, GA:American Diabetes Association;1993.
- ,,, et al.Intensive insulin therapy and pentastarch resuscitation in severe sepsis.N Engl J Med.2008;358(2):125–139.
- ,,, et al.Intensive insulin therapy and mortality among critically ill patients: a meta‐analysis including NICE‐SUGAR study data.CMAJ.2009;180(8):799–800.
- ,,, et al.Randomized study of basal‐bolus insulin therapy in the inpatient management of patients with type 2 diabetes (RABBIT 2 trial).Diabetes Care.2007;30(9):2181–2186.
- ,,, et al.Comparison of inpatient insulin regimens with detemir plus aspart versus neutral protamine hagedorn plus regular in medical patients with type 2 diabetes.J Clin Endocrinol Metab.2009;94(2):564–569.
- ,,, et al.Strict glycaemic control in patients hospitalised in a mixed medical and surgical intensive care unit: a randomised clinical trial.Crit Care.2008;12(5):R120.
- ,,, et al.Hyperglycemia and acute coronary syndrome: a scientific statement from the American Heart Association Diabetes Committee of the Council on Nutrition, Physical Activity, and Metabolism.Circulation.2008;117(12):1610–1619.
- ,,, et al.American Association of Clinical Endocrinologists/American Diabetes Association: Consensus Statement on Inpatient Glycemic Control.Endocr Pract.2009;15(4):353–369.
- .Blood glucose and its prognostic implications in patients hospitalised with acute myocardial infarction.Diab Vasc Dis Res.2008;5(4):269–275.
- ,.Severe hypoglycemia in critically ill patients: risk factors and outcomes.Crit Care Med.2007;35(10):2262–2267.
- ,,, et al.Evaluation of short‐term consequences of hypoglycemia in an intensive care unit.Crit Care Med.2006;34(11):2714–2718.
- ,,,.New insulin infusion protocol Improves blood glucose control in hospitalized patients without increasing hypoglycemia.Jt Comm J Qual Patient Saf.2005;31(3):141–147.
Increasing evidence suggests that in hospitalized adult patients with and without diabetes, hyperglycemia is associated with increased risk of complications, prolonged length of hospitalization, and death.15 Past studies have shown that intensive glucose control in the intensive care unit (ICU) with continuous insulin infusion (CII) improves clinical outcomes by reducing the risk of multiorgan failure, systemic infection, and mortality. Effective management of hyperglycemia, an independent marker of poor outcome,1, 3, 6 is also associated with a decreased length of ICU and hospital stay79 and decreased total hospitalization cost.10 Based on several observational and interventional studies, improved control of blood glucose (BG) has been recommended for most adult patients with critical illness.2, 6, 11
Detrimental effects of hyperglycemia on outcome are not limited to patients in the ICU setting and CII has increasingly been used in non‐ICU settings. In such patients, the presence of hyperglycemia has been associated with prolonged hospital stay, infection, disability after hospital discharge, and death.1, 3, 6 In general medicine and surgery services, however, hyperglycemia is frequently overlooked and inadequately addressed. Numerous reports have shown that sliding scale regular insulin (SSRI) continues to be the most common insulin prescribed regimen in the non‐ICU setting.12 This regimen is challenged by limited and variable efficacy and continued concern for hypoglycemia13; thus, a more structured, target‐driven protocol such as scheduled SC insulin or a CII protocol could facilitate glycemic control in the non‐ICU setting. Recently, we reported that a scheduled regimen using basal‐bolus insulin subcutaneously was safe, effective, and superior to SSRI in controlling BG levels in hospitalized subjects with type 2 diabetes. As in many institutions in the United States, we have used CII protocols as an alternative to subcutaneous (SC) insulin for the management of persistent hyperglycemia in non‐ICU areas during the past 10 years, particularly during the postoperative period, transplant recipients, or patients transferred from the ICU. There is, however, no clinical evidence regarding the safety, efficacy, or outcomes with the use of CII in the non‐ICU setting. Accordingly, we analyzed our experience on the efficacy and safety of CII in the management of hyperglycemia in general medicine and surgical services.
Research Design and Methods
This retrospective chart analysis was conducted in adult patients >18 years of age who were consecutively admitted to the general medical and surgical wards between July 1, 2004 and June 30, 2005 at Emory University Hospital, a 579‐bed tertiary care facility staffed exclusively by Emory University School of Medicine faculty members and residents. The CII protocol, employing regular insulin (Novolin‐R Novo Nordisk Pharmaceuticals, Princeton, NJ) with a very short half‐life, in this study is a dynamic protocol14 that has been available at all nursing stations at Emory Hospital for the past decade (Table 1). The insulin rate is calculated using the formula (BG 60) (multiplier) = units of insulin per hour. The multiplier is a value used to denote the degree of insulin sensitivity based on glucose pattern and response to insulin. The multiplier typically starts at a value of 0.02 and is adjusted by the nurse as needed to achieve target BG levels based on bedside capillary glucose measurements. Blood glucose levels were checked every 1 to 2 hours by the nursing staff (nurse:patient ratio = 1:5) according to the protocol.
| ||
| Date (mm/dd/yyyy): | Time: | Allergies: NKA |
| 1. Begin this protocol and IV fluids on ____/____/____ at __________ (time). Discontinue previous insulin orders when this protocol is started. | ||
| 2. Bedside BG monitoring q 1 h until patient is within target range two consecutive readings, and then obtain BG q 2 h. If the BG falls above or below the targeted range, resume q 1 h readings. (If using A‐line specimen, please use consistently while patient on drip). | ||
| 3. If initial BG >150 mg/dL give Regular Insulin bolus: Dose _____ units. (Dose 0.1 units/kg body weight) | ||
| 4. Insulin drip: 125 units of Regular Insulin in 250 mL 0.9% saline (1 mL of solution = 0.5 units of Insulin). | ||
| 5. Target BG Range on Insulin Drip: _____ mg/dL to _____ mg/dL (Suggested target 80‐100 for ICU patients)* | ||
| For each BG value, recalculate drip rate and disregard previous rate of infusion. | ||
| Calculate Insulin Drip rate: (BG 60) ________ (multiplier) = units of Insulin per hour ( 2 to determine cc/hour) (Typical starting multiplier 0.02 but varies by insulin sensitivity) | ||
| Adjusting Multiplier: | ||
| BG > Target Range: Increase multiplier by 0.01 | ||
| BG within Target Range: No change in multiplier | ||
| BG < Target Range: Decrease multiplier by 0.01 | ||
| 6. Treating Hypoglycemia: | ||
| 6a. BG 60‐80: Give D50W using formula: (100 BG) 0.3 = mL D50W IV Push. Adjust multiplier per protocol above | ||
| 6b. BG <60: Give D50W using formula: (100 BG) 0.3 = mL D50W IV Push | ||
| Decrease insulin drip to 50% of current infusion rate | ||
| Recheck BG in 30 minutes | ||
| BG >80: Decrease multiplier by 0.01 and then return to Step 5 formula | ||
| BG 60‐80: Repeat step 6a | ||
| BG <60: Notify MD and repeat Step 6b | ||
| 7. Continuous IV fluids ______________________ at ____________ mL/hour. (Consider changing to dextrose‐based fluids when BG <250) | ||
| 8. Additional Orders: | ||
Of 1404 patients treated with CII during the hospital stay, 1191 patients received CII in the ICU and 213 patients received CII in non‐ICU areas. The final analysis included a total of 200 non‐ICU patient records after excluding 13 patients with diabetic ketoacidosis, incomplete documentation of glycemic records, or with duration of CII for less than 3 hours. Data collected included demographics, medical history, admission diagnoses, inpatient medications, inpatient laboratory values, bedside BG measurements, insulin doses used, nutrition status during CII, length of stay, disposition at discharge, and mortality rate. Nutrition status was defined in 3 ways: (1) nil per os or nothing by mouth (NPO); (2) oral nutrition (PO‐regular or PO‐liquid); and (3) tube feeds or total parenteral nutrition (TF/TPN). Data collection was limited to the first 10 days of CII use. This study was approved by the Institutional Review Board at Emory University.
The primary aim of the study was to determine the efficacy (mean daily BG levels) and safety (number of hyperglycemic [200 mg/dL] and hypoglycemic [60 mg/dL] events) during CII. We also determined the presence of potential risk factors associated with hypoglycemic and hyperglycemic events (age, body mass index [BMI], nutrition status, renal function, corticosteroid therapy, and use of enteral and parenteral nutrition) during CII.
Statistical Analysis
Two‐sample Wilcoxon tests and analysis of variance (ANOVA) were used to compare continuous variables. Levine's test for homogeneity of variances and log transformations were used when necessary. For categorical variables, chi square (2) analysis was used. Multivariate regression analyses controlling for age, gender, race, history of diabetes mellitus (DM), BMI, Cockcroft‐Gault estimated glomerular filtration rate (GFR), steroid use, nutrition status (via oral route vs. NPO), and number of BG tests were performed based on repeated measures linear models or linear models and were used to determine the influence of demographic and clinical characteristics on the risk of hypoglycemia, hyperglycemia, mortality, and length of stay. Model building followed the backward selection procedure. All data are expressed as mean standard deviation. Statistical significance was defined as P < 0.05.
Statistical Analysis Software (SAS), version 9.1 (SAS Institute, Inc., Cary, NC), was used to perform the statistical analysis.
Results
The cohort of 200 patients consisted of 54% males and 46% females, 53% Caucasian, 37% Black, with a mean age of 52 16 years (Table 2). Forty‐five percent of patients were admitted to the general medicine service and the remaining 55% were admitted to the surgical service for admission diagnoses that included cardiovascular disorders, trauma/surgery gastrointestinal disorders, renal disorders, and infection.
| |
| Age (years) | 52 16 |
| Gender (M/F) | 108/92 |
| Race (W/B/H/O) | 106/74//3/17 |
| Admitting service, Medical/Surgical (%/%) | 45/55 |
| BMI (kg/m2) | 28.4 7.1 |
| Known diabetes/new onset (%/%) | 90/11 |
| Admission blood glucose (mg/dL) | 325 235 |
| A1c (%) | 9.1 3 |
| CrCl (mL/minute) | 59.5 44 |
| On steroids (%) | 82 (41%) |
| Insulin drip duration (hours) | 41.6 37 |
| LOS (days) | 10 9 |
The primary indication for CII was poor glycemic control in 93.4% of patients. Forty‐one percent of subjects were receiving corticosteroids and 16% were continued on the insulin drip after transferring from an ICU. Nearly 90% of subjects had a history of diabetes and 11% were diagnosed with new‐onset diabetes. The mean admission BG concentration was 325 235 mg/dL (mean SD) and the mean A1c in 121 subjects in whom it was measured was 9.1 3%. The mean BG prior to the initiation of CII (323 184) was similar to the admission BG.
Of the 173 subjects that had well‐documented glycemic goals, the BG targeted during CII was 150 mg/dL in 85% of patients while the remaining subjects had a target BG goal that ranged from 70 to 250 mg/dL. The most commonly prescribed BG target goals were 80 to 110 mg/dL (41.6%), 80 to 120 mg/dL (13.9%), and 100 to 150 mg/dL (5.8%).
BG improved rapidly after the initiation of CII. BG on the first day of CII was 182 71 mg/dL; day 2: 142 42 mg/dL; day 3: 131 38 mg/dL; and day 4: 132 43 in response to receiving an average of 84 66 units/day, 71 61 units/day, 70 61 units/day, and 64 29 units/day, respectively (Table 3). Irrespective of the target BG goal, 67% of patients reached BG levels of 150 mg/dL by 48 hours of CII initiation. The duration of CII ranged between 4 and 240 hours, with an average of 41.6 hours and a median of 28 hours. The average insulin infusion rate during CII was 4.29 2.99 units/hour and the mean amount of insulin required to attain glycemic goals was 1.96 1.88 units/kg/day.
| Mean Daily Blood Glucose (mg/dL*) | Mean Daily IV Insulin Dose (units/day) | |
|---|---|---|
| ||
| Preinfusion | 323 184 | N/A |
| Day 1 | 182 71 | 84 66 |
| Day 2 | 142 42 | 71 61 |
| Day 3 | 131 38 | 70 61 |
| Day 4 | 132 43 | 64 29 |
During CII, 48% and 35% of patients had at least 1 episode of hyperglycemia (BG >200 mg/dL) on the second and third day of CII, respectively. Hypoglycemia (BG <60 mg/dL) was noted at least once in 22% of the cohort (day 1: 11%; day 2: 16%; and day 3: 14%); however, severe hypoglycemia (BG <40 mg/dL) only occurred in 5% of subjects. During the CII, 37% of patients experienced a BG <70 mg/dL. When BG targets were stratified (<120 mg/dL vs. 120‐180 mg/dL vs. >180 mg/dL), we found no significant association between the target BG goal and the frequency of hypoglycemic or hyperglycemic events during CII. None of the episodes of hypoglycemia were associated with significant or permanent complications.
The analysis of collected variables for influence on glycemic control (ie, BMI, age, corticosteroid use, renal function, and nutrition status) revealed that subjects with a creatinine level >1.5 mg/dL may have an increased risk of hyperglycemia (BG >200 mg/dL) (P = 0.047) but not hypoglycemia. The analysis also found that younger patients (51 16 years) were more likely to have episodes of hyperglycemia than older patients (57 13 years) (P = 0.027). Hospital length of stay and mortality rate (3%) were not associated with the rate of hyperglycemic or hypoglycemic events.
Eighty‐two percent of patients received nutrition support at some point while on the CII: 48% PO‐regular diet; 14% PO‐liquid diet; and 20% TF/TPN. Due to the titration of nutrition from NPO at CII initiation to PO, NPO status was analyzed in a time‐dependent fashion. Thus, among patients on CII on day 1, day 2, day 3, day 4, and days 510; 34.0%, 26.3%, 11.3%, 12.5%, and 10.5%, respectively, were NPO.
As compared to subjects maintained NPO, subjects that received oral nutrition while on CII had an increased rate of hyperglycemic events (BG >200 mg/dL: 86% vs. 76%, P = 0.19; >300 mg/dL: 57% vs. 53%, P = 0.69; >400 mg/dL: 32% vs. 21%, P = 0.22) and a decreased rate of hypoglycemic events (BG <70 mg/dL: 33% vs. 41%, P = 0.39; BG <60 mg/dL: 20% vs. 26%, P = 0.49; and BG <40 mg/dL: 4% vs. 6%, P = 0.65). The multivariate regression analyses, however, which considered age, gender, race, BMI, renal function, steroid use, history of diabetes, and number of BG tests, showed that nutrition status during CII was associated with increased frequency of hyperglycemic (P = 0.042) and hypoglycemic events (P = 0.086). As compared to NPO, oral intake (PO‐regular or PO‐liquid) was associated with a significantly increased frequency of hyperglycemic (P = 0.012) and hypoglycemic events (P = 0.035). Patients treated with TPN had lower BG values than those not on TPN. Although we observed no increased number of hypoglycemic events, TPN‐treated subjects had higher mortality than non‐TPN treated subjects (P < 0.001).
Discussion
Our study aimed to determine the safety and efficacy of CII in non‐critically‐ill patients with persistent hyperglycemia in general medicine and surgical services. We observed that the use of CII was effective in controlling hyperglycemia, with two‐thirds of patients achieving their target BG 150 mg/dL by 48 hours of insulin infusion. The rate of hypoglycemic events with the use of CII in non‐ICU patients was similar to that reported in recent ICU trials with intensive glycemic control7, 8, 15, 16 and is comparable to that reported in studies using SC insulin therapy in non‐ICU settings.17, 18 The number of hypoglycemic and hyperglycemic events was significantly higher in patients allowed to eat compared to those patients kept NPO during CII. There is substantial observational evidence linking hyperglycemia in hospitalized patients (with and without diabetes) to poor outcomes. There is ongoing debate, however, about the optimal level of BG in hospitalized patients. Early cohort studies as well as randomized controlled trials (RCTs) suggest that intensive treatment of hyperglycemia reduces length of hospital and ICU stay, multiorgan failure and systemic infections, and mortality.7, 9 These positive reports led the American Diabetes Association (ADA) and American Association of Clinical Endocrinologists (AACE) to recommend tight glycemic control (target of 80‐110 mg/dL) in critical care units. Recent multicenter controlled trials, however, have not been able to reproduce these results and in fact, have reported an increased risk of severe hypoglycemia and mortality in ICU patients in association with tight glycemic control.15, 16, 19 New glycemic targets call for more reasonable, achievable, and safer glycemic targets20, 21 in patients receiving CII in the ICU setting. The recent ADA/AACE Inpatient Task Force now recommends against aggressive BG targets of <110 mg/dL for patients in the ICU, and suggests maintaining glucose levels between 140 and 180 mg/dL during insulin therapy. However, lower targets between 110 and 140 mg/dL, while not evidence‐based, may be acceptable in a subset of patients as long as these levels can be achieved safely by a well‐trained staff.
There are no RCTs examining the effect of intensive glycemic control on outcomes or the optimal glycemic target in hospitalized patients outside the ICU setting. However, several observational studies point to a strong association between hyperglycemia and poor clinical outcomes, including prolonged hospital stay, infection, disability after hospital discharge, and death.1, 3, 5 Despite the paucity of randomized controlled trials on general medical‐surgical floors, a premeal BG target of <140 mg/dL with random BG <180 mg/dL are recommended as long as this target can be safely achieved.21
Our study indicates that the use of CII in the non‐ICU setting is effective in improving glycemic control. After the first day of CII, the mean glucose level was within the recommended BG target of <180 mg/dL for patients treated with CII in the ICU. Moreover, the mean daily BG level during CII was lower than those recently reported with the use of SC basal‐bolus and insulin neutral protamine hagedorn (NPH) and regular insulin combinations in non‐ICU settings.17, 18 In the Randomized Study of Basal Bolus Insulin Therapy in the Inpatient Management of Patients with Type 2 Diabetes (RABBIT 2) trial, a study that compared the efficacy and safety of an SC basal‐bolus to a sliding scale insulin regimen, showed that 66% and 38% of patients, respectively, reached a target BG of <140 mg/dL.17 The Comparison of Inpatient Insulin Regimens: DEtemir plus Aspart vs. NPH plus regular in Medical Patients with Type 2 Diabetes (DEAN Trial) trial reported daily mean BG levels after the first day of 160 38 mg/dL and 158 51 mg/dL in the detemir/aspart and NPH/regular group, respectively with an achieved BG target of <140 mg/dL in 45% of patients in the detemir/aspart and in 48% in the NPH/regular18; whereas in this study we observed that most patients reached the target BG goal by 48 hours of the CII regimen.
Increasing evidence indicates that inpatient hypoglycemia is associated with short‐term and long‐term adverse outcomes.22, 23 The incidence of severe hypoglycemia (<40 mg/dL) with intensified glycemic control has ranged between 9.8% and 19%7, 15 vs. <5% in conventional treatment. In the present study, 35% of patients experienced a BG <70 mg/dL, 22% had a BG <60 mg/dL, and 5% of patients had a BG <40 mg/dL. The lower rate of hypoglycemic events with the use of CII in the non‐ICU setting observed in this study is likely the result of a more relaxed glycemic target of 80 to 150 mg/dL for the majority of subjects, as well as fewer severe comorbidities compared to patients in the ICU, where the presence of sepsis or hepatic, adrenal, or renal failure increase the risk of hypoglycemia.2224
Multivariate analyses adjusted for age, gender, race, BMI, renal function, steroid use, history of diabetes, and number of BG tests showed that nutrition status during CII was an important factor associated with increased frequency of hyperglycemic and hypoglycemic events. Compared to subjects maintained NPO, subjects who received oral intake while on CII had a significantly increased rate of hyperglycemic and hypoglycemic events. The increased risk of hypoglycemia for those allowed to eat is expected as the protocol would mandate an increase in the CII rate in response to the prandial BG increase but does not make provisions for BG assessments or CII adjustments in relationship to the meal. These results indicate that in stable patients who are ready to start eating, CII should be stopped and transitioned to SC insulin regimen. In patients who may benefit from the continued use of CII (eg, patients requiring multistep procedures/surgeries), treatment with CII could be continued with supplemental mealtime insulin (intravenous [IV] or SC).
CII may be useful in cases of patients with persistent hyperglycemia despite scheduled SC insulin regimen; in patients where rapid glycemic control may be warranted in order to decrease the risk of increased inflammation and vascular dysfunction in acute coronary syndromes; and to enhance wound healing status post surgical procedures. Other clinical scenarios in which CII may be preferred and no ICU bed is required include cases of new‐onset diabetes with significant hyperglycemia (BG >300 mg/dL), type 1 diabetes poorly controlled with SC insulin, uncontrolled gestational diabetes, parenteral nutrition use, perioperative states, or the use of high‐dose steroids or chemotherapy.
Our findings are limited by the retrospective nature of our study and the evaluation of patients in a single university medical center. Selection bias should be considered in the interpretation of the results since each index case was selected by the attending physician to be treated with CII as opposed to another regimen for inpatient glycemic control. The selection bias, however, may be limited by the fact that the subjects in this study placed on CII seemed to be similar to those in the general hospital population. A previous pilot study from a different academic institution, however, reported that implementing CII protocols in non‐ICU patients is safe and improved glycemic control without increasing hypoglycemia.25 In addition, because most subjects in this study had a history of diabetes prior to admission, these results may not be generalizable to populations with stress‐induced hyperglycemia.
In summary, our study indicates that a CII regimen is an effective option for the management of patients with persistent hyperglycemia in the non‐critical care setting. Most patients achieved and remained within targeted BG levels during CII. The overall rate of hypoglycemic events was similar to that reported in recent randomized clinical trials in the ICU and with SC insulin therapy. The frequency of hypoglycemic and hyperglycemic events was significantly increased in patients allowed to eat during CII suggesting that CII should be stopped and patients should be transitioned to an SC insulin regimen once oral intake is initiated. Future prospective, randomized studies are needed to compare the efficacy and safety of CII protocols to SC insulin protocols in the management of patients with persistent hyperglycemia in the non‐ICU setting.
- ,,,,,.Hyperglycemia: an independent marker of in‐hospital mortality in patients with undiagnosed diabetes.J Clin Endocrinol Metab.2002;87(3):978–982.
- ,,, et al.Outcome benefit of intensive insulin therapy in the critically ill: insulin dose versus glycemic control.Crit Care Med.2003;31(2):359–366.
- ,,, et al.Early postoperative glucose control predicts nosocomial infection rate in diabetic patients.JPEN J Parenter Enteral Nutr.1998;22(2):77–81.
- ,,, et al.Randomized trial of insulin‐glucose infusion followed by subcutaneous insulin treatment in diabetic patients with acute myocardial infarction (DIGAMI study): effects on mortality at 1 year.J Am Coll Cardiol.1995;26(1):57–65.
- ,,,.Glucose control and mortality in critically ill patients.JAMA.2003;290(15):2041–2047.
- ,,, et al.Management of diabetes and hyperglycemia in hospitals.Diabetes Care.2004;27(2):553–597.
- ,,, et al.Intensive insulin therapy in the medical ICU.N Engl J Med.2006;354(5):449–461.
- ,,, et al.Intensive insulin therapy in the critically ill patients.N Engl J Med.2001;345(19):1359–1367.
- ,,, et al.Continuous insulin infusion reduces mortality in patients with diabetes undergoing coronary artery bypass grafting.J Thorac Cardiovasc Surg.2003;125(5):1007–1021.
- ,.Cost analysis of intensive glycemic control in critically ill adult patients.Chest.2006;129(3):644–650.
- ,,, et al.Intensive versus conventional glucose control in critically ill patients.N Engl J Med.2009;360(13):1283–1297.
- ,,, et al.Implementation of a safe and effective insulin infusion protocol in a medical intensive care unit.Diabetes Care.2004;27(2):461–467.
- ,,.Glycemic control and sliding scale insulin use in medical inpatients with diabetes mellitus.Arch Intern Med.1997;157(5):545–552.
- .Diabetes Dek Professional Edition.Eatonton, GA:American Diabetes Association;1993.
- ,,, et al.Intensive insulin therapy and pentastarch resuscitation in severe sepsis.N Engl J Med.2008;358(2):125–139.
- ,,, et al.Intensive insulin therapy and mortality among critically ill patients: a meta‐analysis including NICE‐SUGAR study data.CMAJ.2009;180(8):799–800.
- ,,, et al.Randomized study of basal‐bolus insulin therapy in the inpatient management of patients with type 2 diabetes (RABBIT 2 trial).Diabetes Care.2007;30(9):2181–2186.
- ,,, et al.Comparison of inpatient insulin regimens with detemir plus aspart versus neutral protamine hagedorn plus regular in medical patients with type 2 diabetes.J Clin Endocrinol Metab.2009;94(2):564–569.
- ,,, et al.Strict glycaemic control in patients hospitalised in a mixed medical and surgical intensive care unit: a randomised clinical trial.Crit Care.2008;12(5):R120.
- ,,, et al.Hyperglycemia and acute coronary syndrome: a scientific statement from the American Heart Association Diabetes Committee of the Council on Nutrition, Physical Activity, and Metabolism.Circulation.2008;117(12):1610–1619.
- ,,, et al.American Association of Clinical Endocrinologists/American Diabetes Association: Consensus Statement on Inpatient Glycemic Control.Endocr Pract.2009;15(4):353–369.
- .Blood glucose and its prognostic implications in patients hospitalised with acute myocardial infarction.Diab Vasc Dis Res.2008;5(4):269–275.
- ,.Severe hypoglycemia in critically ill patients: risk factors and outcomes.Crit Care Med.2007;35(10):2262–2267.
- ,,, et al.Evaluation of short‐term consequences of hypoglycemia in an intensive care unit.Crit Care Med.2006;34(11):2714–2718.
- ,,,.New insulin infusion protocol Improves blood glucose control in hospitalized patients without increasing hypoglycemia.Jt Comm J Qual Patient Saf.2005;31(3):141–147.
Copyright © 2010 Society of Hospital Medicine
Inpatient Hyperglycemia in Children
Diabetes is one of the most common diagnoses in hospitalized patients.1, 2 Hyperglycemia is present in 38% of adults admitted to the hospital, one third of whom had no history of diabetes before admission.3 The impact of inpatient hyperglycemia on clinical outcome in adult patients has been increasingly appreciated. Extensive evidence from observational studies indicates that hyperglycemia in patients with or without a history of diabetes is an important marker of poor clinical outcome.312 Several prospective randomized trials in patients with critical illness have shown that aggressive glycemic control improves short‐ and long‐term mortality, multiorgan failure and systemic infection, and length of hospitalization.1317 The importance of glucose control also applies to adult patients admitted to general surgical and medical wards.3, 6, 18 In such patients, we recently reported that the presence of hyperglycemia is associated with prolonged hospital stay, infection, disability after hospital discharge, and death.3, 6, 18 Despite the extensive data in adult patients, there is little information on the impact of inpatient hyperglycemia in pediatric patients. The few observational studies in critically ill children admitted to the pediatric ICU with severe brain injury or extensive burn injuries have shown a positive association between inpatient hyperglycemia and increased length of hospital and ICU stay and a higher risk of complication and mortality rates.1923 No previous studies, however, have examined the association of hyperglycemia and clinical outcome in children admitted to a general community pediatric hospital. Therefore, in this study we determined the prevalence of inpatient hyperglycemia and examined the impact of hyperglycemia on morbidity and mortality in children admitted to Hughes Spalding Children's Hospital, a large community hospital serving the inner city and indigent pediatric population in Atlanta, Georgia.
MATERIALS AND METHODS
This was a retrospective observational cohort of pediatric patients consecutively admitted to Hughes Spalding Children's Hospital in Atlanta from January 2004 to August 2004. This general community pediatric hospital is part of the Grady Health System in Atlanta, a large health care organization that operates under the auspices of the Fulton‐Dekalb Hospital Authoritythe major counties in metropolitan Atlantato deliver care to their uninsured and underserved populations. Ninety percent of the organization's inpatient cases are either uninsured or dependent on Medicaid. This is a broad‐based pediatric hospital without cardiac surgery, burn, or dedicated inpatient hematology‐oncology units. Patients are managed by members of the pediatric residency program and supervised by faculty members from Emory University School of Medicine. The Institutional Review Board of Emory University and Grady Health System Oversight Research Committee approved the methods for data collection and analysis used in the study and waived the need for informed consent.
The medical records of 903 consecutive pediatric patients admitted to both critical and noncritical care areas were reviewed. For the analysis, patients were divided according to a known history of diabetes prior to admission and according to admission blood glucose concentration. A normoglycemic group included patients with normal plasma glucose and without a history of diabetes. Serum or plasma glucose measured in the laboratory was assumed to be equivalent to blood glucose measured by finger stick at bedside using a glucose meter. Hyperglycemia was defined as an admission or in‐hospital blood glucose level >120 mg/dL. High blood glucose was subsequently divided into those with blood glucose of 120179 mg/dL and those with blood glucose 180 mg/dL. Patient information was collected regarding demographic characteristics, blood glucose level on admission and during hospital stay, concurrent medical diagnoses, medical treatment, and hospital outcome (including mortality and disposition at discharge).
The primary objectives of this study were to determine the prevalence of in‐hospital hyperglycemia and to examine the association of hyperglycemia and mortality in children with critical and noncritical illness in a community pediatric hospital. Secondary end points included length of hospital stay, requirement of intensive care, and treatment of hyperglycemia. In addition to blood glucose level, prognostic variables included sex, age, body mass index, admission diagnosis, presence of comorbidities, and intensive care unit admission.
Statistical Analysis
To compare demographics and clinical characteristics between groups, the independent t test and ANOVA with Sheff's method were used for continuous variables. Levine's test for homogeneity of variances and log transformations were used when necessary. For categorical variables, 2 analysis was used. P < .05 was considered significant. SPSS version 12.0 (SPSS, Inc., Chicago, IL), was the statistical software used for the analysis.
RESULTS
Of the 903 admitted patients, 342 patients (38%) had no blood glucose measurement during the hospital stay and were excluded from the analysis. Three patients with a length of stay greater than 6 months were excluded. In addition, 16 patients admitted with diabetic ketoacidosis (DKA) and 1 subject with hyperglycemic hyperosmolar syndrome were also excluded from the analysis. The remaining 542 patients constituted the study population. Most of these, 406 patients (75%), had an admission blood glucose concentration 120 mg/dL (mean SEM 98 1 mg/dL, median 93 mg/dL). A total of 103 children (19%) had an admission blood glucose level of 121179 mg/dL (mean 143 2 mg/dL, median 140 mg/dL), and 32 patients (5.9%) had an admission blood glucose level >180 mg/dL (mean 260 18 mg/dL, median 211 mg/dL; Fig. 1).

The clinical characteristics of study patients are shown in Table 1. Most patients in this study were from minority ethnic groups82% were black, 12% were Hispanic, 2% were from other minority groups, and 4.2% were white. There were no significant differences in mean age, sex, racial distribution, or body mass index among the 3 groups. A total of 409 patients (75.5%) were admitted to general pediatric wards and 133 patients (24.5%) were admitted to the surgical unit. There were no differences in the admission blood glucose between patients admitted to general pediatric wards (112.2 mg/dL) and those admitted to surgical areas (115.7 mg/dL, P > .05). The most common diagnoses in the severe hyperglycemia group were trauma/surgery (25%), pulmonary disease (18.8%), metabolic disorders (12.5%), and infection (6.3%). Most children admitted with hyperglycemia had no history of diabetes prior to admission. Among the 135 children with admission hyperglycemia (blood glucose >120 mg/dL), 17 patients (13%) had a known history of diabetes or were receiving therapy prior to admission. The mean admission blood glucose was 162.4 mg/dL (range 121480 mg/dL) in children with new hyperglycemia and 369.8 mg/dL (range 145678 mg/dL) in those children with a known history of diabetes (P < .01). Among children without a history of diabetes, 33 of 118 children (28%) with admission hyperglycemia had 1 or more glucose values >120 mg/dL during their hospitalizations. Twenty‐five children had a blood glucose of 121179 mg/dL (mean 109 5 mg/dL), and 8 children had a blood glucose 180 mg/dL (mean 159 13 mg/dL). Most patients with a history of diabetes were admitted with significant hyperglycemia. One patient (1%) had a glucose level in the 121179 mg/dL category, and 16 patients (50%) had a glucose level >180 mg/dL.
| BG <120 mg/dL | BG 121179 mg/dL | BG 180 mg/dL | |
|---|---|---|---|
| |||
| No. of patients (%) | 406 (75%) | 103 (19%) | 32 (6%) |
| Mean age (years) | 7.0 .4 | 6.8 .6 | 7.8 1.1 |
| Sex (M/F) | 50/50 | 57/43 | 50/50 |
| Race | |||
| White | 4% | 8% | 9% |
| Black | 80% | 80% | 84% |
| Hispanic | 15% | 10% | 6% |
| Other | 1% | 2% | 1% |
| Weight on admission (kg) | 29 2 | 26 3 | 32 6 |
| Height on admission (cm) | 79 4 | 94 9 | 74 19 |
| Body mass index (kg/m2) | 17 5 | 18 4 | 37 16 |
| Mean admission BG | 92 1 | 143 2 | 260 18 |
| Mean inpatient BG | 96 3 | 109 5 | 159 13 |
| Mean length of hospital stay | 3.8 0.2 | 5.4 1.0 | 5.7 1.8 |
| Mean length of ICU stay | 0.6 0.1 | 1.1 .4a | 3.6 1.9 |
| Admission service (%) | |||
| Pediatrics | 79.6% | 58.8% | 72.4% |
| Surgery | 20.4% | 41.2% | 27.6% |
The presence of hyperglycemia on admission in pediatric patients was not associated with increased mortality or with increased length of hospital stay. There was only 1 death reported during the study period, which occurred in a patient with respiratory failure because of bronchiolitis who was admitted with an admission blood glucose of 151 mg/dL. The mean length of stay for patients with normoglycemia was 3.83 0.2 days, which increased to 5.36 1.0 and 5.68 1.8 days for children with blood glucose of 120179 and 180 mg/dL, respectively (P > .05).
Children with hyperglycemia were more likely to be admitted to the ICU and had a longer length of ICU stay. Admission to the ICU was needed by 10% of children with an admission blood glucose <120 mg/dL, 18% of children with a blood glucose of 120179 mg/dL, and 40% of children with an admission blood 180 mg/dL (P < .01). In addition, length of ICU stay was significantly longer for hyperglycemic children, particularly those with a glucose level 180 mg/dL (P < .001). The mean length of ICU stay (ICU) was 0.56 0.1 days for patients with normoglycemia, and 1.1 0.4 days and 3.6 1.9 days for patients with a blood glucose of 120179 and 180 mg/dL, respectively (P < .01).
Newly diagnosed hyperglycemia was frequently left untreated. Only 3 children without a history of diabetes but with hyperglycemia recorded during the hospital stay received insulin therapy. New hyperglycemia patients received regular insulin per a sliding scale as the main insulin regimen in the hospital. In contrast, all patients with a previous history of diabetes were treated with insulin during their hospital stay.
DISCUSSION
Diabetes mellitus represents a significant public health burden on the basis of increased morbidity, mortality, and economic costs. Increasing evidence from observational and prospective interventional studies has shown that inpatient hyperglycemia is a predictor of poor clinical outcome of adult subjects.313, 16, 17 Admission hyperglycemia has been associated with increased morbidity and mortality in patients with critical illness, as well as in noncritically ill adult subjects admitted to general surgical and medical wards.3, 6, 18 In this study we also found that hyperglycemia is a common finding in children admitted with critical and noncritical illnesses and that most children had no history of diabetes before admission. One‐fourth of the children admitted to the hospital had hyperglycemia on admission. Children with hyperglycemia were more likely to be admitted to the ICU and had a longer length of ICU stay; however, inpatient hyperglycemia was not associated with higher hospital mortality or longer hospital stay than was inpatient normoglycemia. Our findings suggest that recognition of inpatient hyperglycemia can be improved because screening for hyperglycemia was not performed in more than one third of patients (38%) during the hospital stay.
The prevalence of inpatient hyperglycemia in children varies according to the severity of the illness and the study population. Ruiz Magro et al.21 reported that 50% of 353 critically ill children without diabetes mellitus had initial glucose values >120 mg/dL. In a study of 942 nondiabetic patients, Faustino et al.20 found that within 24 hours of admission to the ICU, hyperglycemia was prevalent in 70.4% of patients with a glucose value >120 mg/dL, 44.5% of patients with a glucose value >150 mg/dL, and 22.3% of patients with a glucose value >200 mg/dL. The prevalence of hyperglycemia in non‐critically ill children seen in the emergency department was much lower, ranging from 3.8% to 5.0% (based on an initial blood glucose >150 mg/dL).19, 24 In agreement with these studies, we found inpatient hyperglycemia to be a common finding among hospitalized children. Approximately 75% of our patients had a normal blood glucose on admission, 19% had an admission blood glucose of 121179 mg/dL (mean 143 2 mg/dL), and 5.9% of children had an admission blood glucose 180 mg/dL (mean 260 18 mg/dL). Only 13% of our patients had a known history of diabetes prior to admission, suggesting that the hyperglycemia was a result of the stress of the medical illness or the surgery. Stress hyperglycemia, defined as a transient increase in blood glucose level during acute physiological stress, has been reported to occur in 4% of children with an acute non‐critical illness and in more than 50% of children in the ICU.
A few studies have reported on the impact of inpatient hyperglycemia in children with acute critical illness.1015 Three retrospective studies have demonstrated that admission hyperglycemia is also a predictor of adverse outcomes in the pediatric intensive care unit.20, 22 Srinivasan and colleagues22 demonstrated that 86% of patients in their pediatric intensive care unit had a glucose value >126 mg/dL at some point during their stay. In addition, they showed that duration of the hyperglycemia and peak glucose were also associated with mortality. Faustino and Apkon20 demonstrated that hyperglycemia occurs frequently among critically‐ill nondiabetic children and is correlated with a greater in‐hospital mortality rate and longer length of stay in the ICU. They reported a 2.5‐fold increased risk of dying if the maximum glucose obtained within 24 hours of admission to the ICU was >150 mg/dL. More recently, Yates et al.25 reported that hyperglycemia in the postoperative period was associated with increased morbidity and mortality in postoperative pediatric cardiac patients. Other studies in children with traumatic brain or head injury have also shown an association between poor neurological outcome and elevated admission blood glucose.24, 2628 Brain trauma patients with permanent neurological deficits and in a vegetative state were found to have significantly higher admission blood glucose concentrations than children with good neurological recovery or minimal deficits. In addition, the development of inpatient hyperglycemia in children with extensive burn injuries, covering more than 60% of total body surface area, was found to increase the risk of bacteremia and fungemia, reduce skin graft adhesion, and increase the mortality rate.29 These data show an association of initial glucose, peak glucose, and duration of hyperglycemia with increased incidence of morbidity and mortality in children with acute critical illness. We found no association between initial blood glucose and risk of death. This is in contrast to our previous results in adult patients, in whom inpatient hyperglycemia was found to represent an important marker of increased morbidity and mortality among both those critically ill and not critically ill.3 It is important to note that the overall mortality rate reported in children with hyperglycemia relates to severity of illness and is significantly lower than that of adults.30 In most critically ill pediatric series, hospital mortality ranges from 2% to 5.3% and is higher in patients with severe trauma and those who underwent major cardiac surgery.23, 31 The mortality in children without critical illness admitted to general pediatric wards is significantly lower.30
In agreement with the increasing rate of obesity among children with diabetes,32, 33 especially in minority populations, we found that hospitalized children with a history of diabetes and glucose >180 mg/dL had a higher body mass index than those with normoglycemia (P < .001). Obesity in children has been associated with the presence of several comorbidities and an increased risk of hospital complications.34, 35 There is also increasing evidence among patients admitted to the intensive care unit that obesity contributes to increased morbidity and to a prolonged length of stay.35 Because they have a higher rate of hyperglycemia, diabetes, and hospital complications, we believe that obese children should be screened for hyperglycemia and diabetes.
We acknowledge the following limitations of this study. The main limitation was its retrospective nature. The method of blood glucose collection and analysis was not standardized; thus, it prevented uniformity in the determination of serum glucose values of individual patients. We arbitrarily used 3 glucose cutoff values in this study (<120, 120179, and >180 mg/dL). Although similar values have been used in inpatient diabetes studies,2022 there is no uniform definition of hyperglycemia in hospitalized patients, and the clinical significance of these cutoff values in pediatric population has not been determined. The study was conducted in a single institution in Atlanta, whose population and disease spectrum might be different from those at other pediatric institutions. Our study did not address the question of whether treatment of hyperglycemia might improve the outcome of length of hospital stay of patients with hyperglycemia. We believe that newly diagnosed hyperglycemia is usually considered a transient finding in response to acute illness not requiring medical intervention, as indicated by the fact that more than half of these patients did not receive antidiabetic therapy. Another limitation of our study is that we were not able to determine the percentage of patients with latent or unrecognized diabetes because of the lack of hemoglobin A1C testing and follow‐up after discharge. A prospective, randomized trial of strict glycemic control is certainly needed to address these issues.
In summary, inpatient hyperglycemia is a common finding in children with and without critical illness. One‐fourth of the children admitted to the hospital had hyperglycemia, most of them without a history of diabetes prior to admission. Although we found a higher need for ICU admission and a longer length of ICU stay, hyperglycemia in pediatric patients was not associated with higher hospital mortality compared with that in children with normoglycemia. Several observational studies have reported an association of hyperglycemia with poor clinical outcome in critically ill children; however, no prospective controlled studies have assessed the effect of tight glucose control in pediatric populations. These studies need to be prospective, randomized multicenter trials of sufficient magnitude to provide a well‐powered analysis to enable multiple observations and evaluation of subsets of critically and non‐critically ill pediatric patients.
- ,,, et al.Diabetes trends in the U.S.: 1990–1998.Diabetes Care.2000;23:1278–1283.
- ,,,,.Unrecognized diabetes among hospitalized patients.Diabetes Care.1998;21:246–249.
- ,,, et al.Hyperglycemia: an independent marker of in‐hospital mortality in patients with undiagnosed diabetes.J Clin Endocrinol Metab.2002;87:978–982.
- ,,, et al.Hospital hypoglycemia: not only treatment but also prevention.Endocr Pract.2004;10(Suppl 2):89–99.
- ,,,.Stress hyperglycaemia and increased risk of death after myocardial infarction in patients with and without diabetes: a systematic overview.Lancet.2000;355:773–778.
- ,,, et al.Management of diabetes and hyperglycemia in hospitals.Diabetes Care.2004;27:553–597.
- ,,,.Outcomes and perioperative hyperglycemia in patients with or without diabetes mellitus undergoing coronary artery bypass grafting.Ann Thorac Surg.2003;75:1392–1399.
- .Blood glucose management during critical illness.Rev Endocr Metab Disord.2003;4:187–194.
- ,,.Hyperglycemia in acutely ill patients.JAMA.2002;288:2167–2169.
- ,.ICU care for patients with diabetes.Curr Opin Endocrinol.2004;11:75–81.
- ,,.Admission plasma glucose. Independent risk factor for long‐term prognosis after myocardial infarction even in nondiabetic patients.Diabetes Care.1999;22:1827–1831.
- ,,,.Glucose control and mortality in critically ill patients.JAMA.2003;290:2041–2047.
- .Association between hyperglycemia and increased hospital mortality in a heterogeneous population of critically ill patients.Mayo Clin Proc.2003;78:1471–1478.
- ,,, et al.Management of hyperglycemic crises in patients with diabetes.Diabetes Care.2001;24:131–153.
- .Prospective randomised study of intensive insulin treatment on long term survival after acute myocardial infarction in patients with diabetes mellitus. DIGAMI (Diabetes Mellitus, Insulin Glucose Infusion in Acute Myocardial Infarction) Study Group.BMJ.1997;314:1512–1515.
- ,,, et al.Intensive insulin therapy in the medical ICU.N Engl J Med.2006;354:449–461.
- ,,, et al.Intensive insulin therapy in the critically ill patients.N Engl J Med.2001;345:1359–1367.
- ,,, et al.Early postoperative glucose control predicts nosocomial infection rate in diabetic patients.JPEN J Parenter Enteral Nutr.1998;22:77–81.
- ,,,,,.Prevalence of stress hyperglycemia among patients attending a pediatric emergency department.J Pediatr.1994;124:547–551.
- ,.Persistent hyperglycemia in critically ill children.J Pediatr.2005;146:30–34.
- ,, et al.[Metabolic changes in critically ill children].An Esp Pediatr.1999;51:143–148.
- ,,,,,:Association of timing, duration, and intensity of hyperglycemia with intensive care unit mortality in critically ill children.Pediatr Crit Care Med.2004;5:329–336.
- ,,.Improved survival with hospitalists in a pediatric intensive care unit.Crit Care Med2003;31:847–852.
- ,,,,,:High prevalence of stress hyperglycaemia in children with febrile seizures and traumatic injuries.Acta Paediatr2001;90:618–622.
- ,,, et al.Hyperglycemia is a marker for poor outcome in the postoperative pediatric cardiac patient.Pediatr Crit Care Med.2006;7:351–355.
- ,,,:Hyperglycemia and outcomes from pediatric traumatic brain injury.J Trauma.2003;55:1035–1038.
- ,,, et al.Prognostic implications of hyperglycaemia in paediatric head injury.Childs Nerv Syst.1998;14:455–459.
- ,,, et al.Gunshot wounds in brains of children: prognostic variables in mortality, course, and outcome.J Neurotrauma.1998;15:967–972.
- ,,,,,:Association of hyperglycemia with increased mortality after severe burn injury.J Trauma.51:540–544,2001.
- ,,, et al.Impact of a health maintenance organization hospitalist system in academic pediatrics.Pediatrics.2002;110:720–728.
- ,.Can regionalization decrease the number of deaths for children who undergo cardiac surgery? A theoretical analysis.Pediatrics.2002;109:173–181.
- ,,,.Emerging epidemic of type 2 diabetes in youth.Diabetes Care.1999;22:345–354.
- ,.Type 2 diabetes in children and adolescents: screening, diagnosis, and management.JAAPA.2007;20:51–54.
- ,,,,,.Childhood body mass index and perioperative complications.Paediatr Anaesth.2007;17:426–430.
- ,,,.Childhood obesity increases duration of therapy during severe asthma exacerbations.Pediatr Crit Care Med.2006;7:527–531.
Diabetes is one of the most common diagnoses in hospitalized patients.1, 2 Hyperglycemia is present in 38% of adults admitted to the hospital, one third of whom had no history of diabetes before admission.3 The impact of inpatient hyperglycemia on clinical outcome in adult patients has been increasingly appreciated. Extensive evidence from observational studies indicates that hyperglycemia in patients with or without a history of diabetes is an important marker of poor clinical outcome.312 Several prospective randomized trials in patients with critical illness have shown that aggressive glycemic control improves short‐ and long‐term mortality, multiorgan failure and systemic infection, and length of hospitalization.1317 The importance of glucose control also applies to adult patients admitted to general surgical and medical wards.3, 6, 18 In such patients, we recently reported that the presence of hyperglycemia is associated with prolonged hospital stay, infection, disability after hospital discharge, and death.3, 6, 18 Despite the extensive data in adult patients, there is little information on the impact of inpatient hyperglycemia in pediatric patients. The few observational studies in critically ill children admitted to the pediatric ICU with severe brain injury or extensive burn injuries have shown a positive association between inpatient hyperglycemia and increased length of hospital and ICU stay and a higher risk of complication and mortality rates.1923 No previous studies, however, have examined the association of hyperglycemia and clinical outcome in children admitted to a general community pediatric hospital. Therefore, in this study we determined the prevalence of inpatient hyperglycemia and examined the impact of hyperglycemia on morbidity and mortality in children admitted to Hughes Spalding Children's Hospital, a large community hospital serving the inner city and indigent pediatric population in Atlanta, Georgia.
MATERIALS AND METHODS
This was a retrospective observational cohort of pediatric patients consecutively admitted to Hughes Spalding Children's Hospital in Atlanta from January 2004 to August 2004. This general community pediatric hospital is part of the Grady Health System in Atlanta, a large health care organization that operates under the auspices of the Fulton‐Dekalb Hospital Authoritythe major counties in metropolitan Atlantato deliver care to their uninsured and underserved populations. Ninety percent of the organization's inpatient cases are either uninsured or dependent on Medicaid. This is a broad‐based pediatric hospital without cardiac surgery, burn, or dedicated inpatient hematology‐oncology units. Patients are managed by members of the pediatric residency program and supervised by faculty members from Emory University School of Medicine. The Institutional Review Board of Emory University and Grady Health System Oversight Research Committee approved the methods for data collection and analysis used in the study and waived the need for informed consent.
The medical records of 903 consecutive pediatric patients admitted to both critical and noncritical care areas were reviewed. For the analysis, patients were divided according to a known history of diabetes prior to admission and according to admission blood glucose concentration. A normoglycemic group included patients with normal plasma glucose and without a history of diabetes. Serum or plasma glucose measured in the laboratory was assumed to be equivalent to blood glucose measured by finger stick at bedside using a glucose meter. Hyperglycemia was defined as an admission or in‐hospital blood glucose level >120 mg/dL. High blood glucose was subsequently divided into those with blood glucose of 120179 mg/dL and those with blood glucose 180 mg/dL. Patient information was collected regarding demographic characteristics, blood glucose level on admission and during hospital stay, concurrent medical diagnoses, medical treatment, and hospital outcome (including mortality and disposition at discharge).
The primary objectives of this study were to determine the prevalence of in‐hospital hyperglycemia and to examine the association of hyperglycemia and mortality in children with critical and noncritical illness in a community pediatric hospital. Secondary end points included length of hospital stay, requirement of intensive care, and treatment of hyperglycemia. In addition to blood glucose level, prognostic variables included sex, age, body mass index, admission diagnosis, presence of comorbidities, and intensive care unit admission.
Statistical Analysis
To compare demographics and clinical characteristics between groups, the independent t test and ANOVA with Sheff's method were used for continuous variables. Levine's test for homogeneity of variances and log transformations were used when necessary. For categorical variables, 2 analysis was used. P < .05 was considered significant. SPSS version 12.0 (SPSS, Inc., Chicago, IL), was the statistical software used for the analysis.
RESULTS
Of the 903 admitted patients, 342 patients (38%) had no blood glucose measurement during the hospital stay and were excluded from the analysis. Three patients with a length of stay greater than 6 months were excluded. In addition, 16 patients admitted with diabetic ketoacidosis (DKA) and 1 subject with hyperglycemic hyperosmolar syndrome were also excluded from the analysis. The remaining 542 patients constituted the study population. Most of these, 406 patients (75%), had an admission blood glucose concentration 120 mg/dL (mean SEM 98 1 mg/dL, median 93 mg/dL). A total of 103 children (19%) had an admission blood glucose level of 121179 mg/dL (mean 143 2 mg/dL, median 140 mg/dL), and 32 patients (5.9%) had an admission blood glucose level >180 mg/dL (mean 260 18 mg/dL, median 211 mg/dL; Fig. 1).
The clinical characteristics of study patients are shown in Table 1. Most patients in this study were from minority ethnic groups82% were black, 12% were Hispanic, 2% were from other minority groups, and 4.2% were white. There were no significant differences in mean age, sex, racial distribution, or body mass index among the 3 groups. A total of 409 patients (75.5%) were admitted to general pediatric wards and 133 patients (24.5%) were admitted to the surgical unit. There were no differences in the admission blood glucose between patients admitted to general pediatric wards (112.2 mg/dL) and those admitted to surgical areas (115.7 mg/dL, P > .05). The most common diagnoses in the severe hyperglycemia group were trauma/surgery (25%), pulmonary disease (18.8%), metabolic disorders (12.5%), and infection (6.3%). Most children admitted with hyperglycemia had no history of diabetes prior to admission. Among the 135 children with admission hyperglycemia (blood glucose >120 mg/dL), 17 patients (13%) had a known history of diabetes or were receiving therapy prior to admission. The mean admission blood glucose was 162.4 mg/dL (range 121480 mg/dL) in children with new hyperglycemia and 369.8 mg/dL (range 145678 mg/dL) in those children with a known history of diabetes (P < .01). Among children without a history of diabetes, 33 of 118 children (28%) with admission hyperglycemia had 1 or more glucose values >120 mg/dL during their hospitalizations. Twenty‐five children had a blood glucose of 121179 mg/dL (mean 109 5 mg/dL), and 8 children had a blood glucose 180 mg/dL (mean 159 13 mg/dL). Most patients with a history of diabetes were admitted with significant hyperglycemia. One patient (1%) had a glucose level in the 121179 mg/dL category, and 16 patients (50%) had a glucose level >180 mg/dL.
| BG <120 mg/dL | BG 121179 mg/dL | BG 180 mg/dL | |
|---|---|---|---|
| |||
| No. of patients (%) | 406 (75%) | 103 (19%) | 32 (6%) |
| Mean age (years) | 7.0 .4 | 6.8 .6 | 7.8 1.1 |
| Sex (M/F) | 50/50 | 57/43 | 50/50 |
| Race | |||
| White | 4% | 8% | 9% |
| Black | 80% | 80% | 84% |
| Hispanic | 15% | 10% | 6% |
| Other | 1% | 2% | 1% |
| Weight on admission (kg) | 29 2 | 26 3 | 32 6 |
| Height on admission (cm) | 79 4 | 94 9 | 74 19 |
| Body mass index (kg/m2) | 17 5 | 18 4 | 37 16 |
| Mean admission BG | 92 1 | 143 2 | 260 18 |
| Mean inpatient BG | 96 3 | 109 5 | 159 13 |
| Mean length of hospital stay | 3.8 0.2 | 5.4 1.0 | 5.7 1.8 |
| Mean length of ICU stay | 0.6 0.1 | 1.1 .4a | 3.6 1.9 |
| Admission service (%) | |||
| Pediatrics | 79.6% | 58.8% | 72.4% |
| Surgery | 20.4% | 41.2% | 27.6% |
The presence of hyperglycemia on admission in pediatric patients was not associated with increased mortality or with increased length of hospital stay. There was only 1 death reported during the study period, which occurred in a patient with respiratory failure because of bronchiolitis who was admitted with an admission blood glucose of 151 mg/dL. The mean length of stay for patients with normoglycemia was 3.83 0.2 days, which increased to 5.36 1.0 and 5.68 1.8 days for children with blood glucose of 120179 and 180 mg/dL, respectively (P > .05).
Children with hyperglycemia were more likely to be admitted to the ICU and had a longer length of ICU stay. Admission to the ICU was needed by 10% of children with an admission blood glucose <120 mg/dL, 18% of children with a blood glucose of 120179 mg/dL, and 40% of children with an admission blood 180 mg/dL (P < .01). In addition, length of ICU stay was significantly longer for hyperglycemic children, particularly those with a glucose level 180 mg/dL (P < .001). The mean length of ICU stay (ICU) was 0.56 0.1 days for patients with normoglycemia, and 1.1 0.4 days and 3.6 1.9 days for patients with a blood glucose of 120179 and 180 mg/dL, respectively (P < .01).
Newly diagnosed hyperglycemia was frequently left untreated. Only 3 children without a history of diabetes but with hyperglycemia recorded during the hospital stay received insulin therapy. New hyperglycemia patients received regular insulin per a sliding scale as the main insulin regimen in the hospital. In contrast, all patients with a previous history of diabetes were treated with insulin during their hospital stay.
DISCUSSION
Diabetes mellitus represents a significant public health burden on the basis of increased morbidity, mortality, and economic costs. Increasing evidence from observational and prospective interventional studies has shown that inpatient hyperglycemia is a predictor of poor clinical outcome of adult subjects.313, 16, 17 Admission hyperglycemia has been associated with increased morbidity and mortality in patients with critical illness, as well as in noncritically ill adult subjects admitted to general surgical and medical wards.3, 6, 18 In this study we also found that hyperglycemia is a common finding in children admitted with critical and noncritical illnesses and that most children had no history of diabetes before admission. One‐fourth of the children admitted to the hospital had hyperglycemia on admission. Children with hyperglycemia were more likely to be admitted to the ICU and had a longer length of ICU stay; however, inpatient hyperglycemia was not associated with higher hospital mortality or longer hospital stay than was inpatient normoglycemia. Our findings suggest that recognition of inpatient hyperglycemia can be improved because screening for hyperglycemia was not performed in more than one third of patients (38%) during the hospital stay.
The prevalence of inpatient hyperglycemia in children varies according to the severity of the illness and the study population. Ruiz Magro et al.21 reported that 50% of 353 critically ill children without diabetes mellitus had initial glucose values >120 mg/dL. In a study of 942 nondiabetic patients, Faustino et al.20 found that within 24 hours of admission to the ICU, hyperglycemia was prevalent in 70.4% of patients with a glucose value >120 mg/dL, 44.5% of patients with a glucose value >150 mg/dL, and 22.3% of patients with a glucose value >200 mg/dL. The prevalence of hyperglycemia in non‐critically ill children seen in the emergency department was much lower, ranging from 3.8% to 5.0% (based on an initial blood glucose >150 mg/dL).19, 24 In agreement with these studies, we found inpatient hyperglycemia to be a common finding among hospitalized children. Approximately 75% of our patients had a normal blood glucose on admission, 19% had an admission blood glucose of 121179 mg/dL (mean 143 2 mg/dL), and 5.9% of children had an admission blood glucose 180 mg/dL (mean 260 18 mg/dL). Only 13% of our patients had a known history of diabetes prior to admission, suggesting that the hyperglycemia was a result of the stress of the medical illness or the surgery. Stress hyperglycemia, defined as a transient increase in blood glucose level during acute physiological stress, has been reported to occur in 4% of children with an acute non‐critical illness and in more than 50% of children in the ICU.
A few studies have reported on the impact of inpatient hyperglycemia in children with acute critical illness.1015 Three retrospective studies have demonstrated that admission hyperglycemia is also a predictor of adverse outcomes in the pediatric intensive care unit.20, 22 Srinivasan and colleagues22 demonstrated that 86% of patients in their pediatric intensive care unit had a glucose value >126 mg/dL at some point during their stay. In addition, they showed that duration of the hyperglycemia and peak glucose were also associated with mortality. Faustino and Apkon20 demonstrated that hyperglycemia occurs frequently among critically‐ill nondiabetic children and is correlated with a greater in‐hospital mortality rate and longer length of stay in the ICU. They reported a 2.5‐fold increased risk of dying if the maximum glucose obtained within 24 hours of admission to the ICU was >150 mg/dL. More recently, Yates et al.25 reported that hyperglycemia in the postoperative period was associated with increased morbidity and mortality in postoperative pediatric cardiac patients. Other studies in children with traumatic brain or head injury have also shown an association between poor neurological outcome and elevated admission blood glucose.24, 2628 Brain trauma patients with permanent neurological deficits and in a vegetative state were found to have significantly higher admission blood glucose concentrations than children with good neurological recovery or minimal deficits. In addition, the development of inpatient hyperglycemia in children with extensive burn injuries, covering more than 60% of total body surface area, was found to increase the risk of bacteremia and fungemia, reduce skin graft adhesion, and increase the mortality rate.29 These data show an association of initial glucose, peak glucose, and duration of hyperglycemia with increased incidence of morbidity and mortality in children with acute critical illness. We found no association between initial blood glucose and risk of death. This is in contrast to our previous results in adult patients, in whom inpatient hyperglycemia was found to represent an important marker of increased morbidity and mortality among both those critically ill and not critically ill.3 It is important to note that the overall mortality rate reported in children with hyperglycemia relates to severity of illness and is significantly lower than that of adults.30 In most critically ill pediatric series, hospital mortality ranges from 2% to 5.3% and is higher in patients with severe trauma and those who underwent major cardiac surgery.23, 31 The mortality in children without critical illness admitted to general pediatric wards is significantly lower.30
In agreement with the increasing rate of obesity among children with diabetes,32, 33 especially in minority populations, we found that hospitalized children with a history of diabetes and glucose >180 mg/dL had a higher body mass index than those with normoglycemia (P < .001). Obesity in children has been associated with the presence of several comorbidities and an increased risk of hospital complications.34, 35 There is also increasing evidence among patients admitted to the intensive care unit that obesity contributes to increased morbidity and to a prolonged length of stay.35 Because they have a higher rate of hyperglycemia, diabetes, and hospital complications, we believe that obese children should be screened for hyperglycemia and diabetes.
We acknowledge the following limitations of this study. The main limitation was its retrospective nature. The method of blood glucose collection and analysis was not standardized; thus, it prevented uniformity in the determination of serum glucose values of individual patients. We arbitrarily used 3 glucose cutoff values in this study (<120, 120179, and >180 mg/dL). Although similar values have been used in inpatient diabetes studies,2022 there is no uniform definition of hyperglycemia in hospitalized patients, and the clinical significance of these cutoff values in pediatric population has not been determined. The study was conducted in a single institution in Atlanta, whose population and disease spectrum might be different from those at other pediatric institutions. Our study did not address the question of whether treatment of hyperglycemia might improve the outcome of length of hospital stay of patients with hyperglycemia. We believe that newly diagnosed hyperglycemia is usually considered a transient finding in response to acute illness not requiring medical intervention, as indicated by the fact that more than half of these patients did not receive antidiabetic therapy. Another limitation of our study is that we were not able to determine the percentage of patients with latent or unrecognized diabetes because of the lack of hemoglobin A1C testing and follow‐up after discharge. A prospective, randomized trial of strict glycemic control is certainly needed to address these issues.
In summary, inpatient hyperglycemia is a common finding in children with and without critical illness. One‐fourth of the children admitted to the hospital had hyperglycemia, most of them without a history of diabetes prior to admission. Although we found a higher need for ICU admission and a longer length of ICU stay, hyperglycemia in pediatric patients was not associated with higher hospital mortality compared with that in children with normoglycemia. Several observational studies have reported an association of hyperglycemia with poor clinical outcome in critically ill children; however, no prospective controlled studies have assessed the effect of tight glucose control in pediatric populations. These studies need to be prospective, randomized multicenter trials of sufficient magnitude to provide a well‐powered analysis to enable multiple observations and evaluation of subsets of critically and non‐critically ill pediatric patients.
- ,,, et al.Diabetes trends in the U.S.: 1990–1998.Diabetes Care.2000;23:1278–1283.
- ,,,,.Unrecognized diabetes among hospitalized patients.Diabetes Care.1998;21:246–249.
- ,,, et al.Hyperglycemia: an independent marker of in‐hospital mortality in patients with undiagnosed diabetes.J Clin Endocrinol Metab.2002;87:978–982.
- ,,, et al.Hospital hypoglycemia: not only treatment but also prevention.Endocr Pract.2004;10(Suppl 2):89–99.
- ,,,.Stress hyperglycaemia and increased risk of death after myocardial infarction in patients with and without diabetes: a systematic overview.Lancet.2000;355:773–778.
- ,,, et al.Management of diabetes and hyperglycemia in hospitals.Diabetes Care.2004;27:553–597.
- ,,,.Outcomes and perioperative hyperglycemia in patients with or without diabetes mellitus undergoing coronary artery bypass grafting.Ann Thorac Surg.2003;75:1392–1399.
- .Blood glucose management during critical illness.Rev Endocr Metab Disord.2003;4:187–194.
- ,,.Hyperglycemia in acutely ill patients.JAMA.2002;288:2167–2169.
- ,.ICU care for patients with diabetes.Curr Opin Endocrinol.2004;11:75–81.
- ,,.Admission plasma glucose. Independent risk factor for long‐term prognosis after myocardial infarction even in nondiabetic patients.Diabetes Care.1999;22:1827–1831.
- ,,,.Glucose control and mortality in critically ill patients.JAMA.2003;290:2041–2047.
- .Association between hyperglycemia and increased hospital mortality in a heterogeneous population of critically ill patients.Mayo Clin Proc.2003;78:1471–1478.
- ,,, et al.Management of hyperglycemic crises in patients with diabetes.Diabetes Care.2001;24:131–153.
- .Prospective randomised study of intensive insulin treatment on long term survival after acute myocardial infarction in patients with diabetes mellitus. DIGAMI (Diabetes Mellitus, Insulin Glucose Infusion in Acute Myocardial Infarction) Study Group.BMJ.1997;314:1512–1515.
- ,,, et al.Intensive insulin therapy in the medical ICU.N Engl J Med.2006;354:449–461.
- ,,, et al.Intensive insulin therapy in the critically ill patients.N Engl J Med.2001;345:1359–1367.
- ,,, et al.Early postoperative glucose control predicts nosocomial infection rate in diabetic patients.JPEN J Parenter Enteral Nutr.1998;22:77–81.
- ,,,,,.Prevalence of stress hyperglycemia among patients attending a pediatric emergency department.J Pediatr.1994;124:547–551.
- ,.Persistent hyperglycemia in critically ill children.J Pediatr.2005;146:30–34.
- ,, et al.[Metabolic changes in critically ill children].An Esp Pediatr.1999;51:143–148.
- ,,,,,:Association of timing, duration, and intensity of hyperglycemia with intensive care unit mortality in critically ill children.Pediatr Crit Care Med.2004;5:329–336.
- ,,.Improved survival with hospitalists in a pediatric intensive care unit.Crit Care Med2003;31:847–852.
- ,,,,,:High prevalence of stress hyperglycaemia in children with febrile seizures and traumatic injuries.Acta Paediatr2001;90:618–622.
- ,,, et al.Hyperglycemia is a marker for poor outcome in the postoperative pediatric cardiac patient.Pediatr Crit Care Med.2006;7:351–355.
- ,,,:Hyperglycemia and outcomes from pediatric traumatic brain injury.J Trauma.2003;55:1035–1038.
- ,,, et al.Prognostic implications of hyperglycaemia in paediatric head injury.Childs Nerv Syst.1998;14:455–459.
- ,,, et al.Gunshot wounds in brains of children: prognostic variables in mortality, course, and outcome.J Neurotrauma.1998;15:967–972.
- ,,,,,:Association of hyperglycemia with increased mortality after severe burn injury.J Trauma.51:540–544,2001.
- ,,, et al.Impact of a health maintenance organization hospitalist system in academic pediatrics.Pediatrics.2002;110:720–728.
- ,.Can regionalization decrease the number of deaths for children who undergo cardiac surgery? A theoretical analysis.Pediatrics.2002;109:173–181.
- ,,,.Emerging epidemic of type 2 diabetes in youth.Diabetes Care.1999;22:345–354.
- ,.Type 2 diabetes in children and adolescents: screening, diagnosis, and management.JAAPA.2007;20:51–54.
- ,,,,,.Childhood body mass index and perioperative complications.Paediatr Anaesth.2007;17:426–430.
- ,,,.Childhood obesity increases duration of therapy during severe asthma exacerbations.Pediatr Crit Care Med.2006;7:527–531.
Copyright © 2008 Society of Hospital Medicine