User login
Depression screening: a practical strategy
- A 2-stage strategy, combining an assessment of severity with depression criteria, can help a physician focus on the most severe cases without missing less severe ones that still need treatment (B).
- Because of its brevity, relatively high positive predictive value, and ability to inform the clinician on both depression severity and diagnostic criteria, the PRIME-MD Patient Health Questionnaire (PHQ-9) is the best available depression screening tool for primary care (B).
- One-time screening is cost-effective; physicians may elect to screen more often based on risk factors (A).
What is the most efficient and accurate way for a busy primary care physician to screen patients for depression? Many screening tools exist, but they are not equally effective.
A careful review of the literature strongly favors a 2-stage strategy assessing both depression severity and criteria. In this article, we describe this optimal approach against the background of other available resources.
Health and economic impact of depression
In the average family practice, around 6 cases of depression go unrecognized each week. This real-world estimate derives from studies that consistently report a 10% prevalence of depression in primary care patients1 but a rate of recognition by primary care clinicians of only 29% to 35%.2-4 Depression is a common condition with a large impact on quality of life and productivity, one that indirectly affects other health states, including cardiovascular disease.5-9 It is responsible for an estimated economic cost in the US of over $40 billion annually. As a result, depression screening has been an active area of research, and a variety of organizations have issued guidelines recommending routine screening for depression in primary care.
The need for an efficient, reliable screening tool
Based on a recent review of the evidence on depression screening outcomes in primary care settings,10 the US Preventive Services Task Force (USPSTF) updated its screening recommendation in 2002 to include an endorsement of depression screening in adults “in clinical practices that have systems in place to assure accurate diagnosis, effective treatment, and follow-up” (strength of recommendation [SOR]=A).11 This endorsement leaves the primary care clinician with no guidance about how or when to screen for depression.
Despite lack of guidance in the USPTF guidelines, we believe depression screening can be done efficiently and reliably in primary care. However, one must begin by understanding that depression screening is different from screening for cancer or cardiovascular risk factors (Table 1). The burdens of interpretation of depression screening results are especially noteworthy. For example, the PRIME-MD Patient Health Questionnaire (PHQ) is reported to have a sensitivity of 61% and specificity of 94% for any mood or depressive disorder.12 This results in a positive predictive value (PPV) of 50% using a reasonable estimate of 10% prevalence for depression in primary care settings.13
Put simply, following administration and scoring of the PHQ, the clinician is left with little better odds than a coin toss of identifying a patient that has an active major depressive disorder requiring treatment. If there was no objective help, clinicians would have only their clinical judgment to resolve this, all during an office visit that contains many other competing agendas and demands.14,15
We have reviewed the evidence on depression screening instruments with the intent to highlight an instrument that clinicians can efficiently and reliably use to find depressed and impaired patients in their practice whom they might otherwise miss.
TABLE 1
Burdens of screening for cancer, hyperlipidemia, and depression
| Cancer | Hyperlipidemia | Depression | ||||
|---|---|---|---|---|---|---|
| Burden of performance | Low | Simple test or performance of billable procedure | Low | Blood test | High | Time-intensive administration & scoring |
| Burden of interpretation | Low | Confirmatory testing often referred to specialists | Low | No confirmatory reference standard testing | High | High false positive rate w/burdensome reference standard |
| Burden of treatment | Low | Treatment done by specialists | High | Requires activation of patient & frequent monitoring | High | Requires activation of patient & frequent monitoring |
Two types of screening instruments
Depression screening instruments can be grouped into 2 categories:
- depression assessment scales, which ask patients to rate the severity or frequency of various symptoms
- symptom count instruments, which are based on depression criteria.
Depression assessment scales preceded symptom count instruments, and many were developed prior to the establishment of formal diagnostic criteria within the Diagnostic and Statistical Manual ofMental Disorders (DSM) system.16 Table 2 lists available examples of depression assessment scales and symptom count instruments, along with websites where you may access further information and the instruments themselves.
TABLE 2
Accuracy and ease of administration of commonly available screening instruments
| Instrument | Time and scoring | LR+ (95% CI) | LR– (95% CI) | PPV (95% CI) | Web source |
|---|---|---|---|---|---|
| Assessment scale | |||||
| Beck Depression Inventory (BDI)32 | 2–5 min; simple | 4.2 (1.2–13.6) | 0.17 (0.1–0.3) | 29.6% (10.7–57.6) | www.psychcorpcenter.com/content/bdi-II.htm |
| Center for Epidemiologic Studies Depression Scale (CES-D)34 | 2–5 min; simple | 3.3 (2.5–4.4) | 0.24 (0.2–0.3) | 24.8% (20–30.6) | http://www.mhhe.com/hper/health/personal health/labs/Stress/activ2-2.html |
| Geriatric Depression Scale (GDS)35 | 2–5 min; simple> | 3.3 (2.4–4.7) | 0.16 (0.1–0.3) | 24.8% (19.4–32) | http://www.stanford.edu/~yesavage/GDS.html |
| Hospital Anxiety and Depression Scale* (HADS)20 | 2–5 min; simple | 7.0 (2.9–11.2) | 0.3 (0.3–0.4) | 41.3% (22.6–52.8) | www.clinical-supervision.com/hads.htm |
| Zung Self Assessment Depression Scale (Zung SDS)33 | 2–5 min; simple | 3.3 (1.3–8.1) | 0.35 (0.2–0.8) | 24.8% (11.5–44.8) | http://fpinfo.medicine.uiowa.edu/calculat.htm |
| Symptom count | |||||
| Primary Care Evaluation of Mental Disorders †(PRIME-MD)27 | 2 min; complex | 2.7 (2.0–3.7) | 0.14 (0.1–0.3) | 21.3% (16.7–27) | Available upon request to Robert Spitzer, MD: RLS8@columbia.edu |
| PRIME-MD Patient Health Questionnaire (PHQ) | 5–7 min; simple | 10.2‡ (6.5–17.5) | 0.4‡ (0.3–0.5) | 50.4% (39.4–63.6) | fpinfo.medicine.uiowa.edu/calculat.htm |
| Symptom-Driven Diagnostic System for Primary Care†(SDDS-PC) | 2 min; simple | 3.5 (2.4–5.1) | 0.2 (0.1–0.4) | 25.9% (19.4–33.8) | No website available |
| PRIME-MD Patient Health Questionnaire (PHQ-9) | 2 –5 min; simple | 12.2 (8.4–18) | 0.28 (0.2–0.5) | 55% (45.7–64.3) | www.depression-primarycare.org/ap1.html |
| * Unless noted by (*), adapted from Williams et al.18 | |||||
| † Values reflect the initial brief screening portion of these instruments. | |||||
| ‡ PHQ vaues obtained from original position and reflect diagnosis of “any mood disorders.” | |||||
| LR+, positive likelihood ratio; LR–, negative likelihood ratio; PPV, positive predictive value; CI, confidence interval | |||||
Pros and cons of assessment scales
The advantages of using a scale are due to the manner in which patients experience depressive symptoms, along a continuum of mild to severe. A scale is able to represent these gradations in severity and may be helpful in guiding the need for treatment and treatment adjustments.
Unfortunately, this ability to measure the dimensional nature of depression is also a weakness, as a threshold must be identified above which the patient is classified as warranting further investigation. Ideally, these thresholds should be established in a representative primary care sample and predict functional status as well as likelihood of meeting DSM-IV diagnostic criteria. The ability of a scale to accurately identify patients in need of attention depends directly on the threshold.
Pros and cons of symptom counts
Instruments based on depression criteria are a relatively new innovation, appearing since the establishment of DSM-IV criteria that define reference symptoms, a minimum number of which must be present to diagnose depression. Depression criteria–based instruments have the advantage of not being dependent on a threshold of symptom severity.
However, in primary care settings this can also be a weakness because the presence of depression criteria alone may not be a reliable indicator of depression-related impairment.17 Instruments that can be used in both a diagnostic criteria and scale modes have a particular advantage in that the weaknesses of each are offset.
Characteristics of selected screening instruments
We searched MEDLINE and the Cochrane databases for reviews of depression screening, with particular attention to reviews of primary care-based trials. Forty-one papers emerged, 3 of which were systematic reviews. For this paper, we focused on the review published by Williams and colleagues,18 which summarizes primary care data on the depression screening instruments most widely used. They examined 379 studies that compared the primary care performance of these instruments with a reference standard diagnostic interview, such as the Structured Clinical Interview for DSM-IV (SCID).19 Twenty-eight studies met their criteria and were included in the systematic review.
In Table 2 we have adapted the information from Williams’s review and added a calculation of PPV based on a 10% prevalence estimate for depression in primary care populations. We chose to exclude information on the Single Question (SQ) screen because of its very low PPV and the Hopkins Symptom Checklist (HSCL) because of its length (25 questions). In addition, we chose to add the Hospital Anxiety and Depression Scale (HADS), using operating characteristic information from 2 studies,20,21 because of its purported advantages in medically ill populations.
Beyond the SQ, it is useful to comment on “2-question screening” as suggested by the USPSTF. We are unable to find justification for this in the paper by Pingone and colleagues, which served as background for the recommendations.10 Although Pingone et al did cite the report of Wells and colleagues as using a 2-item screener, their study used not only 2 questions on mood and anhedonia but also other criteria in screening their population.22 Therefore, it is not appropriate as a source for 2-item screening performance characteristics.
Comparison of the operating characteristics of the selected instruments reveals that most yield PPV values in the 20% to 30% range, with the exception of the HADS, the PHQ, and the PHQ-9, which yield PPV values of 41.3%, 50%, and 55%, respectively.
The PHQ-9 (included in the (Appendix) offers a further advantage over the HADS and other instruments listed in that within a 9-item instrument both the presence of diagnostic criteria and severity may be assessed. Kroenke and colleagues have examined the use of the PHQ-9 as a severity instrument and found it to be a reliable and valid measure of depression severity when compared with the Medical Outcomes Study Short Form (SF-20).23
We purposely have not examined negative predictive values (NPV) for the listed instruments. NPV is useful when screening using biomedical markers where a negative result allows extrapolation into the future due to a known, predictable time course for development of the screened-for condition. For example, a negative screening colonoscopy has value not just because of its current predictive value, but because we know something about how long it may take to develop precancerous polyps in a negative screened patient. However, this is not the case with depression. A patient that fails to meet criteria for depression today could fully meet criteria in 2 weeks and be quite depressed. Therefore we have chosen to focus on PPV in comparing depression screening instruments.
Selection and use of a screening instrument
How should a busy clinician select a depression screening instrument? Ease of administration and interpretation are key. Ideally, a depression screen should function similarly to a vital sign, providing an easy-to-assess yet reliable marker of the need to address a patient’s depression. It is not enough to know that formal depression criteria are met; it is also important to know whether a patient’s functioning is impaired. Research indicates that it is difficult in primary care to “clinically” assess functioning in the face of numerous competing demands,15 even when clinicians know from a screening test that a patient meets criteria for depression.24 For this reason, even watchful waiting for the “positive screening/low impairment” patients25 may be difficult to put into practice.
Two-stage strategy to assess impairment
Use of a 2-stage strategy, combining an assessment of severity with an assessment of depression criteria, appears to answer this dilemma. One study26 has attempted to assess whether this strategy could identify the appropriate patients for clinician attention, using an existing data set that included the PRIME-MD27 and 6 items identified from the original data via factor analyses that assess depression severity.
The results suggest that a combined assessment of depression severity and criteria could help clinicians focus on the most severely depressed patients without missing less severely impaired patients that need treatment (SOR=B).
We suggest the PHQ-9 as the instrument of choice for primary care depression screening because it measures both depression criteria and severity. The PHQ-9 provides a simple way to assess both diagnostic criteria and severity with a single, well-validated instrument. While its PPV is not appreciably greater than 50%, this reflects use in a purely “diagnostic mode,” ie, a cut-point of 10.
A well done, primary care evaluation of the PHQ-9 suggests that a score of 15 or greater reliably indicates both satisfaction of DSM-IV depression criteria and a moderate to severe level of impairment (SOR=A).28 Patients screening positive at this level should be targeted by their physician for a discussion of their symptoms and a recommendation for treatment (SOR=B). Patients with a score of 10–14 meet diagnostic criteria for depression but at a lower level of severity; these patients could be candidates for a strategy of repeat testing or watchful waiting (SOR=B).
Before leaving the topic, a comment is warranted regarding 2-stage screening using an initial 1-or 2-question screen followed by a more lengthy instrument. This type of strategy was embodied in the original PRIME-MD with its 2-question Patient Questionnaire (PQ).27 The intent is to reduce the burden of applying a full diagnostic instrument to an entire practice population. By giving the full instrument only to patients that are positive on the initial 2-question screen, the screening performance burden (as identified in Table 1) is reduced. Use of a brief instrument such as the PHQ-9, which requires only 2 to 5 minutes to fully complete, makes it possible to accurately assess both diagnostic criteria and depression severity in an entire patient population, with little administration burden.
When to screen
Once a decision is made to screen, and an instrument is selected, an interval for screening must be determined. Suggested ranges vary greatly from one-time to annual screening. The recent USPSTF recommendations provide little guidance, stating simply, “the optimal interval for screening is unknown.”11
Regular intervals. One-time screening was found to be cost-effective by Valenstein and colleagues,13 suggesting that, at a minimum, screening should occur when a new patient enters a practice (SOR=A). If a more frequent schedule of screening is desired, depression screening should be linked to other periodic preventive services provided in a practice, such as routine Pap smears or health maintenance exams, to ensure that screening occurs in a systematic fashion (SOR=C).
Risk factors. A practice may also elect to screen based on risk factors (SOR=D). Important risk factors to consider include prior history of treated depression, family history of depression, postpartum status, and any history of substance abuse.
Patients with chronic diseases known to have a high rate of comorbidity with depression—ie, diabetes, congestive heart failure, myocardial infarction—should also be considered as having risk factors for depression.
Ease of implementation
The depression screening instruments reviewed in this paper may all be completed by a patient with a sixth- to ninth-grade reading level, and can therefore be given to patients to complete in an exam room while they wait for their physician. Scoring may be then quickly completed either by the patient or by the physician.
Positive screens should prompt the physician to engage the patient in a discussion of their symptoms, the need for treatment, and a quick assessment for the presence of any suicidal ideation.
Finally, when depression is identified by screening, the potential presence of other psychiatric disorders should be noted. Anxiety disorders are frequently diagnosable in depressed patients, although it is unclear whether comorbid anxiety necessitates a change in treatment plans.29 In contrast, a comorbid substance abuse should be recognized and addressed. Similarly, coexisting dysthymia may contribute to depressed patients’ functional impairment.30
Phq-9 reasonable for monitoring treatment
It is important to note that the USPSTF recommendation specifies screening “in clinical practices that have systems in place to assure accurate diagnosis, effective treatment, and followup.” Routine, periodic monitoring is an important aspect of a systems approach to depression care. The PHQ-9, when scored as an assessment scale, and the depression assessment scales listed in Table 2 should be considered for periodic monitoring of patients being treated for depression (SOR=B). Active monitoring may alert the clinician to improvement in symptoms or to a need for treatment adjustment when symptoms do not improve.
The Hamilton Rating Scale for Depression (HAM-D) is often used as a reference standard for monitoring of outcomes in clinical trials, but it is administered by trained interviewers and is therefore impractical to administer in a routine patient care setting. The Beck Depression Inventory (BDI) and Zung Self-rating Depression Scale (SDS) have been used as outcome measures as well, but they are not as sensitive to change over time as the HAM-D.31
The sensitivity to change over time of the PHQ-9 has not yet been formally compared to the HAM-D, but it still represents a reasonable option until the results of such a comparison are available.
1. Katon W, Schulberg H. Epidemiology of depression in primary care. Gen Hosp Psychiatry 1992;14:237-47.
2. Magruder-Habib K, Zung WW, Feussner JR. Improving physicians’ recognition and treatment of depression in general medical care. Results from a randomized clinical trial. Med Care 1990;28:239-50.
3. Coyne JC, Schwenk TL, Fechner-Bates S. Nondetection of depression by primary care physicians reconsidered. Gen Hosp Psychiatry 1995;17:3-12.
4. Williams JW, Mulrow CD, Kroenke K, et al. Case-finding for depression in primary care: a randomized trial. Am J Med 1999;106:36-43.
5. Greenberg PE, Stiglin LE, Finkelstein SN, Berndt ER. The economic burden of depression in 1990. J Clin Psychiatry 1993;54:405-18.
6. Katon W, Von Korff M, Lin E, et al. Distressed high utilizers of medical care. DSM-III-R diagnoses and treatment needs. Gen Hosp Psychiatry 1990;12:355-62.
7. Von Korff M, Ormel J, Katon W, Lin EH. Disability and depression among high utilizers of health care. A longitudinal analysis. Arch Gen Psychiatry 1992;49:91-100.
8. Wells KB, Stewart A, Hays RD, et al. The functioning and well-being of depressed patients. Results from the Medical Outcomes Study. JAMA 1989;262:914-9.
9. Ford DE, Mead LA, Chang PP, Cooper-Patrick L, Wang NY, Klag MJ. Depression is a risk factor for coronary artery disease in men: the precursors study. Arch Intern Med 1998;158:1422-6.
10. Pignone MP, Gaynes BN, Rushton JL, et al. Screening for depression in adults: a summary of the evidence for the U.S. Preventive Services Task Force. Ann Intern Med 2002;136:765-76.
11. US. Preventive Services Task Force. Screening for depression: recommendations and rationale. Ann Intern Med 2002;136:760-4.
12. Spitzer RL, Kroenke K, Williams JB. Validation and utility of a self-report version of PRIME-MD: the PHQ primary care study. Primary Care Evaluation of Mental Disorders. Patient Health Questionnaire. JAMA 1999;282:1737-44.
13. Valenstein M, Vijan S, Zeber JE, Boehm K, Buttar A. The cost-utility of screening for depression in primary care. Ann Intern Med 2001;134:345-60.
14. Jaen CR, Stange KC, Nutting PA. Competing demands of primary care: a model for the delivery of clinical preventive services. J Fam Pract 1994;38:166-71.
15. Klinkman MS. Competing demands in psychosocial care. A model for the identification and treatment of depressive disorders in primary care. Gen Hosp Psychiatry 1997;19:98-111.
16. American Psychiatric Association, American Psychiatric Association, Task Force on DSM-IV. Diagnostic and statistical manual of mental disorders: DSM-IV-TR. 4th ed. Washington, DC: American Psychiatric Association; 2000.
17. Schwenk TL, Coyne JC, Fechner-Bates S. Differences between detected and undetected patients in primary care and depressed psychiatric patients. Gen Hosp Psychiatry 1996;18:407-15.
18. Williams JW, Jr, Noel PH, Cordes JA, Ramirez G, Pignone M. Is this patient clinically depressed? JAMA 2002;287:1160-70.
19. Spitzer RL, Williams JB, Gibbon M, First MB. The Structured Clinical Interview for DSM-III-R (SCID). I: History, rationale, and description. Arch Gen Psychiatry 1992;49:624-9.
20. Zigmond AS, Snaith RP. The hospital anxiety and depression scale. Acta Psychiatr Scand 1983;67:361-70.
21. Silverstone PH. Poor efficacy of the Hospital Anxiety and Depression Scale in the diagnosis of major depressive disorder in both medical and psychiatric patients. J Psychosom Res 1994;38:441-50.
22. Wells KB, Sherbourne C, Schoenbaum M, et al. Impact of disseminating quality improvement programs for depression in managed primary care: a randomized controlled trial. JAMA 2000;283:212-20.
23. Stewart AL, Hays RD, Ware JE, Jr. The MOS short-form general health survey. Reliability and validity in a patient population. Med Care 1988;26:724-35.
24. Rost K, Nutting P, Smith J, Coyne JC, Cooper-Patrick L, Rubenstein L. The role of competing demands in the treatment provided primary care patients with major depression. Arch Fam Med 2000;9:150-4.
25. Leon AC, Portera L, Olfson M, et al. False positive results: a challenge for psychiatric screening in primary care. Am J Psychiatry 1997;154:1462-4.
26. Nease DE, Jr, Klinkman MA, Volk RJ. Improved detection of depression in primary care through severity detection. J Fam Pract 2002;51:1065-70.
27. Spitzer RL, Williams J, Kroenke K, Linzer M, deGruy FV, Hann SR, et al. Utility of a new procedure for diagnosing mental disorders in primary care: the PRIME-MD 1000 study. JAMA 1994;272:1749-56.
28. Kroenke K, Spitzer RL, Williams JB. The PHQ-9: validity of a brief depression severity measure. J Gen Intern Med 2001;16:606-13.
29. Coyne JC, Fechner-Bates S, Schwenk TL. Prevalence, nature, and comorbidity of depressive disorders in primary care. Gen Hosp Psychiatry 1994;16:267-76.
30. Wells K, Burnam M, Rogers W, Hays R, Camp P. The course of depression in adult outpatients: results from the Medical Outcomes Study. Arch Gen Psychiatry 1992;49:788-94.
31. Lambert MJ, Hatch DR, Kingston MD, Edwards BC. Zung, Beck, and Hamilton Rating Scales as measures of treatment outcome: a meta-analytic comparison. J Consult Clin Psychol 1986;54:54-9.
32. Beck A, Ward C, Mendelson M, Mock J, Erbaugh J. An inventory for measuring depression. Arch Gen Psychiatry 1961;4:561-71.
33. Zung WW, Richards CB, Short MJ. Self-rating depression scale in an outpatient clinic. Further validation of the SDS. Arch Gen Psychiatry 1965;13:508-15.
34. Radloff LS. The CES-D Scale: A self-report depression scale for research in the general population. Applied Psychological Measurement 1977;1:385-401.
35. Sheikh JI, Yesavage JA. Geriatric Depression Scale (GDS): Recent evidence and development of a shorter version. In: Clinical Gerontology: A Guide to Assessment and Intervention. New York: Haworth Press; 1986;165-73.
- A 2-stage strategy, combining an assessment of severity with depression criteria, can help a physician focus on the most severe cases without missing less severe ones that still need treatment (B).
- Because of its brevity, relatively high positive predictive value, and ability to inform the clinician on both depression severity and diagnostic criteria, the PRIME-MD Patient Health Questionnaire (PHQ-9) is the best available depression screening tool for primary care (B).
- One-time screening is cost-effective; physicians may elect to screen more often based on risk factors (A).
What is the most efficient and accurate way for a busy primary care physician to screen patients for depression? Many screening tools exist, but they are not equally effective.
A careful review of the literature strongly favors a 2-stage strategy assessing both depression severity and criteria. In this article, we describe this optimal approach against the background of other available resources.
Health and economic impact of depression
In the average family practice, around 6 cases of depression go unrecognized each week. This real-world estimate derives from studies that consistently report a 10% prevalence of depression in primary care patients1 but a rate of recognition by primary care clinicians of only 29% to 35%.2-4 Depression is a common condition with a large impact on quality of life and productivity, one that indirectly affects other health states, including cardiovascular disease.5-9 It is responsible for an estimated economic cost in the US of over $40 billion annually. As a result, depression screening has been an active area of research, and a variety of organizations have issued guidelines recommending routine screening for depression in primary care.
The need for an efficient, reliable screening tool
Based on a recent review of the evidence on depression screening outcomes in primary care settings,10 the US Preventive Services Task Force (USPSTF) updated its screening recommendation in 2002 to include an endorsement of depression screening in adults “in clinical practices that have systems in place to assure accurate diagnosis, effective treatment, and follow-up” (strength of recommendation [SOR]=A).11 This endorsement leaves the primary care clinician with no guidance about how or when to screen for depression.
Despite lack of guidance in the USPTF guidelines, we believe depression screening can be done efficiently and reliably in primary care. However, one must begin by understanding that depression screening is different from screening for cancer or cardiovascular risk factors (Table 1). The burdens of interpretation of depression screening results are especially noteworthy. For example, the PRIME-MD Patient Health Questionnaire (PHQ) is reported to have a sensitivity of 61% and specificity of 94% for any mood or depressive disorder.12 This results in a positive predictive value (PPV) of 50% using a reasonable estimate of 10% prevalence for depression in primary care settings.13
Put simply, following administration and scoring of the PHQ, the clinician is left with little better odds than a coin toss of identifying a patient that has an active major depressive disorder requiring treatment. If there was no objective help, clinicians would have only their clinical judgment to resolve this, all during an office visit that contains many other competing agendas and demands.14,15
We have reviewed the evidence on depression screening instruments with the intent to highlight an instrument that clinicians can efficiently and reliably use to find depressed and impaired patients in their practice whom they might otherwise miss.
TABLE 1
Burdens of screening for cancer, hyperlipidemia, and depression
| Cancer | Hyperlipidemia | Depression | ||||
|---|---|---|---|---|---|---|
| Burden of performance | Low | Simple test or performance of billable procedure | Low | Blood test | High | Time-intensive administration & scoring |
| Burden of interpretation | Low | Confirmatory testing often referred to specialists | Low | No confirmatory reference standard testing | High | High false positive rate w/burdensome reference standard |
| Burden of treatment | Low | Treatment done by specialists | High | Requires activation of patient & frequent monitoring | High | Requires activation of patient & frequent monitoring |
Two types of screening instruments
Depression screening instruments can be grouped into 2 categories:
- depression assessment scales, which ask patients to rate the severity or frequency of various symptoms
- symptom count instruments, which are based on depression criteria.
Depression assessment scales preceded symptom count instruments, and many were developed prior to the establishment of formal diagnostic criteria within the Diagnostic and Statistical Manual ofMental Disorders (DSM) system.16 Table 2 lists available examples of depression assessment scales and symptom count instruments, along with websites where you may access further information and the instruments themselves.
TABLE 2
Accuracy and ease of administration of commonly available screening instruments
| Instrument | Time and scoring | LR+ (95% CI) | LR– (95% CI) | PPV (95% CI) | Web source |
|---|---|---|---|---|---|
| Assessment scale | |||||
| Beck Depression Inventory (BDI)32 | 2–5 min; simple | 4.2 (1.2–13.6) | 0.17 (0.1–0.3) | 29.6% (10.7–57.6) | www.psychcorpcenter.com/content/bdi-II.htm |
| Center for Epidemiologic Studies Depression Scale (CES-D)34 | 2–5 min; simple | 3.3 (2.5–4.4) | 0.24 (0.2–0.3) | 24.8% (20–30.6) | http://www.mhhe.com/hper/health/personal health/labs/Stress/activ2-2.html |
| Geriatric Depression Scale (GDS)35 | 2–5 min; simple> | 3.3 (2.4–4.7) | 0.16 (0.1–0.3) | 24.8% (19.4–32) | http://www.stanford.edu/~yesavage/GDS.html |
| Hospital Anxiety and Depression Scale* (HADS)20 | 2–5 min; simple | 7.0 (2.9–11.2) | 0.3 (0.3–0.4) | 41.3% (22.6–52.8) | www.clinical-supervision.com/hads.htm |
| Zung Self Assessment Depression Scale (Zung SDS)33 | 2–5 min; simple | 3.3 (1.3–8.1) | 0.35 (0.2–0.8) | 24.8% (11.5–44.8) | http://fpinfo.medicine.uiowa.edu/calculat.htm |
| Symptom count | |||||
| Primary Care Evaluation of Mental Disorders †(PRIME-MD)27 | 2 min; complex | 2.7 (2.0–3.7) | 0.14 (0.1–0.3) | 21.3% (16.7–27) | Available upon request to Robert Spitzer, MD: RLS8@columbia.edu |
| PRIME-MD Patient Health Questionnaire (PHQ) | 5–7 min; simple | 10.2‡ (6.5–17.5) | 0.4‡ (0.3–0.5) | 50.4% (39.4–63.6) | fpinfo.medicine.uiowa.edu/calculat.htm |
| Symptom-Driven Diagnostic System for Primary Care†(SDDS-PC) | 2 min; simple | 3.5 (2.4–5.1) | 0.2 (0.1–0.4) | 25.9% (19.4–33.8) | No website available |
| PRIME-MD Patient Health Questionnaire (PHQ-9) | 2 –5 min; simple | 12.2 (8.4–18) | 0.28 (0.2–0.5) | 55% (45.7–64.3) | www.depression-primarycare.org/ap1.html |
| * Unless noted by (*), adapted from Williams et al.18 | |||||
| † Values reflect the initial brief screening portion of these instruments. | |||||
| ‡ PHQ vaues obtained from original position and reflect diagnosis of “any mood disorders.” | |||||
| LR+, positive likelihood ratio; LR–, negative likelihood ratio; PPV, positive predictive value; CI, confidence interval | |||||
Pros and cons of assessment scales
The advantages of using a scale are due to the manner in which patients experience depressive symptoms, along a continuum of mild to severe. A scale is able to represent these gradations in severity and may be helpful in guiding the need for treatment and treatment adjustments.
Unfortunately, this ability to measure the dimensional nature of depression is also a weakness, as a threshold must be identified above which the patient is classified as warranting further investigation. Ideally, these thresholds should be established in a representative primary care sample and predict functional status as well as likelihood of meeting DSM-IV diagnostic criteria. The ability of a scale to accurately identify patients in need of attention depends directly on the threshold.
Pros and cons of symptom counts
Instruments based on depression criteria are a relatively new innovation, appearing since the establishment of DSM-IV criteria that define reference symptoms, a minimum number of which must be present to diagnose depression. Depression criteria–based instruments have the advantage of not being dependent on a threshold of symptom severity.
However, in primary care settings this can also be a weakness because the presence of depression criteria alone may not be a reliable indicator of depression-related impairment.17 Instruments that can be used in both a diagnostic criteria and scale modes have a particular advantage in that the weaknesses of each are offset.
Characteristics of selected screening instruments
We searched MEDLINE and the Cochrane databases for reviews of depression screening, with particular attention to reviews of primary care-based trials. Forty-one papers emerged, 3 of which were systematic reviews. For this paper, we focused on the review published by Williams and colleagues,18 which summarizes primary care data on the depression screening instruments most widely used. They examined 379 studies that compared the primary care performance of these instruments with a reference standard diagnostic interview, such as the Structured Clinical Interview for DSM-IV (SCID).19 Twenty-eight studies met their criteria and were included in the systematic review.
In Table 2 we have adapted the information from Williams’s review and added a calculation of PPV based on a 10% prevalence estimate for depression in primary care populations. We chose to exclude information on the Single Question (SQ) screen because of its very low PPV and the Hopkins Symptom Checklist (HSCL) because of its length (25 questions). In addition, we chose to add the Hospital Anxiety and Depression Scale (HADS), using operating characteristic information from 2 studies,20,21 because of its purported advantages in medically ill populations.
Beyond the SQ, it is useful to comment on “2-question screening” as suggested by the USPSTF. We are unable to find justification for this in the paper by Pingone and colleagues, which served as background for the recommendations.10 Although Pingone et al did cite the report of Wells and colleagues as using a 2-item screener, their study used not only 2 questions on mood and anhedonia but also other criteria in screening their population.22 Therefore, it is not appropriate as a source for 2-item screening performance characteristics.
Comparison of the operating characteristics of the selected instruments reveals that most yield PPV values in the 20% to 30% range, with the exception of the HADS, the PHQ, and the PHQ-9, which yield PPV values of 41.3%, 50%, and 55%, respectively.
The PHQ-9 (included in the (Appendix) offers a further advantage over the HADS and other instruments listed in that within a 9-item instrument both the presence of diagnostic criteria and severity may be assessed. Kroenke and colleagues have examined the use of the PHQ-9 as a severity instrument and found it to be a reliable and valid measure of depression severity when compared with the Medical Outcomes Study Short Form (SF-20).23
We purposely have not examined negative predictive values (NPV) for the listed instruments. NPV is useful when screening using biomedical markers where a negative result allows extrapolation into the future due to a known, predictable time course for development of the screened-for condition. For example, a negative screening colonoscopy has value not just because of its current predictive value, but because we know something about how long it may take to develop precancerous polyps in a negative screened patient. However, this is not the case with depression. A patient that fails to meet criteria for depression today could fully meet criteria in 2 weeks and be quite depressed. Therefore we have chosen to focus on PPV in comparing depression screening instruments.
Selection and use of a screening instrument
How should a busy clinician select a depression screening instrument? Ease of administration and interpretation are key. Ideally, a depression screen should function similarly to a vital sign, providing an easy-to-assess yet reliable marker of the need to address a patient’s depression. It is not enough to know that formal depression criteria are met; it is also important to know whether a patient’s functioning is impaired. Research indicates that it is difficult in primary care to “clinically” assess functioning in the face of numerous competing demands,15 even when clinicians know from a screening test that a patient meets criteria for depression.24 For this reason, even watchful waiting for the “positive screening/low impairment” patients25 may be difficult to put into practice.
Two-stage strategy to assess impairment
Use of a 2-stage strategy, combining an assessment of severity with an assessment of depression criteria, appears to answer this dilemma. One study26 has attempted to assess whether this strategy could identify the appropriate patients for clinician attention, using an existing data set that included the PRIME-MD27 and 6 items identified from the original data via factor analyses that assess depression severity.
The results suggest that a combined assessment of depression severity and criteria could help clinicians focus on the most severely depressed patients without missing less severely impaired patients that need treatment (SOR=B).
We suggest the PHQ-9 as the instrument of choice for primary care depression screening because it measures both depression criteria and severity. The PHQ-9 provides a simple way to assess both diagnostic criteria and severity with a single, well-validated instrument. While its PPV is not appreciably greater than 50%, this reflects use in a purely “diagnostic mode,” ie, a cut-point of 10.
A well done, primary care evaluation of the PHQ-9 suggests that a score of 15 or greater reliably indicates both satisfaction of DSM-IV depression criteria and a moderate to severe level of impairment (SOR=A).28 Patients screening positive at this level should be targeted by their physician for a discussion of their symptoms and a recommendation for treatment (SOR=B). Patients with a score of 10–14 meet diagnostic criteria for depression but at a lower level of severity; these patients could be candidates for a strategy of repeat testing or watchful waiting (SOR=B).
Before leaving the topic, a comment is warranted regarding 2-stage screening using an initial 1-or 2-question screen followed by a more lengthy instrument. This type of strategy was embodied in the original PRIME-MD with its 2-question Patient Questionnaire (PQ).27 The intent is to reduce the burden of applying a full diagnostic instrument to an entire practice population. By giving the full instrument only to patients that are positive on the initial 2-question screen, the screening performance burden (as identified in Table 1) is reduced. Use of a brief instrument such as the PHQ-9, which requires only 2 to 5 minutes to fully complete, makes it possible to accurately assess both diagnostic criteria and depression severity in an entire patient population, with little administration burden.
When to screen
Once a decision is made to screen, and an instrument is selected, an interval for screening must be determined. Suggested ranges vary greatly from one-time to annual screening. The recent USPSTF recommendations provide little guidance, stating simply, “the optimal interval for screening is unknown.”11
Regular intervals. One-time screening was found to be cost-effective by Valenstein and colleagues,13 suggesting that, at a minimum, screening should occur when a new patient enters a practice (SOR=A). If a more frequent schedule of screening is desired, depression screening should be linked to other periodic preventive services provided in a practice, such as routine Pap smears or health maintenance exams, to ensure that screening occurs in a systematic fashion (SOR=C).
Risk factors. A practice may also elect to screen based on risk factors (SOR=D). Important risk factors to consider include prior history of treated depression, family history of depression, postpartum status, and any history of substance abuse.
Patients with chronic diseases known to have a high rate of comorbidity with depression—ie, diabetes, congestive heart failure, myocardial infarction—should also be considered as having risk factors for depression.
Ease of implementation
The depression screening instruments reviewed in this paper may all be completed by a patient with a sixth- to ninth-grade reading level, and can therefore be given to patients to complete in an exam room while they wait for their physician. Scoring may be then quickly completed either by the patient or by the physician.
Positive screens should prompt the physician to engage the patient in a discussion of their symptoms, the need for treatment, and a quick assessment for the presence of any suicidal ideation.
Finally, when depression is identified by screening, the potential presence of other psychiatric disorders should be noted. Anxiety disorders are frequently diagnosable in depressed patients, although it is unclear whether comorbid anxiety necessitates a change in treatment plans.29 In contrast, a comorbid substance abuse should be recognized and addressed. Similarly, coexisting dysthymia may contribute to depressed patients’ functional impairment.30
Phq-9 reasonable for monitoring treatment
It is important to note that the USPSTF recommendation specifies screening “in clinical practices that have systems in place to assure accurate diagnosis, effective treatment, and followup.” Routine, periodic monitoring is an important aspect of a systems approach to depression care. The PHQ-9, when scored as an assessment scale, and the depression assessment scales listed in Table 2 should be considered for periodic monitoring of patients being treated for depression (SOR=B). Active monitoring may alert the clinician to improvement in symptoms or to a need for treatment adjustment when symptoms do not improve.
The Hamilton Rating Scale for Depression (HAM-D) is often used as a reference standard for monitoring of outcomes in clinical trials, but it is administered by trained interviewers and is therefore impractical to administer in a routine patient care setting. The Beck Depression Inventory (BDI) and Zung Self-rating Depression Scale (SDS) have been used as outcome measures as well, but they are not as sensitive to change over time as the HAM-D.31
The sensitivity to change over time of the PHQ-9 has not yet been formally compared to the HAM-D, but it still represents a reasonable option until the results of such a comparison are available.
1. Katon W, Schulberg H. Epidemiology of depression in primary care. Gen Hosp Psychiatry 1992;14:237-47.
2. Magruder-Habib K, Zung WW, Feussner JR. Improving physicians’ recognition and treatment of depression in general medical care. Results from a randomized clinical trial. Med Care 1990;28:239-50.
3. Coyne JC, Schwenk TL, Fechner-Bates S. Nondetection of depression by primary care physicians reconsidered. Gen Hosp Psychiatry 1995;17:3-12.
4. Williams JW, Mulrow CD, Kroenke K, et al. Case-finding for depression in primary care: a randomized trial. Am J Med 1999;106:36-43.
5. Greenberg PE, Stiglin LE, Finkelstein SN, Berndt ER. The economic burden of depression in 1990. J Clin Psychiatry 1993;54:405-18.
6. Katon W, Von Korff M, Lin E, et al. Distressed high utilizers of medical care. DSM-III-R diagnoses and treatment needs. Gen Hosp Psychiatry 1990;12:355-62.
7. Von Korff M, Ormel J, Katon W, Lin EH. Disability and depression among high utilizers of health care. A longitudinal analysis. Arch Gen Psychiatry 1992;49:91-100.
8. Wells KB, Stewart A, Hays RD, et al. The functioning and well-being of depressed patients. Results from the Medical Outcomes Study. JAMA 1989;262:914-9.
9. Ford DE, Mead LA, Chang PP, Cooper-Patrick L, Wang NY, Klag MJ. Depression is a risk factor for coronary artery disease in men: the precursors study. Arch Intern Med 1998;158:1422-6.
10. Pignone MP, Gaynes BN, Rushton JL, et al. Screening for depression in adults: a summary of the evidence for the U.S. Preventive Services Task Force. Ann Intern Med 2002;136:765-76.
11. US. Preventive Services Task Force. Screening for depression: recommendations and rationale. Ann Intern Med 2002;136:760-4.
12. Spitzer RL, Kroenke K, Williams JB. Validation and utility of a self-report version of PRIME-MD: the PHQ primary care study. Primary Care Evaluation of Mental Disorders. Patient Health Questionnaire. JAMA 1999;282:1737-44.
13. Valenstein M, Vijan S, Zeber JE, Boehm K, Buttar A. The cost-utility of screening for depression in primary care. Ann Intern Med 2001;134:345-60.
14. Jaen CR, Stange KC, Nutting PA. Competing demands of primary care: a model for the delivery of clinical preventive services. J Fam Pract 1994;38:166-71.
15. Klinkman MS. Competing demands in psychosocial care. A model for the identification and treatment of depressive disorders in primary care. Gen Hosp Psychiatry 1997;19:98-111.
16. American Psychiatric Association, American Psychiatric Association, Task Force on DSM-IV. Diagnostic and statistical manual of mental disorders: DSM-IV-TR. 4th ed. Washington, DC: American Psychiatric Association; 2000.
17. Schwenk TL, Coyne JC, Fechner-Bates S. Differences between detected and undetected patients in primary care and depressed psychiatric patients. Gen Hosp Psychiatry 1996;18:407-15.
18. Williams JW, Jr, Noel PH, Cordes JA, Ramirez G, Pignone M. Is this patient clinically depressed? JAMA 2002;287:1160-70.
19. Spitzer RL, Williams JB, Gibbon M, First MB. The Structured Clinical Interview for DSM-III-R (SCID). I: History, rationale, and description. Arch Gen Psychiatry 1992;49:624-9.
20. Zigmond AS, Snaith RP. The hospital anxiety and depression scale. Acta Psychiatr Scand 1983;67:361-70.
21. Silverstone PH. Poor efficacy of the Hospital Anxiety and Depression Scale in the diagnosis of major depressive disorder in both medical and psychiatric patients. J Psychosom Res 1994;38:441-50.
22. Wells KB, Sherbourne C, Schoenbaum M, et al. Impact of disseminating quality improvement programs for depression in managed primary care: a randomized controlled trial. JAMA 2000;283:212-20.
23. Stewart AL, Hays RD, Ware JE, Jr. The MOS short-form general health survey. Reliability and validity in a patient population. Med Care 1988;26:724-35.
24. Rost K, Nutting P, Smith J, Coyne JC, Cooper-Patrick L, Rubenstein L. The role of competing demands in the treatment provided primary care patients with major depression. Arch Fam Med 2000;9:150-4.
25. Leon AC, Portera L, Olfson M, et al. False positive results: a challenge for psychiatric screening in primary care. Am J Psychiatry 1997;154:1462-4.
26. Nease DE, Jr, Klinkman MA, Volk RJ. Improved detection of depression in primary care through severity detection. J Fam Pract 2002;51:1065-70.
27. Spitzer RL, Williams J, Kroenke K, Linzer M, deGruy FV, Hann SR, et al. Utility of a new procedure for diagnosing mental disorders in primary care: the PRIME-MD 1000 study. JAMA 1994;272:1749-56.
28. Kroenke K, Spitzer RL, Williams JB. The PHQ-9: validity of a brief depression severity measure. J Gen Intern Med 2001;16:606-13.
29. Coyne JC, Fechner-Bates S, Schwenk TL. Prevalence, nature, and comorbidity of depressive disorders in primary care. Gen Hosp Psychiatry 1994;16:267-76.
30. Wells K, Burnam M, Rogers W, Hays R, Camp P. The course of depression in adult outpatients: results from the Medical Outcomes Study. Arch Gen Psychiatry 1992;49:788-94.
31. Lambert MJ, Hatch DR, Kingston MD, Edwards BC. Zung, Beck, and Hamilton Rating Scales as measures of treatment outcome: a meta-analytic comparison. J Consult Clin Psychol 1986;54:54-9.
32. Beck A, Ward C, Mendelson M, Mock J, Erbaugh J. An inventory for measuring depression. Arch Gen Psychiatry 1961;4:561-71.
33. Zung WW, Richards CB, Short MJ. Self-rating depression scale in an outpatient clinic. Further validation of the SDS. Arch Gen Psychiatry 1965;13:508-15.
34. Radloff LS. The CES-D Scale: A self-report depression scale for research in the general population. Applied Psychological Measurement 1977;1:385-401.
35. Sheikh JI, Yesavage JA. Geriatric Depression Scale (GDS): Recent evidence and development of a shorter version. In: Clinical Gerontology: A Guide to Assessment and Intervention. New York: Haworth Press; 1986;165-73.
Improved detection of depression in primary care through severity evaluation
- Existing instruments designed to improve primary care detection of depression carry significant associated burdens that may make their use difficult to sustain in routine practice.
- A brief instrument designed to assess symptom severity can effectively target severely symptomatic patients for evaluation with Diagnostic and Statistical Manual of Mental Disorders (DSM) criteria for depression.
- A strategy of initial assessment of symptom severity, followed by assessment for DSM depression criteria in the most symptomatic patients, can decrease the burden on primary care clinicians by accurately identifying depressed patients most in need of treatment.
- OBJECTIVES: To determine whether the use of a symptom severity measure to augment an existing Diagnostic and Statistical Manual of Mental Disorders–Third Edition, Revised (DSM-III-R) criteria–based depression screener (PRIME-MD) would decrease the difficulties associated with depression screening in primary care by filtering out patients with minimal impairment.
- STUDY DESIGN: The study design was secondary data analysis.
- POPULATION: The study sample comprised 1317 patients, with intentional oversampling by ethnicity and sex, presenting for routine care at a university family practice center in Galveston, Texas.
- OUTCOMES MEASURED: The primary outcomes were cross-sectional, health-related quality-of-life outcomes of subjects who met symptom severity criteria as well as criteria for a DSM-III-R mood disorder. Health care utilization outcomes were examined as secondary outcomes.
- RESULTS: The combination of a 6-item depression severity instrument and the PRIME-MD resulted in 71% of depressed subjects being categorized as severely symptomatic and 29% as minimally symptomatic. Severely symptomatic subjects had significantly worse SF-36 Mental Health Component Summary scale (MCS) scores than did minimally symptomatic subjects (32.8 vs 43.5, P < .05). Minimally symptomatic subjects had MCS scores similar to those of a third group of subjects who did not meet DSM-III-R “threshold” criteria for mood disorder but who were severely symptomatic. Adjusted health care utilization was higher for the initial 3-month charge period in the severely symptomatic depressed subjects compared with minimally symptomatic depressed subjects ($679.20 vs $462.38, P < .05).
- CONCLUSIONS: The 6-item depression severity measure effectively separated patients meeting DSM-III-R “threshold” depression criteria into 2 groups: one presenting with severe symptoms and impairment and the other presenting with mild symptoms and significantly less impairment. A strategy of initial screening using a brief depression severity instrument, followed with a DSM criteria–based instrument, could decrease the immediate clinician workload by one third and focus treatment on those most likely to benefit.
Numerous efforts have been directed toward improving primary care clinicians’ detection of depression since the report of early findings that depressive disorders are common yet often unrecognized in primary care.1,2 Despite the recent release of a new United States Preventive Task Force recommendation,3 controversy exists about the benefits and cost-effectiveness of routine screening.4–7
Despite the controversies around depression screening, it is clear that there is significant room for improvement in detection of and treatment outcomes for depression in primary care. Additionally, there is ample evidence from clinical trials that depressed patients with higher severity of illness receive the highest benefit from pharmacological treatment. Therefore, it makes sense to target these highly impaired, depressed patients for detection and treatment.
In previous studies exploring the relationships between symptom severity and diagnostic criteria in a large sample of primary care patients, we found that (1) the Diagnostic and Statistical Manual of Mental Disorders (DSM) criteria for major depression were nonspecific at low levels of impairment but more accurate at high levels, and (2) mood symptom severity assessment performed better than DSM criteria as an independent predictor of impairment and utilization.8,9 These findings lend support to the notion that case-finding methods incorporating severity in addition to criteria can improve the efficiency of screening in primary care. This study represents our initial exploration of the potential impact of severity-enhanced screening for depression.
We used a retrospective cohort design to answer the following study questions: (1) Can the administration of a symptom severity scale effectively “filter out” a group of patients who meet diagnostic criteria for “threshold” depression but who have less impairment (and may therefore not need treatment)? (2) Does this filtering strategy inappropriately “filter out” patients who are in need of treatment?
Methods
Population and setting
Our sample consisted of 1317 patients presenting for routine care in a university-based family medicine center at the University of Texas Medical Branch (UTMB) in Galveston. The sample, originally recruited for a National Institute for Alcohol Abuse and Alcoholism–funded study of primary care alcohol screening, has been previously described.10 The study methods and additional data collection methods were reviewed and approved by the UTMB Institutional Review Board.
Evaluation measures
We used the Medical Outcomes Study SF-36 subscales and component summary scale11,12 to assess health-related quality of life (HRQOL) in all subjects. Medical comorbidity was assessed using electronic medical record review as described previously.8 We also examined health care utilization using charge data from the billing system of UTMB. As previously described,8 we obtained all inpatient and outpatient charge data for a 15-month period beginning 3 months before the visit at which each subject was surveyed. Outpatient pharmacy data were not included. The results of the charge data subanalysis are presented online in Figure W1, at www.jfponline.com.
Analytic strategy
All subjects were screened with the Clinician Evaluation Guide mood module from the Primary Care Evaluation of Mental Disorders (PRIME-MD).13 A “DSM criteria positive” screen included major depressive disorder (MDD), dysthymia, and partial remission of MDD. Symptom severity was assessed using a 6-item Brief Depression Rating (BDR) scale (Table 1) derived from a principal components analysis of 15 mood and anxiety symptom severity questions used in the original study and our subsequent investigations.8 Factor analysis of the 6 BDR items confirmed that they occupy a domain distinct from the somatic symptoms included as PRIME-MD depression criteria.
Cronbach’s alpha for the BDR in our sample was 0.8911. Because the distribution of subjects was skewed toward lower severity (median = 9, mean = 10.47, skewness = 1.415), we chose the 75th percentile score13 as our cut point for a “positive” BDR. This choice reflected a more conservative definition of severity than the use of a standard cut point of 1 standard deviation above the mean (in this case, a score of 15).
We “filtered out” low-severity patients by matching BDR scores and DSM criteria to create 4 groups for comparison: “low severity and DSM negative,” “high severity only,” “DSM positive only,” and “high severity and DSM positive.”
TABLE 1
Brief Depression Rating*
| Over the LAST 2 WEEKS, how often have you experienced any of the following?* |
|---|
|
| *Responses to questions are on a 5-point Likert scale ranging from “none of the time” to “all of the time.” |
Data analysis
We used analysis of variance to compare the 4 groups on demographic and outcome measures of interest. We made adjustments where demographic variables or medical comorbidity contributed significantly to the differences between groups by using analysis of covariance (ANCOVA). We examined interaction effects between the covariates and the severity/DSM groups. Where possible and appropriate, we used Bonferroni or Games-Howell adjustments for multiple comparisons between groups.
Results
Size and demographic comparisons
The distribution of the 1317 subjects available for analysis is depicted in Table 2. Fully 75% of the total sample fell below the BDR severity threshold. The BDR filtered out 29% of those subjects meeting DSM criteria because of low symptom severity. Conversely, 17% of subjects who did not meet DSM criteria had high symptom severity based on the BDR. Although the groups had similar demographic characteristics, subjects in the “high severity and DSM positive” group were significantly younger than subjects in the “low severity and DSM negative” group. The distribution of women in all groups was significantly higher than expected except for the “low severity and DSM negative” group. We found even distributions of subjects by ethnicity.
TABLE 2
Group demographics
| Characteristic | PRIME-MD criteria (–) | PRIME-MD criteria (+) | ||
|---|---|---|---|---|
| BDR severity (–) | BDR severity (+) | BDR severity (–) | BDR severity (+) | |
| Subjects, n | 893 | 119 | 91 | 214 |
| Female subjects, % | 66.2 | 72.3 | 74.4 | 84.1 |
| Race, % | ||||
| White | 38.3 | 35.3 | 41.7 | 40.2 |
| African American | 34.5 | 41.2 | 28.6 | 36.9 |
| Hispanic | 27.2 | 23.5 | 29.7 | 22.9 |
| Mean age, y | 43.9* | 43 | 42.5 | 40.0* |
| Chi-square is significant for sex (P < .001) but not for racial distributions (P = .500). | ||||
| *Significant differences exist for mean age by analysis of variance using Bonferroni adjustment (P = .012). | ||||
| BDR, Brief Depression Rating; Prime-MD, Primary Care Evaluation of Mental Diseases. | ||||
Mean HRQOL score comparisons
Figure 1 shows mean Mental Health Component Summary (MCS) scores for subjects in the 4 groups, after ANCOVA adjustments for significant covariates (age and African-American ethnicity, P = .003 for both). The groups of subjects that scored either positively or negatively on both the BDR and PRIME-MD occupy opposite poles of very low and very high functional status, respectively. The groups of subjects that scored positively on only the BDR or only the PRIME-MD share the middle ground with no significant difference in MCS-related functional status.
A similar pattern was seen for the Physical Component Summary (PCS) scores from the SF-36. PCS score means ranged from 41.60 to 44.17 among the 4 groups after ANCOVA adjustment for significant covariates (income, medical comorbidity, and Hispanic ethnicity, P < .001 for each). Only the “low severity and DSM negative” and “high severity and DSM positive” groups differed significantly at either end of this range; however, the absolute difference of 2.57 points carries minimal, if any, clinical significance.
Unadjusted mean values from SF-36 subscale scores across the 4 study groups are shown in Figure 2. Although we saw no differences in the “physical functioning” and “role-physical” subscale scores among the groups, a consistent pattern emerged for the remaining 6 subscales. The “high severity and DSM positive” group had significantly lower mean scores (indicating more impairment) than each of the other 3 groups, whereas the “low severity and DSM negative” group had significantly higher scores than each of the other 3 groups. The other 2 groups’ means were in the middle and almost identical across all 8 subscales, indicating that these 2 groups were similar on each SF-36 measure of physical and mental health functioning.
FIGURE 1
Mean deviations from standardized SF-36 subscale norms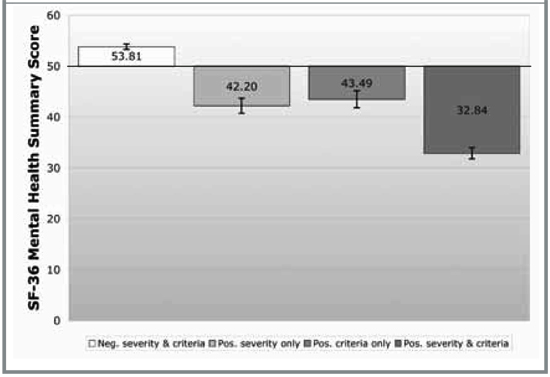
FIGURE 2
Mean deviations from standardized SF-36 subscale norms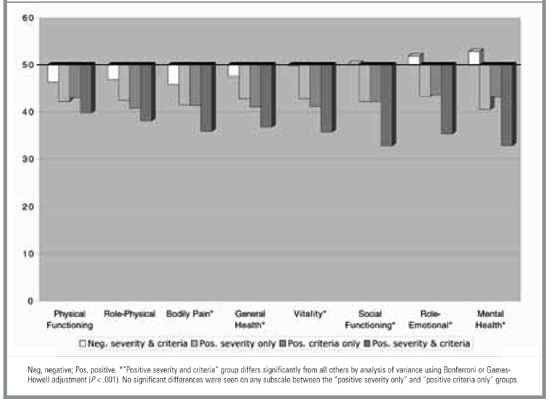
Mean health care charge comparisons
Briefly, adjusted mean health care charges for each group of subjects showed significant charge differences between groups for the period 3 months before the index visit. The adjusted mean health care charges for this period are shown in Figure W1.
Discussion
We believe that the central findings of this study support a severity-targeted screening strategy. The answer to our first study question—Can the addition of a symptom severity scale effectively “filter out” a group of patients who meet diagnostic criteria for “threshold” depression but have less impairment?—is “yes.” We were able to separate patients meeting criteria for depression into 2 groups, roughly one third with mild symptom severity and roughly two thirds with moderate to severe symptom severity.
The answer to our second question—Does this filtering strategy filter out patients who are in need of treatment?—appears to be “no.” The patterns of HRQOL scores and health care utilization seen for the “filtered-out” patients were indistinguishable from those of a third group of more severely symptomatic patients who did not meet depression criteria at the time of screening and who would not routinely be considered candidates for antidepressant treatment. The presence of a cohort of “middle-ground” patients has been noted in other cross-sectional primary care samples.14 Whether these patients represent persons with “major depression-in-waiting” or simply distressed and sad individuals is debatable, but there is no evidence to suggest that immediate detection and treatment lead to improved outcomes for these patients. Therefore, in routine clinical practice there would appear to be little risk in failing to identify and treat these patients unless or until their symptom severity increases.
This study does contain some important limitations. First, its cross-sectional nature does not allow us to address important questions about the middle-ground (“high severity only” and “DSM positive only”) patients, such as when they might warrant treatment, whether or when rescreening is useful, or whether “watchful waiting” is the appropriate clinical strategy for these 2 groups. Also, our decision to include as “DSM positive” those patients meeting criteria for dysthymia and MDD in remission deserves a brief explanation. Our previous work with this sample suggested that many patients meeting criteria for these 2 syndromes had high levels of distress and might be thought of as “depressed” by clinicians in routine practice. We included them to make our stratification strategy more closely representative of usual primary care practice. Repeat analyses including only MDD patients as “DSM positive” did not change our primary findings and conclusions, but they did—as expected—decrease the number of subjects in the “positive severity and criteria” group as well as increase the number of subjects in the “high severity only” group.
Despite these limitations, we believe that the results of this study offer hope to practicing physicians trying to cope with the growing depression screening mandate. Primary care physicians seeking to implement depression screening must deal with the fact that depression-screening protocols impose significant burdens on busy clinicians. In the setting of high competing demand15,16 in primary care, this additional effort—or “cognitive burden”— may render such screening impossible to accomplish in a routine clinical encounter. Several studies support this notion. Rost et al17,18 found that a screening protocol was not sustainable in primary care, in large part because primary care clinicians were unable to determine which screened patients were most in need of treatment. Dobscha et al19 found that clinicians failed to adhere to even a limited practice-based screening protocol. Williams et al20 found no difference in treatment rates or short-term outcomes when comparing brief (1-question) and comprehensive (20-question) case-finding protocols with customary clinical care.
Our results suggest that a simple refinement to a screening protocol—ie, using a brief severity measure to target the patients most appropriate for further DSM diagnostic evaluation—could help clinicians in 2 ways. First, it could decrease the burden of positive screening results by one third according to this study. Second, it could provide a more specific “prompt to act” rather than the “prompt to consider” provided by the use of current DSM criteria–based instruments. The importance of this last point should not be underestimated. Valenstein et al21 demonstrated that clinicians’ perceptions of the value of positive screen results are closely linked to their likelihood to initiate treatment. If we can enhance the value of the positive prompt, we can improve the rate of response to prompting.
Although we believe that the principle of severity targeting, rather than the specific instrument chosen, will improve screening performance, the instrument must nonetheless be chosen carefully. Kroenke et al22 examined the utility of using the quantitative score from the Patient Health Questionnaire, 9-item version, (PHQ-9) as a severity measure and found that higher scores correlated with lower functional status scores, greater numbers of sick days, and greater health care utilization. However, their methodology included as “positive” only those patients who met diagnostic criteria for MDD. Our use of an independent severity instrument identified an additional 17% of middle-ground patients who might benefit from close observation (“watchful waiting”) without the need for active management.
In summary, we believe that severity-targeted screening represents a promising “next step” in the evolution of office-based screening for depression in primary care. Much more work is needed to determine whether this “prompt to act” will be followed by improved treatment adherence and better treatment outcomes.
Acknowledgments
This project was supported in part by grants from the National Institute on Alcohol Abuse and Alcoholism (No. AA09496) and the Bureau of Health Professions, Health Resources and Services Administration (Nos. D32-PE16033 and D32-PE10158). The authors gratefully acknowledge the valuable feedback of James E. Aikens, PhD, during the preparation of this manuscript.
1. Regier DA, Goldberg ID, Taube CA. The de facto US Mental Health Services system: a public health perspective. Arch Gen Psychiatry 1978;35:685-93.
2. Katon W, Schulberg H. Epidemiology of depression in primary care. Gen Hosp Psychiatry 1992;14:237-47.
3. Pignone MP, Gaynes BN, Rushton JL, Burchell CM, Orleans CT, Mulrow CD, et al. Screening for depression in adults: a summary of the evidence for the U.S. Preventive Services Task Force. Ann Intern Med 2002;136:765-76.
4. Gilbody SM, House AO, Sheldon TA. Routinely administered questionnaires for depression and anxiety: systematic review. Br Med J 2001;322:406-9.
5. Valenstein M, Vijan S, Zeber JE, Boehm K, Buttar A. The cost-utility of screening for depression in primary care. Ann Intern Med 2001;134:345-60.
6. Schoenbaum M, Unutzer J, Sherbourne C, Duan N, Rubenstein LV, Miranda J, et al. Cost-effectiveness of practice-initiated quality improvement for depression: results of a randomized controlled trial. JAMA 2001;286:1325-30.
7. Simon GE, Manning WG, Katzelnick DJ, Pearson SD, Henk HJ, Helstad CS. Cost-effectiveness of systematic depression treatment for high utilizers of general medical care. Arch Gen Psychiatry 2001;58:181-7.
8. Nease DE, Jr, Volk RJ, Cass AR. Investigation of a severity-based classification of mood and anxiety symptoms in primary care patients. J Am Board Fam Pract 1999;12:21-31.
9. Nease DE, Jr, Volk RJ, Cass AR. Does the severity of mood and anxiety symptoms predict high health care utilization? J Fam Pract 1999;48:769-77.
10. Volk RJ, Cantor SB, Steinbauer JR, Cass AR. Alcohol use disorders, consumption patterns, and health-related quality of life of primary care patients. Alcohol Clin Exp Res 1997;21:899-905.
11. Ware JE, Jr, Kosinski M, Bayliss MS, McHorney CA, Rogers WH, Raczek A. Comparison of methods for the scoring and statistical analysis of SF-36 health profile and summary measures: summary of results from the Medical Outcomes Study. Med Care 1995;33(suppl 4):AS264-79.
12. Ware JE Jr, Sherbourne CD. The MOS 36-item short-form health survey (SF-36). I. Conceptual framework and item selection. Med Care 1992;30:473-83.
13. Spitzer RL, Williams J, Kroenke K, Linzer M, deGruy FV, Hann SR, et al. Utility of a new procedure for diagnosing mental disorders in primary care: the PRIME-MD 1000 study. JAMA 1994;272:1749-56.
14. Klinkman MS, Coyne JC, Gallo S, Schwenk TL. False positives, false negatives, and the validity of the diagnosis of major depression in primary care. Arch Fam Med 1998;7:451-61.
15. Jaen CR, Stange KC, Nutting PA. Competing demands of primary care: a model for the delivery of clinical preventive services. J Fam Pract 1994;38:166-71.
16. Klinkman MS. Competing demands in psychosocial care.A model for the identification and treatment of depressive disorders in primary care. Gen Hosp Psychiatry 1997;19:98-111.
17. Rost K, Nutting P, Smith J, Coyne JC, Cooper-Patrick L, Rubenstein L. The role of competing demands in the treatment provided primary care patients with major depression. Arch Fam Med 2000;9:150-4.
18. Rost K, Nutting P, Smith J, Werner J, Duan N. Improving depression outcomes in community primary care practice: a randomized trial of the QuEST intervention. J Gen Intern Med 2001;16:143-9.
19. Dobscha SK, Gerrity MS, Ward MF. Effectiveness of an intervention to improve primary care provider recognition of depression. Eff Clin Pract 2001;4:163-71.
20. Williams JW, Mulrow CD, Kroenke K, Dhanda R, Badgett RG, Omori D, et al. Case-finding for depression in primary care: a randomized trial. Am J Med 1999;106:36-43.
21. Valenstein M, Dalack G, Blow F, Figueroa S, Standiford C, Douglass A. Screening for psychiatric illness with a combined screening and diagnostic instrument. J Gen Intern Med 1997;12:679-85.
22. Kroenke K, Spitzer RL, Williams JB. The PHQ-9: validity of a brief depression severity measure. J Gen Intern Med 2001;16:606-13.
- Existing instruments designed to improve primary care detection of depression carry significant associated burdens that may make their use difficult to sustain in routine practice.
- A brief instrument designed to assess symptom severity can effectively target severely symptomatic patients for evaluation with Diagnostic and Statistical Manual of Mental Disorders (DSM) criteria for depression.
- A strategy of initial assessment of symptom severity, followed by assessment for DSM depression criteria in the most symptomatic patients, can decrease the burden on primary care clinicians by accurately identifying depressed patients most in need of treatment.
- OBJECTIVES: To determine whether the use of a symptom severity measure to augment an existing Diagnostic and Statistical Manual of Mental Disorders–Third Edition, Revised (DSM-III-R) criteria–based depression screener (PRIME-MD) would decrease the difficulties associated with depression screening in primary care by filtering out patients with minimal impairment.
- STUDY DESIGN: The study design was secondary data analysis.
- POPULATION: The study sample comprised 1317 patients, with intentional oversampling by ethnicity and sex, presenting for routine care at a university family practice center in Galveston, Texas.
- OUTCOMES MEASURED: The primary outcomes were cross-sectional, health-related quality-of-life outcomes of subjects who met symptom severity criteria as well as criteria for a DSM-III-R mood disorder. Health care utilization outcomes were examined as secondary outcomes.
- RESULTS: The combination of a 6-item depression severity instrument and the PRIME-MD resulted in 71% of depressed subjects being categorized as severely symptomatic and 29% as minimally symptomatic. Severely symptomatic subjects had significantly worse SF-36 Mental Health Component Summary scale (MCS) scores than did minimally symptomatic subjects (32.8 vs 43.5, P < .05). Minimally symptomatic subjects had MCS scores similar to those of a third group of subjects who did not meet DSM-III-R “threshold” criteria for mood disorder but who were severely symptomatic. Adjusted health care utilization was higher for the initial 3-month charge period in the severely symptomatic depressed subjects compared with minimally symptomatic depressed subjects ($679.20 vs $462.38, P < .05).
- CONCLUSIONS: The 6-item depression severity measure effectively separated patients meeting DSM-III-R “threshold” depression criteria into 2 groups: one presenting with severe symptoms and impairment and the other presenting with mild symptoms and significantly less impairment. A strategy of initial screening using a brief depression severity instrument, followed with a DSM criteria–based instrument, could decrease the immediate clinician workload by one third and focus treatment on those most likely to benefit.
Numerous efforts have been directed toward improving primary care clinicians’ detection of depression since the report of early findings that depressive disorders are common yet often unrecognized in primary care.1,2 Despite the recent release of a new United States Preventive Task Force recommendation,3 controversy exists about the benefits and cost-effectiveness of routine screening.4–7
Despite the controversies around depression screening, it is clear that there is significant room for improvement in detection of and treatment outcomes for depression in primary care. Additionally, there is ample evidence from clinical trials that depressed patients with higher severity of illness receive the highest benefit from pharmacological treatment. Therefore, it makes sense to target these highly impaired, depressed patients for detection and treatment.
In previous studies exploring the relationships between symptom severity and diagnostic criteria in a large sample of primary care patients, we found that (1) the Diagnostic and Statistical Manual of Mental Disorders (DSM) criteria for major depression were nonspecific at low levels of impairment but more accurate at high levels, and (2) mood symptom severity assessment performed better than DSM criteria as an independent predictor of impairment and utilization.8,9 These findings lend support to the notion that case-finding methods incorporating severity in addition to criteria can improve the efficiency of screening in primary care. This study represents our initial exploration of the potential impact of severity-enhanced screening for depression.
We used a retrospective cohort design to answer the following study questions: (1) Can the administration of a symptom severity scale effectively “filter out” a group of patients who meet diagnostic criteria for “threshold” depression but who have less impairment (and may therefore not need treatment)? (2) Does this filtering strategy inappropriately “filter out” patients who are in need of treatment?
Methods
Population and setting
Our sample consisted of 1317 patients presenting for routine care in a university-based family medicine center at the University of Texas Medical Branch (UTMB) in Galveston. The sample, originally recruited for a National Institute for Alcohol Abuse and Alcoholism–funded study of primary care alcohol screening, has been previously described.10 The study methods and additional data collection methods were reviewed and approved by the UTMB Institutional Review Board.
Evaluation measures
We used the Medical Outcomes Study SF-36 subscales and component summary scale11,12 to assess health-related quality of life (HRQOL) in all subjects. Medical comorbidity was assessed using electronic medical record review as described previously.8 We also examined health care utilization using charge data from the billing system of UTMB. As previously described,8 we obtained all inpatient and outpatient charge data for a 15-month period beginning 3 months before the visit at which each subject was surveyed. Outpatient pharmacy data were not included. The results of the charge data subanalysis are presented online in Figure W1, at www.jfponline.com.
Analytic strategy
All subjects were screened with the Clinician Evaluation Guide mood module from the Primary Care Evaluation of Mental Disorders (PRIME-MD).13 A “DSM criteria positive” screen included major depressive disorder (MDD), dysthymia, and partial remission of MDD. Symptom severity was assessed using a 6-item Brief Depression Rating (BDR) scale (Table 1) derived from a principal components analysis of 15 mood and anxiety symptom severity questions used in the original study and our subsequent investigations.8 Factor analysis of the 6 BDR items confirmed that they occupy a domain distinct from the somatic symptoms included as PRIME-MD depression criteria.
Cronbach’s alpha for the BDR in our sample was 0.8911. Because the distribution of subjects was skewed toward lower severity (median = 9, mean = 10.47, skewness = 1.415), we chose the 75th percentile score13 as our cut point for a “positive” BDR. This choice reflected a more conservative definition of severity than the use of a standard cut point of 1 standard deviation above the mean (in this case, a score of 15).
We “filtered out” low-severity patients by matching BDR scores and DSM criteria to create 4 groups for comparison: “low severity and DSM negative,” “high severity only,” “DSM positive only,” and “high severity and DSM positive.”
TABLE 1
Brief Depression Rating*
| Over the LAST 2 WEEKS, how often have you experienced any of the following?* |
|---|
|
| *Responses to questions are on a 5-point Likert scale ranging from “none of the time” to “all of the time.” |
Data analysis
We used analysis of variance to compare the 4 groups on demographic and outcome measures of interest. We made adjustments where demographic variables or medical comorbidity contributed significantly to the differences between groups by using analysis of covariance (ANCOVA). We examined interaction effects between the covariates and the severity/DSM groups. Where possible and appropriate, we used Bonferroni or Games-Howell adjustments for multiple comparisons between groups.
Results
Size and demographic comparisons
The distribution of the 1317 subjects available for analysis is depicted in Table 2. Fully 75% of the total sample fell below the BDR severity threshold. The BDR filtered out 29% of those subjects meeting DSM criteria because of low symptom severity. Conversely, 17% of subjects who did not meet DSM criteria had high symptom severity based on the BDR. Although the groups had similar demographic characteristics, subjects in the “high severity and DSM positive” group were significantly younger than subjects in the “low severity and DSM negative” group. The distribution of women in all groups was significantly higher than expected except for the “low severity and DSM negative” group. We found even distributions of subjects by ethnicity.
TABLE 2
Group demographics
| Characteristic | PRIME-MD criteria (–) | PRIME-MD criteria (+) | ||
|---|---|---|---|---|
| BDR severity (–) | BDR severity (+) | BDR severity (–) | BDR severity (+) | |
| Subjects, n | 893 | 119 | 91 | 214 |
| Female subjects, % | 66.2 | 72.3 | 74.4 | 84.1 |
| Race, % | ||||
| White | 38.3 | 35.3 | 41.7 | 40.2 |
| African American | 34.5 | 41.2 | 28.6 | 36.9 |
| Hispanic | 27.2 | 23.5 | 29.7 | 22.9 |
| Mean age, y | 43.9* | 43 | 42.5 | 40.0* |
| Chi-square is significant for sex (P < .001) but not for racial distributions (P = .500). | ||||
| *Significant differences exist for mean age by analysis of variance using Bonferroni adjustment (P = .012). | ||||
| BDR, Brief Depression Rating; Prime-MD, Primary Care Evaluation of Mental Diseases. | ||||
Mean HRQOL score comparisons
Figure 1 shows mean Mental Health Component Summary (MCS) scores for subjects in the 4 groups, after ANCOVA adjustments for significant covariates (age and African-American ethnicity, P = .003 for both). The groups of subjects that scored either positively or negatively on both the BDR and PRIME-MD occupy opposite poles of very low and very high functional status, respectively. The groups of subjects that scored positively on only the BDR or only the PRIME-MD share the middle ground with no significant difference in MCS-related functional status.
A similar pattern was seen for the Physical Component Summary (PCS) scores from the SF-36. PCS score means ranged from 41.60 to 44.17 among the 4 groups after ANCOVA adjustment for significant covariates (income, medical comorbidity, and Hispanic ethnicity, P < .001 for each). Only the “low severity and DSM negative” and “high severity and DSM positive” groups differed significantly at either end of this range; however, the absolute difference of 2.57 points carries minimal, if any, clinical significance.
Unadjusted mean values from SF-36 subscale scores across the 4 study groups are shown in Figure 2. Although we saw no differences in the “physical functioning” and “role-physical” subscale scores among the groups, a consistent pattern emerged for the remaining 6 subscales. The “high severity and DSM positive” group had significantly lower mean scores (indicating more impairment) than each of the other 3 groups, whereas the “low severity and DSM negative” group had significantly higher scores than each of the other 3 groups. The other 2 groups’ means were in the middle and almost identical across all 8 subscales, indicating that these 2 groups were similar on each SF-36 measure of physical and mental health functioning.
FIGURE 1
Mean deviations from standardized SF-36 subscale norms
FIGURE 2
Mean deviations from standardized SF-36 subscale norms
Mean health care charge comparisons
Briefly, adjusted mean health care charges for each group of subjects showed significant charge differences between groups for the period 3 months before the index visit. The adjusted mean health care charges for this period are shown in Figure W1.
Discussion
We believe that the central findings of this study support a severity-targeted screening strategy. The answer to our first study question—Can the addition of a symptom severity scale effectively “filter out” a group of patients who meet diagnostic criteria for “threshold” depression but have less impairment?—is “yes.” We were able to separate patients meeting criteria for depression into 2 groups, roughly one third with mild symptom severity and roughly two thirds with moderate to severe symptom severity.
The answer to our second question—Does this filtering strategy filter out patients who are in need of treatment?—appears to be “no.” The patterns of HRQOL scores and health care utilization seen for the “filtered-out” patients were indistinguishable from those of a third group of more severely symptomatic patients who did not meet depression criteria at the time of screening and who would not routinely be considered candidates for antidepressant treatment. The presence of a cohort of “middle-ground” patients has been noted in other cross-sectional primary care samples.14 Whether these patients represent persons with “major depression-in-waiting” or simply distressed and sad individuals is debatable, but there is no evidence to suggest that immediate detection and treatment lead to improved outcomes for these patients. Therefore, in routine clinical practice there would appear to be little risk in failing to identify and treat these patients unless or until their symptom severity increases.
This study does contain some important limitations. First, its cross-sectional nature does not allow us to address important questions about the middle-ground (“high severity only” and “DSM positive only”) patients, such as when they might warrant treatment, whether or when rescreening is useful, or whether “watchful waiting” is the appropriate clinical strategy for these 2 groups. Also, our decision to include as “DSM positive” those patients meeting criteria for dysthymia and MDD in remission deserves a brief explanation. Our previous work with this sample suggested that many patients meeting criteria for these 2 syndromes had high levels of distress and might be thought of as “depressed” by clinicians in routine practice. We included them to make our stratification strategy more closely representative of usual primary care practice. Repeat analyses including only MDD patients as “DSM positive” did not change our primary findings and conclusions, but they did—as expected—decrease the number of subjects in the “positive severity and criteria” group as well as increase the number of subjects in the “high severity only” group.
Despite these limitations, we believe that the results of this study offer hope to practicing physicians trying to cope with the growing depression screening mandate. Primary care physicians seeking to implement depression screening must deal with the fact that depression-screening protocols impose significant burdens on busy clinicians. In the setting of high competing demand15,16 in primary care, this additional effort—or “cognitive burden”— may render such screening impossible to accomplish in a routine clinical encounter. Several studies support this notion. Rost et al17,18 found that a screening protocol was not sustainable in primary care, in large part because primary care clinicians were unable to determine which screened patients were most in need of treatment. Dobscha et al19 found that clinicians failed to adhere to even a limited practice-based screening protocol. Williams et al20 found no difference in treatment rates or short-term outcomes when comparing brief (1-question) and comprehensive (20-question) case-finding protocols with customary clinical care.
Our results suggest that a simple refinement to a screening protocol—ie, using a brief severity measure to target the patients most appropriate for further DSM diagnostic evaluation—could help clinicians in 2 ways. First, it could decrease the burden of positive screening results by one third according to this study. Second, it could provide a more specific “prompt to act” rather than the “prompt to consider” provided by the use of current DSM criteria–based instruments. The importance of this last point should not be underestimated. Valenstein et al21 demonstrated that clinicians’ perceptions of the value of positive screen results are closely linked to their likelihood to initiate treatment. If we can enhance the value of the positive prompt, we can improve the rate of response to prompting.
Although we believe that the principle of severity targeting, rather than the specific instrument chosen, will improve screening performance, the instrument must nonetheless be chosen carefully. Kroenke et al22 examined the utility of using the quantitative score from the Patient Health Questionnaire, 9-item version, (PHQ-9) as a severity measure and found that higher scores correlated with lower functional status scores, greater numbers of sick days, and greater health care utilization. However, their methodology included as “positive” only those patients who met diagnostic criteria for MDD. Our use of an independent severity instrument identified an additional 17% of middle-ground patients who might benefit from close observation (“watchful waiting”) without the need for active management.
In summary, we believe that severity-targeted screening represents a promising “next step” in the evolution of office-based screening for depression in primary care. Much more work is needed to determine whether this “prompt to act” will be followed by improved treatment adherence and better treatment outcomes.
Acknowledgments
This project was supported in part by grants from the National Institute on Alcohol Abuse and Alcoholism (No. AA09496) and the Bureau of Health Professions, Health Resources and Services Administration (Nos. D32-PE16033 and D32-PE10158). The authors gratefully acknowledge the valuable feedback of James E. Aikens, PhD, during the preparation of this manuscript.
1. Regier DA, Goldberg ID, Taube CA. The de facto US Mental Health Services system: a public health perspective. Arch Gen Psychiatry 1978;35:685-93.
2. Katon W, Schulberg H. Epidemiology of depression in primary care. Gen Hosp Psychiatry 1992;14:237-47.
3. Pignone MP, Gaynes BN, Rushton JL, Burchell CM, Orleans CT, Mulrow CD, et al. Screening for depression in adults: a summary of the evidence for the U.S. Preventive Services Task Force. Ann Intern Med 2002;136:765-76.
4. Gilbody SM, House AO, Sheldon TA. Routinely administered questionnaires for depression and anxiety: systematic review. Br Med J 2001;322:406-9.
5. Valenstein M, Vijan S, Zeber JE, Boehm K, Buttar A. The cost-utility of screening for depression in primary care. Ann Intern Med 2001;134:345-60.
6. Schoenbaum M, Unutzer J, Sherbourne C, Duan N, Rubenstein LV, Miranda J, et al. Cost-effectiveness of practice-initiated quality improvement for depression: results of a randomized controlled trial. JAMA 2001;286:1325-30.
7. Simon GE, Manning WG, Katzelnick DJ, Pearson SD, Henk HJ, Helstad CS. Cost-effectiveness of systematic depression treatment for high utilizers of general medical care. Arch Gen Psychiatry 2001;58:181-7.
8. Nease DE, Jr, Volk RJ, Cass AR. Investigation of a severity-based classification of mood and anxiety symptoms in primary care patients. J Am Board Fam Pract 1999;12:21-31.
9. Nease DE, Jr, Volk RJ, Cass AR. Does the severity of mood and anxiety symptoms predict high health care utilization? J Fam Pract 1999;48:769-77.
10. Volk RJ, Cantor SB, Steinbauer JR, Cass AR. Alcohol use disorders, consumption patterns, and health-related quality of life of primary care patients. Alcohol Clin Exp Res 1997;21:899-905.
11. Ware JE, Jr, Kosinski M, Bayliss MS, McHorney CA, Rogers WH, Raczek A. Comparison of methods for the scoring and statistical analysis of SF-36 health profile and summary measures: summary of results from the Medical Outcomes Study. Med Care 1995;33(suppl 4):AS264-79.
12. Ware JE Jr, Sherbourne CD. The MOS 36-item short-form health survey (SF-36). I. Conceptual framework and item selection. Med Care 1992;30:473-83.
13. Spitzer RL, Williams J, Kroenke K, Linzer M, deGruy FV, Hann SR, et al. Utility of a new procedure for diagnosing mental disorders in primary care: the PRIME-MD 1000 study. JAMA 1994;272:1749-56.
14. Klinkman MS, Coyne JC, Gallo S, Schwenk TL. False positives, false negatives, and the validity of the diagnosis of major depression in primary care. Arch Fam Med 1998;7:451-61.
15. Jaen CR, Stange KC, Nutting PA. Competing demands of primary care: a model for the delivery of clinical preventive services. J Fam Pract 1994;38:166-71.
16. Klinkman MS. Competing demands in psychosocial care.A model for the identification and treatment of depressive disorders in primary care. Gen Hosp Psychiatry 1997;19:98-111.
17. Rost K, Nutting P, Smith J, Coyne JC, Cooper-Patrick L, Rubenstein L. The role of competing demands in the treatment provided primary care patients with major depression. Arch Fam Med 2000;9:150-4.
18. Rost K, Nutting P, Smith J, Werner J, Duan N. Improving depression outcomes in community primary care practice: a randomized trial of the QuEST intervention. J Gen Intern Med 2001;16:143-9.
19. Dobscha SK, Gerrity MS, Ward MF. Effectiveness of an intervention to improve primary care provider recognition of depression. Eff Clin Pract 2001;4:163-71.
20. Williams JW, Mulrow CD, Kroenke K, Dhanda R, Badgett RG, Omori D, et al. Case-finding for depression in primary care: a randomized trial. Am J Med 1999;106:36-43.
21. Valenstein M, Dalack G, Blow F, Figueroa S, Standiford C, Douglass A. Screening for psychiatric illness with a combined screening and diagnostic instrument. J Gen Intern Med 1997;12:679-85.
22. Kroenke K, Spitzer RL, Williams JB. The PHQ-9: validity of a brief depression severity measure. J Gen Intern Med 2001;16:606-13.
Dysthymia in Primary Care Who Needs Treatment and How Do We Know?
It is tempting to agree with Barrett and colleagues1 that dysthymia in primary care is a separate and unique syndrome that requires pharmacologic intervention, though patients with minor depression respond well to watchful waiting. However, this begs the question of who or what are we treating: a patient or a diagnostic label?
We should be concerned about the interpretations of results that encourage the use of labels based on psychiatric diagnosis criteria to drive treatment decisions. These labels confuse the diagnostic criteria’s approximation of truth with the concrete truth of a set of symptoms that belong to a patient sitting in the examination room. There is controversy over the validity of diagnostic labels for depressive disorders within the psychiatric literature.2 In primary care, these problems are amplified because our patients who meet criteria for depressive disorders present with a broad range of severity and frequently have comorbid medical conditions that obscure the unique contribution of depression to the patient’s distress.
Despite the best of intentions, the work by Barrett and colleagues links yet another set of diagnostic criteria with an imperative to treat. The results of this study could easily lead to a very different conclusion from the one reached by the authors. The conclusion could have been that response to treatment is dependent on severity and impairment, rather than on satisfying the diagnostic criteria. Because the study’s design failed to set an upper limit on the severity of symptoms, the population included severely impaired patients whose response to treatment may have had more to do with that severity than with diagnostic criteria. Indeed, the more severely impaired patients were the ones whose outcomes appear most clinically relevant by showing a significant improvement on the Mental Health Component of the Medical Outcomes Study Short Form 36 health-related quality of life measure.
Their project has 2 other problems that create a challenge in translating the results to routine primary care practice: (1) the use of interventions that require resources not commonly available to a practice, and (2) a lack of longer-term outcome data. Problem Solving Therapy (PST) was designed for delivery by clinicians or staff already present in a typical primary care office in the United Kingdom.3
Unfortunately, in the study by Barrett and colleagues PST was provided by mental health professionals. This creates a bias in favor of treatment and does not help us understand the effectiveness of PST in a typical primary care practice. In addition, 25-week outcomes were measured as a part of the study protocol but were not reported.4 These longer-term outcomes would answer questions about treatment sustainability and long-term value.
So, which patients need treatment and how do we determine who they are? Ultimately, the decision is made by those of us who meet with patients in the examination room, listen to their symptoms, attempt to understand their level of impairment, and set priorities among the many comorbid conditions clamoring for attention. Only as a last resort do we reach for a set of diagnostic criteria, hoping they will help us to make sense of the patient’s symptoms. The results of the study by Barrett and colleagues should not sway us to a prescriptive mandate for treatment according to the presence of diagnostic criteria. Rather we should prescribe treatment based on each unique patient and his or her level of impairment.
1. Barrett JE, Williams JW, Oxman TE, et al. Treatment of dysthymia and minor depression in primary care: a randomized trial in patients aged 18 to 59 years. J Fam Pract 2001;50:405-12.
2. Regier DA, Kaelber CT, Rae DS, et al. Limitations of diagnostic criteria and assessment instruments for mental disorders. Implications for research and policy. Arch Gen Psychiatry 1998;55:109-15.
3. Mynors-Wallis L. Problem-solving treatment: evidence for effectiveness and feasibility in primary care. Int J Psychiatry Med 1996;26:249-62.
4. Barrett JE, Williams JW, Jr., Oxman TE, et al. The treatment effectiveness project. A comparison of the effectiveness of paroxetine, problem-solving therapy, and placebo in the treatment of minor depression and dysthymia in primary care patients: background and research plan. Gen Hosp Psychiatry 1999;21:260-73.
It is tempting to agree with Barrett and colleagues1 that dysthymia in primary care is a separate and unique syndrome that requires pharmacologic intervention, though patients with minor depression respond well to watchful waiting. However, this begs the question of who or what are we treating: a patient or a diagnostic label?
We should be concerned about the interpretations of results that encourage the use of labels based on psychiatric diagnosis criteria to drive treatment decisions. These labels confuse the diagnostic criteria’s approximation of truth with the concrete truth of a set of symptoms that belong to a patient sitting in the examination room. There is controversy over the validity of diagnostic labels for depressive disorders within the psychiatric literature.2 In primary care, these problems are amplified because our patients who meet criteria for depressive disorders present with a broad range of severity and frequently have comorbid medical conditions that obscure the unique contribution of depression to the patient’s distress.
Despite the best of intentions, the work by Barrett and colleagues links yet another set of diagnostic criteria with an imperative to treat. The results of this study could easily lead to a very different conclusion from the one reached by the authors. The conclusion could have been that response to treatment is dependent on severity and impairment, rather than on satisfying the diagnostic criteria. Because the study’s design failed to set an upper limit on the severity of symptoms, the population included severely impaired patients whose response to treatment may have had more to do with that severity than with diagnostic criteria. Indeed, the more severely impaired patients were the ones whose outcomes appear most clinically relevant by showing a significant improvement on the Mental Health Component of the Medical Outcomes Study Short Form 36 health-related quality of life measure.
Their project has 2 other problems that create a challenge in translating the results to routine primary care practice: (1) the use of interventions that require resources not commonly available to a practice, and (2) a lack of longer-term outcome data. Problem Solving Therapy (PST) was designed for delivery by clinicians or staff already present in a typical primary care office in the United Kingdom.3
Unfortunately, in the study by Barrett and colleagues PST was provided by mental health professionals. This creates a bias in favor of treatment and does not help us understand the effectiveness of PST in a typical primary care practice. In addition, 25-week outcomes were measured as a part of the study protocol but were not reported.4 These longer-term outcomes would answer questions about treatment sustainability and long-term value.
So, which patients need treatment and how do we determine who they are? Ultimately, the decision is made by those of us who meet with patients in the examination room, listen to their symptoms, attempt to understand their level of impairment, and set priorities among the many comorbid conditions clamoring for attention. Only as a last resort do we reach for a set of diagnostic criteria, hoping they will help us to make sense of the patient’s symptoms. The results of the study by Barrett and colleagues should not sway us to a prescriptive mandate for treatment according to the presence of diagnostic criteria. Rather we should prescribe treatment based on each unique patient and his or her level of impairment.
1. Barrett JE, Williams JW, Oxman TE, et al. Treatment of dysthymia and minor depression in primary care: a randomized trial in patients aged 18 to 59 years. J Fam Pract 2001;50:405-12.
2. Regier DA, Kaelber CT, Rae DS, et al. Limitations of diagnostic criteria and assessment instruments for mental disorders. Implications for research and policy. Arch Gen Psychiatry 1998;55:109-15.
3. Mynors-Wallis L. Problem-solving treatment: evidence for effectiveness and feasibility in primary care. Int J Psychiatry Med 1996;26:249-62.
4. Barrett JE, Williams JW, Jr., Oxman TE, et al. The treatment effectiveness project. A comparison of the effectiveness of paroxetine, problem-solving therapy, and placebo in the treatment of minor depression and dysthymia in primary care patients: background and research plan. Gen Hosp Psychiatry 1999;21:260-73.
Does the Severity of Mood and Anxiety Symptoms Predict Health Care Utilization?
METHODS: We used a cohort design to compare the health care utilization of 1232 subjects classified into 4 groups according to symptom severity. Health care billing data were evaluated for each subject for a 15-month period around the index visit. Multiple linear regression models were used to examine relative contributions of individual variables to differences in health care utilization. Analysis of variance procedures were used to compare charges among the severity groups after adjusting for demographic and medical comorbidity variables.
RESULTS: After adjustment, significant differences in health care utilization between groups were seen in all but 3 of the 15 months studied. Also, after adjustment, the presence of a mood or anxiety disorder influenced utilization for only a 6-month period. At 9 to12 months, subjects in the high-severity group showed a more than twofold difference in adjusted charges compared with the low-severity group ($225.36 vs $94.37).
CONCLUSIONS: Our severity-based classification predicts statistically and clinically significant differences in health care utilization over most of a 15-month period. Differences in utilization persist even after adjustment for medical comorbidity and significant demographic covariates. Our work lends additional evidence that beyond screening for the presence of mood and anxiety disorders, it is important to assess symptom severity in primary care patients. Further study directed toward developing effective methods of identifying patients with high levels of mood and anxiety symptom severity could result in significant cost savings.
Mental health problems in the primary care setting have received a great deal of attention over the past 20 years. Much of the interest and study has focused on depressive disorders, which have been shown to be common in primary care.1-7 Studies have demonstrated that while depressive disorders result in significant morbidity,8,9 they are often underrecognized by primary care physicians.10-12 Consequently, instruments have been developed to assist primary care physicians in the screening and identification of patients who meet standard Diagnostic and Statistical Manual13 (DSM) criteria for depressive disorders.6,7,14,15
This underrecognition and the development of screening tools have fostered the creation of a screen-detect-treat-improve strategy. This strategy is embodied in the National Institute of Mental Health/Agency for Health Care Policy and Research guidelines for the detection and treatment of depression in primary care.16 The underlying assumption is that primary care patients who meet criteria for depression are at risk for significant morbidity and mortality, and may significantly increase costs to the health care system.17 Unfortunately, early clinical trials utilizing this screen-detect-treat-improve strategy have shown little success in improving outcomes.18-21 One explanation for this may be that screening on the basis of DSM22 criteria alone does not identify those patients with the highest morbidity and those most likely to benefit from intervention.
In a previous study, we described a mathematical approach to classifying patients with mood and anxiety symptoms in primary care.23 This approach grouped patients according to the self-reported severity of 15 mood and anxiety symptoms. These groupings did not show much agreement with the diagnosis of DSM-III-R criteria-based mood or anxiety disorders, but did as well or better than DSM-III-R criteria at predicting differences in health-related quality of life (HRQOL). This follow-up study sought to determine if these severity-based groups were also useful in predicting differences in health care utilization over time. If severity-related groupings are proved predictive of utilization differences, our study would lend additional evidence to support the routine assessment of mood and anxiety symptom severity before, or even instead of, screening for mental health disorders.
Methods
Sample And Procedures
For this study we used a secondary analysis of data collected as part of a study of alcohol screening methods in primary care funded by the National Institute on Alcohol Abuse and Alcoholism. Subjects were adult primary care patients presenting for nonurgent care to the Family Practice Center of the University of Texas Medical Branch (UTMB) in Galveston, Texas. They were enrolled over 15 months, beginning in October 1993. The sampling strategy called for an oversampling of women, African Americans, and Mexican Americans. Full details of the sampling strategy are available elsewhere.24 Institutional Review Board approval was obtained from UTMB before the initial study and before the subsequent sampling of charge data.
Primary Measures
Mood and Anxiety Symptoms and Severity-Based Clusters. We developed a severity measure of mood and anxiety symptoms for the primary alcohol screening study. We asked patients to rate the frequency of their symptoms using a 2-week time frame. Response options included “none of the time,” “a little of the time,” “some of the time,” “most of the time,” and “all of the time.” Questions from the symptom measure are presented in Table 1.
Responses to this symptom measure were used to create clusters or groups of patients with similar severity profiles.23 Four distinct groups were identified: low severity, moderate anxiety/minor mood, moderate anxiety/severe mood, and high severity. The groups were distinguished by their relative levels of severity across both mood and anxiety symptoms rather than by clustering mood and anxiety symptoms into individual groups. As previously reported, these groups varied on indicators of physical comorbidity, income and occupational status, and measures of HRQOL.
Health Care Costs. We obtained billing data from UTMB Hospital Information Services for the 15-month period composed of the 3 months before and the 12 months after each patient’s index visit. These data included physician charges and charges for other technical services. Details regarding those services were not obtained. Outpatient pharmacy data was not included. The data reflected all activity within the UTMB Hospitals and Clinics, and therefore included inpatient, outpatient, and mental health services. Because we recognize that any mental health symptomatology captured at the index visit reflected morbidity that had been present for an unknown period, we included charge data from 3 months preceding the index visit. We are confident we captured the majority of health care use in our study population because of the dominant presence of the UTMB Hospitals and Clinics in the local health care market.
All charges were divided into 3-month intervals, then summed. Because missing charge data could (1) indicate the patient had left the area, or (2) indicate the patient received no charges during the period in question, we developed the following procedure. Where charge data for a patient was missing within a 3-month period, we examined the subsequent 3-month periods, including 3 months beyond the period of study. If charge data existed for any subsequent period, we assumed that the patient was still active in the UTMB health system but no charges had been recorded during the intervening period(s). In this situation, a zero was recorded as the amount billed. If, in contrast, all subsequent periods were void of charge data, we assumed the patient had left the UTMB health system, and the data was treated as “system missing” and not used in any data analysis calculations. This conservative approach would reduce the average charges for each group, though more for the low-severity group, which had the lowest medical comorbidity.
Other Variables. We also examined age, sex, ethnicity, income level, medical comorbidities, and the presence or absence of a mood or anxiety disorder as independent variables.
Adjustment for medical comorbidities was based on a count of diagnoses of chronic health problems from patients’ problem lists that were found predictive of Short Form-36 Physical Component Summary scale (SF-36 PCS) scores.25 Chronic health problems, grouped by International Classification of Diseases diagnosis codes, indicative of PCS scale scores were identified through a linear regression model that used the SF-36 PCS scale scores as the dependent variable. These chronic disease states, representing chronic health problems seen commonly in primary care patients, were included in the comorbidity index. The index was confirmed by testing a validation subset of a randomly selected group of cases. The comorbidity index was also shown to have predictive validity for future health care costs. This approach was modeled after the adaptation by Deyo26 of the Charlson Index,27 a widely used and validated clinical comorbidity adjustment index developed in a hospital-based patient population.
The presence of a mood or anxiety disorder was determined in the original study through use of the mood and anxiety modules of the PRIME-MD instrument.6 We included anxiety disorders in this study because we used those symptoms in the original study that produced the severity groups. Disorders included major depression, partial remission or recurrence of a major depressive disorder, dysthymia, bipolar disorder, generalized anxiety disorder, and panic disorder. Prevalence estimates for these disorders in our sample were consistent with those obtained by the PRIME-MD 1000 study, with the exception of major depressive disorder, which was identified in 18.2% of our sample compared with 12% in the PRIME-MD 1000 study.
Data Analysis
After aggregating the charge data for each 3-month period, we normalized the data using a logarithmic transformation. We calculated unadjusted utilization costs for each 3-month period surrounding the study index visit. Associated 95% confidence limits were also estimated. Analyses of variance were used to test for differences between symptom severity groups. T tests were performed to examine charge differences between patients with and without a diagnosed mood or anxiety disorder as determined by the PRIME-MD.
We next evaluated whether the differences seen between the symptom severity groups would remain after adjusting for significant covariates. To ensure that our analyses did not overestimate the contributions of a mood or anxiety disorder or symptom-severity group membership, analyses of covariance were used to test for interactions between these variables.
We used stepwise multiple linear regression to examine which covariates, in addition to the symptom severity groups, had an influence on charges within each period. Because membership in a symptom severity group was not an ordinal measure, this variable was transformed into 4 dichotomous variables, one to denote membership for each group. The 2 moderate-severity groups and the high-severity group were entered into the regression model as a single block, with the low-severity group serving as the reference group. Medical comorbidity was entered into the model first, a stepwise block containing all demographic variables was entered, the symptom severity group block was entered, and finally the DSM-III-R variable. The ordering of variables was chosen to examine the relative impact on charges of the severity groups after first entering the comorbidity and demographic variables, and finally whether the presence of a diagnosed mood or anxiety disorder added additional information. As a part of our evaluation of each regression model, we also examined collinearity diagnostics.
Using the information from the regression models, the significant covariates were included in an analysis of covariance for each period to test for significant differences in adjusted charges between severity groups. For each symptom severity group, means for covariate adjusted charges were also estimated across each period.
Results
Sample Description
Mean age of subjects in our sample was 43 years (standard deviation = 15.7); 70% of our subjects were women, 39% white, 35% African American, and 26% Hispanic. Among our Hispanic patients, the level of acculturation by birth status was relatively high: 51% were at least second-generation US residents, and an additional 34% were first-generation US residents. A total of 57% of our sample had taken some courses beyond the high school level, and 53% had an annual household income of less than $20,000. Additional sociodemographic information is available in the original paper describing this sample.23
From our sample of 1333 subjects, 83 were excluded from the cluster analysis procedure because of incomplete responses to the 15-item symptom severity instrument. Another 18 subjects were excluded because of an inability to access their billing records, leaving 1232 subjects for our utilization analyses. Loss of charge data over time was 14.3%, with available charge data for 1055 subjects for the period 9 to 12 months after each subject’s index visit.
Symptom Severisty Group Descriptions
We clustered study subjects into 4 groups: low severity (n = 686), moderate anxiety/minor mood (n = 335), moderate anxiety/severe mood (n = 148), and high severity (n = 81). Sociodemographic information on subjects in each cluster and mean symptom severity scores for each cluster were presented in our initial paper.22 Membership in a higher-severity cluster tended to be associated with being female, unemployed, and having an annual income of less than $10,000. Significant differences were not seen between groups with respect to age, education, or presence of chronic health problems.
With the exception of the 2 moderate-anxiety groups, individuals in each group were distinguished by the level of severity across all symptoms. Subjects in the 2 moderate groups shared similar severity of anxiety symptoms but differed in the severity of their mood symptoms.
The Figure 1 displays the distribution across the 4 severity groups for those patients who met criteria for individual disorders. (For comparison, we also show the distribution for subjects who failed to meet criteria for any disorder.) This figure illustrates the lack of relationship between the severity groups and the diagnostic entities. The distribution does not follow an expected distribution of the majority of subjects with any particular disorder in the high-severity group. For major depressive disorder, partial remission or recurrence of a depressive disorder, and bipolar disorder the majority of subjects meeting criteria are actually found in the 2 moderate-severity groups. Subjects who failed to meet diagnostic criteria for any major depressive disorder have a symptom severity distribution similar to those who do. This suggests that for these mood and anxiety disorders, meeting the diagnostic criteria is not necessarily associated with a high level of symptom severity.
Charge Differences Between Clusters
Table 2 presents the unadjusted mean charges for each cluster group for each 3-month period of charge data obtained. Charges decreased for each severity group over the period of study, but the general trend toward higher charges in the high-severity group persisted over time. Even 9 to 12 months after the index visit, patients in the high-severity group had an average of more than 3 times the health care charges of patients in the low-severity group.
The largest significant differences were seen between the low- and high-severity clusters, except for the 6- to 9-month period. No statistically significant differences in charges were seen between the moderate-severity clusters for any period studied.
Charge Differences By Mood And Anxiety Disorder Criteria
Table 3 presents mean charges for patients who did and did not meet DSM-III-R criteria for any mood or anxiety disorder according to the PRIME-MD. Again, a trend of diminishing charges over time was seen for all patients. For each period studied, patients who met criteria for either a mood or anxiety disorder had nearly twice the charges of patients who did not meet criteria for these disorders. Significant differences were seen between groups for each period.
Mood Or Anxiety Disorder And Symptom Severity
No significant interactions were seen between the presence of a clinically diagnosed mood or anxiety disorder and symptom severity with respect to our charge data when examined using analysis of covariance procedures. This lack of interaction persisted across all periods for which we obtained charge data. Again this lends support to the idea that mood and anxiety symptom severity operates independently from the presence of a diagnosed disorder.
Regression Analyses
The results of stepwise multiple regression analyses are seen in Table 4. Medical comorbidity and income entered each regression model. Age was a significant factor influencing charges in 3 of the 5 periods. The influence of symptom severity on utilization showed decreasing levels of significance over time. The variable that tracked the presence of a mood or anxiety disorder entered the regression models for only the 2 periods encompassing the first 6 months after the index visit. This indicates that whether a subject met DSM-III-R criteria did not significantly influence utilization beyond the 6 months immediately following the index visit. The variance in total charges explained by each model was consistently approximately 8% to 11%, except for the initial period, where the model explained 15% of the charge variance. Regression diagnostics confirmed that the independent variables were not collinear.
Adjustment Of Mean Charges For Significant Covariates
Table 5 displays mean charges across symptom severity groups after adjusting for covariates that entered our regression models. While the magnitude of charges was reduced somewhat compared with the unadjusted values, the relative charge differences between symptom severity groups were nearly the same as in the unadjusted means. As expected, significant differences existed in the mean charges between severity groups for all periods, except the 6 to 9 months after the index visit. There was an almost fourfold reduction in the mean charges for the high-severity group over the entire study period; however, even at 9 to 12 months, patients in this group showed an average of 2 times the charges of those in the low-severity group.
Discussion
In this study we sought to expand our initial study of differences between patients with varying levels of mood and anxiety symptoms by examining differences in health care utilization. We also sought to determine whether any utilization differences would persist over time. Because of the availability of charge data in the UTMB health system, we used charge data as a surrogate measure for health care utilization.
Limitations
Our study has limitations that should be understood before we address potential implications. The findings are limited by being a retrospective secondary analysis of data. Our original study was not specifically designed to address the questions we have raised here. Also, the subjects were recruited from a single primary care site, which may limit the generalizability of the results. However, the high quality of the initial sampling and our ability to adjust for potential sociodemographic and medical confounders may balance these limitations.
Total charges from a single system were used as an indirect measure of health care utilization. Although it is possible that patients may have accessed health care outside of the UTMB system during the study period, our setting of Galveston Island represents a relatively closed health care environment, with UTMB being the dominant care provider. One confirmation of this fact is the 14.3% rate of attrition from our sample. While this rate may seem high, it should be remembered that our study was purely observational, with no direct contact between the investigators and subjects after the initial index visit. We were unable to obtain information on third-party payers from our billing data. We could not therefore adjust for potential variations in charges based on these differences.
A final limitation stems from the initial sampling design, which enrolled subjects who were presenting for health care and measured their symptom severity at a single point. The relative impact of mental health symptom severity on utilization in our study may be different from that of subjects who were not actively presenting for care. But our sampling design, which enrolled only patients with prior appointments for nonurgent care, and our adjustment for medical comorbidity should have helped alleviate this issue. However, it is very likely that the progressive decrease seen in both the charges and in the ability of our regression models to explain charge variances is due to this limitation. In future studies, measuring mental health symptom severity at multiple points over time might provide a way of understanding the relationship of our findings to patients presenting for medical care.
Study Implications
The implications of this study should be placed in the context of our earlier study. In that study we demonstrated that primary care patients might be better characterized according to the severity of their mood and anxiety symptoms rather than by a diagnostic label. The groupings that we created using cluster analysis techniques were distinguished more by their symptom severity than by whether they had symptoms that were predominately mood or anxiety related. We found these groupings very predictive of differences in HRQOL as measured by the SF-36. While DSM-III-R mood and anxiety disorder criteria also predicted HRQOL differences, the differences associated with membership in a symptom severity group were more profound.23
This study reinforces the findings in our previous work by demonstrating health care utilization differences between symptom severity groups. Not only were significant differences measured between levels of utilization in the 3 months preceding and including the date subjects were enrolled, these differences also persisted for the entire 15 months of the study, with the exception of one 3-month period. The differences were robust to adjustment for significant covariates including age, income, medical comorbidity, ethnicity, and mood or anxiety disorder diagnosis. Except for the period from 1 to 180 days after the index visit, the presence of a mood or anxiety disorder failed to appear in our regression models as a factor that significantly influenced utilization.
This study of health care utilization is unique because it began with the severity of mood and anxiety symptoms experienced by an entire practice-based sample without selection according to symptoms, disorders, or physician recognition. The severity of the symptoms were used to derive a classification scheme that was tested for its ability to predict health care utilization. This is an important break from current classification schemes that employ methods of counting symptoms to identify patients with disorders and subsequent targeting for intervention. The importance of this approach is illustrated in the Figure 1, where we demonstrate that patients who meet specific DSM-III-R disorder criteria distribute across most (if not all) our symptom severity groups. In other words, if a primary care patient reports enough symptoms to meet criteria for a particular disorder we cannot assume that those symptoms are severe. The reverse also appears to be true; that is, patients who fail to meet criteria are not necessarily experiencing a low level of symptom severity. The severity distribution of subjects who have no disorder is strikingly similar to those who meet criteria for major depressive disorder.
Taken together, our 2 studies lay the groundwork for a reconceptualization of how primary care patients with mood and anxiety symptoms are evaluated and classified. Clues are emerging that psychiatric labels may not be adequate to fully describe the spectrum of mental health problems in primary care. Evidence from studies of cancer patients suggests that application of psychiatric criteria for major depressive disorder outside a psychiatric population results in misclassification.28,29 Gallo and colleagues30 have used the Baltimore Epidemiologic Catchment Area Program sample to demonstrate that traditional criteria for classifying depression may not be adequate to identify elderly patients who are at risk. Data from the Michigan Depression Project indicate that primary care physicians appear to recognize an overlapping but different group of patients from those identified by mental health screening tools.31 Our work appears to lend additional evidence that psychiatric labels describe only part of a complex picture of mental health symptomatology.
Our explorations of mood and anxiety symptom severity through cluster analysis have yielded what we have termed a “classification.” However, we believe this classification is most likely representative of an underlying severity dimension that cuts across mood and anxiety symptom types. This concept is not new. Many treatment trials of depression in primary care have already used monitoring of severity with instruments such as the Hamilton Depression Rating Scale32 as outcome measures. What is new is mood and anxiety symptom severity as an independent predictor of HRQOL and utilization outcomes beyond presence of a psychiatric disorder. This suggests a unique and independent priority for symptom severity status.
Consensus is emerging that depression is a chronic illness with periods of exacerbation and recovery.33,34 Conceptualizing a symptom severity dimension as a predictor of HRQOL and utilization appears consistent with this idea. The presence of a mood or anxiety disorder may be similar to having asthma, with actual mood and anxiety symptom severity similar to peak flow status. Just as patients experiencing bronchospasm for any of a variety of reasons have decreased peak flow independent of an asthma diagnosis, it appears that primary care patients experience severe mood and anxiety symptoms for a variety of reasons independent of a psychiatric disorder diagnosis. Also for patients who have disorders, symptom severity may be a more important parameter to follow than DSM-III-R criteria that measure the “recovery from” or “relapse back into” a disorder.
Because our instrument did not include other symptom severity measures we were unable to compare it with others, such as the Hamilton Depression Rating Scale.31 However, questions exist about the ability of the Hamilton Scale to serve as a measure of depression severity.35 Beyond these concerns, a 15-item self report measure of severity appears to have advantages in a busy clinical setting.
Finally, given the apparent sensitivity of symptom severity for impairment and utilization differences, we postulate that our severity instrument could be useful in initially identifying patients at risk, as well as in monitoring previously identified patients. Existing instruments are not well accepted by primary care clinicians, perhaps because of high rates of false positives.36 We are currently testing whether such a use would be feasible. With intervention studies of treatment-resistant patients now being undertaken, use of a severity measure to identify patients for intervention could be very helpful. This work could proceed along the lines of stepped-care approaches for other disease entities, such as diabetes, asthma, or depression.
Conclusions
We agree with Klinkman and Okkes,37 who have called for more primary epidemiology within the area of mental health in primary care. Our work demonstrates that the relationship between symptom severity and the presence of a mood or anxiety disorder is very complex and worthy of further exploratory study. Indeed, the utilization implications here are profound because our classifications have the potential to identify patients who have high levels of health care utilization in a way other than by traditional diagnoses or medical comorbidity. Cluster analysis has provided a useful tool for examining new ways of understanding how mood and anxiety symptoms are present in the primary care setting. Further prospective work should continue to enlarge this understanding.
Acknowledgments
This project was supported in part by grants from the National Institute on Alcohol Abuse and Alcoholism (AA09496) and the Bureau of Health Professions, Health Resources and Services Administration (D32-PE16033 and D32-PE10158).
1. Kessler LG, Cleary PD, Burke JD. Psychiatric disorders in primary care. Arch Gen Psychiatry 1985;42:583-7.
2. Schulberg HC, Saul M, McClelland M, Ganguli M, Christy W, Frank R. Assessing depression in primary medical and psychiatric practices. Arch Gen Psychiatry 1985;42:1164-70.
3. Barrett JE, Barrett JA, Oxman TE, Gerber PD. The prevalence of psychiatric disorders in a primary care practice. Arch Gen Psychiatry 1988;45:1100-6.
4. Katon W, Schulberg HC. Epidemiology of depression in primary care. Gen Hosp Psychiatry 1992;14:237-47.
5. Coyne JC, Fechner-Bates S, Schwenk TL. Prevalence, nature, and comorbidity of depressive disorders in primary care. Gen Hosp Psychiatry 1994;16:267-76.
6. Spitzer RL, Williams JB, Kroenke K, et al. Utility of a new procedure for diagnosing mental disorders in primary care: the PRIME-MD 1000 study. JAMA 1994;272:1749-56.
7. Weissman MM, Olfson M, Leon AC, et al. Brief diagnostic interviews (SDDS-PC) for multiple mental disorders in primary care. A pilot study. Arch Fam Med 1995;4:220-7.
8. Broadhead WE, Blazer DG, George LK, et al. Depression, disability days, and days lost from work in a prospective epidemiologic survey. JAMA 1990;264:2524-8.
9. Wells K, Burnam M, Rogers W, Hays R, Camp P. The course of depression in adult outpatients: results from the medical outcomes study. Arch Gen Psychiatry 1992;49:788-94.
10. Von Korff M, Shapiro S, Burke JD, et al. Anxiety and depression in a primary care clinic. Comparison of diagnostic interview schedule, general health questionnaire, and practitioner assessments. Arch Gen Psychiatry 1987;44:152-6.
11. Gerber PD, Barrett J, Manheimer E, Whiting R, Smith R. Recognition of depression by internists in primary care: a comparison of internist and 'gold standard' psychiatric assessments. J Gen Intern Med 1989;4:7-13.
12. Coyne JC, Schwenk TL, Fechner-Bates S. Nondetection of depression by primary care physicians reconsidered. Gen Hosp Psychiatry 1995;17:3-12.
13. American Psychiatric Association. Task Force on DSM-IV. Diagnostic and statistical manual of mental disorders, 4th ed (DSM-IV). Washington, DC: American Psychiatric Association; 1994:xxvii, 886.
14. Weissman MM, Broadhead WE, Olfson M, et al. A diagnostic aid for detecting (DSM-IV) mental disorders in primary care. Gen Hosp Psychiatry 1998;20:1-11.
15. Broadhead WE, Leon AC, Weissman MM, et al. Development and validation of the SDDS-PC screen for multiple mental disorders in primary care. Arch Fam Med 1995;4:211-9.
16. Hirschfeld RM, Keller MB, Panico S, et al. The National Depressive and Manic-Depressive Association Consensus Statement on the Undertreatment of Depression. JAMA 1997;277:333-40.
17. Depression Guideline Panel. United States. Agency for Health Care Policy and Research. Depression in primary care. Rockville, Md: US Dept of Health and Human Services–Agency for Health Care Policy and Research; 1993.
18. Callahan CM, Hendrie HC, Dittus RS, Brater DC, Hui SL, Tierney WM. Improving treatment of late life depression in primary care: a randomized clinical trial. J Am Geriatr Soc 1994;42:839-46.
19. Dowrick C, Buchan I. Twelve month outcome of depression in general practice: does detection or disclosure make a difference? BMJ 1995;311:1274-6.
20. Reifler DR, Kessler HS, Bernhard EJ, Leon AC, Martin GJ. Impact of screening for mental health concerns on health service utilization and functional status in primary care patients. Arch Intern Med 1996;156:2593-9.
21. Lin EH, Simon GE, Katon WJ, et al. Can enhanced acute-phase treatment of depression improve long-term outcomes? A report of randomized trials in primary care. Am J Psychiatry 1999;156:643-5.
22. American Psychiatric Association, Work Group to Revise DSM-III. Diagnostic and statistical manual of mental disorders: Dsm-III-R. 3rd, rev. ed Washington, DC: American Psychiatric Association; 1987.
23. Nease DE, Volk RJ, Cass AR. Investigation of a severity-based classification of mood and anxiety symptoms in primary care patients. J Am Board Fam Pract 1999;12:21-31.
24. Volk R, Steinbauer J, Cantor C, Holzer C. The Alcohol Use Disorders Identification Test (AUDIT) as a screen for at-risk drinking in primary care patients of different racial/ethnic backgrounds. Addiction 1997;92:197-206.
25. Ware J, Kosinski M, Keller S. Physical and mental health summary scales: a user’s manual. Boston, Mass: The Health Institute, New England Medical Center; 1994.
26. Deyo R, Cherkin D, Ciol M. Adapting a clinical comorbidity index for use with ICD-9-CM administrative databases. J Clin Epidemiol 1992;45:613-9.
27. Charlson M, Pompei P, Ales K, MacKenzie C. A new method of classifying prognostic comorbidity in longitudinal studies: development and validation. J Chron Dis 1987;40:373-83.
28. Endicott J. Measurement of depression in patients with cancer. Cancer 1984;53:2243-9.
29. Kathol RG, Mutgi A, Williams J, Clamon G, Noyes R, Jr. Diagnosis of major depression in cancer patients according to four sets of criteria. Am J Psychiatry 1990;147:1021-4.
30. Gallo JJ, Rabins PV, Lyketsos CG, Tien AY, Anthony JC. Depression without sadness: functional outcomes of nondysphoric depression in later life. J Am Geriatr Soc 1997;45:570-8.
31. Klinkman MS, Coyne JC, Gallo S, Schwenk TL. False positives, false negatives, and the validity of the diagnosis of major depression in primary care. Arch Fam Med. 1998;7:451-61.
32. Hamilton M. Development of a rating scale for primary depressive illness. Br J Soc Clin Psychol. 1967;6:278-96.
33. Klinkman MS, Schwenk TL, Coyne JC. Depression in primary care—more like asthma than appendicitis: the Michigan Depression Project. Can J Psychiatry. 1997;42:966-73.
34. Judd LL, Akiskal HS, Maser JD, et al. A prospective 12-year study of subsyndromal and syndromal depressive symptoms in unipolar major depressive disorders. Arch Gen Psychiatry. 1998;55:694-700.
35. Gibbons RD, Clark DC, Kupfer DJ. Exactly what does the Hamilton Depression Rating Scale measure? J Psychiatr Res. 1993;27:259-73.
36. Valenstein M, Dalack G, Blow F, Figueroa S, Standiford C, Douglass A. Screening for psychiatric illness with a combined screening and diagnostic instrument. J Gen Intern Med. 1997;12:679-85.
37. Klinkman MS, Okkes I. Mental health problems in primary care. A research agenda. J Fam Pract. 1998;47:379-84.
METHODS: We used a cohort design to compare the health care utilization of 1232 subjects classified into 4 groups according to symptom severity. Health care billing data were evaluated for each subject for a 15-month period around the index visit. Multiple linear regression models were used to examine relative contributions of individual variables to differences in health care utilization. Analysis of variance procedures were used to compare charges among the severity groups after adjusting for demographic and medical comorbidity variables.
RESULTS: After adjustment, significant differences in health care utilization between groups were seen in all but 3 of the 15 months studied. Also, after adjustment, the presence of a mood or anxiety disorder influenced utilization for only a 6-month period. At 9 to12 months, subjects in the high-severity group showed a more than twofold difference in adjusted charges compared with the low-severity group ($225.36 vs $94.37).
CONCLUSIONS: Our severity-based classification predicts statistically and clinically significant differences in health care utilization over most of a 15-month period. Differences in utilization persist even after adjustment for medical comorbidity and significant demographic covariates. Our work lends additional evidence that beyond screening for the presence of mood and anxiety disorders, it is important to assess symptom severity in primary care patients. Further study directed toward developing effective methods of identifying patients with high levels of mood and anxiety symptom severity could result in significant cost savings.
Mental health problems in the primary care setting have received a great deal of attention over the past 20 years. Much of the interest and study has focused on depressive disorders, which have been shown to be common in primary care.1-7 Studies have demonstrated that while depressive disorders result in significant morbidity,8,9 they are often underrecognized by primary care physicians.10-12 Consequently, instruments have been developed to assist primary care physicians in the screening and identification of patients who meet standard Diagnostic and Statistical Manual13 (DSM) criteria for depressive disorders.6,7,14,15
This underrecognition and the development of screening tools have fostered the creation of a screen-detect-treat-improve strategy. This strategy is embodied in the National Institute of Mental Health/Agency for Health Care Policy and Research guidelines for the detection and treatment of depression in primary care.16 The underlying assumption is that primary care patients who meet criteria for depression are at risk for significant morbidity and mortality, and may significantly increase costs to the health care system.17 Unfortunately, early clinical trials utilizing this screen-detect-treat-improve strategy have shown little success in improving outcomes.18-21 One explanation for this may be that screening on the basis of DSM22 criteria alone does not identify those patients with the highest morbidity and those most likely to benefit from intervention.
In a previous study, we described a mathematical approach to classifying patients with mood and anxiety symptoms in primary care.23 This approach grouped patients according to the self-reported severity of 15 mood and anxiety symptoms. These groupings did not show much agreement with the diagnosis of DSM-III-R criteria-based mood or anxiety disorders, but did as well or better than DSM-III-R criteria at predicting differences in health-related quality of life (HRQOL). This follow-up study sought to determine if these severity-based groups were also useful in predicting differences in health care utilization over time. If severity-related groupings are proved predictive of utilization differences, our study would lend additional evidence to support the routine assessment of mood and anxiety symptom severity before, or even instead of, screening for mental health disorders.
Methods
Sample And Procedures
For this study we used a secondary analysis of data collected as part of a study of alcohol screening methods in primary care funded by the National Institute on Alcohol Abuse and Alcoholism. Subjects were adult primary care patients presenting for nonurgent care to the Family Practice Center of the University of Texas Medical Branch (UTMB) in Galveston, Texas. They were enrolled over 15 months, beginning in October 1993. The sampling strategy called for an oversampling of women, African Americans, and Mexican Americans. Full details of the sampling strategy are available elsewhere.24 Institutional Review Board approval was obtained from UTMB before the initial study and before the subsequent sampling of charge data.
Primary Measures
Mood and Anxiety Symptoms and Severity-Based Clusters. We developed a severity measure of mood and anxiety symptoms for the primary alcohol screening study. We asked patients to rate the frequency of their symptoms using a 2-week time frame. Response options included “none of the time,” “a little of the time,” “some of the time,” “most of the time,” and “all of the time.” Questions from the symptom measure are presented in Table 1.
Responses to this symptom measure were used to create clusters or groups of patients with similar severity profiles.23 Four distinct groups were identified: low severity, moderate anxiety/minor mood, moderate anxiety/severe mood, and high severity. The groups were distinguished by their relative levels of severity across both mood and anxiety symptoms rather than by clustering mood and anxiety symptoms into individual groups. As previously reported, these groups varied on indicators of physical comorbidity, income and occupational status, and measures of HRQOL.
Health Care Costs. We obtained billing data from UTMB Hospital Information Services for the 15-month period composed of the 3 months before and the 12 months after each patient’s index visit. These data included physician charges and charges for other technical services. Details regarding those services were not obtained. Outpatient pharmacy data was not included. The data reflected all activity within the UTMB Hospitals and Clinics, and therefore included inpatient, outpatient, and mental health services. Because we recognize that any mental health symptomatology captured at the index visit reflected morbidity that had been present for an unknown period, we included charge data from 3 months preceding the index visit. We are confident we captured the majority of health care use in our study population because of the dominant presence of the UTMB Hospitals and Clinics in the local health care market.
All charges were divided into 3-month intervals, then summed. Because missing charge data could (1) indicate the patient had left the area, or (2) indicate the patient received no charges during the period in question, we developed the following procedure. Where charge data for a patient was missing within a 3-month period, we examined the subsequent 3-month periods, including 3 months beyond the period of study. If charge data existed for any subsequent period, we assumed that the patient was still active in the UTMB health system but no charges had been recorded during the intervening period(s). In this situation, a zero was recorded as the amount billed. If, in contrast, all subsequent periods were void of charge data, we assumed the patient had left the UTMB health system, and the data was treated as “system missing” and not used in any data analysis calculations. This conservative approach would reduce the average charges for each group, though more for the low-severity group, which had the lowest medical comorbidity.
Other Variables. We also examined age, sex, ethnicity, income level, medical comorbidities, and the presence or absence of a mood or anxiety disorder as independent variables.
Adjustment for medical comorbidities was based on a count of diagnoses of chronic health problems from patients’ problem lists that were found predictive of Short Form-36 Physical Component Summary scale (SF-36 PCS) scores.25 Chronic health problems, grouped by International Classification of Diseases diagnosis codes, indicative of PCS scale scores were identified through a linear regression model that used the SF-36 PCS scale scores as the dependent variable. These chronic disease states, representing chronic health problems seen commonly in primary care patients, were included in the comorbidity index. The index was confirmed by testing a validation subset of a randomly selected group of cases. The comorbidity index was also shown to have predictive validity for future health care costs. This approach was modeled after the adaptation by Deyo26 of the Charlson Index,27 a widely used and validated clinical comorbidity adjustment index developed in a hospital-based patient population.
The presence of a mood or anxiety disorder was determined in the original study through use of the mood and anxiety modules of the PRIME-MD instrument.6 We included anxiety disorders in this study because we used those symptoms in the original study that produced the severity groups. Disorders included major depression, partial remission or recurrence of a major depressive disorder, dysthymia, bipolar disorder, generalized anxiety disorder, and panic disorder. Prevalence estimates for these disorders in our sample were consistent with those obtained by the PRIME-MD 1000 study, with the exception of major depressive disorder, which was identified in 18.2% of our sample compared with 12% in the PRIME-MD 1000 study.
Data Analysis
After aggregating the charge data for each 3-month period, we normalized the data using a logarithmic transformation. We calculated unadjusted utilization costs for each 3-month period surrounding the study index visit. Associated 95% confidence limits were also estimated. Analyses of variance were used to test for differences between symptom severity groups. T tests were performed to examine charge differences between patients with and without a diagnosed mood or anxiety disorder as determined by the PRIME-MD.
We next evaluated whether the differences seen between the symptom severity groups would remain after adjusting for significant covariates. To ensure that our analyses did not overestimate the contributions of a mood or anxiety disorder or symptom-severity group membership, analyses of covariance were used to test for interactions between these variables.
We used stepwise multiple linear regression to examine which covariates, in addition to the symptom severity groups, had an influence on charges within each period. Because membership in a symptom severity group was not an ordinal measure, this variable was transformed into 4 dichotomous variables, one to denote membership for each group. The 2 moderate-severity groups and the high-severity group were entered into the regression model as a single block, with the low-severity group serving as the reference group. Medical comorbidity was entered into the model first, a stepwise block containing all demographic variables was entered, the symptom severity group block was entered, and finally the DSM-III-R variable. The ordering of variables was chosen to examine the relative impact on charges of the severity groups after first entering the comorbidity and demographic variables, and finally whether the presence of a diagnosed mood or anxiety disorder added additional information. As a part of our evaluation of each regression model, we also examined collinearity diagnostics.
Using the information from the regression models, the significant covariates were included in an analysis of covariance for each period to test for significant differences in adjusted charges between severity groups. For each symptom severity group, means for covariate adjusted charges were also estimated across each period.
Results
Sample Description
Mean age of subjects in our sample was 43 years (standard deviation = 15.7); 70% of our subjects were women, 39% white, 35% African American, and 26% Hispanic. Among our Hispanic patients, the level of acculturation by birth status was relatively high: 51% were at least second-generation US residents, and an additional 34% were first-generation US residents. A total of 57% of our sample had taken some courses beyond the high school level, and 53% had an annual household income of less than $20,000. Additional sociodemographic information is available in the original paper describing this sample.23
From our sample of 1333 subjects, 83 were excluded from the cluster analysis procedure because of incomplete responses to the 15-item symptom severity instrument. Another 18 subjects were excluded because of an inability to access their billing records, leaving 1232 subjects for our utilization analyses. Loss of charge data over time was 14.3%, with available charge data for 1055 subjects for the period 9 to 12 months after each subject’s index visit.
Symptom Severisty Group Descriptions
We clustered study subjects into 4 groups: low severity (n = 686), moderate anxiety/minor mood (n = 335), moderate anxiety/severe mood (n = 148), and high severity (n = 81). Sociodemographic information on subjects in each cluster and mean symptom severity scores for each cluster were presented in our initial paper.22 Membership in a higher-severity cluster tended to be associated with being female, unemployed, and having an annual income of less than $10,000. Significant differences were not seen between groups with respect to age, education, or presence of chronic health problems.
With the exception of the 2 moderate-anxiety groups, individuals in each group were distinguished by the level of severity across all symptoms. Subjects in the 2 moderate groups shared similar severity of anxiety symptoms but differed in the severity of their mood symptoms.
The Figure 1 displays the distribution across the 4 severity groups for those patients who met criteria for individual disorders. (For comparison, we also show the distribution for subjects who failed to meet criteria for any disorder.) This figure illustrates the lack of relationship between the severity groups and the diagnostic entities. The distribution does not follow an expected distribution of the majority of subjects with any particular disorder in the high-severity group. For major depressive disorder, partial remission or recurrence of a depressive disorder, and bipolar disorder the majority of subjects meeting criteria are actually found in the 2 moderate-severity groups. Subjects who failed to meet diagnostic criteria for any major depressive disorder have a symptom severity distribution similar to those who do. This suggests that for these mood and anxiety disorders, meeting the diagnostic criteria is not necessarily associated with a high level of symptom severity.
Charge Differences Between Clusters
Table 2 presents the unadjusted mean charges for each cluster group for each 3-month period of charge data obtained. Charges decreased for each severity group over the period of study, but the general trend toward higher charges in the high-severity group persisted over time. Even 9 to 12 months after the index visit, patients in the high-severity group had an average of more than 3 times the health care charges of patients in the low-severity group.
The largest significant differences were seen between the low- and high-severity clusters, except for the 6- to 9-month period. No statistically significant differences in charges were seen between the moderate-severity clusters for any period studied.
Charge Differences By Mood And Anxiety Disorder Criteria
Table 3 presents mean charges for patients who did and did not meet DSM-III-R criteria for any mood or anxiety disorder according to the PRIME-MD. Again, a trend of diminishing charges over time was seen for all patients. For each period studied, patients who met criteria for either a mood or anxiety disorder had nearly twice the charges of patients who did not meet criteria for these disorders. Significant differences were seen between groups for each period.
Mood Or Anxiety Disorder And Symptom Severity
No significant interactions were seen between the presence of a clinically diagnosed mood or anxiety disorder and symptom severity with respect to our charge data when examined using analysis of covariance procedures. This lack of interaction persisted across all periods for which we obtained charge data. Again this lends support to the idea that mood and anxiety symptom severity operates independently from the presence of a diagnosed disorder.
Regression Analyses
The results of stepwise multiple regression analyses are seen in Table 4. Medical comorbidity and income entered each regression model. Age was a significant factor influencing charges in 3 of the 5 periods. The influence of symptom severity on utilization showed decreasing levels of significance over time. The variable that tracked the presence of a mood or anxiety disorder entered the regression models for only the 2 periods encompassing the first 6 months after the index visit. This indicates that whether a subject met DSM-III-R criteria did not significantly influence utilization beyond the 6 months immediately following the index visit. The variance in total charges explained by each model was consistently approximately 8% to 11%, except for the initial period, where the model explained 15% of the charge variance. Regression diagnostics confirmed that the independent variables were not collinear.
Adjustment Of Mean Charges For Significant Covariates
Table 5 displays mean charges across symptom severity groups after adjusting for covariates that entered our regression models. While the magnitude of charges was reduced somewhat compared with the unadjusted values, the relative charge differences between symptom severity groups were nearly the same as in the unadjusted means. As expected, significant differences existed in the mean charges between severity groups for all periods, except the 6 to 9 months after the index visit. There was an almost fourfold reduction in the mean charges for the high-severity group over the entire study period; however, even at 9 to 12 months, patients in this group showed an average of 2 times the charges of those in the low-severity group.
Discussion
In this study we sought to expand our initial study of differences between patients with varying levels of mood and anxiety symptoms by examining differences in health care utilization. We also sought to determine whether any utilization differences would persist over time. Because of the availability of charge data in the UTMB health system, we used charge data as a surrogate measure for health care utilization.
Limitations
Our study has limitations that should be understood before we address potential implications. The findings are limited by being a retrospective secondary analysis of data. Our original study was not specifically designed to address the questions we have raised here. Also, the subjects were recruited from a single primary care site, which may limit the generalizability of the results. However, the high quality of the initial sampling and our ability to adjust for potential sociodemographic and medical confounders may balance these limitations.
Total charges from a single system were used as an indirect measure of health care utilization. Although it is possible that patients may have accessed health care outside of the UTMB system during the study period, our setting of Galveston Island represents a relatively closed health care environment, with UTMB being the dominant care provider. One confirmation of this fact is the 14.3% rate of attrition from our sample. While this rate may seem high, it should be remembered that our study was purely observational, with no direct contact between the investigators and subjects after the initial index visit. We were unable to obtain information on third-party payers from our billing data. We could not therefore adjust for potential variations in charges based on these differences.
A final limitation stems from the initial sampling design, which enrolled subjects who were presenting for health care and measured their symptom severity at a single point. The relative impact of mental health symptom severity on utilization in our study may be different from that of subjects who were not actively presenting for care. But our sampling design, which enrolled only patients with prior appointments for nonurgent care, and our adjustment for medical comorbidity should have helped alleviate this issue. However, it is very likely that the progressive decrease seen in both the charges and in the ability of our regression models to explain charge variances is due to this limitation. In future studies, measuring mental health symptom severity at multiple points over time might provide a way of understanding the relationship of our findings to patients presenting for medical care.
Study Implications
The implications of this study should be placed in the context of our earlier study. In that study we demonstrated that primary care patients might be better characterized according to the severity of their mood and anxiety symptoms rather than by a diagnostic label. The groupings that we created using cluster analysis techniques were distinguished more by their symptom severity than by whether they had symptoms that were predominately mood or anxiety related. We found these groupings very predictive of differences in HRQOL as measured by the SF-36. While DSM-III-R mood and anxiety disorder criteria also predicted HRQOL differences, the differences associated with membership in a symptom severity group were more profound.23
This study reinforces the findings in our previous work by demonstrating health care utilization differences between symptom severity groups. Not only were significant differences measured between levels of utilization in the 3 months preceding and including the date subjects were enrolled, these differences also persisted for the entire 15 months of the study, with the exception of one 3-month period. The differences were robust to adjustment for significant covariates including age, income, medical comorbidity, ethnicity, and mood or anxiety disorder diagnosis. Except for the period from 1 to 180 days after the index visit, the presence of a mood or anxiety disorder failed to appear in our regression models as a factor that significantly influenced utilization.
This study of health care utilization is unique because it began with the severity of mood and anxiety symptoms experienced by an entire practice-based sample without selection according to symptoms, disorders, or physician recognition. The severity of the symptoms were used to derive a classification scheme that was tested for its ability to predict health care utilization. This is an important break from current classification schemes that employ methods of counting symptoms to identify patients with disorders and subsequent targeting for intervention. The importance of this approach is illustrated in the Figure 1, where we demonstrate that patients who meet specific DSM-III-R disorder criteria distribute across most (if not all) our symptom severity groups. In other words, if a primary care patient reports enough symptoms to meet criteria for a particular disorder we cannot assume that those symptoms are severe. The reverse also appears to be true; that is, patients who fail to meet criteria are not necessarily experiencing a low level of symptom severity. The severity distribution of subjects who have no disorder is strikingly similar to those who meet criteria for major depressive disorder.
Taken together, our 2 studies lay the groundwork for a reconceptualization of how primary care patients with mood and anxiety symptoms are evaluated and classified. Clues are emerging that psychiatric labels may not be adequate to fully describe the spectrum of mental health problems in primary care. Evidence from studies of cancer patients suggests that application of psychiatric criteria for major depressive disorder outside a psychiatric population results in misclassification.28,29 Gallo and colleagues30 have used the Baltimore Epidemiologic Catchment Area Program sample to demonstrate that traditional criteria for classifying depression may not be adequate to identify elderly patients who are at risk. Data from the Michigan Depression Project indicate that primary care physicians appear to recognize an overlapping but different group of patients from those identified by mental health screening tools.31 Our work appears to lend additional evidence that psychiatric labels describe only part of a complex picture of mental health symptomatology.
Our explorations of mood and anxiety symptom severity through cluster analysis have yielded what we have termed a “classification.” However, we believe this classification is most likely representative of an underlying severity dimension that cuts across mood and anxiety symptom types. This concept is not new. Many treatment trials of depression in primary care have already used monitoring of severity with instruments such as the Hamilton Depression Rating Scale32 as outcome measures. What is new is mood and anxiety symptom severity as an independent predictor of HRQOL and utilization outcomes beyond presence of a psychiatric disorder. This suggests a unique and independent priority for symptom severity status.
Consensus is emerging that depression is a chronic illness with periods of exacerbation and recovery.33,34 Conceptualizing a symptom severity dimension as a predictor of HRQOL and utilization appears consistent with this idea. The presence of a mood or anxiety disorder may be similar to having asthma, with actual mood and anxiety symptom severity similar to peak flow status. Just as patients experiencing bronchospasm for any of a variety of reasons have decreased peak flow independent of an asthma diagnosis, it appears that primary care patients experience severe mood and anxiety symptoms for a variety of reasons independent of a psychiatric disorder diagnosis. Also for patients who have disorders, symptom severity may be a more important parameter to follow than DSM-III-R criteria that measure the “recovery from” or “relapse back into” a disorder.
Because our instrument did not include other symptom severity measures we were unable to compare it with others, such as the Hamilton Depression Rating Scale.31 However, questions exist about the ability of the Hamilton Scale to serve as a measure of depression severity.35 Beyond these concerns, a 15-item self report measure of severity appears to have advantages in a busy clinical setting.
Finally, given the apparent sensitivity of symptom severity for impairment and utilization differences, we postulate that our severity instrument could be useful in initially identifying patients at risk, as well as in monitoring previously identified patients. Existing instruments are not well accepted by primary care clinicians, perhaps because of high rates of false positives.36 We are currently testing whether such a use would be feasible. With intervention studies of treatment-resistant patients now being undertaken, use of a severity measure to identify patients for intervention could be very helpful. This work could proceed along the lines of stepped-care approaches for other disease entities, such as diabetes, asthma, or depression.
Conclusions
We agree with Klinkman and Okkes,37 who have called for more primary epidemiology within the area of mental health in primary care. Our work demonstrates that the relationship between symptom severity and the presence of a mood or anxiety disorder is very complex and worthy of further exploratory study. Indeed, the utilization implications here are profound because our classifications have the potential to identify patients who have high levels of health care utilization in a way other than by traditional diagnoses or medical comorbidity. Cluster analysis has provided a useful tool for examining new ways of understanding how mood and anxiety symptoms are present in the primary care setting. Further prospective work should continue to enlarge this understanding.
Acknowledgments
This project was supported in part by grants from the National Institute on Alcohol Abuse and Alcoholism (AA09496) and the Bureau of Health Professions, Health Resources and Services Administration (D32-PE16033 and D32-PE10158).
1. Kessler LG, Cleary PD, Burke JD. Psychiatric disorders in primary care. Arch Gen Psychiatry 1985;42:583-7.
2. Schulberg HC, Saul M, McClelland M, Ganguli M, Christy W, Frank R. Assessing depression in primary medical and psychiatric practices. Arch Gen Psychiatry 1985;42:1164-70.
3. Barrett JE, Barrett JA, Oxman TE, Gerber PD. The prevalence of psychiatric disorders in a primary care practice. Arch Gen Psychiatry 1988;45:1100-6.
4. Katon W, Schulberg HC. Epidemiology of depression in primary care. Gen Hosp Psychiatry 1992;14:237-47.
5. Coyne JC, Fechner-Bates S, Schwenk TL. Prevalence, nature, and comorbidity of depressive disorders in primary care. Gen Hosp Psychiatry 1994;16:267-76.
6. Spitzer RL, Williams JB, Kroenke K, et al. Utility of a new procedure for diagnosing mental disorders in primary care: the PRIME-MD 1000 study. JAMA 1994;272:1749-56.
7. Weissman MM, Olfson M, Leon AC, et al. Brief diagnostic interviews (SDDS-PC) for multiple mental disorders in primary care. A pilot study. Arch Fam Med 1995;4:220-7.
8. Broadhead WE, Blazer DG, George LK, et al. Depression, disability days, and days lost from work in a prospective epidemiologic survey. JAMA 1990;264:2524-8.
9. Wells K, Burnam M, Rogers W, Hays R, Camp P. The course of depression in adult outpatients: results from the medical outcomes study. Arch Gen Psychiatry 1992;49:788-94.
10. Von Korff M, Shapiro S, Burke JD, et al. Anxiety and depression in a primary care clinic. Comparison of diagnostic interview schedule, general health questionnaire, and practitioner assessments. Arch Gen Psychiatry 1987;44:152-6.
11. Gerber PD, Barrett J, Manheimer E, Whiting R, Smith R. Recognition of depression by internists in primary care: a comparison of internist and 'gold standard' psychiatric assessments. J Gen Intern Med 1989;4:7-13.
12. Coyne JC, Schwenk TL, Fechner-Bates S. Nondetection of depression by primary care physicians reconsidered. Gen Hosp Psychiatry 1995;17:3-12.
13. American Psychiatric Association. Task Force on DSM-IV. Diagnostic and statistical manual of mental disorders, 4th ed (DSM-IV). Washington, DC: American Psychiatric Association; 1994:xxvii, 886.
14. Weissman MM, Broadhead WE, Olfson M, et al. A diagnostic aid for detecting (DSM-IV) mental disorders in primary care. Gen Hosp Psychiatry 1998;20:1-11.
15. Broadhead WE, Leon AC, Weissman MM, et al. Development and validation of the SDDS-PC screen for multiple mental disorders in primary care. Arch Fam Med 1995;4:211-9.
16. Hirschfeld RM, Keller MB, Panico S, et al. The National Depressive and Manic-Depressive Association Consensus Statement on the Undertreatment of Depression. JAMA 1997;277:333-40.
17. Depression Guideline Panel. United States. Agency for Health Care Policy and Research. Depression in primary care. Rockville, Md: US Dept of Health and Human Services–Agency for Health Care Policy and Research; 1993.
18. Callahan CM, Hendrie HC, Dittus RS, Brater DC, Hui SL, Tierney WM. Improving treatment of late life depression in primary care: a randomized clinical trial. J Am Geriatr Soc 1994;42:839-46.
19. Dowrick C, Buchan I. Twelve month outcome of depression in general practice: does detection or disclosure make a difference? BMJ 1995;311:1274-6.
20. Reifler DR, Kessler HS, Bernhard EJ, Leon AC, Martin GJ. Impact of screening for mental health concerns on health service utilization and functional status in primary care patients. Arch Intern Med 1996;156:2593-9.
21. Lin EH, Simon GE, Katon WJ, et al. Can enhanced acute-phase treatment of depression improve long-term outcomes? A report of randomized trials in primary care. Am J Psychiatry 1999;156:643-5.
22. American Psychiatric Association, Work Group to Revise DSM-III. Diagnostic and statistical manual of mental disorders: Dsm-III-R. 3rd, rev. ed Washington, DC: American Psychiatric Association; 1987.
23. Nease DE, Volk RJ, Cass AR. Investigation of a severity-based classification of mood and anxiety symptoms in primary care patients. J Am Board Fam Pract 1999;12:21-31.
24. Volk R, Steinbauer J, Cantor C, Holzer C. The Alcohol Use Disorders Identification Test (AUDIT) as a screen for at-risk drinking in primary care patients of different racial/ethnic backgrounds. Addiction 1997;92:197-206.
25. Ware J, Kosinski M, Keller S. Physical and mental health summary scales: a user’s manual. Boston, Mass: The Health Institute, New England Medical Center; 1994.
26. Deyo R, Cherkin D, Ciol M. Adapting a clinical comorbidity index for use with ICD-9-CM administrative databases. J Clin Epidemiol 1992;45:613-9.
27. Charlson M, Pompei P, Ales K, MacKenzie C. A new method of classifying prognostic comorbidity in longitudinal studies: development and validation. J Chron Dis 1987;40:373-83.
28. Endicott J. Measurement of depression in patients with cancer. Cancer 1984;53:2243-9.
29. Kathol RG, Mutgi A, Williams J, Clamon G, Noyes R, Jr. Diagnosis of major depression in cancer patients according to four sets of criteria. Am J Psychiatry 1990;147:1021-4.
30. Gallo JJ, Rabins PV, Lyketsos CG, Tien AY, Anthony JC. Depression without sadness: functional outcomes of nondysphoric depression in later life. J Am Geriatr Soc 1997;45:570-8.
31. Klinkman MS, Coyne JC, Gallo S, Schwenk TL. False positives, false negatives, and the validity of the diagnosis of major depression in primary care. Arch Fam Med. 1998;7:451-61.
32. Hamilton M. Development of a rating scale for primary depressive illness. Br J Soc Clin Psychol. 1967;6:278-96.
33. Klinkman MS, Schwenk TL, Coyne JC. Depression in primary care—more like asthma than appendicitis: the Michigan Depression Project. Can J Psychiatry. 1997;42:966-73.
34. Judd LL, Akiskal HS, Maser JD, et al. A prospective 12-year study of subsyndromal and syndromal depressive symptoms in unipolar major depressive disorders. Arch Gen Psychiatry. 1998;55:694-700.
35. Gibbons RD, Clark DC, Kupfer DJ. Exactly what does the Hamilton Depression Rating Scale measure? J Psychiatr Res. 1993;27:259-73.
36. Valenstein M, Dalack G, Blow F, Figueroa S, Standiford C, Douglass A. Screening for psychiatric illness with a combined screening and diagnostic instrument. J Gen Intern Med. 1997;12:679-85.
37. Klinkman MS, Okkes I. Mental health problems in primary care. A research agenda. J Fam Pract. 1998;47:379-84.