User login
Using biomarkers to quantify problematic alcohol use
CASE A 34-year-old woman presents with fatigue. She appears defensive when asked about her alcohol use. She answers No to all questions on the CAGE (cut down, annoyed, guilty, eye-opener) screening tool, but acknowledges drinking excessively on rare occasions. Her physician has a high suspicion for alcohol use disorder (AUD) and recommends further testing. The patient agrees but denies having used alcohol over the past several days. Which of the following is most likely to help support the suspicion of a heavy drinking pattern?
- Routine lab tests (liver panel and complete blood count).
- Blood or urine alcohol level.
- Phosphatidylethanol (PEth) level in the blood.
- Ethyl glucuronide (EtG) in the urine.
- Carbohydrate-deficient transferrin (CDT) in the blood.
(See "Case answer.").
About 1 in 12 Americans have AUD,1 and 1 in 10 children live in a home with a parent who has a drinking problem.2 While the Diagnostic and Statistical Manual of Mental Disorders (DSM-5) succinctly defines AUD with specific criteria,1 the term generally refers to an inability to control or stop drinking despite adverse social or health consequences. AUD is regarded as > 4 drinks per day for men and > 3 drinks per day for women.3 A “standard drink” would be a 12-oz bottle of beer, a 5-oz glass of wine, or 1.5 oz of distilled spirits. Effects of chronic alcohol use are vast and include malnutrition, alcohol withdrawal syndrome, alcoholic liver disease, pancreatitis/pancreatic cancer, cardiomyopathy, and stroke.4-6 Alcohol use by a pregnant woman can lead to fetal alcohol syndrome in her child.7
AUD may be more prevalent in the wake of COVID-19. Primary care practitioners tend to miss a large fraction of patients with AUD in their practice, especially younger patients and those without somatic comorbidities.8 Systematic screening for AUD can identify many of these people.8 Particularly as the COVID-19 pandemic continues to unfold and increases stress for everyone, risk of worsening drinking increases both in individuals with current AUD and for those in remission.9 Contrary to common belief, patients visiting primary care favor screening for at-risk drinking.10 Thus, awareness of the prevalence of AUD and patient acceptance of screening should encourage wider testing.
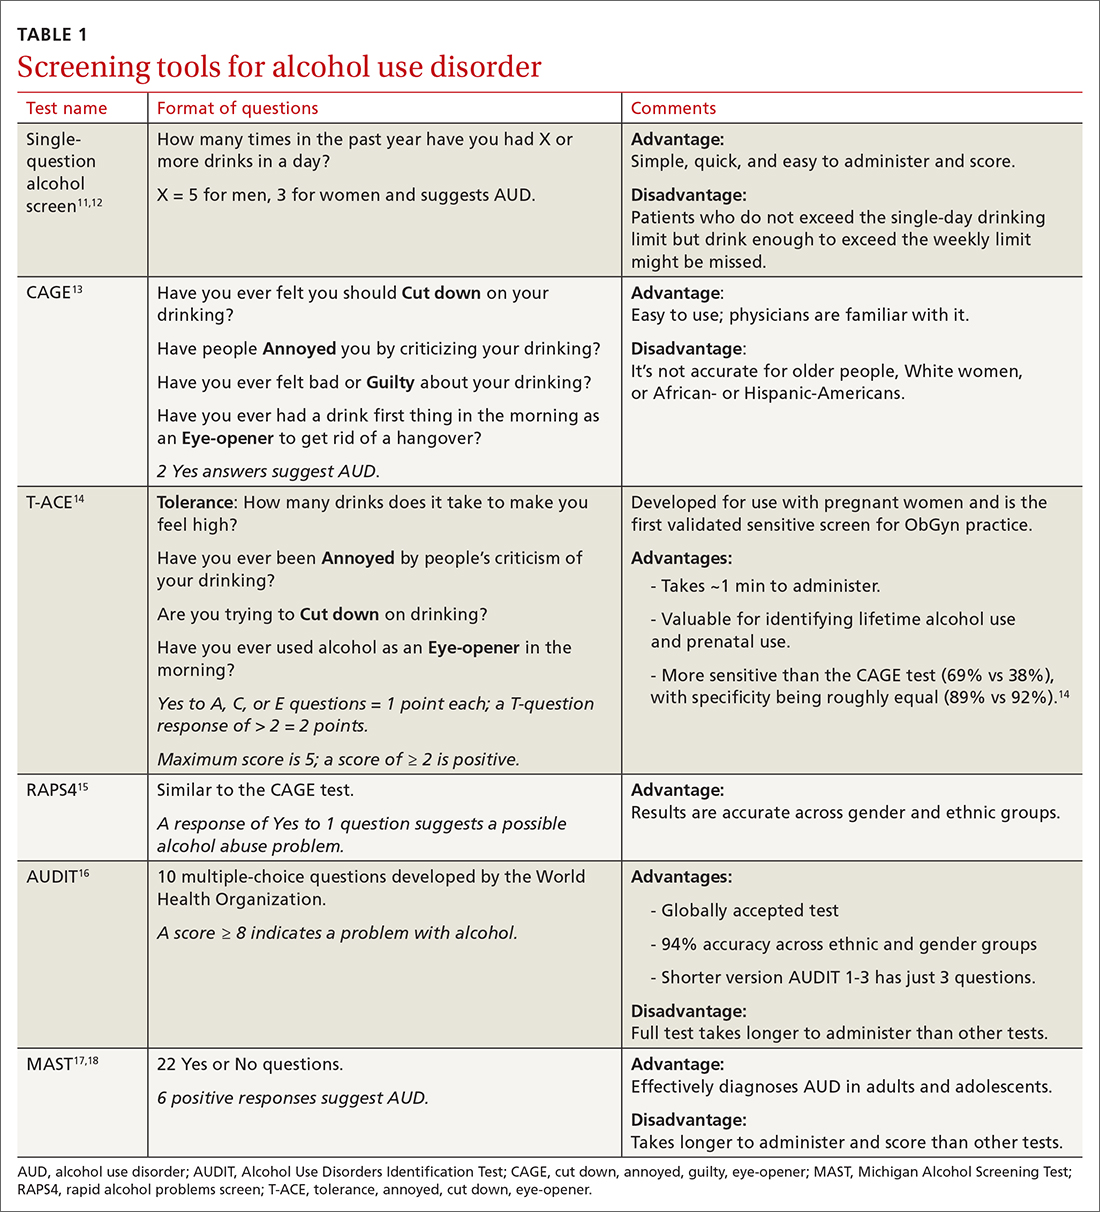
Screening tools. The 2014 guidelines published by the Centers for Disease Control and Prevention recommend using quick screening tools—ie, single question or AUDIT 1-3 (TABLE 111-18)—as an objective means of determining whether patients’ drinking creates a risk for themselves or others.11 Excessive drinking identified using alcohol questionnaires can help reduce medical complications and health care costs.19 The questionnaires we review do not provide a diagnosis but help identify individuals who might benefit from more thorough assessment.20 Following up, as needed, by testing for alcohol biomarkers can provide quantitative insight into problematic alcohol use.2
But before we discuss the utility of biomarkers, it’s important to quickly review how alcohol is eliminated from the body.
Alcohol elimination
The stomach and small intestine are the primary sites for alcohol absorption. Alcohol elimination from the body occurs through 3 pathways. The first involves oxidative metabolism, which eliminates most ethanol (95%) through the actions of alcohol dehydrogenase, cytochrome P4502E1, or catalase. A lesser amount of alcohol (2%-5%) is eliminated, unchanged, via the second pathway, which includes urine, sweat, and breath. Nonoxidative metabolism makes up the third pathway. Nonoxidative metabolism removes a very small amount (0.1%) of alcohol and involves the direct ethanol biomarkers PEth, EtG, ethyl sulfate (EtS), and fatty acid ethyl esters (FAEEs).21 Our emphasis in this article is on assays of direct metabolites of alcohol—particularly PEth.
Continue to: To understand the utility...
To understand the utility of these direct biomarkers, it is helpful to look at the indirect biomarkers first.
Indirect biomarkers have limited sensitivity and specificity
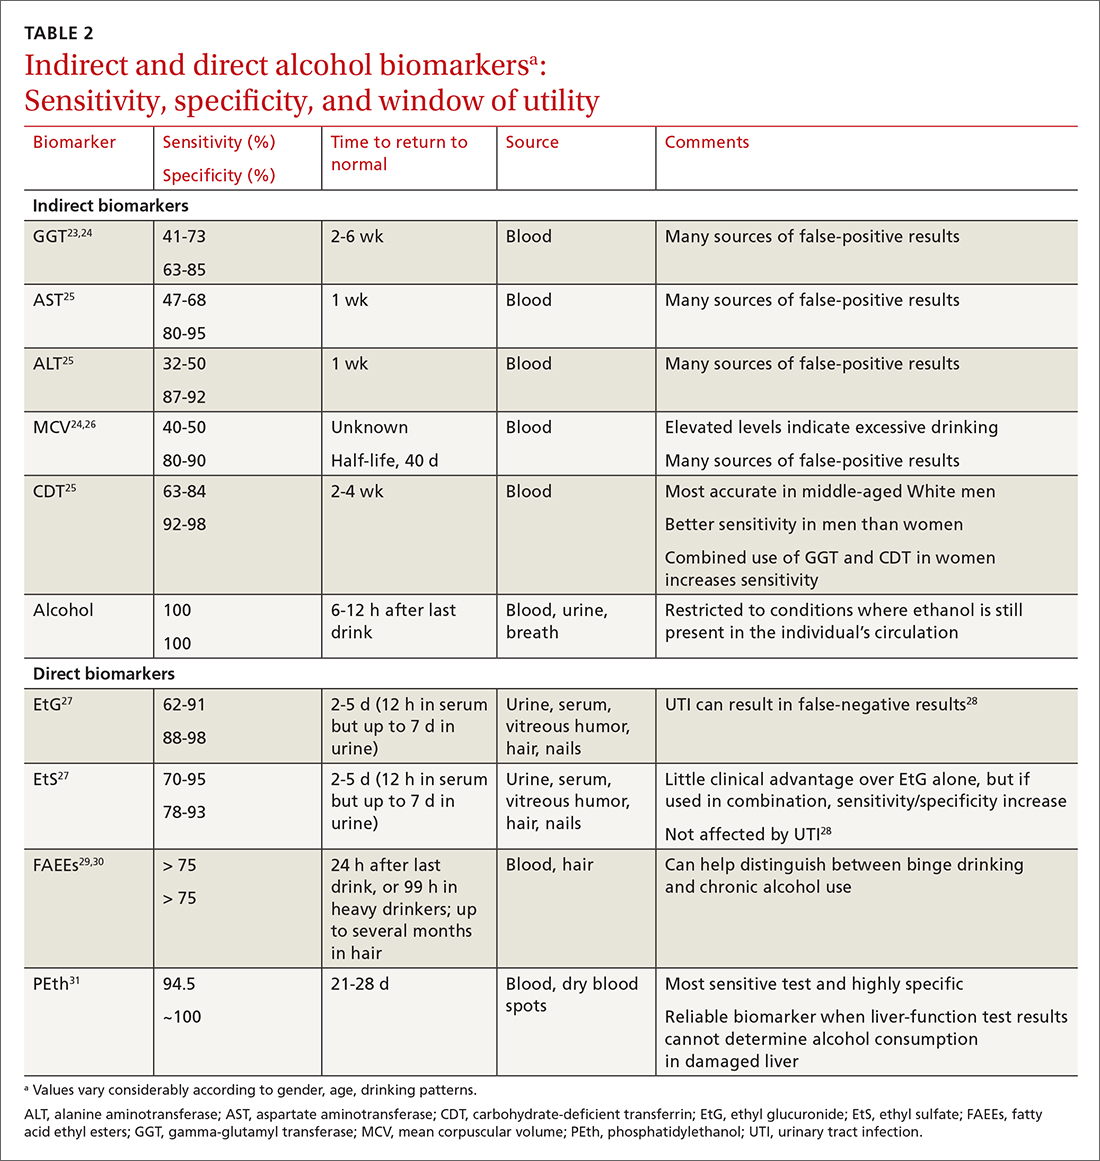
When alcohol is consumed in large enough quantities over time, indirect biomarkers of alcohol can become abnormal.22 The major indirect biomarkers are the liver enzymes aspartate and alanine aminotransferase (AST and ALT), gamma-glutamyl transferase (GGT), mean corpuscular volume (MCV) of red blood cells, and carbohydrate-deficient transferrin (CDT). Indirect biomarkers have limited sensitivity and specificity for AUD. (For specifics on sensitivity and specificity of indirect and direct biomarkers, see TABLE 2.23-31)
Liver enzymes. AST and ALT are also present in the heart, muscle, and kidneys. Elevated levels usually imply injury to hepatocytes, with ALT being more reflective of liver involvement than AST. Both AST and ALT are elevated in other common liver conditions including hepatitis C virus infection and fatty liver disease. In alcoholic liver disease (ALD), AST is elevated more than ALT; an AST-to-ALT ratio > 3 suggests ALD. An elevated GGT often indicates hepatic injury and is used to confirm that elevated alkaline phosphatase is of hepatic origin.3
MCV is the average volume of erythrocytes,33 and an elevated MCV is a potential indicator of excessive alcohol intake. Macrocytosis requires sustained alcohol use, and the test has low sensitivity. Other diseases such as vitamin B12 or folic acid deficiency, hypothyroidism, hematologic diseases (eg, cold agglutinin disease, multiple myeloma, amyloidosis), and certain medications can also increase MCV.34 Moreover, MCV responds slowly to alcohol use, abstinence, and relapse because red cells have a life span of 120 days.35
CDT. Transferrin is a glycoprotein produced in the liver. The level of transferrin with sialic acid chains increases with alcohol consumption as well as in the carbohydrate deficient glycoprotein syndrome, leading to so-called carbohydrate deficient transferrin.36 It is a sensitive marker for detecting alcohol relapse and monitoring sobriety. Moderate-to-heavy alcohol use, averaging ≥ 40 g of alcohol per day for 2 weeks,36 can decrease the amount of carbohydrate attached to transferrin. Two weeks after complete alcohol cessation, CDT levels will return to normal.37
Continue to: CDT is approved...
CDT is approved by the FDA as an assay for alcohol consumption.37 While CDT is felt to be one of the better indirect markers of AUD and can extend the window of detection, there are still issues with its sensitivity and specificity.38 This biomarker can be elevated with other liver diseases and can be affected by the patient’s age, body mass index, gender, and tobacco use.39,40 Testing for CDT has never achieved widespread clinical use and has been largely supplanted by the more accurate PEth test (described in a bit).
Direct biomarkers offer insight into recent alcohol use
Other than ethanol itself, direct biomarkers of alcohol use are minor ethanol metabolites created through biochemical reactions when ethanol is coupled to endogenous compounds. Hence, the presence of these metabolites is usually directly related to ethanol consumption.41 Direct alcohol biomarkers are EtG, EtS, FAEEs, and PEth (TABLE 223-31). They reflect alcohol consumption over a period of several days, making them useful when paired with questionnaire data, especially for identifying young adults who engage in binge drinking.42
Ethanol can be measured in blood, urine, and breath and is detectable a bit longer in urine than in blood. However, alcohol is detectable in the blood only for 6 to 12 hours after drinking. After alcohol consumption, concentrations peak in the blood within 2 hours. The window for detecting ethanol in the blood depends on the amount of alcohol consumed and the elimination rate of alcohol, which is about 12 mg/dL/h (or 0.012%)—approximately the same amount of alcohol contained in a standard drink (14 g).
Checking the blood alcohol level might be helpful in the office if a patient appears intoxicated but denies alcohol use. A blood alcohol level > 300 mg/dL, or > 150 mg/dL without gross evidence of intoxication, or > 100 mg/dL upon routine examination indicates AUD with a high degree of reliability.33,43 But the short half-life of ethanol in blood limits its use as a biomarker,33 and it is not a good indicator of chronic drinking.44
EtG and EtS. Less than 0.1% of ethanol is secreted as the metabolites EtG and EtS, which are generated, respectively, by the enzymes uridine diphosphate glucuronosyltransferase and sulfotransferase.45 They have value in the diagnosis of AUD because of the length of time in which they can be detected. Urinary EtG and EtS have been especially important biomarkers for monitoring relapse in outpatients treated for alcohol-related problems.46 Generally, EtG and EtS can be detected in urine for 13 to 20 hours after a single drink (0.1 g/kg), and for up to 4 to 5 days following ingestion of large amounts of alcohol.47
Continue to: EtG has been detectable...
EtG has been detectable in urine for ≥ 24 hours following only 1 or 2 drinks, and for up to 4 days following heavy consumption.48 Shortly after alcohol intake, even in small amounts, EtG is detectable. Analysis of EtG in urine is helpful in monitoring alcohol consumption during withdrawal treatment, for workplace testing, and to check for abstinence in legal matters. The EtG urine test is useful in detecting alcohol consumption in a person who claims to be abstinent but who drank 2 or 3 days before the evaluation. Although accurate, EtG’s window for detection is narrower than that of the PEth assay.
EtS is a good marker of acute short-term alcohol use, up to 12 hours in the blood (or longer in heavier drinkers) and up to 5 days in urine.49 Its sensitivity is highest in heavy drinkers. Post-sampling formation and degradation of EtS have not been known to occur in urine samples. Testing for this second metabolite of ethanol can slightly improve the sensitivity and specificity of the EtG test. A urine test for EtS has a wider detection window. But it has little practical advantage compared with EtG.50
For better clinical specificity, a combination of both EtG and EtS testing has been recommended. However, the EtS assay is more cumbersome and provides little advantage over EtG. EtG values do not correlate precisely with the amount or frequency of ethanol use, but the magnitude of the EtG finding roughly corresponds to the amount of alcohol recently consumed.
False-positive and false-negative results for EtG and EtS are uncommon in practice. However, false-positive results are possible with the EtG test in certain circumstances: presence of Escherichia coli in the specimen, use of ethanol-based hand sanitizers (> 20 times a day) or mouthwashes, and the consumption of substances like pralines, nonalcoholic beer, pharmaceutical products, and fruit juice. Similarly, false-negative results of EtG can occur from degradation if the samples are contaminated with other bacteria, transported without cooling, or stored improperly.51 In practice, this is uncommon, and the test is believed to be specific with few false-positive results. Commercially available EtG colorimetric test strips permit on-site analysis of urine samples.
FAEEs are a combination of different esters and products of alcohol metabolism through a nonoxidative pathway. They are formed by esterification of endogenous free fatty acids and ethanol in blood and several tissues.29 These are sensitive and specific markers of alcohol ingestion and can differentiate chronic alcohol consumption from binge drinking.29 It is elevated for up to 99 hours in heavy alcohol drinkers.30 It can be detected in hair for a longer period than in blood.52 Detection of FAEEs in meconium can help establish fetal alcohol exposure.53
Continue to: PEth
PEth. Use of the PEth assay has increased in recent years and its accuracy has had a transformative effect on the diagnosis of AUD.54 PEth is a phospholipid found in erythrocyte membranes, formed by an interaction between ethanol and phosphatidylcholine, catalyzed by phospholipase D.55,56 Major advantages of PEth include an unusually long half-life and specificity. Red cells lack enzymes to degrade PEth, therefore PEth accumulates in red cells and has a half-life of 4 to 10 days57,58 allowing for detection of significant ethanol consumption extending back 3 to 4 weeks.59 There is no evidence that PEth is formed in the absence of ethanol, making the test essentially 100% specific, particularly at higher cutoff values of ≥ 150 ng/mL.31,60
PEth levels are not affected by age, gender, or underlying liver or renal disease.61 PEth can differentiate between heavy alcohol use and social drinking and can therefore identify chronic excessive use.62 With chronic excessive alcohol consumption, PEth is detectable in blood up to 28 days after sobriety.63 A correlation exists between PEth concentrations in blood and the amount of consumed ethanol. PEth has increased specificity and sensitivity for the detection of latent ethanol use compared with other direct biomarkers.21 It can identify recent heavy drinking earlier than indirect biomarkers, as it does not rely on hepatic injury.
Using a cutoff level of 20 ng/mL, PEth assays have a sensitivity of 73% for any alcohol use in the past month; at 80 ng/mL, the sensitivity is 91% for > 4 drinks/d.61 PEth is considered semi-quantitative. The World Health Organization defines acceptable social alcohol use at a PEth value < 40 ng/dL for men and < 20 ng/dL for women. Chronic excessive use is defined by a level > 60 ng/dL.55 The cutoff levels tend to be arbitrary and vary with different guidelines.
Although false-positive PEth test results may be possible, most experts believe that dishonesty in self-reporting by test subjects is more likely. That said, the true specificity of PEth remains unknown; a lower value detected should not be regarded as absolute proof of relapse or chronic alcoholism.
Studies have shown a positive correlation between the AUDIT-C score and PEth values combined with self-reported alcohol consumption, indicating that PEth may be a useful marker in difficult-to-assess settings, or in confirming or invalidating self-reported alcohol consumption.61,64,65 The PEth test is now widely available and, in the authors’ experience, usually costs $100 to $200. Analysis typically costs $40 to $100,66 and costs could decrease as the test becomes more widely used. Turnaround time for PEth is 5 to 10 days. It is now the recommended assay by transplant hepatologists for detecting alcohol use.67
Continue to: CASE ANSWER
CASE
CORRESPONDENCE
Frederick Nunes, MD, Pennsylvania Hospital of University of Pennsylvania, 230 West Washington Square, 4th Floor, Philadelphia, PA 19104; frederick.nunes@pennmedicine.upenn.edu
1. APA. Diagnostic and Statistical Manual of Mental Disorders. 5th edition. American Psychiatric Publishing. 2013:490-497.
2. Fleming MF, Smith MJ, Oslakovic E, et al. Phosphatidylethanol detects moderate-to-heavy alcohol use in liver transplant recipients. Alcohol Clin Exp Res. 2017;41:857-862.
3. National Institute on Alcohol Abuse and Alcoholism. Drinking levels defined. Accessed November 12, 2021. www.niaaa.nih.gov/alcohol-health/overview-alcohol-consumption/moderate-binge-drinking
4. Herreros-Villanueva M, Hijona E, Bañales JM, et al. Alcohol consumption on pancreatic diseases. World J Gastroenterol. 2013;19:638-647.
5. Rocco A, Compare D, Angrisani D, et al. Alcoholic disease: liver and beyond. World J Gastroenterol. 2014;20:14652-14659.
6.
7. Sebastiani G, Borrás-Novell C, Casanova MA, et al. The effects of alcohol and drugs of abuse on maternal nutritional profile during pregnancy. Nutrients. 2018;10:1008.
8. Rehm J, Anderson P, Manthey J, et al. Alcohol use disorders in primary health care: what do we know and where do we go? Alcohol Alcohol. 2016;51:422-427. doi: 10.1093/alcalc/agv127
9. ASAM. Caring for patients during the COVID-19 pandemic. Accessed November 12, 2021. www.asam.org/docs/default-source/covid-19/acute-care_062620.pdf?sfvrsn=e66d54c2_10
10. Miller PM, Thomas SE, Mallin R. Patient attitudes towards self-report and biomarker alcohol screening by primary care physicians. Alcohol Alcohol. 2006;41:306-310. doi: 10.1093/alcalc/agl022
11. Zoorob R, Snell H, Kihlberg C, et al. Screening and brief intervention for risky alcohol use. Curr Probl Pediatr Adolesc Health Care. 2014;44:82-87.
12. Smith PC, Schmidt SM, Allensworth-Davies D, et al. Primary care validation of a single-question alcohol screening test. J Gen Intern Med. 2009;24:783-788.
13. Ewing JA. Detecting alcoholism. The CAGE questionnaire. JAMA. 1984;252:1905-1907.
14. Sokol RJ, Martier SS, Ager JW. The T-ACE questions: practical prenatal detection of risk-drinking. Am J Obstet Gynecol. 1989;160:863-868.
15. Cherpitel CJ. A brief screening instrument for problem drinking in the emergency room: the RAPS4. Rapid Alcohol Problems Screen. J Stud Alcohol. 2000;61:447-449.
16. WHO. AUDIT: The alcohol use identification test. Accessed November 14, 2021. http://apps.who.int/iris/bitstream/handle/10665/67205/WHO_MSD_MSB_01.6a.pdf?sequence=1
17. Westermeyer J, Yargic I, Thuras P. Michigan assessment-screening test for alcohol and drugs (MAST/AD): evaluation in a clinical sample. Am J Addict. 2004;13:151-162.
18. Powers JS, Spickard A. Michigan Alcoholism Screening Test to diagnose early alcoholism in a general practice. South Med J. 1984;77:852-856.
19. NIH. Treatment for alcohol problems: finding and getting help. Accessed November 12, 2021. www.niaaa.nih.gov/publications/brochures-and-fact-sheets/treatment-alcohol-problems-finding-and-getting-help
20. Kitchens JM. Does this patient have an alcohol problem? JAMA. 1994;272:1782-1787.
21. Kummer N, Lambert WE, Samyn N, et al. Alternative sampling strategies for the assessment of alcohol intake of living persons. Clin Biochem. 2016;49:1078-1091.
22. Ulwelling W, Smith K. The PEth blood test in the security environment: what it is; why it is important; and interpretative guidelines. J Forensic Sci. 2018;63:1634-1640.
23. Mundle G, Ackermann K, Munkes J, et al. Influence of age, alcohol consumption and abstinence on the sensitivity of carbohydrate‐deficient transferrin, gamma‐glutamyltransferase and mean corpuscular volume. Alcohol Alcohol. 1999;34:760-766.
24. Neumann T, Spies C. Use of biomarkers for alcohol use disorders in clinical practice. Addiction. 2003;98(suppl 2):81-91.
25. Torruellas C, French SW, Medici V. Diagnosis of alcoholic liver disease. World J Gastroenterol. 2014;20:11684-11699.
26. Helander A. Biological markers of alcohol use and abuse in theory and practice. In: Agarwal DP, Seitz HK, eds. Alcohol in Health and Disease. Marcel Dekker. 2001:177-205.
27. Stewart SH, Koch DG, Burgess DM, et al. Sensitivity and specificity of urinary ethyl glucuronide and ethyl sulfate in liver disease patients. Alcohol Clin Exp Res. 2013;37:150-155.
28. Helander A, Dahl H. Urinary tract infection: a risk factor for false-negative urinary ethyl glucuronide but not ethyl sulfate in the detection of recent alcohol consumption. Clin Chem. 2005;51:1728-1730.
29. Ghosh S, Jain R, Jhanjee S, et al. Alcohol biomarkers and their relevance in detection of alcohol consumption in clinical settings. Accessed November 12, 2021. https://www.clinmedjournals.org/articles/iasar/international-archives-of-substance-abuse-and-rehabilitation-iasar-1-002.php?jid=iasar
30. Borucki K, Dierkes J, Wartberg J, et al. In heavy drinkers, fatty acid ethyl esters remain elevated for up to 99 hours. Alcohol Clin Exp Res. 2007;31:423-427.
31. Hartmann S, Aradottir S, Graf M, et al. Phosphatidylethanol as a sensitive and specific biomarker: comparison with gamma-glutamyl transpeptidase, mean corpuscular volume and carbohydrate-deficient transferrin. Addict Biol. 2007;12:81-84.
32. Choe YM, Lee BC, Choi IG, et al. Combination of the CAGE and serum gamma-glutamyl transferase: an effective screening tool for alcohol use disorder and alcohol dependence. Neuropsychiatr Dis Treat. 2019 31;15:1507-1515.
33. Niemelä O. Biomarkers in alcoholism. Clin Chim Acta. 2007;377:39-49.
34. Kauffmann T, Evans DS. Macrocytosis. Accessed November 12, 2021. https://www.ncbi.nlm.nih.gov/books/NBK560908/
35. Maenhout TM, De Buyzere ML, Delanghe JR. Non-oxidative ethanol metabolites as a measure of alcohol intake. Clin Chim Acta. 2013;415:322-329.
36. Solomons HD. Carbohydrate deficient transferrin and alcoholism. Germs. 2012;2:75-78.
37. Allen JP, Wurst FM, Thon N, et al. Assessing the drinking status of liver transplant patients with alcoholic liver disease. Liver Transpl. 2013;19:369-376.
38. Bortolotti F, De Paoli G, Tagliaro F. Carbohydrate-deficient transferrin (CDT) as a marker of alcohol abuse: a critical review of the literature 2001-2005. J Chromatogr B Analyt Technol Biomed Life Sci. 2006;841:96-109.
39. Hannuksela ML, Liisanantti MK, Nissinen AE, et al. Biochemical markers of alcoholism. Clin Chem Lab Med. 2007;45:953-961.
40. Arndt T. Carbohydrate-deficient transferrin as a marker of chronic alcohol abuse: a critical review of preanalysis, analysis, and interpretation. Clin Chem. 2001;47:13-27.
41. Cabarcos P, Hassan HM, Tabernero MJ, et al. Analysis of ethyl glucuronide in hair samples by liquid chromatography-electrospray ionization-tandem mass spectrometry (LC-ESI-MS/MS). J Appl Toxicol. 2013;33:638-643.
42. Piano MR, Mazzuco A, Kang M, et al. Binge drinking episodes in young adults: how should we measure them in a research setting? J Stud Alcohol Drugs. 2017;78:502-511.
43. Adinoff B, Bone GH, Linnoila M. Acute ethanol poisoning and the ethanol withdrawal syndrome. Med Toxicol Adverse Drug Exp. 1988;3:172-196.
44. Cabezas J, Lucey MR, Bataller R. Biomarkers for monitoring alcohol use. Clin Liver Dis (Hoboken). 2016;8:59-63.
45. Wurst FM, Alling C, Aradottir S, et al. Emerging biomarkers: new directions and clinical applications. Alcohol Clin Exp Res. 2005;29:465-473.
46. Helander A, Péter O, Zheng Y. Monitoring of the alcohol biomarkers PEth, CDT and EtG/EtS in an outpatient treatment setting. Alcohol Alcohol. 2012;47:552-557.
47. Helander A, Böttcher M, Fehr C, et al. Detection times for urinary ethyl glucuronide and ethyl sulfate in heavy drinkers during alcohol detoxification. Alcohol Alcohol. 2009;44:55-61.
48. Jatlow P, O’Malley SS. Clinical (nonforensic) application of ethyl glucuronide measurement: are we ready? Alcohol Clin Exp Res. 2010;34:968-975.
49. Jatlow PI, Agro A, Wu R, et al. Ethyl glucuronide and ethyl sulfate assays in clinical trials, interpretation, and limitations: results of a dose ranging alcohol challenge study and 2 clinical trials. Alcohol Clin Exp Res. 2014;38:2056-2065.
50. Gonzalo P, Radenne S, Gonzalo S. Biomarkers of chronic alcohol misuse. Curr Biomark Find. 2014;4:9-22.
51. Bornhorst JA, Mbughuni MM. Alcohol biomarkers: clinical issues and analytical methods. In: Critical Issues in Alcohol and Drugs of Abuse Testing. 2nd ed. Academic Press. 2019:25-42.
52. Soderberg BL, Salem RO, Best CA, et al. Fatty acid ethyl esters. Ethanol metabolites that reflect ethanol intake. Am J Clin Pathol. 2003;119(suppl):S94-S99.
53. Cheng CT, Ostrea EM Jr, Alviedo JN, et al. Fatty acid ethyl esters in meconium: a biomarker of fetal alcohol exposure and effect. Exp Biol Med (Maywood). 2021;246:380-386.
54. Andresen-Streichert H, Beres Y, Weinmann W, et al. Improved detection of alcohol consumption using the novel marker phosphatidylethanol in the transplant setting: results of a prospective study. Transpl Int. 2017;30:611-620.
55. Viel G, Boscolo-Berto R, Cecchetto G, et al. Phosphatidylethanol in blood as a marker of chronic alcohol use: a systematic review and meta-analysis. Int J Mol Sci. 2012;13:14788-14812.
56. Gnann H, Weinmann W, Thierauf A. Formation of phosphatidylethanol and its subsequent elimination during an extensive drinking experiment over 5 days. Alcohol Clin Exp Res. 2012;36:1507-1511.
57. Aradóttir S, Moller K, Alling C. Phosphatidylethanol formation and degradation in human and rat blood. Alcohol Alcohol. 2004;39:8-13.
58. Varga A, Alling C. Formation of phosphatidylethanol in vitro in red blood cells from healthy volunteers and chronic alcoholics. J Lab Clin Med. 2002;140:79-83.
59. Javors MA, Hill-Kapturczak N, Roache JD, et al. Characterization of the pharmacokinetics of phosphatidylethanol 16:0/18:1 and 16:0/18:2 in human whole blood after alcohol consumption in a clinical laboratory study. Alcohol Clin Exp Res. 2016;40:1228-1234.
60. Schröck A, Pfäffli M, König S, et al. Application of phosphatidylethanol (PEth) in whole blood in comparison to ethyl glucuronide in hair (hEtG) in driving aptitude assessment (DAA). Int J Legal Med. 2016;130:1527-1533.
61. Stewart SH, Koch DG, Willner IR, et al. Validation of blood phosphatidylethanol as an alcohol consumption biomarker in patients with chronic liver disease. Alcohol Clin Exp Res. 2014;38:1706-1711.
62. Nanau RM, Neuman MG. Biomolecules and biomarkers used in diagnosis of alcohol drinking and in monitoring therapeutic interventions. Biomolecules. 2015 29;5:1339-1385.
63. Hill-Kapturczak N, Dougherty DM, Roache JD, et al. Phosphatidylethanol homologs in blood as biomarkers for the time frame and amount of recent alcohol consumption. In: Preedy VR (ed) Neuroscience of Alcohol. Academic Press; 2019:567-576.
64. Jain J, Evans JL, Briceño A, et al. Comparison of phosphatidylethanol results to self-reported alcohol consumption among young injection drug users. Alcohol Alcohol. 2014;49:520-524.
65. Schröck A, Wurst FM, Thon N, et al. Assessing phosphatidylethanol (PEth) levels reflecting different drinking habits in comparison to the alcohol use disorders identification test - C (AUDIT-C). Drug Alcohol Depend. 2017;178:80-86.
66. McDonnell MG, Skalisky J, Leickly E, et al. Pilot investigation of a phosphatidylethanol-based contingency management intervention targeting alcohol use. Psychol Addict Behav. 2017;31:608-613.
67. Asrani SK, Trotter J, Lake J, et al. Meeting Report: The Dallas Consensus Conference on Liver Transplantation for Alcohol Associated Hepatitis. Liver Transpl. 2020;26:127-140.
68. WHO. International Guide for Monitoring Alcohol Consumption and Harm. 2000. Accessed November 12, 2021. http://apps.who.int/iris/bitstream/handle/10665/66529/WHO_MSD_MSB_00.4.pdf?sequence=1
CASE A 34-year-old woman presents with fatigue. She appears defensive when asked about her alcohol use. She answers No to all questions on the CAGE (cut down, annoyed, guilty, eye-opener) screening tool, but acknowledges drinking excessively on rare occasions. Her physician has a high suspicion for alcohol use disorder (AUD) and recommends further testing. The patient agrees but denies having used alcohol over the past several days. Which of the following is most likely to help support the suspicion of a heavy drinking pattern?
- Routine lab tests (liver panel and complete blood count).
- Blood or urine alcohol level.
- Phosphatidylethanol (PEth) level in the blood.
- Ethyl glucuronide (EtG) in the urine.
- Carbohydrate-deficient transferrin (CDT) in the blood.
(See "Case answer.").
About 1 in 12 Americans have AUD,1 and 1 in 10 children live in a home with a parent who has a drinking problem.2 While the Diagnostic and Statistical Manual of Mental Disorders (DSM-5) succinctly defines AUD with specific criteria,1 the term generally refers to an inability to control or stop drinking despite adverse social or health consequences. AUD is regarded as > 4 drinks per day for men and > 3 drinks per day for women.3 A “standard drink” would be a 12-oz bottle of beer, a 5-oz glass of wine, or 1.5 oz of distilled spirits. Effects of chronic alcohol use are vast and include malnutrition, alcohol withdrawal syndrome, alcoholic liver disease, pancreatitis/pancreatic cancer, cardiomyopathy, and stroke.4-6 Alcohol use by a pregnant woman can lead to fetal alcohol syndrome in her child.7
AUD may be more prevalent in the wake of COVID-19. Primary care practitioners tend to miss a large fraction of patients with AUD in their practice, especially younger patients and those without somatic comorbidities.8 Systematic screening for AUD can identify many of these people.8 Particularly as the COVID-19 pandemic continues to unfold and increases stress for everyone, risk of worsening drinking increases both in individuals with current AUD and for those in remission.9 Contrary to common belief, patients visiting primary care favor screening for at-risk drinking.10 Thus, awareness of the prevalence of AUD and patient acceptance of screening should encourage wider testing.
Screening tools. The 2014 guidelines published by the Centers for Disease Control and Prevention recommend using quick screening tools—ie, single question or AUDIT 1-3 (TABLE 111-18)—as an objective means of determining whether patients’ drinking creates a risk for themselves or others.11 Excessive drinking identified using alcohol questionnaires can help reduce medical complications and health care costs.19 The questionnaires we review do not provide a diagnosis but help identify individuals who might benefit from more thorough assessment.20 Following up, as needed, by testing for alcohol biomarkers can provide quantitative insight into problematic alcohol use.2
But before we discuss the utility of biomarkers, it’s important to quickly review how alcohol is eliminated from the body.
Alcohol elimination
The stomach and small intestine are the primary sites for alcohol absorption. Alcohol elimination from the body occurs through 3 pathways. The first involves oxidative metabolism, which eliminates most ethanol (95%) through the actions of alcohol dehydrogenase, cytochrome P4502E1, or catalase. A lesser amount of alcohol (2%-5%) is eliminated, unchanged, via the second pathway, which includes urine, sweat, and breath. Nonoxidative metabolism makes up the third pathway. Nonoxidative metabolism removes a very small amount (0.1%) of alcohol and involves the direct ethanol biomarkers PEth, EtG, ethyl sulfate (EtS), and fatty acid ethyl esters (FAEEs).21 Our emphasis in this article is on assays of direct metabolites of alcohol—particularly PEth.
Continue to: To understand the utility...
To understand the utility of these direct biomarkers, it is helpful to look at the indirect biomarkers first.
Indirect biomarkers have limited sensitivity and specificity
When alcohol is consumed in large enough quantities over time, indirect biomarkers of alcohol can become abnormal.22 The major indirect biomarkers are the liver enzymes aspartate and alanine aminotransferase (AST and ALT), gamma-glutamyl transferase (GGT), mean corpuscular volume (MCV) of red blood cells, and carbohydrate-deficient transferrin (CDT). Indirect biomarkers have limited sensitivity and specificity for AUD. (For specifics on sensitivity and specificity of indirect and direct biomarkers, see TABLE 2.23-31)
Liver enzymes. AST and ALT are also present in the heart, muscle, and kidneys. Elevated levels usually imply injury to hepatocytes, with ALT being more reflective of liver involvement than AST. Both AST and ALT are elevated in other common liver conditions including hepatitis C virus infection and fatty liver disease. In alcoholic liver disease (ALD), AST is elevated more than ALT; an AST-to-ALT ratio > 3 suggests ALD. An elevated GGT often indicates hepatic injury and is used to confirm that elevated alkaline phosphatase is of hepatic origin.3
MCV is the average volume of erythrocytes,33 and an elevated MCV is a potential indicator of excessive alcohol intake. Macrocytosis requires sustained alcohol use, and the test has low sensitivity. Other diseases such as vitamin B12 or folic acid deficiency, hypothyroidism, hematologic diseases (eg, cold agglutinin disease, multiple myeloma, amyloidosis), and certain medications can also increase MCV.34 Moreover, MCV responds slowly to alcohol use, abstinence, and relapse because red cells have a life span of 120 days.35
CDT. Transferrin is a glycoprotein produced in the liver. The level of transferrin with sialic acid chains increases with alcohol consumption as well as in the carbohydrate deficient glycoprotein syndrome, leading to so-called carbohydrate deficient transferrin.36 It is a sensitive marker for detecting alcohol relapse and monitoring sobriety. Moderate-to-heavy alcohol use, averaging ≥ 40 g of alcohol per day for 2 weeks,36 can decrease the amount of carbohydrate attached to transferrin. Two weeks after complete alcohol cessation, CDT levels will return to normal.37
Continue to: CDT is approved...
CDT is approved by the FDA as an assay for alcohol consumption.37 While CDT is felt to be one of the better indirect markers of AUD and can extend the window of detection, there are still issues with its sensitivity and specificity.38 This biomarker can be elevated with other liver diseases and can be affected by the patient’s age, body mass index, gender, and tobacco use.39,40 Testing for CDT has never achieved widespread clinical use and has been largely supplanted by the more accurate PEth test (described in a bit).
Direct biomarkers offer insight into recent alcohol use
Other than ethanol itself, direct biomarkers of alcohol use are minor ethanol metabolites created through biochemical reactions when ethanol is coupled to endogenous compounds. Hence, the presence of these metabolites is usually directly related to ethanol consumption.41 Direct alcohol biomarkers are EtG, EtS, FAEEs, and PEth (TABLE 223-31). They reflect alcohol consumption over a period of several days, making them useful when paired with questionnaire data, especially for identifying young adults who engage in binge drinking.42
Ethanol can be measured in blood, urine, and breath and is detectable a bit longer in urine than in blood. However, alcohol is detectable in the blood only for 6 to 12 hours after drinking. After alcohol consumption, concentrations peak in the blood within 2 hours. The window for detecting ethanol in the blood depends on the amount of alcohol consumed and the elimination rate of alcohol, which is about 12 mg/dL/h (or 0.012%)—approximately the same amount of alcohol contained in a standard drink (14 g).
Checking the blood alcohol level might be helpful in the office if a patient appears intoxicated but denies alcohol use. A blood alcohol level > 300 mg/dL, or > 150 mg/dL without gross evidence of intoxication, or > 100 mg/dL upon routine examination indicates AUD with a high degree of reliability.33,43 But the short half-life of ethanol in blood limits its use as a biomarker,33 and it is not a good indicator of chronic drinking.44
EtG and EtS. Less than 0.1% of ethanol is secreted as the metabolites EtG and EtS, which are generated, respectively, by the enzymes uridine diphosphate glucuronosyltransferase and sulfotransferase.45 They have value in the diagnosis of AUD because of the length of time in which they can be detected. Urinary EtG and EtS have been especially important biomarkers for monitoring relapse in outpatients treated for alcohol-related problems.46 Generally, EtG and EtS can be detected in urine for 13 to 20 hours after a single drink (0.1 g/kg), and for up to 4 to 5 days following ingestion of large amounts of alcohol.47
Continue to: EtG has been detectable...
EtG has been detectable in urine for ≥ 24 hours following only 1 or 2 drinks, and for up to 4 days following heavy consumption.48 Shortly after alcohol intake, even in small amounts, EtG is detectable. Analysis of EtG in urine is helpful in monitoring alcohol consumption during withdrawal treatment, for workplace testing, and to check for abstinence in legal matters. The EtG urine test is useful in detecting alcohol consumption in a person who claims to be abstinent but who drank 2 or 3 days before the evaluation. Although accurate, EtG’s window for detection is narrower than that of the PEth assay.
EtS is a good marker of acute short-term alcohol use, up to 12 hours in the blood (or longer in heavier drinkers) and up to 5 days in urine.49 Its sensitivity is highest in heavy drinkers. Post-sampling formation and degradation of EtS have not been known to occur in urine samples. Testing for this second metabolite of ethanol can slightly improve the sensitivity and specificity of the EtG test. A urine test for EtS has a wider detection window. But it has little practical advantage compared with EtG.50
For better clinical specificity, a combination of both EtG and EtS testing has been recommended. However, the EtS assay is more cumbersome and provides little advantage over EtG. EtG values do not correlate precisely with the amount or frequency of ethanol use, but the magnitude of the EtG finding roughly corresponds to the amount of alcohol recently consumed.
False-positive and false-negative results for EtG and EtS are uncommon in practice. However, false-positive results are possible with the EtG test in certain circumstances: presence of Escherichia coli in the specimen, use of ethanol-based hand sanitizers (> 20 times a day) or mouthwashes, and the consumption of substances like pralines, nonalcoholic beer, pharmaceutical products, and fruit juice. Similarly, false-negative results of EtG can occur from degradation if the samples are contaminated with other bacteria, transported without cooling, or stored improperly.51 In practice, this is uncommon, and the test is believed to be specific with few false-positive results. Commercially available EtG colorimetric test strips permit on-site analysis of urine samples.
FAEEs are a combination of different esters and products of alcohol metabolism through a nonoxidative pathway. They are formed by esterification of endogenous free fatty acids and ethanol in blood and several tissues.29 These are sensitive and specific markers of alcohol ingestion and can differentiate chronic alcohol consumption from binge drinking.29 It is elevated for up to 99 hours in heavy alcohol drinkers.30 It can be detected in hair for a longer period than in blood.52 Detection of FAEEs in meconium can help establish fetal alcohol exposure.53
Continue to: PEth
PEth. Use of the PEth assay has increased in recent years and its accuracy has had a transformative effect on the diagnosis of AUD.54 PEth is a phospholipid found in erythrocyte membranes, formed by an interaction between ethanol and phosphatidylcholine, catalyzed by phospholipase D.55,56 Major advantages of PEth include an unusually long half-life and specificity. Red cells lack enzymes to degrade PEth, therefore PEth accumulates in red cells and has a half-life of 4 to 10 days57,58 allowing for detection of significant ethanol consumption extending back 3 to 4 weeks.59 There is no evidence that PEth is formed in the absence of ethanol, making the test essentially 100% specific, particularly at higher cutoff values of ≥ 150 ng/mL.31,60
PEth levels are not affected by age, gender, or underlying liver or renal disease.61 PEth can differentiate between heavy alcohol use and social drinking and can therefore identify chronic excessive use.62 With chronic excessive alcohol consumption, PEth is detectable in blood up to 28 days after sobriety.63 A correlation exists between PEth concentrations in blood and the amount of consumed ethanol. PEth has increased specificity and sensitivity for the detection of latent ethanol use compared with other direct biomarkers.21 It can identify recent heavy drinking earlier than indirect biomarkers, as it does not rely on hepatic injury.
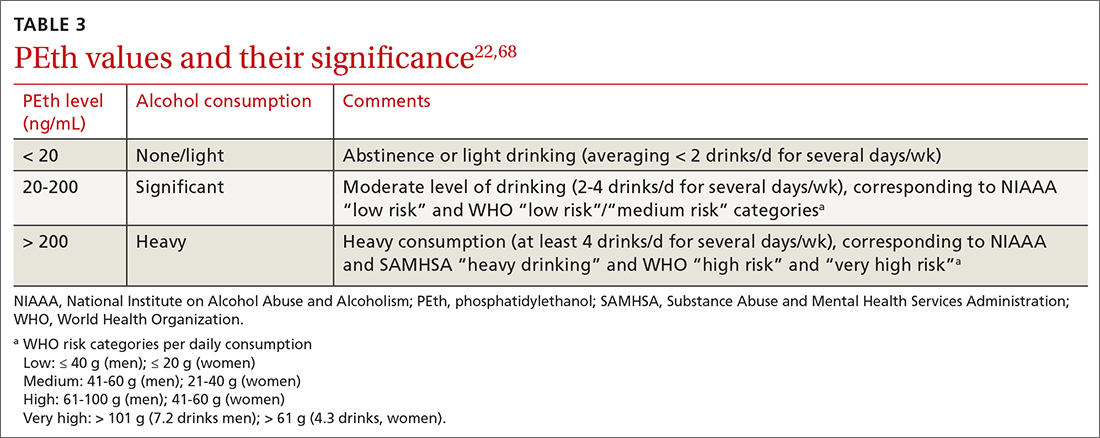
Using a cutoff level of 20 ng/mL, PEth assays have a sensitivity of 73% for any alcohol use in the past month; at 80 ng/mL, the sensitivity is 91% for > 4 drinks/d.61 PEth is considered semi-quantitative. The World Health Organization defines acceptable social alcohol use at a PEth value < 40 ng/dL for men and < 20 ng/dL for women. Chronic excessive use is defined by a level > 60 ng/dL.55 The cutoff levels tend to be arbitrary and vary with different guidelines.
Although false-positive PEth test results may be possible, most experts believe that dishonesty in self-reporting by test subjects is more likely. That said, the true specificity of PEth remains unknown; a lower value detected should not be regarded as absolute proof of relapse or chronic alcoholism.
Studies have shown a positive correlation between the AUDIT-C score and PEth values combined with self-reported alcohol consumption, indicating that PEth may be a useful marker in difficult-to-assess settings, or in confirming or invalidating self-reported alcohol consumption.61,64,65 The PEth test is now widely available and, in the authors’ experience, usually costs $100 to $200. Analysis typically costs $40 to $100,66 and costs could decrease as the test becomes more widely used. Turnaround time for PEth is 5 to 10 days. It is now the recommended assay by transplant hepatologists for detecting alcohol use.67
Continue to: CASE ANSWER
CASE
CORRESPONDENCE
Frederick Nunes, MD, Pennsylvania Hospital of University of Pennsylvania, 230 West Washington Square, 4th Floor, Philadelphia, PA 19104; frederick.nunes@pennmedicine.upenn.edu
CASE A 34-year-old woman presents with fatigue. She appears defensive when asked about her alcohol use. She answers No to all questions on the CAGE (cut down, annoyed, guilty, eye-opener) screening tool, but acknowledges drinking excessively on rare occasions. Her physician has a high suspicion for alcohol use disorder (AUD) and recommends further testing. The patient agrees but denies having used alcohol over the past several days. Which of the following is most likely to help support the suspicion of a heavy drinking pattern?
- Routine lab tests (liver panel and complete blood count).
- Blood or urine alcohol level.
- Phosphatidylethanol (PEth) level in the blood.
- Ethyl glucuronide (EtG) in the urine.
- Carbohydrate-deficient transferrin (CDT) in the blood.
(See "Case answer.").
About 1 in 12 Americans have AUD,1 and 1 in 10 children live in a home with a parent who has a drinking problem.2 While the Diagnostic and Statistical Manual of Mental Disorders (DSM-5) succinctly defines AUD with specific criteria,1 the term generally refers to an inability to control or stop drinking despite adverse social or health consequences. AUD is regarded as > 4 drinks per day for men and > 3 drinks per day for women.3 A “standard drink” would be a 12-oz bottle of beer, a 5-oz glass of wine, or 1.5 oz of distilled spirits. Effects of chronic alcohol use are vast and include malnutrition, alcohol withdrawal syndrome, alcoholic liver disease, pancreatitis/pancreatic cancer, cardiomyopathy, and stroke.4-6 Alcohol use by a pregnant woman can lead to fetal alcohol syndrome in her child.7
AUD may be more prevalent in the wake of COVID-19. Primary care practitioners tend to miss a large fraction of patients with AUD in their practice, especially younger patients and those without somatic comorbidities.8 Systematic screening for AUD can identify many of these people.8 Particularly as the COVID-19 pandemic continues to unfold and increases stress for everyone, risk of worsening drinking increases both in individuals with current AUD and for those in remission.9 Contrary to common belief, patients visiting primary care favor screening for at-risk drinking.10 Thus, awareness of the prevalence of AUD and patient acceptance of screening should encourage wider testing.
Screening tools. The 2014 guidelines published by the Centers for Disease Control and Prevention recommend using quick screening tools—ie, single question or AUDIT 1-3 (TABLE 111-18)—as an objective means of determining whether patients’ drinking creates a risk for themselves or others.11 Excessive drinking identified using alcohol questionnaires can help reduce medical complications and health care costs.19 The questionnaires we review do not provide a diagnosis but help identify individuals who might benefit from more thorough assessment.20 Following up, as needed, by testing for alcohol biomarkers can provide quantitative insight into problematic alcohol use.2
But before we discuss the utility of biomarkers, it’s important to quickly review how alcohol is eliminated from the body.
Alcohol elimination
The stomach and small intestine are the primary sites for alcohol absorption. Alcohol elimination from the body occurs through 3 pathways. The first involves oxidative metabolism, which eliminates most ethanol (95%) through the actions of alcohol dehydrogenase, cytochrome P4502E1, or catalase. A lesser amount of alcohol (2%-5%) is eliminated, unchanged, via the second pathway, which includes urine, sweat, and breath. Nonoxidative metabolism makes up the third pathway. Nonoxidative metabolism removes a very small amount (0.1%) of alcohol and involves the direct ethanol biomarkers PEth, EtG, ethyl sulfate (EtS), and fatty acid ethyl esters (FAEEs).21 Our emphasis in this article is on assays of direct metabolites of alcohol—particularly PEth.
Continue to: To understand the utility...
To understand the utility of these direct biomarkers, it is helpful to look at the indirect biomarkers first.
Indirect biomarkers have limited sensitivity and specificity
When alcohol is consumed in large enough quantities over time, indirect biomarkers of alcohol can become abnormal.22 The major indirect biomarkers are the liver enzymes aspartate and alanine aminotransferase (AST and ALT), gamma-glutamyl transferase (GGT), mean corpuscular volume (MCV) of red blood cells, and carbohydrate-deficient transferrin (CDT). Indirect biomarkers have limited sensitivity and specificity for AUD. (For specifics on sensitivity and specificity of indirect and direct biomarkers, see TABLE 2.23-31)
Liver enzymes. AST and ALT are also present in the heart, muscle, and kidneys. Elevated levels usually imply injury to hepatocytes, with ALT being more reflective of liver involvement than AST. Both AST and ALT are elevated in other common liver conditions including hepatitis C virus infection and fatty liver disease. In alcoholic liver disease (ALD), AST is elevated more than ALT; an AST-to-ALT ratio > 3 suggests ALD. An elevated GGT often indicates hepatic injury and is used to confirm that elevated alkaline phosphatase is of hepatic origin.3
MCV is the average volume of erythrocytes,33 and an elevated MCV is a potential indicator of excessive alcohol intake. Macrocytosis requires sustained alcohol use, and the test has low sensitivity. Other diseases such as vitamin B12 or folic acid deficiency, hypothyroidism, hematologic diseases (eg, cold agglutinin disease, multiple myeloma, amyloidosis), and certain medications can also increase MCV.34 Moreover, MCV responds slowly to alcohol use, abstinence, and relapse because red cells have a life span of 120 days.35
CDT. Transferrin is a glycoprotein produced in the liver. The level of transferrin with sialic acid chains increases with alcohol consumption as well as in the carbohydrate deficient glycoprotein syndrome, leading to so-called carbohydrate deficient transferrin.36 It is a sensitive marker for detecting alcohol relapse and monitoring sobriety. Moderate-to-heavy alcohol use, averaging ≥ 40 g of alcohol per day for 2 weeks,36 can decrease the amount of carbohydrate attached to transferrin. Two weeks after complete alcohol cessation, CDT levels will return to normal.37
Continue to: CDT is approved...
CDT is approved by the FDA as an assay for alcohol consumption.37 While CDT is felt to be one of the better indirect markers of AUD and can extend the window of detection, there are still issues with its sensitivity and specificity.38 This biomarker can be elevated with other liver diseases and can be affected by the patient’s age, body mass index, gender, and tobacco use.39,40 Testing for CDT has never achieved widespread clinical use and has been largely supplanted by the more accurate PEth test (described in a bit).
Direct biomarkers offer insight into recent alcohol use
Other than ethanol itself, direct biomarkers of alcohol use are minor ethanol metabolites created through biochemical reactions when ethanol is coupled to endogenous compounds. Hence, the presence of these metabolites is usually directly related to ethanol consumption.41 Direct alcohol biomarkers are EtG, EtS, FAEEs, and PEth (TABLE 223-31). They reflect alcohol consumption over a period of several days, making them useful when paired with questionnaire data, especially for identifying young adults who engage in binge drinking.42
Ethanol can be measured in blood, urine, and breath and is detectable a bit longer in urine than in blood. However, alcohol is detectable in the blood only for 6 to 12 hours after drinking. After alcohol consumption, concentrations peak in the blood within 2 hours. The window for detecting ethanol in the blood depends on the amount of alcohol consumed and the elimination rate of alcohol, which is about 12 mg/dL/h (or 0.012%)—approximately the same amount of alcohol contained in a standard drink (14 g).
Checking the blood alcohol level might be helpful in the office if a patient appears intoxicated but denies alcohol use. A blood alcohol level > 300 mg/dL, or > 150 mg/dL without gross evidence of intoxication, or > 100 mg/dL upon routine examination indicates AUD with a high degree of reliability.33,43 But the short half-life of ethanol in blood limits its use as a biomarker,33 and it is not a good indicator of chronic drinking.44
EtG and EtS. Less than 0.1% of ethanol is secreted as the metabolites EtG and EtS, which are generated, respectively, by the enzymes uridine diphosphate glucuronosyltransferase and sulfotransferase.45 They have value in the diagnosis of AUD because of the length of time in which they can be detected. Urinary EtG and EtS have been especially important biomarkers for monitoring relapse in outpatients treated for alcohol-related problems.46 Generally, EtG and EtS can be detected in urine for 13 to 20 hours after a single drink (0.1 g/kg), and for up to 4 to 5 days following ingestion of large amounts of alcohol.47
Continue to: EtG has been detectable...
EtG has been detectable in urine for ≥ 24 hours following only 1 or 2 drinks, and for up to 4 days following heavy consumption.48 Shortly after alcohol intake, even in small amounts, EtG is detectable. Analysis of EtG in urine is helpful in monitoring alcohol consumption during withdrawal treatment, for workplace testing, and to check for abstinence in legal matters. The EtG urine test is useful in detecting alcohol consumption in a person who claims to be abstinent but who drank 2 or 3 days before the evaluation. Although accurate, EtG’s window for detection is narrower than that of the PEth assay.
EtS is a good marker of acute short-term alcohol use, up to 12 hours in the blood (or longer in heavier drinkers) and up to 5 days in urine.49 Its sensitivity is highest in heavy drinkers. Post-sampling formation and degradation of EtS have not been known to occur in urine samples. Testing for this second metabolite of ethanol can slightly improve the sensitivity and specificity of the EtG test. A urine test for EtS has a wider detection window. But it has little practical advantage compared with EtG.50
For better clinical specificity, a combination of both EtG and EtS testing has been recommended. However, the EtS assay is more cumbersome and provides little advantage over EtG. EtG values do not correlate precisely with the amount or frequency of ethanol use, but the magnitude of the EtG finding roughly corresponds to the amount of alcohol recently consumed.
False-positive and false-negative results for EtG and EtS are uncommon in practice. However, false-positive results are possible with the EtG test in certain circumstances: presence of Escherichia coli in the specimen, use of ethanol-based hand sanitizers (> 20 times a day) or mouthwashes, and the consumption of substances like pralines, nonalcoholic beer, pharmaceutical products, and fruit juice. Similarly, false-negative results of EtG can occur from degradation if the samples are contaminated with other bacteria, transported without cooling, or stored improperly.51 In practice, this is uncommon, and the test is believed to be specific with few false-positive results. Commercially available EtG colorimetric test strips permit on-site analysis of urine samples.
FAEEs are a combination of different esters and products of alcohol metabolism through a nonoxidative pathway. They are formed by esterification of endogenous free fatty acids and ethanol in blood and several tissues.29 These are sensitive and specific markers of alcohol ingestion and can differentiate chronic alcohol consumption from binge drinking.29 It is elevated for up to 99 hours in heavy alcohol drinkers.30 It can be detected in hair for a longer period than in blood.52 Detection of FAEEs in meconium can help establish fetal alcohol exposure.53
Continue to: PEth
PEth. Use of the PEth assay has increased in recent years and its accuracy has had a transformative effect on the diagnosis of AUD.54 PEth is a phospholipid found in erythrocyte membranes, formed by an interaction between ethanol and phosphatidylcholine, catalyzed by phospholipase D.55,56 Major advantages of PEth include an unusually long half-life and specificity. Red cells lack enzymes to degrade PEth, therefore PEth accumulates in red cells and has a half-life of 4 to 10 days57,58 allowing for detection of significant ethanol consumption extending back 3 to 4 weeks.59 There is no evidence that PEth is formed in the absence of ethanol, making the test essentially 100% specific, particularly at higher cutoff values of ≥ 150 ng/mL.31,60
PEth levels are not affected by age, gender, or underlying liver or renal disease.61 PEth can differentiate between heavy alcohol use and social drinking and can therefore identify chronic excessive use.62 With chronic excessive alcohol consumption, PEth is detectable in blood up to 28 days after sobriety.63 A correlation exists between PEth concentrations in blood and the amount of consumed ethanol. PEth has increased specificity and sensitivity for the detection of latent ethanol use compared with other direct biomarkers.21 It can identify recent heavy drinking earlier than indirect biomarkers, as it does not rely on hepatic injury.
Using a cutoff level of 20 ng/mL, PEth assays have a sensitivity of 73% for any alcohol use in the past month; at 80 ng/mL, the sensitivity is 91% for > 4 drinks/d.61 PEth is considered semi-quantitative. The World Health Organization defines acceptable social alcohol use at a PEth value < 40 ng/dL for men and < 20 ng/dL for women. Chronic excessive use is defined by a level > 60 ng/dL.55 The cutoff levels tend to be arbitrary and vary with different guidelines.
Although false-positive PEth test results may be possible, most experts believe that dishonesty in self-reporting by test subjects is more likely. That said, the true specificity of PEth remains unknown; a lower value detected should not be regarded as absolute proof of relapse or chronic alcoholism.
Studies have shown a positive correlation between the AUDIT-C score and PEth values combined with self-reported alcohol consumption, indicating that PEth may be a useful marker in difficult-to-assess settings, or in confirming or invalidating self-reported alcohol consumption.61,64,65 The PEth test is now widely available and, in the authors’ experience, usually costs $100 to $200. Analysis typically costs $40 to $100,66 and costs could decrease as the test becomes more widely used. Turnaround time for PEth is 5 to 10 days. It is now the recommended assay by transplant hepatologists for detecting alcohol use.67
Continue to: CASE ANSWER
CASE
CORRESPONDENCE
Frederick Nunes, MD, Pennsylvania Hospital of University of Pennsylvania, 230 West Washington Square, 4th Floor, Philadelphia, PA 19104; frederick.nunes@pennmedicine.upenn.edu
1. APA. Diagnostic and Statistical Manual of Mental Disorders. 5th edition. American Psychiatric Publishing. 2013:490-497.
2. Fleming MF, Smith MJ, Oslakovic E, et al. Phosphatidylethanol detects moderate-to-heavy alcohol use in liver transplant recipients. Alcohol Clin Exp Res. 2017;41:857-862.
3. National Institute on Alcohol Abuse and Alcoholism. Drinking levels defined. Accessed November 12, 2021. www.niaaa.nih.gov/alcohol-health/overview-alcohol-consumption/moderate-binge-drinking
4. Herreros-Villanueva M, Hijona E, Bañales JM, et al. Alcohol consumption on pancreatic diseases. World J Gastroenterol. 2013;19:638-647.
5. Rocco A, Compare D, Angrisani D, et al. Alcoholic disease: liver and beyond. World J Gastroenterol. 2014;20:14652-14659.
6.
7. Sebastiani G, Borrás-Novell C, Casanova MA, et al. The effects of alcohol and drugs of abuse on maternal nutritional profile during pregnancy. Nutrients. 2018;10:1008.
8. Rehm J, Anderson P, Manthey J, et al. Alcohol use disorders in primary health care: what do we know and where do we go? Alcohol Alcohol. 2016;51:422-427. doi: 10.1093/alcalc/agv127
9. ASAM. Caring for patients during the COVID-19 pandemic. Accessed November 12, 2021. www.asam.org/docs/default-source/covid-19/acute-care_062620.pdf?sfvrsn=e66d54c2_10
10. Miller PM, Thomas SE, Mallin R. Patient attitudes towards self-report and biomarker alcohol screening by primary care physicians. Alcohol Alcohol. 2006;41:306-310. doi: 10.1093/alcalc/agl022
11. Zoorob R, Snell H, Kihlberg C, et al. Screening and brief intervention for risky alcohol use. Curr Probl Pediatr Adolesc Health Care. 2014;44:82-87.
12. Smith PC, Schmidt SM, Allensworth-Davies D, et al. Primary care validation of a single-question alcohol screening test. J Gen Intern Med. 2009;24:783-788.
13. Ewing JA. Detecting alcoholism. The CAGE questionnaire. JAMA. 1984;252:1905-1907.
14. Sokol RJ, Martier SS, Ager JW. The T-ACE questions: practical prenatal detection of risk-drinking. Am J Obstet Gynecol. 1989;160:863-868.
15. Cherpitel CJ. A brief screening instrument for problem drinking in the emergency room: the RAPS4. Rapid Alcohol Problems Screen. J Stud Alcohol. 2000;61:447-449.
16. WHO. AUDIT: The alcohol use identification test. Accessed November 14, 2021. http://apps.who.int/iris/bitstream/handle/10665/67205/WHO_MSD_MSB_01.6a.pdf?sequence=1
17. Westermeyer J, Yargic I, Thuras P. Michigan assessment-screening test for alcohol and drugs (MAST/AD): evaluation in a clinical sample. Am J Addict. 2004;13:151-162.
18. Powers JS, Spickard A. Michigan Alcoholism Screening Test to diagnose early alcoholism in a general practice. South Med J. 1984;77:852-856.
19. NIH. Treatment for alcohol problems: finding and getting help. Accessed November 12, 2021. www.niaaa.nih.gov/publications/brochures-and-fact-sheets/treatment-alcohol-problems-finding-and-getting-help
20. Kitchens JM. Does this patient have an alcohol problem? JAMA. 1994;272:1782-1787.
21. Kummer N, Lambert WE, Samyn N, et al. Alternative sampling strategies for the assessment of alcohol intake of living persons. Clin Biochem. 2016;49:1078-1091.
22. Ulwelling W, Smith K. The PEth blood test in the security environment: what it is; why it is important; and interpretative guidelines. J Forensic Sci. 2018;63:1634-1640.
23. Mundle G, Ackermann K, Munkes J, et al. Influence of age, alcohol consumption and abstinence on the sensitivity of carbohydrate‐deficient transferrin, gamma‐glutamyltransferase and mean corpuscular volume. Alcohol Alcohol. 1999;34:760-766.
24. Neumann T, Spies C. Use of biomarkers for alcohol use disorders in clinical practice. Addiction. 2003;98(suppl 2):81-91.
25. Torruellas C, French SW, Medici V. Diagnosis of alcoholic liver disease. World J Gastroenterol. 2014;20:11684-11699.
26. Helander A. Biological markers of alcohol use and abuse in theory and practice. In: Agarwal DP, Seitz HK, eds. Alcohol in Health and Disease. Marcel Dekker. 2001:177-205.
27. Stewart SH, Koch DG, Burgess DM, et al. Sensitivity and specificity of urinary ethyl glucuronide and ethyl sulfate in liver disease patients. Alcohol Clin Exp Res. 2013;37:150-155.
28. Helander A, Dahl H. Urinary tract infection: a risk factor for false-negative urinary ethyl glucuronide but not ethyl sulfate in the detection of recent alcohol consumption. Clin Chem. 2005;51:1728-1730.
29. Ghosh S, Jain R, Jhanjee S, et al. Alcohol biomarkers and their relevance in detection of alcohol consumption in clinical settings. Accessed November 12, 2021. https://www.clinmedjournals.org/articles/iasar/international-archives-of-substance-abuse-and-rehabilitation-iasar-1-002.php?jid=iasar
30. Borucki K, Dierkes J, Wartberg J, et al. In heavy drinkers, fatty acid ethyl esters remain elevated for up to 99 hours. Alcohol Clin Exp Res. 2007;31:423-427.
31. Hartmann S, Aradottir S, Graf M, et al. Phosphatidylethanol as a sensitive and specific biomarker: comparison with gamma-glutamyl transpeptidase, mean corpuscular volume and carbohydrate-deficient transferrin. Addict Biol. 2007;12:81-84.
32. Choe YM, Lee BC, Choi IG, et al. Combination of the CAGE and serum gamma-glutamyl transferase: an effective screening tool for alcohol use disorder and alcohol dependence. Neuropsychiatr Dis Treat. 2019 31;15:1507-1515.
33. Niemelä O. Biomarkers in alcoholism. Clin Chim Acta. 2007;377:39-49.
34. Kauffmann T, Evans DS. Macrocytosis. Accessed November 12, 2021. https://www.ncbi.nlm.nih.gov/books/NBK560908/
35. Maenhout TM, De Buyzere ML, Delanghe JR. Non-oxidative ethanol metabolites as a measure of alcohol intake. Clin Chim Acta. 2013;415:322-329.
36. Solomons HD. Carbohydrate deficient transferrin and alcoholism. Germs. 2012;2:75-78.
37. Allen JP, Wurst FM, Thon N, et al. Assessing the drinking status of liver transplant patients with alcoholic liver disease. Liver Transpl. 2013;19:369-376.
38. Bortolotti F, De Paoli G, Tagliaro F. Carbohydrate-deficient transferrin (CDT) as a marker of alcohol abuse: a critical review of the literature 2001-2005. J Chromatogr B Analyt Technol Biomed Life Sci. 2006;841:96-109.
39. Hannuksela ML, Liisanantti MK, Nissinen AE, et al. Biochemical markers of alcoholism. Clin Chem Lab Med. 2007;45:953-961.
40. Arndt T. Carbohydrate-deficient transferrin as a marker of chronic alcohol abuse: a critical review of preanalysis, analysis, and interpretation. Clin Chem. 2001;47:13-27.
41. Cabarcos P, Hassan HM, Tabernero MJ, et al. Analysis of ethyl glucuronide in hair samples by liquid chromatography-electrospray ionization-tandem mass spectrometry (LC-ESI-MS/MS). J Appl Toxicol. 2013;33:638-643.
42. Piano MR, Mazzuco A, Kang M, et al. Binge drinking episodes in young adults: how should we measure them in a research setting? J Stud Alcohol Drugs. 2017;78:502-511.
43. Adinoff B, Bone GH, Linnoila M. Acute ethanol poisoning and the ethanol withdrawal syndrome. Med Toxicol Adverse Drug Exp. 1988;3:172-196.
44. Cabezas J, Lucey MR, Bataller R. Biomarkers for monitoring alcohol use. Clin Liver Dis (Hoboken). 2016;8:59-63.
45. Wurst FM, Alling C, Aradottir S, et al. Emerging biomarkers: new directions and clinical applications. Alcohol Clin Exp Res. 2005;29:465-473.
46. Helander A, Péter O, Zheng Y. Monitoring of the alcohol biomarkers PEth, CDT and EtG/EtS in an outpatient treatment setting. Alcohol Alcohol. 2012;47:552-557.
47. Helander A, Böttcher M, Fehr C, et al. Detection times for urinary ethyl glucuronide and ethyl sulfate in heavy drinkers during alcohol detoxification. Alcohol Alcohol. 2009;44:55-61.
48. Jatlow P, O’Malley SS. Clinical (nonforensic) application of ethyl glucuronide measurement: are we ready? Alcohol Clin Exp Res. 2010;34:968-975.
49. Jatlow PI, Agro A, Wu R, et al. Ethyl glucuronide and ethyl sulfate assays in clinical trials, interpretation, and limitations: results of a dose ranging alcohol challenge study and 2 clinical trials. Alcohol Clin Exp Res. 2014;38:2056-2065.
50. Gonzalo P, Radenne S, Gonzalo S. Biomarkers of chronic alcohol misuse. Curr Biomark Find. 2014;4:9-22.
51. Bornhorst JA, Mbughuni MM. Alcohol biomarkers: clinical issues and analytical methods. In: Critical Issues in Alcohol and Drugs of Abuse Testing. 2nd ed. Academic Press. 2019:25-42.
52. Soderberg BL, Salem RO, Best CA, et al. Fatty acid ethyl esters. Ethanol metabolites that reflect ethanol intake. Am J Clin Pathol. 2003;119(suppl):S94-S99.
53. Cheng CT, Ostrea EM Jr, Alviedo JN, et al. Fatty acid ethyl esters in meconium: a biomarker of fetal alcohol exposure and effect. Exp Biol Med (Maywood). 2021;246:380-386.
54. Andresen-Streichert H, Beres Y, Weinmann W, et al. Improved detection of alcohol consumption using the novel marker phosphatidylethanol in the transplant setting: results of a prospective study. Transpl Int. 2017;30:611-620.
55. Viel G, Boscolo-Berto R, Cecchetto G, et al. Phosphatidylethanol in blood as a marker of chronic alcohol use: a systematic review and meta-analysis. Int J Mol Sci. 2012;13:14788-14812.
56. Gnann H, Weinmann W, Thierauf A. Formation of phosphatidylethanol and its subsequent elimination during an extensive drinking experiment over 5 days. Alcohol Clin Exp Res. 2012;36:1507-1511.
57. Aradóttir S, Moller K, Alling C. Phosphatidylethanol formation and degradation in human and rat blood. Alcohol Alcohol. 2004;39:8-13.
58. Varga A, Alling C. Formation of phosphatidylethanol in vitro in red blood cells from healthy volunteers and chronic alcoholics. J Lab Clin Med. 2002;140:79-83.
59. Javors MA, Hill-Kapturczak N, Roache JD, et al. Characterization of the pharmacokinetics of phosphatidylethanol 16:0/18:1 and 16:0/18:2 in human whole blood after alcohol consumption in a clinical laboratory study. Alcohol Clin Exp Res. 2016;40:1228-1234.
60. Schröck A, Pfäffli M, König S, et al. Application of phosphatidylethanol (PEth) in whole blood in comparison to ethyl glucuronide in hair (hEtG) in driving aptitude assessment (DAA). Int J Legal Med. 2016;130:1527-1533.
61. Stewart SH, Koch DG, Willner IR, et al. Validation of blood phosphatidylethanol as an alcohol consumption biomarker in patients with chronic liver disease. Alcohol Clin Exp Res. 2014;38:1706-1711.
62. Nanau RM, Neuman MG. Biomolecules and biomarkers used in diagnosis of alcohol drinking and in monitoring therapeutic interventions. Biomolecules. 2015 29;5:1339-1385.
63. Hill-Kapturczak N, Dougherty DM, Roache JD, et al. Phosphatidylethanol homologs in blood as biomarkers for the time frame and amount of recent alcohol consumption. In: Preedy VR (ed) Neuroscience of Alcohol. Academic Press; 2019:567-576.
64. Jain J, Evans JL, Briceño A, et al. Comparison of phosphatidylethanol results to self-reported alcohol consumption among young injection drug users. Alcohol Alcohol. 2014;49:520-524.
65. Schröck A, Wurst FM, Thon N, et al. Assessing phosphatidylethanol (PEth) levels reflecting different drinking habits in comparison to the alcohol use disorders identification test - C (AUDIT-C). Drug Alcohol Depend. 2017;178:80-86.
66. McDonnell MG, Skalisky J, Leickly E, et al. Pilot investigation of a phosphatidylethanol-based contingency management intervention targeting alcohol use. Psychol Addict Behav. 2017;31:608-613.
67. Asrani SK, Trotter J, Lake J, et al. Meeting Report: The Dallas Consensus Conference on Liver Transplantation for Alcohol Associated Hepatitis. Liver Transpl. 2020;26:127-140.
68. WHO. International Guide for Monitoring Alcohol Consumption and Harm. 2000. Accessed November 12, 2021. http://apps.who.int/iris/bitstream/handle/10665/66529/WHO_MSD_MSB_00.4.pdf?sequence=1
PRACTICE RECOMMENDATIONS
› Use a quick screening instrument such as the single-question tool or the AUDIT 1-3 to objectively determine whether patients’ drinking is risky for themselves or for others. C
› Suspect alcoholic liver disease if the ratio of aspartate aminotransferase to alanine aminotransferase is > 3. C
› Consider using the PEth assay in high-risk patients to differentiate between heavy alcohol use and social drinking. C
Strength of recommendation (SOR)
A Good-quality patient-oriented evidence
B Inconsistent or limited-quality patient-oriented evidence
C Consensus, usual practice, opinion, disease-oriented evidence, case series
To avoid Hep B reactivation, screen before immunosuppression
CASE A 53-year-old woman you are seeing for the first time has been taking 10 mg of prednisone daily for a month, prescribed by another practitioner for polymyalgia rheumatica. Testing is negative for hepatitis B surface antigen but is positive for hepatitis B core antibody total, indicating a resolved hepatitis B infection. The absence of hepatitis B DNA is confirmed.
How would you proceed with this patient?
Patients with resolved hepatitis B virus (HBV) or chronic hepatitis B (CHB) infections are at risk for HBV reactivation (HBVr) if they undergo immunosuppressive therapy for a condition such as cancer. HBVr can in turn lead to delays in treatment and increased morbidity and mortality.
HBVr is a well-documented adverse outcome in patients treated with rituximab and in those undergoing stem cell transplantation. Current oncology guidelines recommend screening for HBV prior to initiating these treatments.1,2 More recent evidence shows that many other immunosuppressive therapies can also lead to HBVr.3 Such treatments are now used across a multitude of specialties and conditions. For many of these conditions, there are no consistent guidelines regarding HBV screening.
In 2013, the US Food and Drug Administration (FDA) announced the requirement of a Boxed Warning for the immunosuppressive drugs ofatumumab and rituximab. In 2016, the FDA announced the same requirement for certain direct-acting antiviral medicines for hepatitis C virus.
Among patients who are positive for hepatitis-B surface antigen (HBsAg) and who are treated with immunosuppression, the frequency of HBVr has ranged from 0% to 39%.4,5
As the list of immunosuppressive therapies that can cause HBVr grows, specialty guidelines are evolving to address the risk that HBVr poses.
Continue to: An underrecognized problem
An underrecognized problem. CHB affects an estimated 350 million people worldwide6 but remains underrecognized and underdiagnosed. An estimated 1.4 million Americans6 have CHB, but only a minority of them are aware of their positive status and are followed by a hepatologist or receive medical care for their disease.7 Compared with the natural-born US population, a higher prevalence of CHB exists among immigrants to this country from the Asian Pacific and Eastern Mediterranean regions, sub-Saharan Africa, and certain parts of South America.8-10 In 2008, the Centers for Disease Control and Prevention (CDC) updated its recommendations on screening for HBV to include immigrants to the United States from intermediate and high endemic areas.6 Unfortunately, data published on physicians’ adherence to the CDC guidelines for screening show that only 60% correctly screened at-risk patients.11
Individuals with CHB are at risk and rely on a robust immune system to keep their disease from becoming active. During infection, the virus gains entry into the hepatocytes and the double-stranded viral genome is imported into the nucleus of the cell, where it is repaired into covalently closed circular DNA (cccDNA). Research has demonstrated the stability of cccDNA and its persistence as a latent reservoir for HBV reactivation, even decades after recovery from infection.12
Also at risk are individuals who have unrecovered from HBV infection and are HBsAg negative and anti-HBc positive. To avert reverse seroconversion, they also rely on a robust immune system.13 Reverse seroconversion is defined as a reappearance of HBV DNA and HBsAg positivity in individuals who were previously negative.13 In these individuals, HBV DNA may not be quantifiable in circulation, but trace amounts of viral DNA found in the liver are enough to pose a reactivation risk in the setting of immune suppression.14
Moreover, often overlooked is the fact that reactivation or reverse seroconversion can necessitate disruptions and delays in immunosuppressive treatment for other life-threatening disease processes.14,15
Universal screening reduces risk for HBVr. Patients with CHB are at risk for reactivation, as are patients with resolved HBV infection. Many patients, however, do not know their status. By screening all patients before beginning immunosuppressive therapy, physicians can provide effective prophylaxis, which has been shown to significantly reduce the risk for HBVr.8.15
Continue to: Recognizing the onset of HBVr
Recognizing the onset of HBVr
In patients with CHB, HBVr is defined as at least a 3-fold increase in aspart aminotransferase (AST) and alanine aminotransferase (ALT) and at least a 10-fold increase from baseline in HBV DNA. In patients with resolved HBV infection, there may be reverse seroconversion from HbsAg-negative to HBsAg-positive status (TABLE 113,16).

Not all elevations in AST/ALT in patients undergoing chemotherapy or immunosuppressive therapy indicate HBVr. Very often, derangements in AST/ALT may be related to the toxic effects of therapy or to the underlying disease process. However, as immunosuppressive therapy is now used for a wide array of medical conditions, consider HBVr as a potential cause of abnormal liver function in all patients receiving such therapy
A patient is at risk for HBVr when starting immunosuppression and up to a year following the completion of therapy. With suppression of the immune system, HBV replication increases and serum AST/ALT concentrations may rise. HBVr may also present with the appearance of HBV DNA in patients with previously undetectable levels.12,17
Most patients remain asymptomatic, and abnormal AST/ALT levels eventually resolve after completion of immunosuppression. However, some patients' liver enzymes may rise, indicating a more severe hepatic flare. These patients may present with right upper-quadrant tenderness, jaundice, or fatigue. In these cases, recognizing HBVr and starting antivirals may reduce hepatitis flare.
Unfortunately, despite early recognition of HBVr and initiation of appropriate therapy, some patients can progress to hepatic decompensation and even fulminant hepatic failure that may have been prevented with prophylaxis.
Continue to: The justification for universal screening
The justification for universal screening
Although nongastroenterology societies differ in their recommendations on screening for HBV, universal screening before implementing prolonged immunosuppressive treatment is recommended by the CDC,6 the American Association for the Study of Liver Diseases,18 the Asian Pacific Association for the Study of the Liver,19 the European Association for the Study of the Liver,20 and the American Gastroenterological Association (AGA).21
Older guidelines recommended screening only high-risk populations. But such screening has downfalls. It requires that patients or their physicians recognize that they are at high risk. In one study, nearly 65% of an infected Asian-American population was unaware of their positive HBV status.22 Risk-based screening also requires that physicians ask the appropriate questions and that patients admit to high-risk behavior. Screening patients based only on risk factors may easily overlook patients who need prophylaxis against HBVr.
Common arguments against universal screening include the cost of testing, the possibility of false-positive results, and the implications of a new diagnosis of hepatitis B. However, the potential benefits of screening are significant, and HBV screening in the general population has been shown to be cost effective when the prevalence of HBV is 0.3%.21 In the United States, conservative estimates are a prevalence of HBsAg positivity of 0.4% and past infection of 3%, making screening a cost-effective recommendation.16 It is therefore prudent to screen all patients before starting immunosuppressive therapy.
How to screen
All guidelines agree on how to test for HBV. Measuring levels of HBsAg and hepatitis B core antibody (anti-HBc total) allows the clinician to ascertain whether the patient’s HBV infection status is acute, chronic, or resolved (TABLE 223) and to perform HBVr risk stratification (discussed later).

Patients with acute infections should be referred to a hepatologist. With chronic or resolved HBV, stratify patients into a prophylaxis group or monitoring group (FIGURE14). Stratification involves identifying HBV status (chronic or resolved) and selecting a type of immunosuppressive therapy. Whether the patient falls into prophylaxis or monitoring, obtain a baseline level of viral DNA, as this has proven to be the best predictor of HBV reactivation.16

Continue to: In screening, be sure the appropriate...
In screening, be sure the appropriate anti-HBc testing is covered. Common usage of the term anti-HBc may refer to immunoglobulin G (IgG) or immunoglobulin M (IgM)or total core antibody, containing both IgG and IgM. But in this context, accurate screening requires either total core antibody or anti-HBc IgG. Anti-IgM alone is inadequate. Many commercial laboratories offer acute hepatitis panels or hepatitis profiles (TABLE 324,25), and it is important to confirm that such order sets contain the tests necessary to allow for risk stratification.

Testing for hepatitis B surface antibody (anti-HBs) is not useful in screening. Although it was hypothesized that the presence of this antibody lowered risk, recent studies have proven no change in risk based on this value.21
How to assess HBVr risk
Assessing risk for HBVr takes into account both the patient’s serology and intended treatment. Reddy et al delineated patient groups into high, moderate, and low risk (TABLES 4 and 5).21 The high-risk group was defined by anticipated incidence of HBVr in > 10% of cases; the moderate-risk group had an anticipated incidence of 1% to 10%; and the low-risk group had an anticipated incidence of <1%.21 Evidence was strongest in the high-risk group.

Patients with CHB (HBsAg positive and anti-HBc positive) are considered high risk for reactivation with a wide variety of immunosuppressive therapies. Such patients are 5 to 8 times more likely to develop HBVr than patients with an HBsAg-negative status signifying a resolved infection.16

Immunosuppressive agents and associated risks. The AGA guidelines consider treatment with B-cell-depleting agents, such as rituximab and ofatumumab, to be high risk, regardless of a patient’s surface antigen status. Additionally, for patients who are HBsAg positive, high-risk treatments include anthracycline derivatives, such as doxorubicin and epirubicin, or high- or moderate-dose steroids. These treatments are considered moderate risk when used in patients who have resolved HBV infection (HBsAg negative/anti-HBc positive). Moderate-risk modalities also include tumor necrosis factor inhibitors and tyrosine kinase inhibitors, regardless of surface antigen status; and low-dose steroids or cytokine or integrin inhibitors in HbsAg-positive individuals.21
Continue to: Other immunosuppression modalities...
Other immunosuppression modalities considered to be moderate risk independent of HBV serology include proteasome inhibitors, such as bortezomib, used for multiple myeloma treatment, and histone deacetylase inhibitors, such as romidepsin, used to treat T-cell lymphoma.13 Low-dose steroids or cytokine or integrin inhibitors are considered to be low risk in surface antigen-negative individuals; azathioprine, mercaptopurine, or methotrexate are low risk regardless of HBsAg status.21 Intra-articular steroid injections are considered extremely low risk in HbsAg-positive individuals, and are unclassified for HbsAg-negative individuals.13
More recent evidence has implicated other medication classes in triggering HBVr — (eg, direct-acting antivirals.)26
Prophylaxis options: High to moderate risk vs low risk
The consensus of major guideline issuers is to offer prophylaxis to high-risk patients and to monitor low-risk patients. The AGA additionally recommends prophylaxis for patients at moderate risk.
Controversy surrounding the moderate-risk group. Some authors argue that monitoring HBV DNA in the moderate-risk group is preferable to committing patients to long periods of prophylaxis, and that rescue treatment could be initiated as needed. However, the ideal monitoring period has not been determined, and the effectiveness of prophylaxis over monitoring is so significant that monitoring is losing favor.
Perrillo et al performed a meta-analysis of 5 randomized controlled trials evaluating antiviral agents vs no prophylaxis.16 The analysis included 139 patients receiving prophylaxis and 137 controls. The pooled results demonstrated an 87% relative risk reduction with prophylaxis, supporting the trend toward treating patients with moderate risk.16
Continue to: Prophylactic treatment options are safe...
Prophylactic treatment options are safe and well tolerated. For this reason, committing a high- or moderate-risk patient to a course of treatment should be less of a concern than the risk for HBVr.
In the early randomized controlled trials for HBVr prophylaxis, lamivudine, although effective, unfortunately led to a high incidence of viral resistance after prolonged use, thus diminishing its desirability.18 Newer agents, such as entecavir and tenofovir, have proven just as effective as lamivudine and are largely unaffected by viral resistance.27
In retrospective and prospective studies on HBVr prophylaxis, patients treated with entecavir had less HBV-related hepatitis, less delay in chemotherapy, and a lower rate of HBVr when compared with lamivudine.28,29 Tenofovir is recommended, however, if patients were previously treated with lamivudine.30
A recent meta-analysis demonstrated that tenofovir and entecavir are preferable to lamivudine in preventing HBVr.31
Looking ahead
Screening for HBsAg and anti-HBc total before starting immunosuppressive therapy can reduce morbidity and mortality in patients undergoing such treatment. The AGA recommends screening all patients about to begin high- or moderate-risk therapy or patients in populations with a prevalence of CHB ≥2%, per the CDC.6,21
Continue to: Classes of medications...
Classes of medications other than immunosuppressants may also trigger HBVr. The FDA has issued a warning regarding direct-acting antivirals, but optimal management of these patients is still evolving.
Once HBV status is established, a patient’s risk for HBVr can be specified as high, moderate, or low using their HBV status and the type of therapy being initiated. The AGA recommends prophylactic treatment with well-tolerated and effective agents for patients classified as high or moderate risk. If a patient’s risk is low, regular monitoring of HBV DNA and AST and ALT levels is sufficient. Recommendations of monitoring intervals span from monthly to every 3 months.13,14
CASE Given the patient’s status of resolved HBV infection and her current moderate-dose regimen of prednisone, her risk for HBV reactivation is moderate. She could either receive antiviral prophylaxis or undergo regular monitoring. Following a discussion of the options, she opts for referral to a hepatologist to discuss possible prophylactic treatment.
Increased awareness of HBVr risk associated with immunosuppressive therapy, coupled with a planned approach to appropriate screening and risk stratification, can help health care providers prevent the reactivation of HBV or initiate early intervention for CHB.
CORRESPONDENCE
Ronan Farrell, MD, Rhode Island Hospital, 593 Eddy Street, Providence, RI 02903; ronan_farrell@brown.edu.
1. Artz AS, Somerfield MR, Feld JJ, et al. American Society of Clinical Oncology provisional clinical opinion: chronic hepatitis B virus infection screening in patients receiving cytotoxic chemotherapy for treatment of malignant diseases. J Clin Oncol. 2010;28:3199-3202.
2. Day FL, Link E, Thursky K, et al. Current hepatitis B screening practices and clinical experience of reactivation in patients undergoing chemotherapy for solid tumors: a nationwide survey of medical oncologists. J Oncol Pract. 2011;7:141-147.
3. Paul S, Saxena A, Terrin N, et al. Hepatitis B virus reactivation and prophylaxis during solid tumor chemotherapy: a systematic review and meta-analysis. Ann Internal Med. 2016;164:30-40.
4. Kim MK, Ahn JH, Kim SB, et al. Hepatitis B reactivation during adjuvant anthracycline-based chemotherapy in patients with breast cancer: a single institution’s experience. Korean J Intern Med. 2007;22:237-243.
5. Esteve M, Saro C, González-Huix F, et al. Chronic hepatitis B reactivation following infliximab therapy in Crohn’s disease patients: need for primary prophylaxis. Gut. 2004;53:1363-1365.
6. Weinbaum CM, Williams I, Mast EE, et al. Recommendations for identification and public health management of persons with chronic hepatitis B virus infection. MMWR Recomm Rep. 2008;57:1-20.
7. Liang TJ, Block TM, McMahon BJ, et al. Present and future therapies of hepatitis B: from discovery to cure. Hepatology. 2015;62:1893-1908.
8, , , A mathematical model to estimate global hepatitis B disease burden and vaccination impact. Int J Epidemiol. 2005;34:1329-1339.
9. WHO. Hepatitis B. www.who.int/en/news-room/fact-sheets/detail/hepatitis-b. Accessed February 28, 2019.
10. Kowdley KV, Wang CC, Welch S, et al. Prevalence of chronic hepatitis B among foreign-born persons living in the United States by country of origin. Hepatology. 2012;56:422-433.
11. Foster T, Hon H, Kanwal F, et al. Screening high risk individuals for hepatitis B: physician knowledge, attitudes, and beliefs. Dig Dis Sci. 2011;56:3471-3487.
12. Rehermann B, Ferrari C, Pasquinelli C, et al. The hepatitis B virus persists for decades after patients’ recovery from acute viral hepatitis despite active maintenance of a cytotoxic T-lymphocyte response. Nat Med. 1996;2:1104-1108.
13. Loomba R, Liang TJ. Hepatitis B reactivation associated with immune suppressive and biological modifier therapies: current concepts, management strategies, and future directions. Gastroenterology. 2017;152:1297-1309.
14. Di Bisceglie AM, Lok AS, Martin P, et al. Recent US Food and Drug Administration warnings on hepatitis B reactivation with immune-suppressing and anticancer drugs: just the tip of the iceberg? Hepatology. 2015;61:703-711.
15. Lok AS, Ward JW, Perrillo RP, et al. Reactivation of hepatitis B during immunosuppressive therapy: potentially fatal yet preventable. Ann Intern Med. 2012;156:743-745.
16. Perrillo RP, Gish R, Falck-Ytter YT. American Gastroenterological Association Institute technical review on prevention and treatment of hepatitis B virus reactivation during immunosuppressive drug therapy. Gastroenterology. 2015;148:221-244.
17. Hwang JP, Lok AS. Management of patients with hepatitis B who require immunosuppressive therapy. Nat Rev Gastroenterol Hepatol. 2014;11:209-219.
18. Lok AS, McMahon BJ. Chronic hepatitis B: update 2009. Hepatology. 2009;50:661-662.
19. Asian-Pacific consensus statement on the management of chronic hepatitis B: a 2012 update. Hepatol Int. 2012;6:531-561.
20. EASL clinical practice guidelines: management of chronic hepatitis B virus infection. J Hepatol. 2012;57:167-185.
21. Reddy KR, Beavers KL, Hammond SP, et al. American Gastroenterological Association Institute guideline on the prevention and treatment of hepatitis B virus reactivation during immunosuppressive drug therapy. Gastroenterology. 2015;148:215-219.
, , . Why we should routinely screen Asian American adults for hepatitis B: a cross-sectional study of Asians in California. Hepatology. 2007;46:1034-1040.
23. Hwang JP, Artz AS, Somerfield MR. Hepatitis B virus screening for patients with cancer before therapy: American Society of Clinical Oncology Provisional Clinical Opinion Update. J Oncol Pract. 2015;11:e487-489.
24. LabCorp. Hepatitis B core antibody, IgG, IgM, differentiation. www.labcorp.com/test-menu/27196/hepatitis-b-core-antibody-igg-igm-differentiation. Accessed February 28, 2019.
25. Quest diagnostics. Hepatitis B Core Antibody, Total. www.questdiagnostics.com/testcenter/TestDetail.action?ntc=501.Accessed November 5, 2018.
26. The Food and Drug Administration Adverse Event Reporting System (FAERS). www.fda.gov/Drugs/DrugSafety/ucm522932.htm. Accessed February 28, 2019.
27. Lim YS. Management of antiviral resistance in chronic hepatitis B. Gut Liver. 2017;11:189-195.
28. Huang H, Li X, Zhu J, et al. Entecavir vs lamivudine for prevention of hepatitis B virus reactivation among patients with untreated diffuse large B-cell lymphoma receiving R-CHOP chemotherapy: a randomized clinical trial. JAMA. 2014;312:2521-2530.
29. Chen WC, Cheng JS, Chiang PH, et al. A comparison of entecavir and lamivudine for the prophylaxis of hepatitis B virus reactivation in solid tumor patients undergoing systemic cytotoxic chemotherapy. PLoS One. 2015;10:e0131545.
30. Tenney DJ, Rose RE, Baldick CJ, et al. Long-term monitoring shows hepatitis B virus resistance to entecavir in nucleoside-naïve patients is rare through 5 years of therapy. Hepatology. 2009;49:1503-1514.
31. Zhang MY, Zhu GQ, Shi KQ, et al. Systematic review with network meta-analysis: comparative efficacy of oral nucleos(t)ide analogues for the prevention of chemotherapy-induced hepatitis B virus reactivation. Oncotarget. 2016;7:30642-30658.
CASE A 53-year-old woman you are seeing for the first time has been taking 10 mg of prednisone daily for a month, prescribed by another practitioner for polymyalgia rheumatica. Testing is negative for hepatitis B surface antigen but is positive for hepatitis B core antibody total, indicating a resolved hepatitis B infection. The absence of hepatitis B DNA is confirmed.
How would you proceed with this patient?
Patients with resolved hepatitis B virus (HBV) or chronic hepatitis B (CHB) infections are at risk for HBV reactivation (HBVr) if they undergo immunosuppressive therapy for a condition such as cancer. HBVr can in turn lead to delays in treatment and increased morbidity and mortality.
HBVr is a well-documented adverse outcome in patients treated with rituximab and in those undergoing stem cell transplantation. Current oncology guidelines recommend screening for HBV prior to initiating these treatments.1,2 More recent evidence shows that many other immunosuppressive therapies can also lead to HBVr.3 Such treatments are now used across a multitude of specialties and conditions. For many of these conditions, there are no consistent guidelines regarding HBV screening.
In 2013, the US Food and Drug Administration (FDA) announced the requirement of a Boxed Warning for the immunosuppressive drugs ofatumumab and rituximab. In 2016, the FDA announced the same requirement for certain direct-acting antiviral medicines for hepatitis C virus.
Among patients who are positive for hepatitis-B surface antigen (HBsAg) and who are treated with immunosuppression, the frequency of HBVr has ranged from 0% to 39%.4,5
As the list of immunosuppressive therapies that can cause HBVr grows, specialty guidelines are evolving to address the risk that HBVr poses.
Continue to: An underrecognized problem
An underrecognized problem. CHB affects an estimated 350 million people worldwide6 but remains underrecognized and underdiagnosed. An estimated 1.4 million Americans6 have CHB, but only a minority of them are aware of their positive status and are followed by a hepatologist or receive medical care for their disease.7 Compared with the natural-born US population, a higher prevalence of CHB exists among immigrants to this country from the Asian Pacific and Eastern Mediterranean regions, sub-Saharan Africa, and certain parts of South America.8-10 In 2008, the Centers for Disease Control and Prevention (CDC) updated its recommendations on screening for HBV to include immigrants to the United States from intermediate and high endemic areas.6 Unfortunately, data published on physicians’ adherence to the CDC guidelines for screening show that only 60% correctly screened at-risk patients.11
Individuals with CHB are at risk and rely on a robust immune system to keep their disease from becoming active. During infection, the virus gains entry into the hepatocytes and the double-stranded viral genome is imported into the nucleus of the cell, where it is repaired into covalently closed circular DNA (cccDNA). Research has demonstrated the stability of cccDNA and its persistence as a latent reservoir for HBV reactivation, even decades after recovery from infection.12
Also at risk are individuals who have unrecovered from HBV infection and are HBsAg negative and anti-HBc positive. To avert reverse seroconversion, they also rely on a robust immune system.13 Reverse seroconversion is defined as a reappearance of HBV DNA and HBsAg positivity in individuals who were previously negative.13 In these individuals, HBV DNA may not be quantifiable in circulation, but trace amounts of viral DNA found in the liver are enough to pose a reactivation risk in the setting of immune suppression.14
Moreover, often overlooked is the fact that reactivation or reverse seroconversion can necessitate disruptions and delays in immunosuppressive treatment for other life-threatening disease processes.14,15
Universal screening reduces risk for HBVr. Patients with CHB are at risk for reactivation, as are patients with resolved HBV infection. Many patients, however, do not know their status. By screening all patients before beginning immunosuppressive therapy, physicians can provide effective prophylaxis, which has been shown to significantly reduce the risk for HBVr.8.15
Continue to: Recognizing the onset of HBVr
Recognizing the onset of HBVr
In patients with CHB, HBVr is defined as at least a 3-fold increase in aspart aminotransferase (AST) and alanine aminotransferase (ALT) and at least a 10-fold increase from baseline in HBV DNA. In patients with resolved HBV infection, there may be reverse seroconversion from HbsAg-negative to HBsAg-positive status (TABLE 113,16).
Not all elevations in AST/ALT in patients undergoing chemotherapy or immunosuppressive therapy indicate HBVr. Very often, derangements in AST/ALT may be related to the toxic effects of therapy or to the underlying disease process. However, as immunosuppressive therapy is now used for a wide array of medical conditions, consider HBVr as a potential cause of abnormal liver function in all patients receiving such therapy
A patient is at risk for HBVr when starting immunosuppression and up to a year following the completion of therapy. With suppression of the immune system, HBV replication increases and serum AST/ALT concentrations may rise. HBVr may also present with the appearance of HBV DNA in patients with previously undetectable levels.12,17
Most patients remain asymptomatic, and abnormal AST/ALT levels eventually resolve after completion of immunosuppression. However, some patients' liver enzymes may rise, indicating a more severe hepatic flare. These patients may present with right upper-quadrant tenderness, jaundice, or fatigue. In these cases, recognizing HBVr and starting antivirals may reduce hepatitis flare.
Unfortunately, despite early recognition of HBVr and initiation of appropriate therapy, some patients can progress to hepatic decompensation and even fulminant hepatic failure that may have been prevented with prophylaxis.
Continue to: The justification for universal screening
The justification for universal screening
Although nongastroenterology societies differ in their recommendations on screening for HBV, universal screening before implementing prolonged immunosuppressive treatment is recommended by the CDC,6 the American Association for the Study of Liver Diseases,18 the Asian Pacific Association for the Study of the Liver,19 the European Association for the Study of the Liver,20 and the American Gastroenterological Association (AGA).21
Older guidelines recommended screening only high-risk populations. But such screening has downfalls. It requires that patients or their physicians recognize that they are at high risk. In one study, nearly 65% of an infected Asian-American population was unaware of their positive HBV status.22 Risk-based screening also requires that physicians ask the appropriate questions and that patients admit to high-risk behavior. Screening patients based only on risk factors may easily overlook patients who need prophylaxis against HBVr.
Common arguments against universal screening include the cost of testing, the possibility of false-positive results, and the implications of a new diagnosis of hepatitis B. However, the potential benefits of screening are significant, and HBV screening in the general population has been shown to be cost effective when the prevalence of HBV is 0.3%.21 In the United States, conservative estimates are a prevalence of HBsAg positivity of 0.4% and past infection of 3%, making screening a cost-effective recommendation.16 It is therefore prudent to screen all patients before starting immunosuppressive therapy.
How to screen
All guidelines agree on how to test for HBV. Measuring levels of HBsAg and hepatitis B core antibody (anti-HBc total) allows the clinician to ascertain whether the patient’s HBV infection status is acute, chronic, or resolved (TABLE 223) and to perform HBVr risk stratification (discussed later).
Patients with acute infections should be referred to a hepatologist. With chronic or resolved HBV, stratify patients into a prophylaxis group or monitoring group (FIGURE14). Stratification involves identifying HBV status (chronic or resolved) and selecting a type of immunosuppressive therapy. Whether the patient falls into prophylaxis or monitoring, obtain a baseline level of viral DNA, as this has proven to be the best predictor of HBV reactivation.16
Continue to: In screening, be sure the appropriate...
In screening, be sure the appropriate anti-HBc testing is covered. Common usage of the term anti-HBc may refer to immunoglobulin G (IgG) or immunoglobulin M (IgM)or total core antibody, containing both IgG and IgM. But in this context, accurate screening requires either total core antibody or anti-HBc IgG. Anti-IgM alone is inadequate. Many commercial laboratories offer acute hepatitis panels or hepatitis profiles (TABLE 324,25), and it is important to confirm that such order sets contain the tests necessary to allow for risk stratification.
Testing for hepatitis B surface antibody (anti-HBs) is not useful in screening. Although it was hypothesized that the presence of this antibody lowered risk, recent studies have proven no change in risk based on this value.21
How to assess HBVr risk
Assessing risk for HBVr takes into account both the patient’s serology and intended treatment. Reddy et al delineated patient groups into high, moderate, and low risk (TABLES 4 and 5).21 The high-risk group was defined by anticipated incidence of HBVr in > 10% of cases; the moderate-risk group had an anticipated incidence of 1% to 10%; and the low-risk group had an anticipated incidence of <1%.21 Evidence was strongest in the high-risk group.
Patients with CHB (HBsAg positive and anti-HBc positive) are considered high risk for reactivation with a wide variety of immunosuppressive therapies. Such patients are 5 to 8 times more likely to develop HBVr than patients with an HBsAg-negative status signifying a resolved infection.16
Immunosuppressive agents and associated risks. The AGA guidelines consider treatment with B-cell-depleting agents, such as rituximab and ofatumumab, to be high risk, regardless of a patient’s surface antigen status. Additionally, for patients who are HBsAg positive, high-risk treatments include anthracycline derivatives, such as doxorubicin and epirubicin, or high- or moderate-dose steroids. These treatments are considered moderate risk when used in patients who have resolved HBV infection (HBsAg negative/anti-HBc positive). Moderate-risk modalities also include tumor necrosis factor inhibitors and tyrosine kinase inhibitors, regardless of surface antigen status; and low-dose steroids or cytokine or integrin inhibitors in HbsAg-positive individuals.21
Continue to: Other immunosuppression modalities...
Other immunosuppression modalities considered to be moderate risk independent of HBV serology include proteasome inhibitors, such as bortezomib, used for multiple myeloma treatment, and histone deacetylase inhibitors, such as romidepsin, used to treat T-cell lymphoma.13 Low-dose steroids or cytokine or integrin inhibitors are considered to be low risk in surface antigen-negative individuals; azathioprine, mercaptopurine, or methotrexate are low risk regardless of HBsAg status.21 Intra-articular steroid injections are considered extremely low risk in HbsAg-positive individuals, and are unclassified for HbsAg-negative individuals.13
More recent evidence has implicated other medication classes in triggering HBVr — (eg, direct-acting antivirals.)26
Prophylaxis options: High to moderate risk vs low risk
The consensus of major guideline issuers is to offer prophylaxis to high-risk patients and to monitor low-risk patients. The AGA additionally recommends prophylaxis for patients at moderate risk.
Controversy surrounding the moderate-risk group. Some authors argue that monitoring HBV DNA in the moderate-risk group is preferable to committing patients to long periods of prophylaxis, and that rescue treatment could be initiated as needed. However, the ideal monitoring period has not been determined, and the effectiveness of prophylaxis over monitoring is so significant that monitoring is losing favor.
Perrillo et al performed a meta-analysis of 5 randomized controlled trials evaluating antiviral agents vs no prophylaxis.16 The analysis included 139 patients receiving prophylaxis and 137 controls. The pooled results demonstrated an 87% relative risk reduction with prophylaxis, supporting the trend toward treating patients with moderate risk.16
Continue to: Prophylactic treatment options are safe...
Prophylactic treatment options are safe and well tolerated. For this reason, committing a high- or moderate-risk patient to a course of treatment should be less of a concern than the risk for HBVr.
In the early randomized controlled trials for HBVr prophylaxis, lamivudine, although effective, unfortunately led to a high incidence of viral resistance after prolonged use, thus diminishing its desirability.18 Newer agents, such as entecavir and tenofovir, have proven just as effective as lamivudine and are largely unaffected by viral resistance.27
In retrospective and prospective studies on HBVr prophylaxis, patients treated with entecavir had less HBV-related hepatitis, less delay in chemotherapy, and a lower rate of HBVr when compared with lamivudine.28,29 Tenofovir is recommended, however, if patients were previously treated with lamivudine.30
A recent meta-analysis demonstrated that tenofovir and entecavir are preferable to lamivudine in preventing HBVr.31
Looking ahead
Screening for HBsAg and anti-HBc total before starting immunosuppressive therapy can reduce morbidity and mortality in patients undergoing such treatment. The AGA recommends screening all patients about to begin high- or moderate-risk therapy or patients in populations with a prevalence of CHB ≥2%, per the CDC.6,21
Continue to: Classes of medications...
Classes of medications other than immunosuppressants may also trigger HBVr. The FDA has issued a warning regarding direct-acting antivirals, but optimal management of these patients is still evolving.
Once HBV status is established, a patient’s risk for HBVr can be specified as high, moderate, or low using their HBV status and the type of therapy being initiated. The AGA recommends prophylactic treatment with well-tolerated and effective agents for patients classified as high or moderate risk. If a patient’s risk is low, regular monitoring of HBV DNA and AST and ALT levels is sufficient. Recommendations of monitoring intervals span from monthly to every 3 months.13,14
CASE Given the patient’s status of resolved HBV infection and her current moderate-dose regimen of prednisone, her risk for HBV reactivation is moderate. She could either receive antiviral prophylaxis or undergo regular monitoring. Following a discussion of the options, she opts for referral to a hepatologist to discuss possible prophylactic treatment.
Increased awareness of HBVr risk associated with immunosuppressive therapy, coupled with a planned approach to appropriate screening and risk stratification, can help health care providers prevent the reactivation of HBV or initiate early intervention for CHB.
CORRESPONDENCE
Ronan Farrell, MD, Rhode Island Hospital, 593 Eddy Street, Providence, RI 02903; ronan_farrell@brown.edu.
1. Artz AS, Somerfield MR, Feld JJ, et al. American Society of Clinical Oncology provisional clinical opinion: chronic hepatitis B virus infection screening in patients receiving cytotoxic chemotherapy for treatment of malignant diseases. J Clin Oncol. 2010;28:3199-3202.
2. Day FL, Link E, Thursky K, et al. Current hepatitis B screening practices and clinical experience of reactivation in patients undergoing chemotherapy for solid tumors: a nationwide survey of medical oncologists. J Oncol Pract. 2011;7:141-147.
3. Paul S, Saxena A, Terrin N, et al. Hepatitis B virus reactivation and prophylaxis during solid tumor chemotherapy: a systematic review and meta-analysis. Ann Internal Med. 2016;164:30-40.
4. Kim MK, Ahn JH, Kim SB, et al. Hepatitis B reactivation during adjuvant anthracycline-based chemotherapy in patients with breast cancer: a single institution’s experience. Korean J Intern Med. 2007;22:237-243.
5. Esteve M, Saro C, González-Huix F, et al. Chronic hepatitis B reactivation following infliximab therapy in Crohn’s disease patients: need for primary prophylaxis. Gut. 2004;53:1363-1365.
6. Weinbaum CM, Williams I, Mast EE, et al. Recommendations for identification and public health management of persons with chronic hepatitis B virus infection. MMWR Recomm Rep. 2008;57:1-20.
7. Liang TJ, Block TM, McMahon BJ, et al. Present and future therapies of hepatitis B: from discovery to cure. Hepatology. 2015;62:1893-1908.
8, , , A mathematical model to estimate global hepatitis B disease burden and vaccination impact. Int J Epidemiol. 2005;34:1329-1339.
9. WHO. Hepatitis B. www.who.int/en/news-room/fact-sheets/detail/hepatitis-b. Accessed February 28, 2019.
10. Kowdley KV, Wang CC, Welch S, et al. Prevalence of chronic hepatitis B among foreign-born persons living in the United States by country of origin. Hepatology. 2012;56:422-433.
11. Foster T, Hon H, Kanwal F, et al. Screening high risk individuals for hepatitis B: physician knowledge, attitudes, and beliefs. Dig Dis Sci. 2011;56:3471-3487.
12. Rehermann B, Ferrari C, Pasquinelli C, et al. The hepatitis B virus persists for decades after patients’ recovery from acute viral hepatitis despite active maintenance of a cytotoxic T-lymphocyte response. Nat Med. 1996;2:1104-1108.
13. Loomba R, Liang TJ. Hepatitis B reactivation associated with immune suppressive and biological modifier therapies: current concepts, management strategies, and future directions. Gastroenterology. 2017;152:1297-1309.
14. Di Bisceglie AM, Lok AS, Martin P, et al. Recent US Food and Drug Administration warnings on hepatitis B reactivation with immune-suppressing and anticancer drugs: just the tip of the iceberg? Hepatology. 2015;61:703-711.
15. Lok AS, Ward JW, Perrillo RP, et al. Reactivation of hepatitis B during immunosuppressive therapy: potentially fatal yet preventable. Ann Intern Med. 2012;156:743-745.
16. Perrillo RP, Gish R, Falck-Ytter YT. American Gastroenterological Association Institute technical review on prevention and treatment of hepatitis B virus reactivation during immunosuppressive drug therapy. Gastroenterology. 2015;148:221-244.
17. Hwang JP, Lok AS. Management of patients with hepatitis B who require immunosuppressive therapy. Nat Rev Gastroenterol Hepatol. 2014;11:209-219.
18. Lok AS, McMahon BJ. Chronic hepatitis B: update 2009. Hepatology. 2009;50:661-662.
19. Asian-Pacific consensus statement on the management of chronic hepatitis B: a 2012 update. Hepatol Int. 2012;6:531-561.
20. EASL clinical practice guidelines: management of chronic hepatitis B virus infection. J Hepatol. 2012;57:167-185.
21. Reddy KR, Beavers KL, Hammond SP, et al. American Gastroenterological Association Institute guideline on the prevention and treatment of hepatitis B virus reactivation during immunosuppressive drug therapy. Gastroenterology. 2015;148:215-219.
, , . Why we should routinely screen Asian American adults for hepatitis B: a cross-sectional study of Asians in California. Hepatology. 2007;46:1034-1040.
23. Hwang JP, Artz AS, Somerfield MR. Hepatitis B virus screening for patients with cancer before therapy: American Society of Clinical Oncology Provisional Clinical Opinion Update. J Oncol Pract. 2015;11:e487-489.
24. LabCorp. Hepatitis B core antibody, IgG, IgM, differentiation. www.labcorp.com/test-menu/27196/hepatitis-b-core-antibody-igg-igm-differentiation. Accessed February 28, 2019.
25. Quest diagnostics. Hepatitis B Core Antibody, Total. www.questdiagnostics.com/testcenter/TestDetail.action?ntc=501.Accessed November 5, 2018.
26. The Food and Drug Administration Adverse Event Reporting System (FAERS). www.fda.gov/Drugs/DrugSafety/ucm522932.htm. Accessed February 28, 2019.
27. Lim YS. Management of antiviral resistance in chronic hepatitis B. Gut Liver. 2017;11:189-195.
28. Huang H, Li X, Zhu J, et al. Entecavir vs lamivudine for prevention of hepatitis B virus reactivation among patients with untreated diffuse large B-cell lymphoma receiving R-CHOP chemotherapy: a randomized clinical trial. JAMA. 2014;312:2521-2530.
29. Chen WC, Cheng JS, Chiang PH, et al. A comparison of entecavir and lamivudine for the prophylaxis of hepatitis B virus reactivation in solid tumor patients undergoing systemic cytotoxic chemotherapy. PLoS One. 2015;10:e0131545.
30. Tenney DJ, Rose RE, Baldick CJ, et al. Long-term monitoring shows hepatitis B virus resistance to entecavir in nucleoside-naïve patients is rare through 5 years of therapy. Hepatology. 2009;49:1503-1514.
31. Zhang MY, Zhu GQ, Shi KQ, et al. Systematic review with network meta-analysis: comparative efficacy of oral nucleos(t)ide analogues for the prevention of chemotherapy-induced hepatitis B virus reactivation. Oncotarget. 2016;7:30642-30658.
PRACTICE RECOMMENDATIONS
› Measure levels of hepatitis B surface antigen and core antibody total. Although testing for IgG alone can be acceptable, testing for IgM alone is unacceptable. C
› Use both a patient’s serologic findings and the recognized risk associated with intended therapy to determine the threat of hepatitis B virus (HBV) reactivation. C
› Offer antiviral prophylaxis when risk for HBV reactivation is high. Consider prophylaxis or monitoring for those at moderate risk. C
Strength of recommendation (SOR)
A Good-quality patient-oriented evidence
B Inconsistent or limited-quality patient-oriented evidence
C Consensus, usual practice, opinion, disease-oriented evidence, case series
