User login
Issues in Determining Appropriate Levels of Hospitalist Staffing
Introduction
A major challenge for leaders of hospital medicine programs is determining appropriate staffing levels. Specifically, every hospitalist leader must answer the following question:
- What is the correct number of physician staff needed to meet the requirements of the work environment?
The Board of Directors of the Society of Hospital Medicine (SHM) asked the Benchmarks Committee to prepare a “white paper” on this subject. The Committee discussed hospitalist staffing and agreed that there is no simple formula or process for answering the question cited above. Instead, the Committee decided to prepare a paper that outlines the issues and suggests best practices for determining appropriate hospitalist staffing levels. A member of the Benchmarks Committee, Gale Ashbrener, Sr., Performance Consultant, Kaiser Permanente-Hawaii, has prepared a model for hospitalist staffing in her organization, and her work is the basis of this document.
NOTE: Most of the examples used in this document are from Kaiser-Hawaii. As such, the numbers cited are reflective of that particular organizational environment (i.e., a group model HMO). Readers should focus on the concepts and processes that are presented, recognizing that the numbers may be different for their environment.
Overview of the Issues
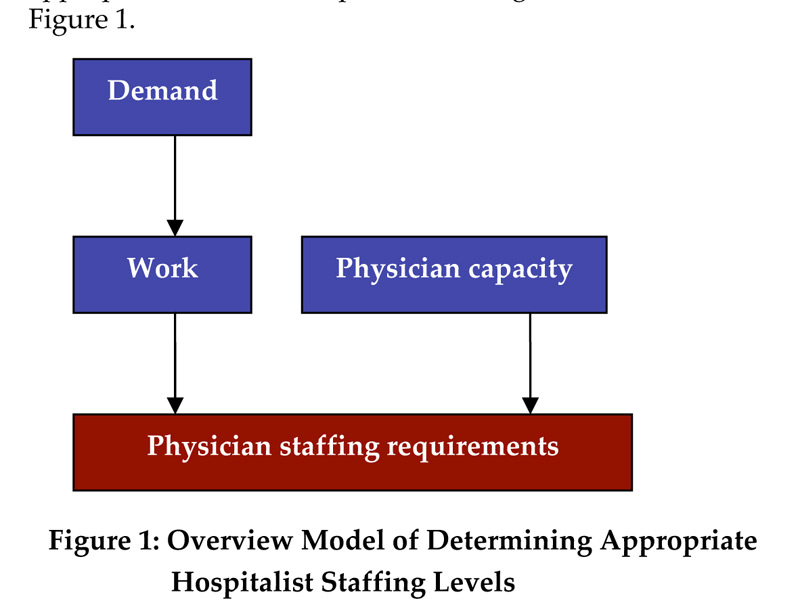
A process or simplistic model for determining the appropriate level of hospitalist staffing is summarized in Figure 1.
Staffing
Staffing is driven by demand: how many and what types of patients will the program expect to see in the upcoming year? Demand can then be converted to work: the tasks that the hospital medicine program must perform in order to treat these patients (the model must also quantify non-patient work). Once the total amount of work is described and quantified, the capacity of a hospitalist must be defined (e.g., in annual work hours). Then the number of hospitalists required to complete the projected work load can be computed.
Demand
The best practices for projecting patient demand are summarized in Box 1.
Hospitalist leaders should involve key stakeholders in the information gathering process. This helps establish the foundation for buy-in of the model down the road. You may want to pull together members of the hospitalist team and/or hospital administration to brainstorm on factors that may affect patient demand for inpatient services. At this point, keep an open mind for all considerations.
It is also critical to perform a comprehensive analysis of historical inpatient data. The analysis should examine all medical admissions at the hospital and specifically, in detail, those admissions cared for by the hospital medicine program. This analysis must look beyond the number of admissions and average length of stay (LOS). Several key characteristics of the hospitalized patients should be evaluated: age, diagnosis/severity, payer, and referring physician.

- Age: There are significant differences in inpatient utilization by age categories. It is important to further segment the “senior” Medicare (over age 65) population into several subgroups. Figure 2 (page 49) is based on data from Kaiser Permanente-Hawaii. As expected, there is a major difference in hospital utilization between the under age 65 population (15.9 admissions and 84 days per 1000) and the over age 65 population (167.9 admissions and 1,090 days per 1000). However, the differences within the Medicare subgroups are also substantial. For example, compare utilization by the population that is 65-69 years old (96.0 admissions and 621 days per 1000) with the population that is over age 85 (358.2 admissions and 2,111 days per 1000):
- Diagnoses/severity: There are acknowledged differences in LOS based on the patient’s reason for admission and many ways to characterize the reason of admission, including diagnosis and diagnostics-related groups (DRGs). Furthermore, patients with co-morbidities clearly require more coordination and patient management. There are several proprietary grouping methodologies that characterize the severity and intensity of an inpatient case, which include an assessment of co-morbidities. In analyzing historical data, the hospitalist leader should select a scheme that is used within the institution while minimizing the number of categories.
- Payer: In analyzing inpatient demand, it is also important to have an understanding of historical differences by payer (including uninsured patients). Health plans (or Medicaid programs) that are increasing or decreasing in size could affect the number of patients seen by a hospital medicine program.
- Referring physician: Community physicians (primary care, specialists, and surgeons) are a major source of inpatient cases for hospital medicine programs. It is important to analyze the historical impact of specific physicians or group practices on the patient load of the hospital medicine program.
The best way to project inpatient demand for hospitalist services is to identify and quantify what may change in the next year: what trends could increase or decrease the number of cases that will need to be treated? These change factors include the following:
- Population trends: Is the community growing? It there an influx of new residents? Is the community aging? Is it likely that there will be more seniors requiring inpatient services? Health plans and medical groups often can more easily assess population trends because they treat an enrolled population.
- Local health care factors: Will a hospital in the region be closing, resulting in additional inpatient demand? Is there a shortage of nursing home beds in the community that may affect the need for inpatient care? Is Medicaid reducing the number of covered recipients, potentially increasing the demand from uninsured patients?
- Changing referral patterns from community physicians: Do you expect additional community physicians to stop/start referring patients to the hospital medicine program? Are referring medical groups increasing or decreasing in size?
- Institution-specific factors: Does the hospital medicine program expect to assume new responsibilities in the next year – e.g., in the emergency department (ED), in the intensive care unit (ICU), providing night coverage, doing surgical co‑management, etc.?
Work
The best practices for measuring hospitalist output (work) are summarized in Box 2.
Determining how to quantify the labor of hospitalists can be the most controversial component of developing a staffing model. To ensure buy-in of these modeling decisions, participation by hospitalists and other key players (e.g., other physicians, physician leadership, and hospital/medical group administration) is crucial. Hospitalists and other key individuals must understand and agree on the quantification of time and labor.
It is critical that the analysis include ALL elements of work. Brainstorming with hospitalists can be helpful in this process. To build physician acceptance of and trust in the model, it is important to acknowledge the full set of hospitalist responsibilities in the initial stages of model development.
The services provided by a hospitalist team can vary from program to program and hospital to hospital. For example, at Kaiser Permanente-Hawaii, the dedicated hospitalist triage physician may direct patients coming from the clinic or ED to the ambulatory treatment center. A hospitalist then sees the patient in the center and an admission is often avoided. This physician labor must be captured in the model even though an admission did not occur. If your program includes a day team and a night team, you may want to handle these two teams as separate models.
Based on an analysis performed at Kaiser Permanente-Hawaii, some examples of hospitalist labor components are noted in Box 3 (page 50).
To measure the work performed by hospitalists, the model needs to recognize that there are differences in the labor components that have been identified (i.e., they are “weighted” differently). “Conventional wisdom” describes the work that hospitalists perform in terms of the number of patients seen per day (e.g., 15 patients per day). However, the work involved in a hospitalist seeing the following categories of patients is very different:
- Admitting a patient
- Rounding on a patient already admitted
- Discharging a patient
- Performing a consultation
Kaiser Permanente Hawaii developed the example in Box 4 to illustrate differences in the work required for admissions, rounding, and discharges, and how reductions in LOS do not lead to corresponding reductions in physician staffing levels.
There are basically two options in weighting the different elements of work performed by a hospitalist: time or relative value units (RVUs). Although the amount of time it takes to do a task seems to be the most sensible measurement of labor, it can be fraught with obstacles. The amount of time it takes a physician to round on a patient, for example, is not straightforward:
- Are all the patients located on one floor?
- Does the physician have to chase down test results routinely?
- Are all physicians the same, taking the same average amount of time to see a patient?
- Are all patients the same? Do older patients take more time due to social and medical complexity?
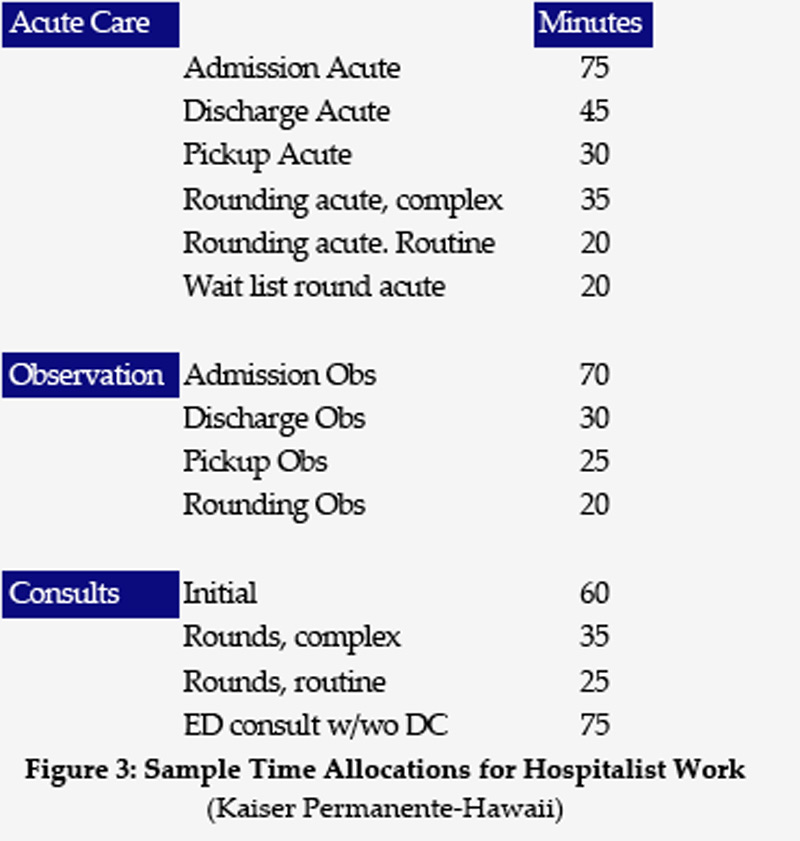
These are all factors that affect time. Furthermore, individuals are limited by their own experiences and frame of reference. Acceptance of a specific time allocation (e.g., a discharge takes 45 minutes) by those not doing the work is subjective. Despite these obstacles, it is valuable for hospitalist leaders to attempt to quantify the amount of time required to do inpatient work. Figure 3 shows example times used by a Kaiser Permanente-Hawaii medical group.
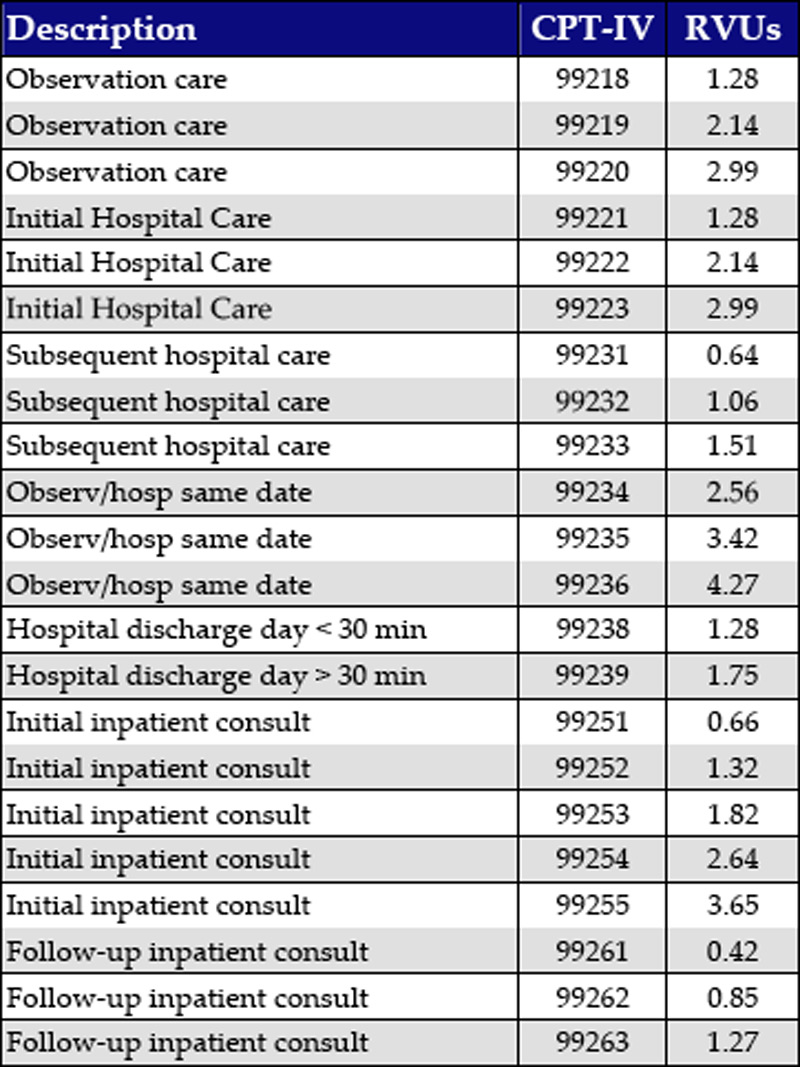
A hospital medicine program leader can use RVUs as a compliment to or as an alternative to time as the basis of weighting the work components performed by hospitalists. RVUs may account for patient acuity in a way that is hard to measure using time as the basis of measurement. Figure 4 illustrates RVUs by CPT-IV code.
Physician Capacity
The best practices for determining physician capacity are summarized in Box 5.
When determining the work capacity for a hospitalist (typically defined by the number of hours worked per year), it is critical to clearly define the unique aspects of the hospital medicine program that affect work capacity. These factors include:
- Staffing model: shift vs. call
- Scheduling approach: number of days on/off
- Non-patient care responsibilities: teaching, research, committees, etc.
- Staffing philosophy: part-time vs. full-time preference
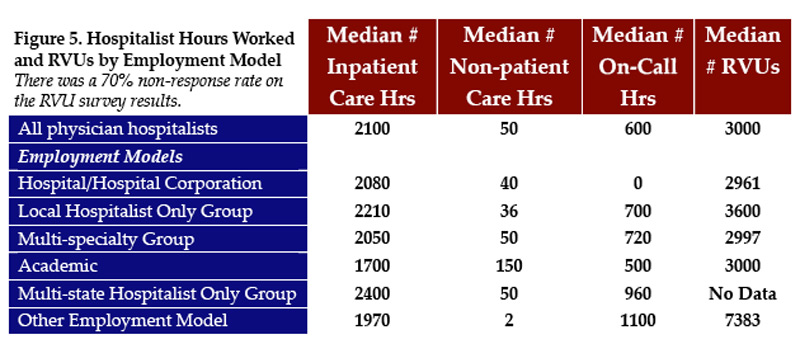
Benchmark information is extremely helpful in determining physician capacity for a hospital medicine program. These benchmarks provide a point of comparison for hospitalist leaders developing staffing models. Medians for inpatient, non-patient, and on-call hours from the 2004 SHM Productivity and Compensation Survey are documented in Figure 5 (page 52).
The simplified example in Box 6, based on Kaiser time estimates, illustrates how demand, work, and physician capacity can be used to determine the number of hospitalists required to support a program.
As an alternative methodology or for comparative purposes, RVUs can be used rather than time. Box 7 uses RVUs from Figure 4 (initial hospital care: 1.28 RVUs; subsequent hospital care: .64 RVUs; hospital discharge < 30 minutes: 1.28 RVUs). The lowest level RVU values are used because they are consistent with the Kaiser example. Also, the median RVUs per year from Figure 5 are used (2961 for a hospital-based program).
Understand Your Work Environment
When a hospitalist program leader begins the process of developing a staffing model, it is important that he or she understands how the unique goals and characteristics of the program affects staffing. For example:
- Hospitalist-only groups are often driven by revenue. It is likely that these programs will expect hospitalists to do more billable work (i.e., see more patients)
- Academic programs typically have a broad range of other, non-patient care responsibilities, including teaching, research, and committee work. The hospitalists in these programs may see fewer patients.
The data from the 2004 SHM Productivity and Compensation Survey (Figure 5) confirms these differences. For inpatient hours worked, the national medians for these two different employment models differ by 23% (1700 vs. 2210). For RVUs worked, the national medians for the two different employment models differ by 17% (3000 vs. 3600).
Summary
Determining the right level of hospitalist staffing is important because it can positively or negatively affect the hospital medicine program and the hospital. Understaffing can lead to physician burn-out and adversely affect physician performance and hospital utilization. Overstaffing can affect the program’s financial performance and undercut the credibility of the program. The right staffing models and formulas, however, can help create a successful hospitalist work environment.
Summary of Recommendations
- There is no industry standard for a hospitalist staffing model. The analysis can be time-based or RVU-based, census driven, or based on any combination of output measures.
- Inpatient utilization drives the requirements for hospitalist staffing. A thorough analysis of historical inpatient utilization data is critical to developing a staffing model.
- In addition to understanding past utilization, projecting future inpatient demand is also important. Critical change factors include trends in: 1) the age and severity of patients; 2) population growth or decline; 3) payer sources; and 4) referral patterns.
- The services (work) performed by the hospital medicine program should be clearly identified and factored into the staffing formula. Brainstorming with the hospitalist group can be an effective technique for ensuring that the analysis is credible.
- Stakeholders should be involved early and often in developing a staffing model and in making staffing decisions.
- In developing a staffing model, particularly in the beginning stages, focus on the process and the methodology and not on the outcome (i.e., “my program needs 6 physicians”).
- Understand how the unique goals and characteristics of your hospital medicine program affect your staffing model.
Introduction
A major challenge for leaders of hospital medicine programs is determining appropriate staffing levels. Specifically, every hospitalist leader must answer the following question:
- What is the correct number of physician staff needed to meet the requirements of the work environment?
The Board of Directors of the Society of Hospital Medicine (SHM) asked the Benchmarks Committee to prepare a “white paper” on this subject. The Committee discussed hospitalist staffing and agreed that there is no simple formula or process for answering the question cited above. Instead, the Committee decided to prepare a paper that outlines the issues and suggests best practices for determining appropriate hospitalist staffing levels. A member of the Benchmarks Committee, Gale Ashbrener, Sr., Performance Consultant, Kaiser Permanente-Hawaii, has prepared a model for hospitalist staffing in her organization, and her work is the basis of this document.
NOTE: Most of the examples used in this document are from Kaiser-Hawaii. As such, the numbers cited are reflective of that particular organizational environment (i.e., a group model HMO). Readers should focus on the concepts and processes that are presented, recognizing that the numbers may be different for their environment.
Overview of the Issues
A process or simplistic model for determining the appropriate level of hospitalist staffing is summarized in Figure 1.
Staffing
Staffing is driven by demand: how many and what types of patients will the program expect to see in the upcoming year? Demand can then be converted to work: the tasks that the hospital medicine program must perform in order to treat these patients (the model must also quantify non-patient work). Once the total amount of work is described and quantified, the capacity of a hospitalist must be defined (e.g., in annual work hours). Then the number of hospitalists required to complete the projected work load can be computed.
Demand
The best practices for projecting patient demand are summarized in Box 1.
Hospitalist leaders should involve key stakeholders in the information gathering process. This helps establish the foundation for buy-in of the model down the road. You may want to pull together members of the hospitalist team and/or hospital administration to brainstorm on factors that may affect patient demand for inpatient services. At this point, keep an open mind for all considerations.
It is also critical to perform a comprehensive analysis of historical inpatient data. The analysis should examine all medical admissions at the hospital and specifically, in detail, those admissions cared for by the hospital medicine program. This analysis must look beyond the number of admissions and average length of stay (LOS). Several key characteristics of the hospitalized patients should be evaluated: age, diagnosis/severity, payer, and referring physician.
- Age: There are significant differences in inpatient utilization by age categories. It is important to further segment the “senior” Medicare (over age 65) population into several subgroups. Figure 2 (page 49) is based on data from Kaiser Permanente-Hawaii. As expected, there is a major difference in hospital utilization between the under age 65 population (15.9 admissions and 84 days per 1000) and the over age 65 population (167.9 admissions and 1,090 days per 1000). However, the differences within the Medicare subgroups are also substantial. For example, compare utilization by the population that is 65-69 years old (96.0 admissions and 621 days per 1000) with the population that is over age 85 (358.2 admissions and 2,111 days per 1000):
- Diagnoses/severity: There are acknowledged differences in LOS based on the patient’s reason for admission and many ways to characterize the reason of admission, including diagnosis and diagnostics-related groups (DRGs). Furthermore, patients with co-morbidities clearly require more coordination and patient management. There are several proprietary grouping methodologies that characterize the severity and intensity of an inpatient case, which include an assessment of co-morbidities. In analyzing historical data, the hospitalist leader should select a scheme that is used within the institution while minimizing the number of categories.
- Payer: In analyzing inpatient demand, it is also important to have an understanding of historical differences by payer (including uninsured patients). Health plans (or Medicaid programs) that are increasing or decreasing in size could affect the number of patients seen by a hospital medicine program.
- Referring physician: Community physicians (primary care, specialists, and surgeons) are a major source of inpatient cases for hospital medicine programs. It is important to analyze the historical impact of specific physicians or group practices on the patient load of the hospital medicine program.
The best way to project inpatient demand for hospitalist services is to identify and quantify what may change in the next year: what trends could increase or decrease the number of cases that will need to be treated? These change factors include the following:
- Population trends: Is the community growing? It there an influx of new residents? Is the community aging? Is it likely that there will be more seniors requiring inpatient services? Health plans and medical groups often can more easily assess population trends because they treat an enrolled population.
- Local health care factors: Will a hospital in the region be closing, resulting in additional inpatient demand? Is there a shortage of nursing home beds in the community that may affect the need for inpatient care? Is Medicaid reducing the number of covered recipients, potentially increasing the demand from uninsured patients?
- Changing referral patterns from community physicians: Do you expect additional community physicians to stop/start referring patients to the hospital medicine program? Are referring medical groups increasing or decreasing in size?
- Institution-specific factors: Does the hospital medicine program expect to assume new responsibilities in the next year – e.g., in the emergency department (ED), in the intensive care unit (ICU), providing night coverage, doing surgical co‑management, etc.?
Work
The best practices for measuring hospitalist output (work) are summarized in Box 2.
Determining how to quantify the labor of hospitalists can be the most controversial component of developing a staffing model. To ensure buy-in of these modeling decisions, participation by hospitalists and other key players (e.g., other physicians, physician leadership, and hospital/medical group administration) is crucial. Hospitalists and other key individuals must understand and agree on the quantification of time and labor.
It is critical that the analysis include ALL elements of work. Brainstorming with hospitalists can be helpful in this process. To build physician acceptance of and trust in the model, it is important to acknowledge the full set of hospitalist responsibilities in the initial stages of model development.
The services provided by a hospitalist team can vary from program to program and hospital to hospital. For example, at Kaiser Permanente-Hawaii, the dedicated hospitalist triage physician may direct patients coming from the clinic or ED to the ambulatory treatment center. A hospitalist then sees the patient in the center and an admission is often avoided. This physician labor must be captured in the model even though an admission did not occur. If your program includes a day team and a night team, you may want to handle these two teams as separate models.
Based on an analysis performed at Kaiser Permanente-Hawaii, some examples of hospitalist labor components are noted in Box 3 (page 50).
To measure the work performed by hospitalists, the model needs to recognize that there are differences in the labor components that have been identified (i.e., they are “weighted” differently). “Conventional wisdom” describes the work that hospitalists perform in terms of the number of patients seen per day (e.g., 15 patients per day). However, the work involved in a hospitalist seeing the following categories of patients is very different:
- Admitting a patient
- Rounding on a patient already admitted
- Discharging a patient
- Performing a consultation
Kaiser Permanente Hawaii developed the example in Box 4 to illustrate differences in the work required for admissions, rounding, and discharges, and how reductions in LOS do not lead to corresponding reductions in physician staffing levels.
There are basically two options in weighting the different elements of work performed by a hospitalist: time or relative value units (RVUs). Although the amount of time it takes to do a task seems to be the most sensible measurement of labor, it can be fraught with obstacles. The amount of time it takes a physician to round on a patient, for example, is not straightforward:
- Are all the patients located on one floor?
- Does the physician have to chase down test results routinely?
- Are all physicians the same, taking the same average amount of time to see a patient?
- Are all patients the same? Do older patients take more time due to social and medical complexity?
These are all factors that affect time. Furthermore, individuals are limited by their own experiences and frame of reference. Acceptance of a specific time allocation (e.g., a discharge takes 45 minutes) by those not doing the work is subjective. Despite these obstacles, it is valuable for hospitalist leaders to attempt to quantify the amount of time required to do inpatient work. Figure 3 shows example times used by a Kaiser Permanente-Hawaii medical group.
A hospital medicine program leader can use RVUs as a compliment to or as an alternative to time as the basis of weighting the work components performed by hospitalists. RVUs may account for patient acuity in a way that is hard to measure using time as the basis of measurement. Figure 4 illustrates RVUs by CPT-IV code.
Physician Capacity
The best practices for determining physician capacity are summarized in Box 5.
When determining the work capacity for a hospitalist (typically defined by the number of hours worked per year), it is critical to clearly define the unique aspects of the hospital medicine program that affect work capacity. These factors include:
- Staffing model: shift vs. call
- Scheduling approach: number of days on/off
- Non-patient care responsibilities: teaching, research, committees, etc.
- Staffing philosophy: part-time vs. full-time preference
Benchmark information is extremely helpful in determining physician capacity for a hospital medicine program. These benchmarks provide a point of comparison for hospitalist leaders developing staffing models. Medians for inpatient, non-patient, and on-call hours from the 2004 SHM Productivity and Compensation Survey are documented in Figure 5 (page 52).
The simplified example in Box 6, based on Kaiser time estimates, illustrates how demand, work, and physician capacity can be used to determine the number of hospitalists required to support a program.
As an alternative methodology or for comparative purposes, RVUs can be used rather than time. Box 7 uses RVUs from Figure 4 (initial hospital care: 1.28 RVUs; subsequent hospital care: .64 RVUs; hospital discharge < 30 minutes: 1.28 RVUs). The lowest level RVU values are used because they are consistent with the Kaiser example. Also, the median RVUs per year from Figure 5 are used (2961 for a hospital-based program).
Understand Your Work Environment
When a hospitalist program leader begins the process of developing a staffing model, it is important that he or she understands how the unique goals and characteristics of the program affects staffing. For example:
- Hospitalist-only groups are often driven by revenue. It is likely that these programs will expect hospitalists to do more billable work (i.e., see more patients)
- Academic programs typically have a broad range of other, non-patient care responsibilities, including teaching, research, and committee work. The hospitalists in these programs may see fewer patients.
The data from the 2004 SHM Productivity and Compensation Survey (Figure 5) confirms these differences. For inpatient hours worked, the national medians for these two different employment models differ by 23% (1700 vs. 2210). For RVUs worked, the national medians for the two different employment models differ by 17% (3000 vs. 3600).
Summary
Determining the right level of hospitalist staffing is important because it can positively or negatively affect the hospital medicine program and the hospital. Understaffing can lead to physician burn-out and adversely affect physician performance and hospital utilization. Overstaffing can affect the program’s financial performance and undercut the credibility of the program. The right staffing models and formulas, however, can help create a successful hospitalist work environment.
Summary of Recommendations
- There is no industry standard for a hospitalist staffing model. The analysis can be time-based or RVU-based, census driven, or based on any combination of output measures.
- Inpatient utilization drives the requirements for hospitalist staffing. A thorough analysis of historical inpatient utilization data is critical to developing a staffing model.
- In addition to understanding past utilization, projecting future inpatient demand is also important. Critical change factors include trends in: 1) the age and severity of patients; 2) population growth or decline; 3) payer sources; and 4) referral patterns.
- The services (work) performed by the hospital medicine program should be clearly identified and factored into the staffing formula. Brainstorming with the hospitalist group can be an effective technique for ensuring that the analysis is credible.
- Stakeholders should be involved early and often in developing a staffing model and in making staffing decisions.
- In developing a staffing model, particularly in the beginning stages, focus on the process and the methodology and not on the outcome (i.e., “my program needs 6 physicians”).
- Understand how the unique goals and characteristics of your hospital medicine program affect your staffing model.