User login
Introducing the Hospitalist Morale Index
Explosive growth in hospital medicine has led to hospitalists having the option to change jobs easily. Annual turnover for all physicians is 6.8%, whereas that of hospitalists exceeds 14.8%.[1] Losing a single physician has significant financial and operational implications, with estimates of $20,000 to $120,000 in recruiting costs, and up to $500,000 in lost revenue that may take years to recoup due to the time required for new physician assimilation.[2, 3] In 2006, the Society of Hospital Medicine (SHM) appointed a career task force to develop retention recommendations, 1 of which includes monitoring hospitalists' job satisfaction.[4]
Studies examining physician satisfaction have demonstrated that high physician job satisfaction is associated with lower physician turnover.[5] However, surveys of hospitalists, including SHM's Hospital Medicine Physician Worklife Survey (HMPWS), have reported high job satisfaction among hospitalists,[6, 7, 8, 9, 10] suggesting that high job satisfaction may not be enough to overcome forces that pull hospitalists toward other opportunities.
Morale, a more complex construct related to an individual's contentment and happiness, might provide insight into reducing hospitalist turnover. Morale has been defined as the emotional or mental condition with respect to cheerfulness, confidence, or zeal and is especially relevant in the face of opposition or hardship.[11] Job satisfaction is 1 element that contributes to morale, but alone does not equate morale.[12] Morale, more than satisfaction, relates to how people see themselves within the group and may be closely tied to the concept of esprit de corps. To illustrate, workers may feel satisfied with the content of their job, but frustration with the organization may result in low morale.[13] Efforts focused on assessing provider morale may provide deeper understanding of hospitalists' professional needs and garner insight for retention strategies.
The construct of hospitalist morale and its underlying drivers has not been explored in the literature. Using literature within and outside of healthcare,[1, 12, 14, 15, 16, 17, 18, 19, 20, 21, 22] and our own prior work,[23] we sought to characterize elements that contribute to hospitalist morale and develop a metric to measure it. The HMPWS found that job satisfaction factors vary across hospitalist groups.[9] We suspected that the same would hold true for factors important to morale at the individual level. This study describes the development and validation of the Hospitalist Morale Index (HMI), and explores the relationship between morale and intent to leave due to unhappiness.
METHODS
2009 Pilot Survey
To establish content validity, after reviewing employee morale literature, and examining qualitative comments from our 2007 and 2008 morale surveys, our expert panel, consisting of practicing hospitalists, hospitalist leaders, and administrative staff, identified 46 potential drivers of hospitalist morale. In May 2009, all hospitalists, including physicians, nurse practitioners (NPs), and physician assistants (PAs) from a single hospitalist group received invitations to complete the pilot survey. We asked hospitalists to assess on 5‐point Likert scales the importance of (not at all to tremendously) and contentment with (extremely discontent to extremely content) each of the 46 items as it relates to their work morale. Also included were demographic questions and general morale questions (including rating participants' own morale), investment, long‐term career plans, and intent to leave due to unhappiness.
Data Collection
To maintain anonymity and limit social desirability bias, a database manager, working outside the Division of Hospital Medicine and otherwise not associated with the research team, used Survey Monkey to coordinate survey distribution and data collection. Each respondent had a unique identifier code that was unrelated to the respondent's name and email address. Personal identifiers were maintained in a secure database accessible only to the database manager.
Establishing Internal Structure Validity Evidence
Response frequency to each question was examined for irregularities in distribution. For continuous variables, descriptive statistics were examined for evidence of skewness, outliers, and non‐normality to ensure appropriate use of parametric statistical tests. Upon ranking importance ratings by mode, 15 of 46 items were judged to be of low importance by almost all participants and removed from further consideration.
Stata 13.1 (StataCorp, College Station, TX) was used for exploratory factor analysis (EFA) of the importance responses for all 31 remaining items by principal components factoring. Eigenvalues >1 were designated as a cutoff point for inclusion in varimax rotation. Factor loading of 0.50 was the threshold for inclusion in a factor.
The 31 items loaded across 10 factors; however, 3 factors included 1 item each. After reviewing the scree plot and considering their face value, these items/factors were omitted. Repeating the factor analysis resulted in a 28‐item, 7‐factor solution that accounted for 75% variance. All items were considered informative as demonstrated by low uniqueness scores (0.050.38). Using standard validation procedures, all 7 factors were found to have acceptable factor loadings (0.460.98) and face validity. Cronbach's quantified internal reliability of the 7 factors with scores ranging from 0.68 to 0.92. We named the resultant solution the Hospitalist Morale Index (HMI).
Establishing Response Process Validity Evidence
In developing the HMI, we asked respondents to rate the importance of and their contentment with each variable as related to their work morale. From pilot testing, which included discussions with respondents immediately after completing the survey, we learned that the 2‐part consideration of each variable resulted in thoughtful reflection about their morale. Further, by multiplying the contentment score for each item (scaled from 15) by the corresponding importance score (scaled 01), we quantified the relative contribution and contentment of each item for each hospitalist. Scaling importance scores from 0 to 1 insured that items that were not considered important to the respondent did not affect the respondent's personal morale score. Averaging resultant item scores that were greater than 0 resulted in a personal morale score for each hospitalist. Averaging item scores >0 that constituted each factor resulted in factor scores.
May 2011 Survey
The refined survey was distributed in May 2011 to a convenience sample of 5 hospitalist programs at separate hospitals (3 community hospitals, 2 academic hospitals) encompassing 108 hospitalists in 3 different states. Responses to the 2011 survey were used to complete confirmatory factor analyses (CFA) and establish further validity and reliability evidence.
Based on the 28‐item, 7‐factor solution developed from the pilot study, we developed the theoretical model of factors constituting hospitalist morale. We used the structural equation modeling command in Stata 13 to perform CFA. Factor loading of 0.50 was the threshold for inclusion of an item in a factor. To measure internal consistency, we considered Cronbach's score of 0.60 acceptable. Iterative models were reviewed to find the optimal solution for the data. Four items did not fit into any of the 5 resulting factors and were evaluated in terms of mean importance score and face value. Three items were considered important enough to warrant being stand‐alone items, whereas 1 was omitted. Two additional items had borderline factor loadings (0.48, 0.49) and were included in the model as stand‐alone items due to their overall relevance. The resultant solution was a 5‐factor model with 5 additional stand‐alone items (Table 1).
| Factor | Cronbach's | |||||
|---|---|---|---|---|---|---|
| Clinical | Workload | Leadership | Appreciation and Acknowledgement | Material Rewards | ||
| How much does the following item contribute to your morale? | ||||||
| Paperwork | 0.72 | 0.89 | ||||
| Relationship with patients | 0.69 | 0.90 | ||||
| Electronic medical system | 0.60 | 0.90 | ||||
| Intellectual stimulation | 0.59 | 0.90 | ||||
| Variety of cases | 0.58 | 0.90 | ||||
| Relationship with consultants | 0.51 | 0.89 | ||||
| No. of night shifts | 0.74 | 0.89 | ||||
| Patient census | 0.61 | 0.90 | ||||
| No. of shifts | 0.52 | 0.90 | ||||
| Fairness of leadership | 0.82 | 0.89 | ||||
| Effectiveness of leadership | 0.82 | 0.89 | ||||
| Leadership's receptiveness to my thoughts and suggestions | 0.78 | 0.89 | ||||
| Leadership as advocate for my needs | 0.77 | 0.89 | ||||
| Approachability of leadership | 0.77 | 0.89 | ||||
| Accessibility of leadership | 0.69 | 0.89 | ||||
| Alignment of the group's goals with my goals | 0.50 | 0.89 | ||||
| Recognition within the group | 0.82 | 0.89 | ||||
| Feeling valued within the institution | 0.73 | 0.89 | ||||
| Feeling valued within the group | 0.73 | 0.89 | ||||
| Feedback | 0.52 | 0.89 | ||||
| Pay | 0.99 | 0.90 | ||||
| Benefits | 0.56 | 0.89 | ||||
| Cronbach's | 0.78 | 0.65 | 0.89 | 0.78 | 0.71 | |
| How much does the following item contribute to your morale? | Single item indicators | |||||
| Family time | 0.90 | |||||
| Job security | 0.90 | |||||
| Institutional climate | 0.89 | |||||
| Opportunities for professional growth | 0.90 | |||||
| Autonomy | 0.89 | |||||
| Cronbach's | 0.90 | |||||
Establishing Convergent, Concurrent, and Discriminant Validity Evidence
To establish convergent, concurrent, and discriminant validity, linear and logistic regression models were examined for continuous and categorical data accordingly.
Self‐perceived overall work morale and perceived group morale, as assessed by 6‐point Likert questions with response options from terrible to excellent, were modeled as predictors for personal morale as calculated by the HMI.
Personal morale scores were modeled as predictors of professional growth, stress, investment in the group, and intent to leave due to unhappiness. While completing the HMI, hospitalists simultaneously completed a validated professional growth scale[24] and Cohen stress scale.[25] We hypothesized that those with higher morale would have more professional growth. Stress, although an important issue in the workplace, is a distinct construct from morale, and we did not expect a significant relationship between personal morale and stress. We used Pearson's r to assess the strength of association between the HMI and these scales. Participants' level of investment in their group was assessed on a 5‐point Likert scale. To simplify presentation, highly invested represents those claiming to be very or tremendously invested in the success of their current hospitalist group. Intent to leave due to unhappiness was assessed on a 5‐point Likert scale, I have had serious thoughts about leaving my current hospitalist group because I am unhappy, with responses from strongly disagree (1) to strongly agree (5). To simplify presentation, responses higher than 2 are considered to be consistent with intending to leave due to unhappiness.
Our institutional review board approved the study.
RESULTS
Respondents
In May 2009, 30 of the 33 (91%) invited hospitalists completed the original pilot morale survey; 19 (63%) were women. Eleven hospitalists (37%) had been part of the group 1 year or less, whereas 4 (13%) had been with the group for more than 5 years.
In May 2011, 93 of the 108 (86%) hospitalists from 5 hospitals completed the demographic and global parts of the survey. Fifty (53%) were from community hospitals; 47 (51%) were women. Thirty‐seven (40%) physicians and 6 (60%) NPs/PAs were from academic hospitals. Thirty‐nine hospitalists (42%) had been with their current group 1 year or less. Ten hospitalists (11%) had been with their current group over 5 years. Sixty‐three respondents (68%) considered themselves career hospitalists, whereas 5 (5%) did not; the rest were undecided.
Internal Structure Validity Evidence
The final CFA from the 2011 survey resulted in a 5‐factor plus 5stand‐alone‐items HMI. The solution with item‐level and factor‐level Cronbach's scores (range, 0.890.90 and range, 0.650.89, respectively) are shown in Table 1.
Personal Morale Scores and Factor Scores
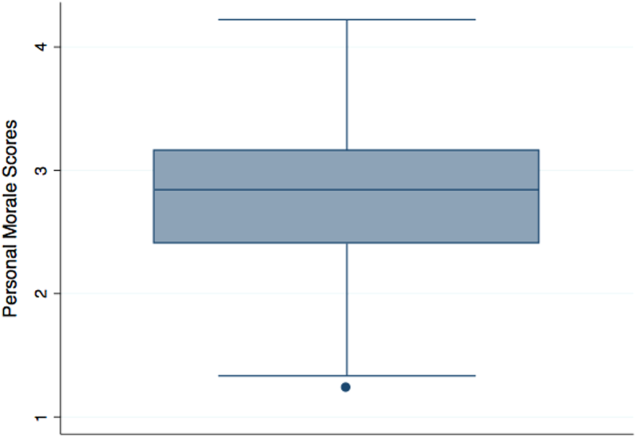
Personal morale scores were normally distributed (mean = 2.79; standard deviation [SD] = 0.58), ranging from 1.23 to 4.22, with a theoretical low of 0 and high of 5 (Figure 1). Mean personal morale scores across hospitalist groups ranged from 2.70 to 2.99 (P > 0.05). Personal morale scores, factor sores and item scores for NPs and PAs did not significantly differ from those of physicians (P > 0.05 for all analyses). Personal morale scores were lower for those in their first 3 years with their current group, compared to those with greater institutional longevity. For every categorical increase in a participant's response to seeing oneself as a career hospitalist, the personal morale score rose 0.23 points (P < 0.001).
Factor scores for material reward and mean item scores for professional growth were significantly different across the 5 hospitalist groups (P = 0.03 and P < 0.001, respectively). Community hospitalists had significantly higher factor scores, despite having similar importance scores, for material rewards than academic hospitalists (diff. = 0.44, P = 0.02). Academic hospitalists had significantly higher scores for professional growth (diff. = 0.94, P < 0.001) (Table 2). Professional growth had the highest importance score for academic hospitalists (mean = 0.87, SD = 0.18) and the lowest importance score for community hospitalists (mean = 0.65, SD = 0.24, P < 0.001).
| Personal Morale Score | Factor 1 | Factor 2 | Factor 3 | Factor 4 | Factor 5 | Item 1 | Item 2 | Item 3 | Item 4 | Item 5 | ||
|---|---|---|---|---|---|---|---|---|---|---|---|---|
| Clinical | Workload | Leadership | Appreciation and Acknowledgement | Material Rewards | Family Time | Institutional Climate | Job Security | Autonomy | Professional Growth | |||
| ||||||||||||
| All participants | Mean | 2.79 | 2.54 | 2.78 | 3.18 | 2.58 | 2.48 | 3.05 | 2.67 | 2.92 | 3.00 | 2.76 |
| SD | 0.58 | 0.63 | 0.70 | 0.95 | 0.86 | 0.85 | 1.15 | 0.97 | 1.11 | 1.10 | 1.21 | |
| Academic A | Mean | 2.77 | 2.43 | 2.92 | 3.10 | 2.54 | 2.28 | 3.16 | 2.70 | 3.06 | 3.20 | 3.08 |
| SD | 0.57 | 0.62 | 0.64 | 0.92 | 0.84 | 0.77 | 1.19 | 0.95 | 1.08 | 1.12 | 1.24 | |
| Academic B | Mean | 2.99 | 2.58 | 2.99 | 3.88 | 2.69 | 2.00 | 2.58 | 2.13 | 1.65 | 3.29 | 4.33 |
| SD | 0.36 | 0.70 | 0.80 | 0.29 | 0.80 | 0.35 | 0.92 | 0.88 | 0.78 | 1.01 | 0.82 | |
| Community A | Mean | 2.86 | 2.61 | 2.51 | 3.23 | 2.73 | 3.03 | 2.88 | 2.84 | 2.95 | 3.23 | 2.66 |
| SD | 0.75 | 0.79 | 0.68 | 1.21 | 1.11 | 1.14 | 1.37 | 1.17 | 0.98 | 1.24 | 1.15 | |
| Community B | Mean | 2.86 | 2.74 | 2.97 | 3.37 | 2.67 | 2.44 | 3.28 | 2.35 | 2.70 | 2.50 | 2.25 |
| SD | 0.67 | 0.55 | 0.86 | 1.04 | 0.94 | 0.87 | 1.00 | 1.15 | 1.40 | 0.72 | 1.26 | |
| Community C | Mean | 2.70 | 2.56 | 2.64 | 2.99 | 2.47 | 2.53 | 3.03 | 2.79 | 3.07 | 2.68 | 2.15 |
| SD | 0.49 | 0.53 | 0.67 | 0.85 | 0.73 | 0.64 | 1.08 | 0.76 | 1.05 | 1.07 | 0.71 | |
| Academic combined | Mean | 2.80 | 2.45 | 2.93 | 3.22 | 2.56 | 2.24 | 3.07 | 2.62 | 2.88 | 3.21 | 3.28 |
| SD | 0.54 | 0.63 | 0.66 | 0.89 | 0.82 | 0.72 | 1.16 | 0.95 | 1.14 | 1.10 | 1.26 | |
| Community combined | Mean | 2.79 | 2.61 | 2.66 | 3.14 | 2.60 | 2.68 | 3.03 | 2.72 | 2.95 | 2.82 | 2.34 |
| SD | 0.62 | 0.62 | 0.72 | 1.01 | 0.90 | 0.90 | 1.15 | 0.99 | 1.09 | 1.09 | 1.00 | |
| P value | >0.05 | >0.05 | >0.05 | >0.05 | >0.05 | 0.02 | >0.05 | >0.05 | >0.05 | >0.05 | <0.001 | |
Convergent, Concurrent, and Discriminant Validity Evidence
For every categorical increase on the question assessing overall morale, the personal morale score was 0.23 points higher (P < 0.001). For every categorical increase in a participant's perception of the group's morale, the personal morale score was 0.29 points higher (P < 0.001).
For every 1‐point increase in personal morale score, the odds of being highly invested in the group increased by 5 times (odds ratio [OR]: 5.23, 95% confidence interval [CI]: 1.91‐14.35, P = 0.001). The mean personal morale score for highly invested hospitalists was 2.92, whereas that of those less invested was 2.43 (diff. = 0.49, P < 0.001) (Table 3). Highly invested hospitalists had significantly higher importance factor scores for leadership (diff. = 0.08, P = 0.03) as well as appreciation and acknowledgement (diff. = 0.08, P = 0.02).
| Personal Morale Score | Factor 1 | Factor 2 | Factor 3 | Factor 4 | Factor 5 | Item 1 | Item 2 | Item 3 | Item 4 | Item 5 | |
|---|---|---|---|---|---|---|---|---|---|---|---|
| Clinical | Workload | Leadership | Appreciation and Acknowledgement | Material Rewards | Family Time | Institutional Climate | Job Security | Autonomy | Professional Growth | ||
| |||||||||||
| Highly invested in success of current hospitalist group | |||||||||||
| Mean | 2.92 | 2.61 | 2.89 | 3.38 | 2.78 | 2.45 | 3.21 | 2.78 | 2.86 | 3.10 | 2.95 |
| SD | 0.55 | 0.59 | 0.68 | 0.92 | 0.88 | 0.77 | 1.11 | 1.00 | 1.09 | 1.06 | 1.25 |
| Less invested in success of current hospitalist group | |||||||||||
| Mean | 2.43 | 2.34 | 2.48 | 2.60 | 2.02 | 2.57 | 2.60 | 2.38 | 3.08 | 2.69 | 2.24 |
| SD | 0.52 | 0.69 | 0.69 | 0.81 | 0.49 | 1.04 | 1.17 | 0.83 | 1.18 | 1.19 | 0.94 |
| P value | <0.001 | >0.05 | 0.02 | 0.001 | <0.001 | >0.05 | 0.03 | >0.05 | >0.05 | >0.05 | 0.02 |
| Not intending to leave because unhappy | |||||||||||
| Mean | 2.97 | 2.67 | 2.89 | 3.48 | 2.77 | 2.52 | 3.24 | 2.85 | 3.05 | 3.06 | 3.01 |
| SD | 0.51 | 0.54 | 0.61 | 0.91 | 0.89 | 0.78 | 1.03 | 0.99 | 1.10 | 1.07 | 1.25 |
| Intending to leave current group because unhappy | |||||||||||
| Mean | 2.45 | 2.30 | 2.59 | 2.59 | 2.21 | 2.40 | 2.68 | 2.33 | 2.67 | 2.88 | 2.28 |
| SD | 0.56 | 0.72 | 0.82 | 0.74 | 0.68 | 0.97 | 1.29 | 0.83 | 1.11 | 1.17 | 0.97 |
| P value | <0.001 | 0.01 | >0.05 | <0.001 | 0.003 | >0.05 | 0.03 | 0.01 | >0.05 | >0.05 | 0.01 |
Every 1‐point increase in personal morale was associated with a rise of 2.27 on the professional growth scale (P = 0.01). The correlation between these 2 scales was 0.26 (P = 0.01). Every 1‐point increase in personal morale was associated with a 2.21 point decrease on the Cohen stress scale (P > 0.05). The correlation between these 2 scales was 0.21 (P > 0.05).
Morale and Intent to Leave Due to Unhappiness
Sixteen (37%) academic and 18 (36%) community hospitalists reported having thoughts of leaving their current hospitalist program due to unhappiness. The mean personal morale score for hospitalists with no intent to leave their current group was 2.97, whereas that of those with intent to leave was 2.45 (diff. = 0.53, P < 0.001). Each 1‐point increase in the personal morale score was associated with an 85% decrease (OR: 0.15, 95% CI: 0.05‐0.41, P < 0.001) in the odds of leaving because of unhappiness. Holding self‐perception of being a career hospitalist constant, each 1‐point increase in the personal morale score was associated with an 83% decrease (OR: 0.17, 95% CI: 0.05‐0.51, P = 0.002) in the odds of leaving because of unhappiness. Hospitalists who reported intent to leave had significantly lower factor scores for all factors and items except workload, material reward, and autonomy than those who did not report intent to leave (Table 3). Within the academic groups, those who reported intent to leave had significantly lower scores for professional growth (diff. = 1.08, P = 0.01). For community groups, those who reported intent to leave had significantly lower scores for clinical work (diff. = 0.54, P = 0.003), workload (diff. = 0.50, P = 0.02), leadership (diff. = 1.19, P < 0.001), feeling appreciated and acknowledged (diff. = 0.68, P = 0.01), job security (diff. = 0.70, P = 0.03), and institutional climate (diff. = 0.67, P = 0.02) than those who did not report intent to leave.
DISCUSSION
The HMI is a validated tool that objectively measures and quantifies hospitalist morale. The HMI's capacity to comprehensively assess morale comes from its breadth and depth in uncovering work‐related areas that may be sources of contentment or displeasure. Furthermore, the fact that HMI scores varied among groups of individuals, including those who are thinking about leaving their hospitalist group because they are unhappy and those who are highly invested in their hospitalist group, speaks to its ability to highlight and account for what is most important to hospitalist providers.
Low employee morale has been associated with decreased productivity, increased absenteeism, increased turnover, and decreased patient satisfaction.[2, 26, 27, 28] A few frustrated workers can breed group discontentment and lower the entire group's morale.[28] In addition to its financial impact, departures due to low morale can be sudden and devastating, leading to loss of team cohesiveness, increased work burden on the remaining workforce, burnout, and cascades of more turnover.[2] In contrast, when morale is high, workers more commonly go the extra mile, are more committed to the organization's mission, and are more supportive of their coworkers.[28]
While we asked the informants about plans to leave their job, there are many factors that drive an individual's intent and ultimate decision to make changes in his or her employment. Some factors are outside the control of the employer or practice leaders, such as change in an individual's family life or desire and opportunity to pursue fellowship training. Others variables, however, are more directly tied to the job or practice environment. In a specialty where providers are relatively mobile and turnover is high, it is important for hospitalist practices to cultivate a climate in which the sacrifices associated with leaving outweigh the promised benefits.[29]
Results from the HMPWS suggested the need to address climate and fairness issues in hospitalist programs to improve satisfaction and retention.[9] Two large healthcare systems achieved success by investing in multipronged physician retention strategies including recruiting advisors, sign‐on bonuses, extensive onboarding, family support, and the promotion of ongoing effective communication.[3, 30]
Our findings suggest that morale for hospitalists is a complex amalgam of contentment and importance, and that there may not be a one size fits all solution to improving morale for all. While we did not find a difference in personal morale scores across individual hospitalist groups, or even between academic and community groups, each group had a unique profile with variability in the dynamics between importance and contentment of different factors. If practice group leaders review HMI data for their providers and use the information to facilitate meaningful dialogue with them about the factors influencing their morale, such leaders will have great insight into allocating resources for the best return on investment.
While we believe that the HMI is providing unique perspective compared to other commonly used metrics, it may be best to employ HMI data as complementary measures alongside that of some of the benchmarked scales that explore job satisfaction, job fit, and burnout among hospitalists.[6, 9, 10, 31, 32, 33, 34, 35] Aggregate HMI data at the group level may allow for the identification of factors that are highly important to morale but scored low in contentment. Such factors deserve priority and attention such that the subgroups within a practice can collaborate to come to consensus on strategies for amelioration. Because the HMI generates a score and profile for each provider, we can imagine effective leaders using the HMI with individuals as part of an annual review to facilitate discussion about maximizing contentment at work. Being fully transparent and sharing an honest nonanonymous version of the HMI with a superior would require a special relationship founded on trust and mutual respect.
Several limitations of this study should be considered. First, the initial item reduction and EFA were based on a single‐site survey, and our overall sample size was relatively small. We plan on expanding our sample size in the future for further validation of our exploratory findings. Second, the data were collected at 2 specific times several years ago. In continuing to analyze the data from subsequent years, validity and reliability results remain stable, thereby minimizing the likelihood of significant historical bias. Third, there may have been some recall bias, in that respondents may have overlooked the good and perseverated over variables that disappointed them. Fourth, although intention to leave does not necessarily equate actual employee turnover, intention has been found to be a strong predictor of quitting a job.[36, 37] Finally, while we had high response rates, response bias may have existed wherein those with lower morale may have elected not to complete the survey or became apathetic in their responses.
The HMI is a validated instrument that evaluates hospitalist morale by incorporating each provider's characterization of the importance of and contentment with 27 variables. By accounting for the multidimensional and dynamic nature of morale, the HMI may help program leaders tailor retention and engagement strategies specific to their own group. Future studies may explore trends in contributors to morale and examine whether interventions to augment low morale can result in improved morale and hospitalist retention.
Acknowledgements
The authors are indebted to the hospitalists who were willing to share their perspectives about their work, and grateful to Ms. Lisa Roberts, Ms. Barbara Brigade, and Ms. Regina Landis for insuring confidentiality in managing the survey database.
Disclosures: Dr. Chandra had full access to all of the data in the study and takes responsibility for the integrity of the data and the accuracy of the data analysis. Dr. Wright is a Miller‐Coulson Family Scholar through the Johns Hopkins Center for Innovative Medicine. Ethical approval has been granted for studies involving human subjects by a Johns Hopkins University School of Medicine institutional review board. The authors report no conflicts of interest.
- 2014 State of Hospital Medicine Report. Philadelphia, PA: Society of Hospital Medicine; 2014.
- , , . A review of physician turnover: rates, causes, and consequences. Am J Med Qual. 2004;19(2):56–66.
- . Physician retention plans help reduce costs and optimize revenues. Healthc Financ Manage. 1998;52(1):75–77.
- SHM Career Satisfaction Task Force. A Challenge for a New Specialty: A White Paper on Hospitalist Career Satisfaction.; 2006. Available at: www.hospitalmedicine.org. Accessed February 28, 2009.
- , . Outcomes of physician job satisfaction: a narrative review, implications, and directions for future research. Health Care Manage Rev. 2003;28(2):119–139.
- , , , , . Characteristics and work experiences of hospitalists in the United States. Arch Intern Med. 2001;161(6):851–858.
- . Doing the same and earning less: male and female physicians in a new medical specialty. Inquiry. 2004;41(3):301–315.
- . Physician satisfaction and communication. National findings and best practices. Available at: http://www.pressganey.com/files/clark_cox_acpe_apr06.pdf. Accessed October 10, 2010.
- , , , , . Worklife and satisfaction of hospitalists: toward flourishing careers. J Gen Intern Med. 2012;27(1):28–36.
- , , , , ; Society of Hospital Medicine Career Satisfaction Task Force. Job characteristics, satisfaction, and burnout across hospitalist practice models. J Hosp Med. 2012;7(5):402–410.
- Morale | Define Morale at Dictionary.com. Morale | Define Morale at Dictionary.com. Morale | Define Morale at Dictionary.com. Available at: http://dictionary.reference.com/browse/morale. Accessed June 5, 2014.
- . Morale and satisfaction: a study in past‐future time perspective. Adm Sci Q. 1958:195–209.
- . Men and Women of the Corporation. 2nd ed. New York, NY: Basic Books; 1993.
- . The relation of morale to turnover among teachers. Am Educ Res J. 1965:163–173.
- . Structural and individual determinants of organization morale and satisfaction. Soc Forces. 1982;61:1088.
- , , . Morale matters: midlevel administrators and their intent to leave. J Higher Educ. 2000:34–59.
- . Factors influencing employee morale. Harv Bus Rev. 1950;28(1):61–73.
- . Dimensions of teacher morale. Am Educ Res J. 1970;7(2):221.
- , . The definition and measurement of employee morale. Adm Sci Q. 1958:157–184.
- , , , et al. Measuring physician job satisfaction in a changing workplace and a challenging environment. SGIM Career Satisfaction Study Group. Society of General Internal Medicine. Med Care. 1999;37(11):1174–1182.
- . Structural and individual determinants of organization morale and satisfaction. Soc Forces. 1983;61(4):1088–1108.
- . Morale and its measurement. Am J Sociol. 1941;47(3):406–414.
- , , , . Following morale over time within an academic hospitalist division. J Clin Outcomes Manag. 2011;18(1):21–26.
- , , , et al. Personal growth and its correlates during residency training. Med Educ. 2006;40(8):737–745.
- , , . A global measure of perceived stress. J Health Soc Behav. 1983:385–396.
- , , . Morale matters: midlevel administrators and their intent to leave. J Higher Educ. 2000;71(1):34–59.
- , . Faculty members' morale and their intention to leave: a multilevel explanation. J Higher Educ. 2002;73(4):518–542.
- , . Employee Morale. New York, NY: Palgrave Macmillan; 2009.
- , , , , . Silence Kills. Silence Kills: The Seven Crucial Conversations® for Healthcare. VitalSmarts™ in association with the American Association of Critical Care Nurses, USA. 2005. Accessed October 10, 2014.
- , , . The lifelong iterative process of physician retention. J Healthc Manag. 2009;54(4):220–226.
- . Physicians' burnout. Rev Prat. 2004;54(7):753–754.
- , , , , , . Work stress and health in primary health care physicians and hospital physicians. Occup Environ Med. 2008;65(5):364–366.
- , , , et al. Understanding physicians' intentions to withdraw from practice: the role of job satisfaction, job stress, mental and physical health. 2001. Health Care Manage Rev. 2010;35(2):105–115.
- , , , , , . Physician satisfaction and burnout at different career stages. Mayo Clin Proc. 2013;88(12):1358–1367.
- , . Burnout and Hospitalists: Etiology and Prevention. In: What Exactly Does A Hospitalist Do? Best of the Best Hospital Medicine 2005: Strategies for Success. Society of Hospital Medicine; 2005:5.
- , . Using job involvement and organizational commitment interactively to predict turnover. J Manage. 1989;15(1):115–127.
- , , , et al. Nurse turnover: a literature review. Int J Nurs Stud. 2006;43(2):237–263.
Explosive growth in hospital medicine has led to hospitalists having the option to change jobs easily. Annual turnover for all physicians is 6.8%, whereas that of hospitalists exceeds 14.8%.[1] Losing a single physician has significant financial and operational implications, with estimates of $20,000 to $120,000 in recruiting costs, and up to $500,000 in lost revenue that may take years to recoup due to the time required for new physician assimilation.[2, 3] In 2006, the Society of Hospital Medicine (SHM) appointed a career task force to develop retention recommendations, 1 of which includes monitoring hospitalists' job satisfaction.[4]
Studies examining physician satisfaction have demonstrated that high physician job satisfaction is associated with lower physician turnover.[5] However, surveys of hospitalists, including SHM's Hospital Medicine Physician Worklife Survey (HMPWS), have reported high job satisfaction among hospitalists,[6, 7, 8, 9, 10] suggesting that high job satisfaction may not be enough to overcome forces that pull hospitalists toward other opportunities.
Morale, a more complex construct related to an individual's contentment and happiness, might provide insight into reducing hospitalist turnover. Morale has been defined as the emotional or mental condition with respect to cheerfulness, confidence, or zeal and is especially relevant in the face of opposition or hardship.[11] Job satisfaction is 1 element that contributes to morale, but alone does not equate morale.[12] Morale, more than satisfaction, relates to how people see themselves within the group and may be closely tied to the concept of esprit de corps. To illustrate, workers may feel satisfied with the content of their job, but frustration with the organization may result in low morale.[13] Efforts focused on assessing provider morale may provide deeper understanding of hospitalists' professional needs and garner insight for retention strategies.
The construct of hospitalist morale and its underlying drivers has not been explored in the literature. Using literature within and outside of healthcare,[1, 12, 14, 15, 16, 17, 18, 19, 20, 21, 22] and our own prior work,[23] we sought to characterize elements that contribute to hospitalist morale and develop a metric to measure it. The HMPWS found that job satisfaction factors vary across hospitalist groups.[9] We suspected that the same would hold true for factors important to morale at the individual level. This study describes the development and validation of the Hospitalist Morale Index (HMI), and explores the relationship between morale and intent to leave due to unhappiness.
METHODS
2009 Pilot Survey
To establish content validity, after reviewing employee morale literature, and examining qualitative comments from our 2007 and 2008 morale surveys, our expert panel, consisting of practicing hospitalists, hospitalist leaders, and administrative staff, identified 46 potential drivers of hospitalist morale. In May 2009, all hospitalists, including physicians, nurse practitioners (NPs), and physician assistants (PAs) from a single hospitalist group received invitations to complete the pilot survey. We asked hospitalists to assess on 5‐point Likert scales the importance of (not at all to tremendously) and contentment with (extremely discontent to extremely content) each of the 46 items as it relates to their work morale. Also included were demographic questions and general morale questions (including rating participants' own morale), investment, long‐term career plans, and intent to leave due to unhappiness.
Data Collection
To maintain anonymity and limit social desirability bias, a database manager, working outside the Division of Hospital Medicine and otherwise not associated with the research team, used Survey Monkey to coordinate survey distribution and data collection. Each respondent had a unique identifier code that was unrelated to the respondent's name and email address. Personal identifiers were maintained in a secure database accessible only to the database manager.
Establishing Internal Structure Validity Evidence
Response frequency to each question was examined for irregularities in distribution. For continuous variables, descriptive statistics were examined for evidence of skewness, outliers, and non‐normality to ensure appropriate use of parametric statistical tests. Upon ranking importance ratings by mode, 15 of 46 items were judged to be of low importance by almost all participants and removed from further consideration.
Stata 13.1 (StataCorp, College Station, TX) was used for exploratory factor analysis (EFA) of the importance responses for all 31 remaining items by principal components factoring. Eigenvalues >1 were designated as a cutoff point for inclusion in varimax rotation. Factor loading of 0.50 was the threshold for inclusion in a factor.
The 31 items loaded across 10 factors; however, 3 factors included 1 item each. After reviewing the scree plot and considering their face value, these items/factors were omitted. Repeating the factor analysis resulted in a 28‐item, 7‐factor solution that accounted for 75% variance. All items were considered informative as demonstrated by low uniqueness scores (0.050.38). Using standard validation procedures, all 7 factors were found to have acceptable factor loadings (0.460.98) and face validity. Cronbach's quantified internal reliability of the 7 factors with scores ranging from 0.68 to 0.92. We named the resultant solution the Hospitalist Morale Index (HMI).
Establishing Response Process Validity Evidence
In developing the HMI, we asked respondents to rate the importance of and their contentment with each variable as related to their work morale. From pilot testing, which included discussions with respondents immediately after completing the survey, we learned that the 2‐part consideration of each variable resulted in thoughtful reflection about their morale. Further, by multiplying the contentment score for each item (scaled from 15) by the corresponding importance score (scaled 01), we quantified the relative contribution and contentment of each item for each hospitalist. Scaling importance scores from 0 to 1 insured that items that were not considered important to the respondent did not affect the respondent's personal morale score. Averaging resultant item scores that were greater than 0 resulted in a personal morale score for each hospitalist. Averaging item scores >0 that constituted each factor resulted in factor scores.
May 2011 Survey
The refined survey was distributed in May 2011 to a convenience sample of 5 hospitalist programs at separate hospitals (3 community hospitals, 2 academic hospitals) encompassing 108 hospitalists in 3 different states. Responses to the 2011 survey were used to complete confirmatory factor analyses (CFA) and establish further validity and reliability evidence.
Based on the 28‐item, 7‐factor solution developed from the pilot study, we developed the theoretical model of factors constituting hospitalist morale. We used the structural equation modeling command in Stata 13 to perform CFA. Factor loading of 0.50 was the threshold for inclusion of an item in a factor. To measure internal consistency, we considered Cronbach's score of 0.60 acceptable. Iterative models were reviewed to find the optimal solution for the data. Four items did not fit into any of the 5 resulting factors and were evaluated in terms of mean importance score and face value. Three items were considered important enough to warrant being stand‐alone items, whereas 1 was omitted. Two additional items had borderline factor loadings (0.48, 0.49) and were included in the model as stand‐alone items due to their overall relevance. The resultant solution was a 5‐factor model with 5 additional stand‐alone items (Table 1).
| Factor | Cronbach's | |||||
|---|---|---|---|---|---|---|
| Clinical | Workload | Leadership | Appreciation and Acknowledgement | Material Rewards | ||
| How much does the following item contribute to your morale? | ||||||
| Paperwork | 0.72 | 0.89 | ||||
| Relationship with patients | 0.69 | 0.90 | ||||
| Electronic medical system | 0.60 | 0.90 | ||||
| Intellectual stimulation | 0.59 | 0.90 | ||||
| Variety of cases | 0.58 | 0.90 | ||||
| Relationship with consultants | 0.51 | 0.89 | ||||
| No. of night shifts | 0.74 | 0.89 | ||||
| Patient census | 0.61 | 0.90 | ||||
| No. of shifts | 0.52 | 0.90 | ||||
| Fairness of leadership | 0.82 | 0.89 | ||||
| Effectiveness of leadership | 0.82 | 0.89 | ||||
| Leadership's receptiveness to my thoughts and suggestions | 0.78 | 0.89 | ||||
| Leadership as advocate for my needs | 0.77 | 0.89 | ||||
| Approachability of leadership | 0.77 | 0.89 | ||||
| Accessibility of leadership | 0.69 | 0.89 | ||||
| Alignment of the group's goals with my goals | 0.50 | 0.89 | ||||
| Recognition within the group | 0.82 | 0.89 | ||||
| Feeling valued within the institution | 0.73 | 0.89 | ||||
| Feeling valued within the group | 0.73 | 0.89 | ||||
| Feedback | 0.52 | 0.89 | ||||
| Pay | 0.99 | 0.90 | ||||
| Benefits | 0.56 | 0.89 | ||||
| Cronbach's | 0.78 | 0.65 | 0.89 | 0.78 | 0.71 | |
| How much does the following item contribute to your morale? | Single item indicators | |||||
| Family time | 0.90 | |||||
| Job security | 0.90 | |||||
| Institutional climate | 0.89 | |||||
| Opportunities for professional growth | 0.90 | |||||
| Autonomy | 0.89 | |||||
| Cronbach's | 0.90 | |||||
Establishing Convergent, Concurrent, and Discriminant Validity Evidence
To establish convergent, concurrent, and discriminant validity, linear and logistic regression models were examined for continuous and categorical data accordingly.
Self‐perceived overall work morale and perceived group morale, as assessed by 6‐point Likert questions with response options from terrible to excellent, were modeled as predictors for personal morale as calculated by the HMI.
Personal morale scores were modeled as predictors of professional growth, stress, investment in the group, and intent to leave due to unhappiness. While completing the HMI, hospitalists simultaneously completed a validated professional growth scale[24] and Cohen stress scale.[25] We hypothesized that those with higher morale would have more professional growth. Stress, although an important issue in the workplace, is a distinct construct from morale, and we did not expect a significant relationship between personal morale and stress. We used Pearson's r to assess the strength of association between the HMI and these scales. Participants' level of investment in their group was assessed on a 5‐point Likert scale. To simplify presentation, highly invested represents those claiming to be very or tremendously invested in the success of their current hospitalist group. Intent to leave due to unhappiness was assessed on a 5‐point Likert scale, I have had serious thoughts about leaving my current hospitalist group because I am unhappy, with responses from strongly disagree (1) to strongly agree (5). To simplify presentation, responses higher than 2 are considered to be consistent with intending to leave due to unhappiness.
Our institutional review board approved the study.
RESULTS
Respondents
In May 2009, 30 of the 33 (91%) invited hospitalists completed the original pilot morale survey; 19 (63%) were women. Eleven hospitalists (37%) had been part of the group 1 year or less, whereas 4 (13%) had been with the group for more than 5 years.
In May 2011, 93 of the 108 (86%) hospitalists from 5 hospitals completed the demographic and global parts of the survey. Fifty (53%) were from community hospitals; 47 (51%) were women. Thirty‐seven (40%) physicians and 6 (60%) NPs/PAs were from academic hospitals. Thirty‐nine hospitalists (42%) had been with their current group 1 year or less. Ten hospitalists (11%) had been with their current group over 5 years. Sixty‐three respondents (68%) considered themselves career hospitalists, whereas 5 (5%) did not; the rest were undecided.
Internal Structure Validity Evidence
The final CFA from the 2011 survey resulted in a 5‐factor plus 5stand‐alone‐items HMI. The solution with item‐level and factor‐level Cronbach's scores (range, 0.890.90 and range, 0.650.89, respectively) are shown in Table 1.
Personal Morale Scores and Factor Scores
Personal morale scores were normally distributed (mean = 2.79; standard deviation [SD] = 0.58), ranging from 1.23 to 4.22, with a theoretical low of 0 and high of 5 (Figure 1). Mean personal morale scores across hospitalist groups ranged from 2.70 to 2.99 (P > 0.05). Personal morale scores, factor sores and item scores for NPs and PAs did not significantly differ from those of physicians (P > 0.05 for all analyses). Personal morale scores were lower for those in their first 3 years with their current group, compared to those with greater institutional longevity. For every categorical increase in a participant's response to seeing oneself as a career hospitalist, the personal morale score rose 0.23 points (P < 0.001).
Factor scores for material reward and mean item scores for professional growth were significantly different across the 5 hospitalist groups (P = 0.03 and P < 0.001, respectively). Community hospitalists had significantly higher factor scores, despite having similar importance scores, for material rewards than academic hospitalists (diff. = 0.44, P = 0.02). Academic hospitalists had significantly higher scores for professional growth (diff. = 0.94, P < 0.001) (Table 2). Professional growth had the highest importance score for academic hospitalists (mean = 0.87, SD = 0.18) and the lowest importance score for community hospitalists (mean = 0.65, SD = 0.24, P < 0.001).
| Personal Morale Score | Factor 1 | Factor 2 | Factor 3 | Factor 4 | Factor 5 | Item 1 | Item 2 | Item 3 | Item 4 | Item 5 | ||
|---|---|---|---|---|---|---|---|---|---|---|---|---|
| Clinical | Workload | Leadership | Appreciation and Acknowledgement | Material Rewards | Family Time | Institutional Climate | Job Security | Autonomy | Professional Growth | |||
| ||||||||||||
| All participants | Mean | 2.79 | 2.54 | 2.78 | 3.18 | 2.58 | 2.48 | 3.05 | 2.67 | 2.92 | 3.00 | 2.76 |
| SD | 0.58 | 0.63 | 0.70 | 0.95 | 0.86 | 0.85 | 1.15 | 0.97 | 1.11 | 1.10 | 1.21 | |
| Academic A | Mean | 2.77 | 2.43 | 2.92 | 3.10 | 2.54 | 2.28 | 3.16 | 2.70 | 3.06 | 3.20 | 3.08 |
| SD | 0.57 | 0.62 | 0.64 | 0.92 | 0.84 | 0.77 | 1.19 | 0.95 | 1.08 | 1.12 | 1.24 | |
| Academic B | Mean | 2.99 | 2.58 | 2.99 | 3.88 | 2.69 | 2.00 | 2.58 | 2.13 | 1.65 | 3.29 | 4.33 |
| SD | 0.36 | 0.70 | 0.80 | 0.29 | 0.80 | 0.35 | 0.92 | 0.88 | 0.78 | 1.01 | 0.82 | |
| Community A | Mean | 2.86 | 2.61 | 2.51 | 3.23 | 2.73 | 3.03 | 2.88 | 2.84 | 2.95 | 3.23 | 2.66 |
| SD | 0.75 | 0.79 | 0.68 | 1.21 | 1.11 | 1.14 | 1.37 | 1.17 | 0.98 | 1.24 | 1.15 | |
| Community B | Mean | 2.86 | 2.74 | 2.97 | 3.37 | 2.67 | 2.44 | 3.28 | 2.35 | 2.70 | 2.50 | 2.25 |
| SD | 0.67 | 0.55 | 0.86 | 1.04 | 0.94 | 0.87 | 1.00 | 1.15 | 1.40 | 0.72 | 1.26 | |
| Community C | Mean | 2.70 | 2.56 | 2.64 | 2.99 | 2.47 | 2.53 | 3.03 | 2.79 | 3.07 | 2.68 | 2.15 |
| SD | 0.49 | 0.53 | 0.67 | 0.85 | 0.73 | 0.64 | 1.08 | 0.76 | 1.05 | 1.07 | 0.71 | |
| Academic combined | Mean | 2.80 | 2.45 | 2.93 | 3.22 | 2.56 | 2.24 | 3.07 | 2.62 | 2.88 | 3.21 | 3.28 |
| SD | 0.54 | 0.63 | 0.66 | 0.89 | 0.82 | 0.72 | 1.16 | 0.95 | 1.14 | 1.10 | 1.26 | |
| Community combined | Mean | 2.79 | 2.61 | 2.66 | 3.14 | 2.60 | 2.68 | 3.03 | 2.72 | 2.95 | 2.82 | 2.34 |
| SD | 0.62 | 0.62 | 0.72 | 1.01 | 0.90 | 0.90 | 1.15 | 0.99 | 1.09 | 1.09 | 1.00 | |
| P value | >0.05 | >0.05 | >0.05 | >0.05 | >0.05 | 0.02 | >0.05 | >0.05 | >0.05 | >0.05 | <0.001 | |
Convergent, Concurrent, and Discriminant Validity Evidence
For every categorical increase on the question assessing overall morale, the personal morale score was 0.23 points higher (P < 0.001). For every categorical increase in a participant's perception of the group's morale, the personal morale score was 0.29 points higher (P < 0.001).
For every 1‐point increase in personal morale score, the odds of being highly invested in the group increased by 5 times (odds ratio [OR]: 5.23, 95% confidence interval [CI]: 1.91‐14.35, P = 0.001). The mean personal morale score for highly invested hospitalists was 2.92, whereas that of those less invested was 2.43 (diff. = 0.49, P < 0.001) (Table 3). Highly invested hospitalists had significantly higher importance factor scores for leadership (diff. = 0.08, P = 0.03) as well as appreciation and acknowledgement (diff. = 0.08, P = 0.02).
| Personal Morale Score | Factor 1 | Factor 2 | Factor 3 | Factor 4 | Factor 5 | Item 1 | Item 2 | Item 3 | Item 4 | Item 5 | |
|---|---|---|---|---|---|---|---|---|---|---|---|
| Clinical | Workload | Leadership | Appreciation and Acknowledgement | Material Rewards | Family Time | Institutional Climate | Job Security | Autonomy | Professional Growth | ||
| |||||||||||
| Highly invested in success of current hospitalist group | |||||||||||
| Mean | 2.92 | 2.61 | 2.89 | 3.38 | 2.78 | 2.45 | 3.21 | 2.78 | 2.86 | 3.10 | 2.95 |
| SD | 0.55 | 0.59 | 0.68 | 0.92 | 0.88 | 0.77 | 1.11 | 1.00 | 1.09 | 1.06 | 1.25 |
| Less invested in success of current hospitalist group | |||||||||||
| Mean | 2.43 | 2.34 | 2.48 | 2.60 | 2.02 | 2.57 | 2.60 | 2.38 | 3.08 | 2.69 | 2.24 |
| SD | 0.52 | 0.69 | 0.69 | 0.81 | 0.49 | 1.04 | 1.17 | 0.83 | 1.18 | 1.19 | 0.94 |
| P value | <0.001 | >0.05 | 0.02 | 0.001 | <0.001 | >0.05 | 0.03 | >0.05 | >0.05 | >0.05 | 0.02 |
| Not intending to leave because unhappy | |||||||||||
| Mean | 2.97 | 2.67 | 2.89 | 3.48 | 2.77 | 2.52 | 3.24 | 2.85 | 3.05 | 3.06 | 3.01 |
| SD | 0.51 | 0.54 | 0.61 | 0.91 | 0.89 | 0.78 | 1.03 | 0.99 | 1.10 | 1.07 | 1.25 |
| Intending to leave current group because unhappy | |||||||||||
| Mean | 2.45 | 2.30 | 2.59 | 2.59 | 2.21 | 2.40 | 2.68 | 2.33 | 2.67 | 2.88 | 2.28 |
| SD | 0.56 | 0.72 | 0.82 | 0.74 | 0.68 | 0.97 | 1.29 | 0.83 | 1.11 | 1.17 | 0.97 |
| P value | <0.001 | 0.01 | >0.05 | <0.001 | 0.003 | >0.05 | 0.03 | 0.01 | >0.05 | >0.05 | 0.01 |
Every 1‐point increase in personal morale was associated with a rise of 2.27 on the professional growth scale (P = 0.01). The correlation between these 2 scales was 0.26 (P = 0.01). Every 1‐point increase in personal morale was associated with a 2.21 point decrease on the Cohen stress scale (P > 0.05). The correlation between these 2 scales was 0.21 (P > 0.05).
Morale and Intent to Leave Due to Unhappiness
Sixteen (37%) academic and 18 (36%) community hospitalists reported having thoughts of leaving their current hospitalist program due to unhappiness. The mean personal morale score for hospitalists with no intent to leave their current group was 2.97, whereas that of those with intent to leave was 2.45 (diff. = 0.53, P < 0.001). Each 1‐point increase in the personal morale score was associated with an 85% decrease (OR: 0.15, 95% CI: 0.05‐0.41, P < 0.001) in the odds of leaving because of unhappiness. Holding self‐perception of being a career hospitalist constant, each 1‐point increase in the personal morale score was associated with an 83% decrease (OR: 0.17, 95% CI: 0.05‐0.51, P = 0.002) in the odds of leaving because of unhappiness. Hospitalists who reported intent to leave had significantly lower factor scores for all factors and items except workload, material reward, and autonomy than those who did not report intent to leave (Table 3). Within the academic groups, those who reported intent to leave had significantly lower scores for professional growth (diff. = 1.08, P = 0.01). For community groups, those who reported intent to leave had significantly lower scores for clinical work (diff. = 0.54, P = 0.003), workload (diff. = 0.50, P = 0.02), leadership (diff. = 1.19, P < 0.001), feeling appreciated and acknowledged (diff. = 0.68, P = 0.01), job security (diff. = 0.70, P = 0.03), and institutional climate (diff. = 0.67, P = 0.02) than those who did not report intent to leave.
DISCUSSION
The HMI is a validated tool that objectively measures and quantifies hospitalist morale. The HMI's capacity to comprehensively assess morale comes from its breadth and depth in uncovering work‐related areas that may be sources of contentment or displeasure. Furthermore, the fact that HMI scores varied among groups of individuals, including those who are thinking about leaving their hospitalist group because they are unhappy and those who are highly invested in their hospitalist group, speaks to its ability to highlight and account for what is most important to hospitalist providers.
Low employee morale has been associated with decreased productivity, increased absenteeism, increased turnover, and decreased patient satisfaction.[2, 26, 27, 28] A few frustrated workers can breed group discontentment and lower the entire group's morale.[28] In addition to its financial impact, departures due to low morale can be sudden and devastating, leading to loss of team cohesiveness, increased work burden on the remaining workforce, burnout, and cascades of more turnover.[2] In contrast, when morale is high, workers more commonly go the extra mile, are more committed to the organization's mission, and are more supportive of their coworkers.[28]
While we asked the informants about plans to leave their job, there are many factors that drive an individual's intent and ultimate decision to make changes in his or her employment. Some factors are outside the control of the employer or practice leaders, such as change in an individual's family life or desire and opportunity to pursue fellowship training. Others variables, however, are more directly tied to the job or practice environment. In a specialty where providers are relatively mobile and turnover is high, it is important for hospitalist practices to cultivate a climate in which the sacrifices associated with leaving outweigh the promised benefits.[29]
Results from the HMPWS suggested the need to address climate and fairness issues in hospitalist programs to improve satisfaction and retention.[9] Two large healthcare systems achieved success by investing in multipronged physician retention strategies including recruiting advisors, sign‐on bonuses, extensive onboarding, family support, and the promotion of ongoing effective communication.[3, 30]
Our findings suggest that morale for hospitalists is a complex amalgam of contentment and importance, and that there may not be a one size fits all solution to improving morale for all. While we did not find a difference in personal morale scores across individual hospitalist groups, or even between academic and community groups, each group had a unique profile with variability in the dynamics between importance and contentment of different factors. If practice group leaders review HMI data for their providers and use the information to facilitate meaningful dialogue with them about the factors influencing their morale, such leaders will have great insight into allocating resources for the best return on investment.
While we believe that the HMI is providing unique perspective compared to other commonly used metrics, it may be best to employ HMI data as complementary measures alongside that of some of the benchmarked scales that explore job satisfaction, job fit, and burnout among hospitalists.[6, 9, 10, 31, 32, 33, 34, 35] Aggregate HMI data at the group level may allow for the identification of factors that are highly important to morale but scored low in contentment. Such factors deserve priority and attention such that the subgroups within a practice can collaborate to come to consensus on strategies for amelioration. Because the HMI generates a score and profile for each provider, we can imagine effective leaders using the HMI with individuals as part of an annual review to facilitate discussion about maximizing contentment at work. Being fully transparent and sharing an honest nonanonymous version of the HMI with a superior would require a special relationship founded on trust and mutual respect.
Several limitations of this study should be considered. First, the initial item reduction and EFA were based on a single‐site survey, and our overall sample size was relatively small. We plan on expanding our sample size in the future for further validation of our exploratory findings. Second, the data were collected at 2 specific times several years ago. In continuing to analyze the data from subsequent years, validity and reliability results remain stable, thereby minimizing the likelihood of significant historical bias. Third, there may have been some recall bias, in that respondents may have overlooked the good and perseverated over variables that disappointed them. Fourth, although intention to leave does not necessarily equate actual employee turnover, intention has been found to be a strong predictor of quitting a job.[36, 37] Finally, while we had high response rates, response bias may have existed wherein those with lower morale may have elected not to complete the survey or became apathetic in their responses.
The HMI is a validated instrument that evaluates hospitalist morale by incorporating each provider's characterization of the importance of and contentment with 27 variables. By accounting for the multidimensional and dynamic nature of morale, the HMI may help program leaders tailor retention and engagement strategies specific to their own group. Future studies may explore trends in contributors to morale and examine whether interventions to augment low morale can result in improved morale and hospitalist retention.
Acknowledgements
The authors are indebted to the hospitalists who were willing to share their perspectives about their work, and grateful to Ms. Lisa Roberts, Ms. Barbara Brigade, and Ms. Regina Landis for insuring confidentiality in managing the survey database.
Disclosures: Dr. Chandra had full access to all of the data in the study and takes responsibility for the integrity of the data and the accuracy of the data analysis. Dr. Wright is a Miller‐Coulson Family Scholar through the Johns Hopkins Center for Innovative Medicine. Ethical approval has been granted for studies involving human subjects by a Johns Hopkins University School of Medicine institutional review board. The authors report no conflicts of interest.
- 2014 State of Hospital Medicine Report. Philadelphia, PA: Society of Hospital Medicine; 2014.
- , , . A review of physician turnover: rates, causes, and consequences. Am J Med Qual. 2004;19(2):56–66.
- . Physician retention plans help reduce costs and optimize revenues. Healthc Financ Manage. 1998;52(1):75–77.
- SHM Career Satisfaction Task Force. A Challenge for a New Specialty: A White Paper on Hospitalist Career Satisfaction.; 2006. Available at: www.hospitalmedicine.org. Accessed February 28, 2009.
- , . Outcomes of physician job satisfaction: a narrative review, implications, and directions for future research. Health Care Manage Rev. 2003;28(2):119–139.
- , , , , . Characteristics and work experiences of hospitalists in the United States. Arch Intern Med. 2001;161(6):851–858.
- . Doing the same and earning less: male and female physicians in a new medical specialty. Inquiry. 2004;41(3):301–315.
- . Physician satisfaction and communication. National findings and best practices. Available at: http://www.pressganey.com/files/clark_cox_acpe_apr06.pdf. Accessed October 10, 2010.
- , , , , . Worklife and satisfaction of hospitalists: toward flourishing careers. J Gen Intern Med. 2012;27(1):28–36.
- , , , , ; Society of Hospital Medicine Career Satisfaction Task Force. Job characteristics, satisfaction, and burnout across hospitalist practice models. J Hosp Med. 2012;7(5):402–410.
- Morale | Define Morale at Dictionary.com. Morale | Define Morale at Dictionary.com. Morale | Define Morale at Dictionary.com. Available at: http://dictionary.reference.com/browse/morale. Accessed June 5, 2014.
- . Morale and satisfaction: a study in past‐future time perspective. Adm Sci Q. 1958:195–209.
- . Men and Women of the Corporation. 2nd ed. New York, NY: Basic Books; 1993.
- . The relation of morale to turnover among teachers. Am Educ Res J. 1965:163–173.
- . Structural and individual determinants of organization morale and satisfaction. Soc Forces. 1982;61:1088.
- , , . Morale matters: midlevel administrators and their intent to leave. J Higher Educ. 2000:34–59.
- . Factors influencing employee morale. Harv Bus Rev. 1950;28(1):61–73.
- . Dimensions of teacher morale. Am Educ Res J. 1970;7(2):221.
- , . The definition and measurement of employee morale. Adm Sci Q. 1958:157–184.
- , , , et al. Measuring physician job satisfaction in a changing workplace and a challenging environment. SGIM Career Satisfaction Study Group. Society of General Internal Medicine. Med Care. 1999;37(11):1174–1182.
- . Structural and individual determinants of organization morale and satisfaction. Soc Forces. 1983;61(4):1088–1108.
- . Morale and its measurement. Am J Sociol. 1941;47(3):406–414.
- , , , . Following morale over time within an academic hospitalist division. J Clin Outcomes Manag. 2011;18(1):21–26.
- , , , et al. Personal growth and its correlates during residency training. Med Educ. 2006;40(8):737–745.
- , , . A global measure of perceived stress. J Health Soc Behav. 1983:385–396.
- , , . Morale matters: midlevel administrators and their intent to leave. J Higher Educ. 2000;71(1):34–59.
- , . Faculty members' morale and their intention to leave: a multilevel explanation. J Higher Educ. 2002;73(4):518–542.
- , . Employee Morale. New York, NY: Palgrave Macmillan; 2009.
- , , , , . Silence Kills. Silence Kills: The Seven Crucial Conversations® for Healthcare. VitalSmarts™ in association with the American Association of Critical Care Nurses, USA. 2005. Accessed October 10, 2014.
- , , . The lifelong iterative process of physician retention. J Healthc Manag. 2009;54(4):220–226.
- . Physicians' burnout. Rev Prat. 2004;54(7):753–754.
- , , , , , . Work stress and health in primary health care physicians and hospital physicians. Occup Environ Med. 2008;65(5):364–366.
- , , , et al. Understanding physicians' intentions to withdraw from practice: the role of job satisfaction, job stress, mental and physical health. 2001. Health Care Manage Rev. 2010;35(2):105–115.
- , , , , , . Physician satisfaction and burnout at different career stages. Mayo Clin Proc. 2013;88(12):1358–1367.
- , . Burnout and Hospitalists: Etiology and Prevention. In: What Exactly Does A Hospitalist Do? Best of the Best Hospital Medicine 2005: Strategies for Success. Society of Hospital Medicine; 2005:5.
- , . Using job involvement and organizational commitment interactively to predict turnover. J Manage. 1989;15(1):115–127.
- , , , et al. Nurse turnover: a literature review. Int J Nurs Stud. 2006;43(2):237–263.
© 2016 Society of Hospital Medicine
