User login
Immune status linked to outcomes of CAR T-cell therapy
MAINZ/FRANKFURT, GERMANY—Outcomes of treatment with a third-generation chimeric antigen receptor (CAR) T-cell therapy are associated with a patient’s immune status, according to a phase 1/2a trial.
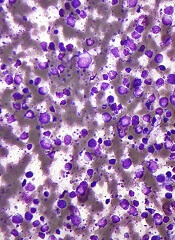
The CD19-specific CAR T-cell therapy produced a complete response (CR) in 6 of 15 patients with relapsed/refractory CD19-positive leukemia or lymphoma.
Though all responders eventually relapsed, 4 patients—including 2 with stable disease (SD) after treatment—responded to subsequent therapy and are still alive, 1 of them beyond 36 months.
An analysis of blood samples taken throughout the study revealed that a patient’s immune status was associated with treatment failure and overall survival.
Tanja Lövgren, PhD, of Uppsala University in Sweden, and her colleagues presented these findings at the Third CRI-CIMT-EATI-AACR International Cancer Immunotherapy Conference: Translating Science into Survival (abstract B156).
“CD19-specific CAR T-cell therapy has yielded remarkable response rates for patients who have B-cell acute lymphoblastic leukemia,” Dr Lövgren said. “However, many patients relapse.”
“In addition, response rates are more variable for patients who have other CD19-positive B-cell malignancies, and many patients experience serious adverse events. We set out to investigate the safety and effectiveness of a third-generation CD19-specific CAR T-cell therapy and to identify potential biomarkers of treatment outcome.”
Dr Lövgren and her colleagues studied 15 patients (ages 24-72) who had relapsed or refractory CD19-positive B-cell malignancies:
- Six patients with diffuse large B-cell lymphoma (DLBCL), including 3 cases that were transformed from follicular lymphoma (FL)
- Four patients with pre-B acute lymphoblastic leukemia (ALL)
- Two patients with mantle cell lymphoma (MCL)
- Two patients with chronic lymphocytic leukemia (CLL)
- One patient with FL transformed from Burkitt lymphoma.
Eleven patients received preconditioning with cyclophosphamide (500 mg/m2) and fludarabine (3 doses at 25 mg/m2).
All patients received CAR T cells at 1 x 10⁸, 2 x 10⁷, or 2 x 10⁸ cells/m2. These were autologous, CD19-targeting CAR T cells with 3 intracellular signaling domains derived from CD3 zeta, CD28, and 4-1BB.
The researchers assessed tumor responses via bone marrow/blood analysis and/or radiology, depending on the type of malignancy. The team also collected blood samples before CAR T-cell infusion and at multiple times after infusion.
Efficacy and safety
Six patients achieved a CR to treatment—3 with DLBCL (1 transformed), 2 with ALL, and 1 with CLL. Two patients had SD—1 with MCL and 1 with CLL. The remaining patients progressed.
All patients with a CR eventually relapsed. The median duration of CR was 5 months (range, 3-24 months).
Four patients—2 complete responders and 2 with SD—responded well to subsequent therapy and are still alive with 27 to 36 months of follow-up. This includes 1 patient with DLBCL, 1 with MCL, and 2 with CLL.
Four patients had serious adverse events. Three had cytokine-release syndrome, and 2 had neurological toxicity.
All cases of cytokine-release syndrome resolved after treatment with corticosteroids/anti-IL6R therapy. The neurological toxicity resolved spontaneously.
Immune status
An analysis of the blood samples taken throughout the study showed that high levels of monocytic myeloid-derived suppressor cells (MDSCs) prior to treatment was associated with decreased overall survival. In addition, increased levels of MDSCs after treatment preceded treatment failure.
Furthermore, high plasma levels of immunosuppressive factors—such as PD-L1 and PD-L2—after treatment were associated with decreased overall survival.
High plasma levels of biomarkers of an immunostimulatory environment—including IL-12, DC-LAMP, TRAIL, and FasL—before the administration of CAR T-cell therapy was associated with increased overall survival.
“[A]n immunostimulatory environment was associated with improved overall survival, while immunosuppressive cells and factors were associated with treatment failure and decreased overall survival,” Dr Lövgren said.
“We are hoping to follow up this study with another clinical trial that will combine CAR T-cell therapy with chemotherapy known to decrease the number of monocytic myeloid-derived suppressive cells. We are also looking to further optimize the CAR T-cell therapy.”
Dr Lövgren said the main limitations of this study are that it only included 15 patients, the patients had several different malignancies, and some patients may have been too sick to respond to any treatment.
This study was supported by funds from AFA Insurance AB, the Swedish Cancer Society, the Swedish Research Council, the Lions Fund at Uppsala University Hospital, and the Swedish State Support for Clinical Research. Dr Lövgren declared no conflicts of interest. ![]()
MAINZ/FRANKFURT, GERMANY—Outcomes of treatment with a third-generation chimeric antigen receptor (CAR) T-cell therapy are associated with a patient’s immune status, according to a phase 1/2a trial.
The CD19-specific CAR T-cell therapy produced a complete response (CR) in 6 of 15 patients with relapsed/refractory CD19-positive leukemia or lymphoma.
Though all responders eventually relapsed, 4 patients—including 2 with stable disease (SD) after treatment—responded to subsequent therapy and are still alive, 1 of them beyond 36 months.
An analysis of blood samples taken throughout the study revealed that a patient’s immune status was associated with treatment failure and overall survival.
Tanja Lövgren, PhD, of Uppsala University in Sweden, and her colleagues presented these findings at the Third CRI-CIMT-EATI-AACR International Cancer Immunotherapy Conference: Translating Science into Survival (abstract B156).
“CD19-specific CAR T-cell therapy has yielded remarkable response rates for patients who have B-cell acute lymphoblastic leukemia,” Dr Lövgren said. “However, many patients relapse.”
“In addition, response rates are more variable for patients who have other CD19-positive B-cell malignancies, and many patients experience serious adverse events. We set out to investigate the safety and effectiveness of a third-generation CD19-specific CAR T-cell therapy and to identify potential biomarkers of treatment outcome.”
Dr Lövgren and her colleagues studied 15 patients (ages 24-72) who had relapsed or refractory CD19-positive B-cell malignancies:
- Six patients with diffuse large B-cell lymphoma (DLBCL), including 3 cases that were transformed from follicular lymphoma (FL)
- Four patients with pre-B acute lymphoblastic leukemia (ALL)
- Two patients with mantle cell lymphoma (MCL)
- Two patients with chronic lymphocytic leukemia (CLL)
- One patient with FL transformed from Burkitt lymphoma.
Eleven patients received preconditioning with cyclophosphamide (500 mg/m2) and fludarabine (3 doses at 25 mg/m2).
All patients received CAR T cells at 1 x 10⁸, 2 x 10⁷, or 2 x 10⁸ cells/m2. These were autologous, CD19-targeting CAR T cells with 3 intracellular signaling domains derived from CD3 zeta, CD28, and 4-1BB.
The researchers assessed tumor responses via bone marrow/blood analysis and/or radiology, depending on the type of malignancy. The team also collected blood samples before CAR T-cell infusion and at multiple times after infusion.
Efficacy and safety
Six patients achieved a CR to treatment—3 with DLBCL (1 transformed), 2 with ALL, and 1 with CLL. Two patients had SD—1 with MCL and 1 with CLL. The remaining patients progressed.
All patients with a CR eventually relapsed. The median duration of CR was 5 months (range, 3-24 months).
Four patients—2 complete responders and 2 with SD—responded well to subsequent therapy and are still alive with 27 to 36 months of follow-up. This includes 1 patient with DLBCL, 1 with MCL, and 2 with CLL.
Four patients had serious adverse events. Three had cytokine-release syndrome, and 2 had neurological toxicity.
All cases of cytokine-release syndrome resolved after treatment with corticosteroids/anti-IL6R therapy. The neurological toxicity resolved spontaneously.
Immune status
An analysis of the blood samples taken throughout the study showed that high levels of monocytic myeloid-derived suppressor cells (MDSCs) prior to treatment was associated with decreased overall survival. In addition, increased levels of MDSCs after treatment preceded treatment failure.
Furthermore, high plasma levels of immunosuppressive factors—such as PD-L1 and PD-L2—after treatment were associated with decreased overall survival.
High plasma levels of biomarkers of an immunostimulatory environment—including IL-12, DC-LAMP, TRAIL, and FasL—before the administration of CAR T-cell therapy was associated with increased overall survival.
“[A]n immunostimulatory environment was associated with improved overall survival, while immunosuppressive cells and factors were associated with treatment failure and decreased overall survival,” Dr Lövgren said.
“We are hoping to follow up this study with another clinical trial that will combine CAR T-cell therapy with chemotherapy known to decrease the number of monocytic myeloid-derived suppressive cells. We are also looking to further optimize the CAR T-cell therapy.”
Dr Lövgren said the main limitations of this study are that it only included 15 patients, the patients had several different malignancies, and some patients may have been too sick to respond to any treatment.
This study was supported by funds from AFA Insurance AB, the Swedish Cancer Society, the Swedish Research Council, the Lions Fund at Uppsala University Hospital, and the Swedish State Support for Clinical Research. Dr Lövgren declared no conflicts of interest. ![]()
Survey reveals lack of specialized care for AYAs with cancer

MADRID—New research indicates there is a lack of specialized care in Europe for adolescents and young adults (AYAs) with cancer.
In a survey of more than 200 European healthcare professionals, more than two-thirds of respondents said they did not have access to specialized services where adult and pediatric cancer specialists work together to plan treatment and deliver care to AYAs with cancer.
This lack of services was more pronounced in Eastern and Southern Europe than Western and Northern Europe.
“The survey found gaps and disparities in cancer care for adolescents and young adults across Europe,” said study author Emmanouil Saloustros, MD, a consultant medical oncologist at General Hospital of Heraklion “Venizelio” in Heraklion, Crete, Greece.
Dr Saloustros and his colleagues presented these findings at the ESMO 2017 Congress (abstract 1438O_PR) and reported them in ESMO Open.
The researchers sent an online survey on the status of care and research in AYAs (ages 15-39) to members of the European Society for Medical Oncology (ESMO) and the European Society for Paediatric Oncology (SIOPE).
The team received responses from 266 healthcare professionals across Europe—55% of them female. Eleven percent were age 20–29, 29% were age 30–39, 26% were age 40–49, 25% were age 50–59, and 9% were age 60 and older.
Forty-eight percent were medical oncologists, 21% were pediatric oncologists, 8% were in training, 5% were hematologists, 4% were radiation oncologists, and 2% were surgical oncologists. The rest were other types of healthcare professionals, such as oncology nurses.
Fifty-two percent of respondents worked in general academic centers, 19% in specialized cancer hospitals, and 11% in pediatric hospitals. Sixty percent of respondents had been trained to treat adults with cancer, 25% to treat pediatric cancer patients, and 15% were trained to treat both.
In the past year, 32% of respondents had treated between 1 and 10 AYAs, 28% had treated 11 to 20, 17% had treated between 21 and 50, and 16% had treated more than 50 AYAs.
Results
The following results are based on data from 242 survey respondents. (The other respondents did not provide complete information.)
More than two-thirds (67%) of the respondents said they did not have access to specialized services for AYAs with cancer. This was true for 88% of respondents in Southern Europe, 87% in Eastern Europe, 55% in Western Europe, and 40% in Northern Europe.
Sixty-two percent of hematologists said they had access to AYA services, as did 44% of pediatric oncologists and 27% of medical oncologists.
Eighty-six percent of respondents said their AYA patients had access to professional psychological support. This was true for 97% of respondents in Western Europe, 82% in Southern Europe, 81% in Northern Europe, and 74% in Eastern Europe.
Fifty-four percent of all respondents said their AYAs had access to a support group with other young people. This was true for 81% of respondents in Northern Europe, 60% in Western Europe, 48% in Eastern Europe, and 34% in Southern Europe.
Thirty-six percent of all respondents said their AYAs had access to an age-specific specialist nurse. This was true for 53% of respondents in Western Europe, 51% in Northern Europe, 32% in Eastern Europe, and 10% in Southern Europe.
Sixty-two percent of respondents said their institution provided AYAs with access to a fertility specialist. This was true for 78% of respondents in Western Europe, 72% in Northern Europe, 52% in Southern Europe, and 24% in Eastern Europe.
“These patients have specific needs that are not covered by pediatric or general oncology centers or classical medical oncology centers, and this survey shows that most do not have access to the recommended special care,” said Gilles Vassal, director of clinical research at Gustave Roussy in Villejuif, France, and past president of SIOPE (who was not involved in this study).
“Countries without these services can look at existing examples—such as in the UK and France—to build teams equipped to improve survival and survivorship for adolescents and young adults with cancer.” ![]()
Report details progress, obstacles in cancer research and care
Deaths from cancer are on the decline in the US, but new cases of cancer are on the rise, according to the 7th annual American Association for Cancer Research (AACR) Cancer Progress Report.
The data suggest the cancer death rate declined by 35% from 1991 to 2014 for children and by 25% for adults, a reduction that translates to 2.1 million cancer deaths avoided.
However, 600,920 people in the US are projected to die from cancer in 2017.
And the number of new cancer cases is predicted to rise from 1.7 million in 2017 to 2.3 million in 2030.
The report also estimates there will be 62,130 new cases of leukemia in 2017 and 24,500 leukemia deaths this year.
This includes:
- 5970 cases of acute lymphocytic leukemia and 1440 deaths
- 20,110 cases of chronic lymphocytic leukemia and 4660 deaths
- 21,380 cases of acute myeloid leukemia (AML) and 10,590 deaths
- 8950 cases of chronic myeloid leukemia and 1080 deaths.
The estimate for lymphomas is 80,500 new cases and 21,210 deaths.
This includes:
- 8260 cases of Hodgkin lymphoma (HL) and 1070 deaths
- 72,240 cases of non-Hodgkin lymphoma and 20,140 deaths.
The estimate for myeloma is 30,280 new cases and 12,590 deaths.
The report says the estimated new cases of cancer are based on cancer incidence rates from 49 states and the District of Columbia from 1995 through 2013, as reported by the North American Association of Central Cancer Registries. This represents about 98% of the US population.
The estimated deaths are based on US mortality data from 1997 through 2013, taken from the National Center for Health Statistics of the Centers for Disease Control and Prevention.
Drug approvals
The AACR report notes that, between August 1, 2016, and July 31, 2017, the US Food and Drug Administration (FDA) approved new uses for 15 anticancer agents, 9 of which had no previous FDA approval.
Five of the agents are immunotherapies, which the report dubs “revolutionary treatments that are increasing survival and improving quality of life for patients.”
Among the recently approved therapies are 3 used for hematology indications:
- Ibrutinib (Imbruvica), approved to treat patients with relapsed/refractory marginal zone lymphoma who require systemic therapy and have received at least 1 prior anti-CD20-based therapy
- Midostaurin (Rydapt), approved as monotherapy for adults with advanced systemic mastocytosis and for use in combination with standard cytarabine and daunorubicin induction, followed by cytarabine consolidation, in adults with newly diagnosed AML who are FLT3 mutation-positive, as detected by an FDA-approved test.
- Pembrolizumab (Keytruda), approved to treat adult and pediatric patients with refractory classical HL or those with classical HL who have relapsed after 3 or more prior lines of therapy.
Disparities and costs
The AACR report points out that advances against cancer have not benefited everyone equally, and cancer health disparities are some of the most pressing challenges.
Among the disparities listed is the fact that adolescents and young adults (ages 15 to 39) with AML have a 5-year relative survival rate that is 22% lower than that of children (ages 1 to 14) with AML.
And Hispanic children are 24% more likely to develop leukemia than non-Hispanic children.
Another concern mentioned in the report is the cost of cancer care. The direct medical costs of cancer care in 2014 were estimated to be nearly $87.6 billion. This number does not include the indirect costs of lost productivity due to cancer-related morbidity and mortality.
With this in mind, the AACR is calling for a $2 billion increase in funding for the National Institutes of Health in fiscal year 2018, for a total funding level of $36.2 billion.
The AACR also recommends an $80 million increase in the FDA budget, bringing it to $2.8 billion for fiscal year 2018. ![]()
Study raises questions about anemia in astronauts
Previous research has suggested that astronauts develop anemia during space flight, but a new study indicates this is not the case for astronauts on long space missions.
“There is an idea of ‘space anemia’ that is associated with space flight,” said Richard Simpson, PhD, of the University of Houston in Texas.
“However, this is based on blood samples from astronauts collected after flight, which may be influenced by various factors—for example, the stress of landing and re-adaptation to conditions on Earth.”
“For this study . . ., living, whole blood samples were collected during space flight and returned to Earth for analysis. This unique sample allowed us to track hematological parameters—such as concentrations of red blood cells, hemoglobin, or hematocrit—in astronauts on board the International Space Station during flight.”
Dr Simpson and his colleagues reported their findings in BMC Hematology.
The researchers found that, during space flight, concentrations of red blood cells (RBCs), platelets, and hemoglobin were higher compared to pre-flight levels. Hematocrit also increased significantly during space flight.
While previous studies had shown this to be the case during the first few days of flight, this is the first study to show that RBC concentrations and hematocrit remain at higher levels even after astronauts’ bodies have adapted to microgravity.
To find out how the blood of astronauts may change if they spend a long time in space, the researchers collected blood samples from 31 astronauts who spent up to 6 months on the International Space Station (ISS). There were 6 female and 25 male subjects, and their mean age was 52 (range, 38–61).
Samples were collected at 180 days and 45 days before the astronauts flew to the ISS. Blood was also collected while they were in space—during the first 2 weeks (early time point), between 2 and 4 months (mid time point), and about 6 months into the mission (late time point).
Samples were returned to Earth for analysis either in Houston or at Star City, Russia, within 48 hours of collection. Post-flight samples were collected 3 to 8 hours after landing and 30 days after the mission had ended.
Results
The researchers said some of the changes observed in the in-flight blood samples were to be expected due to the 48-hour processing delay between sample collection and analysis.
However, the team found that RBC concentration was significantly elevated at all 3 in-flight time points, when compared to the 180-day pre-mission time point (baseline). And RBC counts returned to baseline levels upon Earth landing.
The mean RBC concentrations (x 106 cells/μL) were:
- 4.4 ± 0.4 (range, 3.5–5.1) at baseline
- 4.8 ± 0.5 (range, 3.9–5.7) at the early time point (P<0.05)
- 4.7 ± 0.4 (range, 3.9–5.4) at the mid time point (P<0.05)
- 4.7 ± 0.4 (range, 4.1–5.6) at the late time point (P<0.05).
Hemoglobin was elevated early in flight but returned to pre-flight levels during the mission and fell below baseline levels on landing day. The mean hemoglobin (g/dL) levels were:
- 14.1 ± 1.4 (range, 11.0–17.8) at baseline
- 15.0 ± 1.9 (range, 10.7–17.5) at the early time point (P<0.05)
- 13.5 ± 1.4 (range, 10.1–15.9) on landing day (P<0.05).
Mean corpuscular hemoglobin (MCH) decreased during the mission and was significantly lower than baseline at the late time point. However, MCH returned to pre-flight values upon landing. The mean MCH (pg) was:
- 31.7 ± 1.6 (range, 28.8–36.4) at baseline
- 31.3 ± 1.9 (range 26.3–34.0) at the late time point (P<0.05).
The researchers said they observed significant increases in mean corpuscular volume (MCV) during space flight. However, these reflect the changes observed following the 48-hour processing delay. So there were no variations in MCV attributable to space flight.
The changes observed in hematocrit during space flight were “striking,” according to the researchers. The mean hematocrit levels were:
- 40.9 ± 3.9 (range, 33.1–48.0) at baseline
- 45.9 ± 4.7 (range 38.2–52.1) at the early time point (P<0.05)
- 45.9 ± 5.5 (range 38.9–58.3) at the mid time point (P<0.05)
- 45.0 ± 2.5 (range 38.9–49.9) at the late time point (P<0.05).
Compared to pre-flight levels, hematocrit increased by 12.2% at early, 12.2% at mid, and 10.0% at late time points. In comparison, there was a 4.7% increase in hematocrit in reference samples from non-astronauts after the 48-hour processing delay.
Finally, the researchers found that platelet concentrations were elevated in flight, at the early and mid time points. However, platelets were not significantly elevated at the late time point, and they were stable upon landing.
For all of the astronauts, all blood parameters returned to pre-flight levels within 30 days of landing on Earth.
The researchers said these results are susceptible to the possible influence of dehydration or plasma volume alterations. However, the findings do suggest the increases observed in the ISS samples are partly due to a true in-flight increase in RBC count.
“Although the data does not indicate that significant anemia is present, it must be interpreted in the context of crew plasma volume during flight,” Dr Simpson said. “Overall plasma volume has been shown to be reduced during space flight, but this has not been assessed during long-duration missions.”
“In order to fully interpret the changes to RBC, hematocrit, and other parameters observed in this study, further research into plasma volume during long space missions is needed. This will be addressed in a separate, ongoing NASA investigation.” ![]()
FDA grants priority review for drug to treat APL

The US Food and Drug Administration (FDA) has accepted for priority review a supplemental new drug application (sNDA) for arsenic trioxide (TRISENOX®) injection.
With this sNDA, Teva Pharmaceutical Industries Ltd. is seeking approval for arsenic trioxide to be used in combination with all-trans retinoic acid (ATRA) for induction of remission and consolidation in patients with newly diagnosed, low- or intermediate-risk acute promyelocytic leukemia (APL) characterized by the presence of the t(15;17) translocation or PML/RAR-alpha gene expression.
Currently, arsenic trioxide is FDA-approved as monotherapy for induction of remission and consolidation in patients with APL who are refractory to, or have relapsed from, retinoid and anthracycline chemotherapy, and whose APL is characterized by the presence of the t(15;17) translocation or PML/RAR-alpha gene expression.
For more details, see the full prescribing information.
The FDA has accepted the arsenic trioxide sNDA for priority review and expects to make a decision on the application in the first quarter of 2018.
The FDA grants priority review to applications for products that may provide significant improvements in the treatment, diagnosis, or prevention of serious conditions.
The agency’s goal is to take action on a priority review application within 6 months of receiving it, rather than the standard 10 months.
Phase 3 study results
The sNDA for arsenic trioxide is supported by results from the APL0406 study. Updated results from this phase 3 study were published in the Journal of Clinical Oncology in February.
The study included 276 adults (ages 18 to 71) with newly diagnosed, low- or intermediate-risk APL. Patients were randomized to receive ATRA plus arsenic trioxide or ATRA plus chemotherapy.
A total of 263 patients were evaluable for response to induction. One hundred percent of patients in the arsenic trioxide arm (127/127) achieved a complete response (CR), as did 97% (132/136) of patients in the chemotherapy arm (P=0.12).
After a median follow-up of 40.6 months, the event-free survival was 97.3% in the arsenic trioxide arm and 80% in the chemotherapy arm (P<0.001). The cumulative incidence of relapse was 1.9% and 13.9%, respectively (P=0.0013).
At 50 months, the overall survival was 99.2% in the arsenic trioxide arm and 92.6% in the chemotherapy arm (P=0.0073).
After induction, there were 2 relapses and 1 death in CR in the arsenic trioxide arm.
In the chemotherapy arm, there were 2 instances of molecular resistance after third consolidation, 15 relapses, 5 deaths in CR, and 2 patients who developed a therapy-related myeloid neoplasm. ![]()
R&D costs for cancer drugs may be lower than previously thought

New research has provided an updated estimate of the spending needed to bring a cancer drug to the US market.
In analyzing data from 10 companies bringing a cancer drug to market, researchers found that sales revenue from these drugs was roughly 7 times higher than the research and development (R&D) costs.
The total sales revenue for the drugs—during a median follow-up of 4 years—was $67.0 billion, and the total R&D spending was $9.1 billion (including 7% opportunity costs).
Researchers reported these figures in JAMA Internal Medicine.
“[T]he price of cancer drugs is currently rising higher and higher each year,” said study author Vinay Prasad, MD, of Oregon Health and Science University in Portland.
“The cost of 1 drug for 1 year of treatment is now routinely in excess of $100,000 . . . . One of the often-cited reasons why cancer drugs cost so much—one of the justifications for the high price—is that the outlay by the biopharmaceutical industry to bring these drugs to market is sizable, and there have been a wide range of estimates for what that R&D outlay is.”
“The most-cited estimate is one that comes out of the Tufts Medical Group1 that puts the cost to bring a cancer drug to market, when adjusted for 2017 dollars, at $2.7 billion. Another estimate is from the group Public Citizen.2 And that is a much lower estimate, finding the cost to bring a drug to market of $320 million.”
“Both of these estimates have limitations in the methods for how they estimated the cost to bring a drug to market. Notably, the Tufts group is rather non-transparent. Because of confidentiality agreements, we don’t know what drugs and what companies they’re looking at, and we can’t independently verify their analysis.”
“The Public Citizen group, in contrast, is comparing expenditures over a period of time against the number of drugs in a different period of time to make an estimate of the cost to bring a drug to market, but this isn’t exactly the cost of bringing those particular drugs to market.”
These issues prompted Dr Prasad and Sham Mailankody, MBBS, of the Memorial Sloan Kettering Cancer Center in New York, to conduct the current study.
Analysis
The researchers analyzed US Securities and Exchange Commission filings for 10 drug companies that received approval from the US Food and Drug Administration for a cancer drug from 2006 through 2015.
Prior to this, none of the companies had any drugs approved for use in the US. However, the companies had a median of 3.5 (range, 2-11) drugs in development during the study period.
The researchers said the fact that these companies had no prior drug approvals eliminated biases that may be present when analyzing larger drug companies, such as redundancies in R&D development and tax incentives for listing different endeavors as R&D spending.
In addition, the fact that the 10 companies were developing other drugs during the study period means this study takes into account the cost of failure in bringing a drug to market.
Results
For the 10 companies and drugs analyzed, the median duration of drug development was 7.3 years (range, 5.8 to 15.2 years).
The median cost of drug development (in 2017 US dollars) was $648.0 million (range, $157.3 to $1950.8 million). For a 7% per annum cost of capital (or opportunity costs), the median cost was $757.4 million (range, $203.6 to $2601.7 million).
The median time from approval to analysis in December 2016 (or until the company sold or licensed the compound to another company) was 4.0 years (range, 0.8 years to 8.8 years).
The total revenue from sales of the 10 drugs during this time was $67.0 billion.
The total R&D spending was $7.2 billion, or $9.1 billion when including 7% opportunity costs.
The following table includes data broken down by drug.
| Drug and company | Approval date | Indication | Total R&D costs | Revenue since approval |
|---|---|---|---|---|
| Eculizumab (Soliris)
Alexion Pharmaceuticals |
2007 | Paroxysmal nocturnal hemoglobinuria | $817.6 million | $12,987.8 million |
| Pralatrexate (Folotyn)*
Allos Therapeutics |
2009 | Relapsed/refractory peripheral T-cell lymphoma | $178.2 million | $304.8 million |
| Brentuximab vedotin (Adcetris)*
Seattle Genetics |
2011 | Certain patients with Hodgkin lymphoma and systemic anaplastic large cell lymphoma | $899.2 million | $1034.3 million |
| Ruxolitinib (Jakafi)
Incyte Corporation |
2011 | Intermediate- and high-risk myelofibrosis | $1097.8 million | $2251.5 million |
| Enzalutamide (Xtandi)**
Medivation |
2012 | Metastatic castration-resistant prostate cancer | $473.3 million | $21,068.3 million |
| Vincristine liposome (Marqibo)*
Talon Therapeutics |
2012 | Ph- acute lymphoblastic leukemia | $157.3 million | $204.1 million |
| Cabozantinib (Cometriq)
Exelixis |
2012 | Metastatic medullary thyroid cancer | $1950.8 million | $341.9 million |
| Ponatinib (Iclusig)*
Ariad Pharmaceuticals |
2012 | Chronic myeloid leukemia and Ph+ acute lymphoblastic leukemia
|
$480.1 million | $5457.98 million |
| Ibrutinib (Imbruvica)*
Pharmacyclics |
2013 | Previously treated mantle cell lymphoma | $328.1 million | $22,275.0 million |
| Irinotecan liposome (Onivyde)
Merrimack Pharmaceuticals |
2015 | Advanced pancreatic cancer previously treated with gemcitabine-based chemotherapy | $815.8 million | $1065.2 million |
*Received accelerated approval. (The other 5 drugs received regular approval.)
**Did not receive orphan designation. (Nine of the 10 drugs received orphan designation.)
“So I think what we’re showing is . . . a transparent analysis of cancer drugs and companies, looking at the cost to bring a drug to market,” Dr Mailankody said. “And our estimate of $648 million is substantially lower than the often-cited number of $2.7 billion.”
“We’re also showing that, for these 10 drugs, revenue since approval is quite a bit higher than the R&D spending, almost 7-fold higher, and some of these companies have already had revenue of 10-fold or higher, compared to the R&D expenses.”
The researchers acknowledged that this study is limited by a small data set and the fact that the findings cannot be extrapolated to other types of drugs. ![]()
1. DiMasi JA et al. Innovation in the pharmaceutical industry: new estimates of R&D costs. J Health Econ. 2016;47:20-33.
2. Young B et al. Rx R&D Myths: The Case Against the Drug Industry’s R&D “Scare Card.” Washington, DC: Public Citizen’s Congress Watch; 2001. https://www.citizen.org/sites/default/files/rdmyths.pdf.
New drug proves effective against malaria
A new drug is effective against non-severe cases of malaria, according to results from a phase 2 trial published in The Lancet Infectious Diseases.
The drug, AQ-13, was able to clear patients of the malaria parasite Plasmodium falciparum within a week, matching the effectiveness of combination treatment with artemether and lumefantrine.
“The clinical trial results are extraordinarily encouraging,” said study author Donald Krogstad, MD, of Tulane University in New Orleans, Louisiana.
“Compared to the current first-line recommendation for treatment of malaria, the new drug comes out very well.”
For this study, Dr Krogstad and his colleagues recruited 66 adult men in Mali with uncomplicated malaria. Half of the subjects were randomized to receive AQ-13, and the other half received combination treatment with artemether and lumefantrine.
The researchers found that asexual parasites were cleared by day 7 in both treatment groups.
In a per-protocol analysis, the cure rate was 100% (28/28) in the AQ-13 group and 93.9% (28/31) in the combination group (P=0.50, difference −6.1%, 95% CI −14.7 to 2.4).
In the intention-to-treat analysis, the cure rate was 84.8% (28/33) in the AQ-13 group and 93.9% in the combination group (P=0.43, difference 9.1%, 95% CI −5.6 to 23.8).
Grade 1 or lower adverse events (AEs) occurred in 239 patients in the AQ-13 group and 214 in the combination group. There were no grade 2-4 AEs.
The most common AEs (in the AQ-13 and combination groups, respectively) were fever (97% and 88%), weakness (82% and 85%), myalgias and arthralgias (82% and 76%), headache (97% and 94%), and anorexia (73% and 61%).
Two subjects in AQ-13 group left the study, and 3 were lost to follow-up. Two subjects in the combination group had late treatment failures with recurrence of their original infections.
The researchers hope to expand testing of AQ-13 to more participants, including women and children.
Dr Krogstad said the same biotechnology that helped the researchers develop AQ-13 has also revealed similar drugs that hold promise against drug-resistant parasites.
“The potential long-term implications are bigger than one drug,” Dr Krogstad said. “The conceptual step here is that if you understand the resistance well enough, you may actually be able to develop others as well. We synthesized over 200 analogues and, of those, 66 worked against the resistant parasites.” ![]()
A new drug is effective against non-severe cases of malaria, according to results from a phase 2 trial published in The Lancet Infectious Diseases.
The drug, AQ-13, was able to clear patients of the malaria parasite Plasmodium falciparum within a week, matching the effectiveness of combination treatment with artemether and lumefantrine.
“The clinical trial results are extraordinarily encouraging,” said study author Donald Krogstad, MD, of Tulane University in New Orleans, Louisiana.
“Compared to the current first-line recommendation for treatment of malaria, the new drug comes out very well.”
For this study, Dr Krogstad and his colleagues recruited 66 adult men in Mali with uncomplicated malaria. Half of the subjects were randomized to receive AQ-13, and the other half received combination treatment with artemether and lumefantrine.
The researchers found that asexual parasites were cleared by day 7 in both treatment groups.
In a per-protocol analysis, the cure rate was 100% (28/28) in the AQ-13 group and 93.9% (28/31) in the combination group (P=0.50, difference −6.1%, 95% CI −14.7 to 2.4).
In the intention-to-treat analysis, the cure rate was 84.8% (28/33) in the AQ-13 group and 93.9% in the combination group (P=0.43, difference 9.1%, 95% CI −5.6 to 23.8).
Grade 1 or lower adverse events (AEs) occurred in 239 patients in the AQ-13 group and 214 in the combination group. There were no grade 2-4 AEs.
The most common AEs (in the AQ-13 and combination groups, respectively) were fever (97% and 88%), weakness (82% and 85%), myalgias and arthralgias (82% and 76%), headache (97% and 94%), and anorexia (73% and 61%).
Two subjects in AQ-13 group left the study, and 3 were lost to follow-up. Two subjects in the combination group had late treatment failures with recurrence of their original infections.
The researchers hope to expand testing of AQ-13 to more participants, including women and children.
Dr Krogstad said the same biotechnology that helped the researchers develop AQ-13 has also revealed similar drugs that hold promise against drug-resistant parasites.
“The potential long-term implications are bigger than one drug,” Dr Krogstad said. “The conceptual step here is that if you understand the resistance well enough, you may actually be able to develop others as well. We synthesized over 200 analogues and, of those, 66 worked against the resistant parasites.”
Clinical trials may go unregistered, unpublished
A new study has revealed a lack of registration and publication of clinical trials, as well as discrepancies in the reporting of primary outcomes.
However, this study is limited in that it only included 113 clinical trials approved in Finland.
An-Wen Chan, MD, DPhil, of the University of Toronto in Ontario, Canada, and his colleagues reported findings from the study in JAMA.
The results were also presented at the Eighth International Congress on Peer Review and Scientific Publication.
The researchers examined adherence to trial registration and its association with subsequent publication and reporting of primary outcomes.
The team looked at 113 clinical trial protocols approved in 2007 by the research ethics committee for the region of Helsinki and Uusimaa, Finland.
Sixty-one percent of the trials were prospectively registered, which was defined as registration within 1 month of the trial start date to allow for incomplete start dates and processing delays in the registry.
Fifty-seven percent of the trials were published, and 80% had a defined primary outcome.
Prospective registration was significantly associated with subsequent publication, with 68% of registered trials and 39% of unregistered trials getting published (adjusted odds ratio=4.53 [95% CI, 1.12-18.34]).
In addition, registered trials were significantly more likely than unregistered trials to be published with the same primary outcomes as defined in the protocol—64% and 25%, respectively (adjusted odds ratio=5.79 [95% CI, 1.42-23.65]).
The researchers assessed discrepancies in primary outcomes between the protocol and the registry/publication. These were defined as:
- A new primary outcome being reported that was not specified as primary in the protocol
- A protocol-defined primary outcome being omitted or downgraded (reported as secondary or unspecified) in the registry or publication.
The researchers found discrepancies between the registry and the protocol in 23% of the prospectively registered trials. There were discrepancies between the publication and the protocol for 16% of published trials.
Discrepancies between the protocol and publication were more common in unregistered trials than registered trials—55% and 6%, respectively (P<0.001).
Based on these results, the researchers concluded that prospective registration should be mandatory for all clinical trials.
Biosimilar deemed equivalent to reference drug in FL
MADRID—The biosimilar GP2013 has demonstrated equivalence to its reference drug rituximab in patients with previously untreated, advanced-stage follicular lymphoma (FL), according to researchers.
Treatment with GP2013 plus cyclophosphamide, vincristine, and prednisone (CVP) produced a similar overall response rate (ORR) as rituximab plus CVP in the phase 3 ASSIST-FL trial.
Survival rates were also similar between the treatment arms, as were adverse events (AEs).
Results from this study were published in The Lancet Haematology and presented at ESMO 2017 Congress (abstract 994O).
The study was funded by Hexal AG, a Sandoz company (part of the Novartis group), which is marketing GP2013 as Rixathon in Europe.
Patients and treatment
The trial included 629 patients with previously untreated, advanced-stage FL. They were randomized to receive 8 cycles of GP2013-CVP (n=314) or rituximab-CVP (n=315). Responders in either arm could receive monotherapy maintenance for up to 2 years.
The mean age was 57.5 in the GP2013 arm and 56.4 in the rituximab arm. Fifty-eight percent and 54% of patients, respectively, were female.
Fifty-seven percent of patients in the GP2013 arm and 56% in the rituximab arm had an ECOG performance status of 0. Forty percent and 39%, respectively, had a status of 1. Two percent and 4%, respectively, had a status of 2. (For the remaining 1% of patients in each arm, data on performance status were missing.)
Patients had an Ann Arbor stage of III—46% in the GP2013 arm and 43% in the GP2013 arm—or IV—54% in the GP2013 arm and 57% in the rituximab arm.
Fifty-six percent of patients in each arm were high-risk according to FLIPI. Thirty-four percent in the GP2013 arm and 33% in the rituximab arm were intermediate-risk. Ten percent and 11%, respectively, were low-risk.
Fourteen percent of patients in the GP2013 arm and 18% in the rituximab arm had bulky disease. Fifteen percent and 13%, respectively, had splenic involvement.
ORR and survival
The patients had a median follow-up of 23.8 months. The primary efficacy endpoint was equivalence in ORR, defined by a 95% confidence interval (CI) with a margin of ± 12% standard deviation.
The primary endpoint was met, as the ORR was 87% in the GP2013 arm and 88% in the rituximab arm, with a difference of –0.40% (95% CI –5.94%, 5.14%).
The complete response rate was 15% in the GP2013 arm and 13% in the rituximab arm. The partial response rates were 72% and 74%, respectively.
The median progression-free survival and overall survival have not been reached. However, the progression-free survival rate was 70% in the GP2013 arm and 76% in the rituximab arm (hazard ratio [HR]=1.31; 95% CI 1.02, 1.69).
The overall survival rate was 93% in the GP2013 arm and 91% in the rituximab arm (HR=0.77; 95% CI 0.49, 1.22).
Safety
During the combination phase, the incidence of AEs was 93% in the GP2013 arm and 91% in the rituximab arm. The incidence of serious AEs was 23% and 20%, respectively.
The most frequent AEs (in the GP2013 and rituximab arms, respectively) were neutropenia (26% and 30%), constipation (22% and 20%), and nausea (16% and 13%). The most common grade 3/4 AE was neutropenia (18% and 21%).
There were 11 deaths reported during the combination phase—4 in the GP2013 arm and 7 in the rituximab arm.
Three deaths in the GP2013 arm (sudden death, septic shock, and respiratory failure) and 2 deaths in the rituximab arm (multiple organ dysfunction syndrome and sepsis) were suspected to be related to study treatment.
During the maintenance phase, the incidence of AEs was 63% in the GP2013 arm and 57% in the rituximab arm. The incidence of serious AEs was 6% and 4%, respectively.
The most frequent AEs (in the GP2013 and rituximab arms, respectively) were infections and infestations (20% and 27%), neutropenia (10% and 6%), cough (9% and 6%), and upper respiratory tract infection (3% and 6%). The most common grade 3/4 AE was neutropenia (7% and 4%).
There were 4 deaths reported during the maintenance phase, 2 in each treatment arm.
Treatment for WDTC tied to increased risk of AML
MADRID—New research suggests patients with well-differentiated thyroid cancer (WDTC) are more likely to develop acute myeloid leukemia (AML) if they receive radioactive iodine (RAI) after surgery.
Of the WDTC patients studied, those who only underwent surgery were less likely to develop AML.
WDTC patients who did develop AML had a far worse prognosis than WDTC patients without AML and patients with de novo AML.
These results were presented at the ESMO 2017 Congress (abstract 996O).
Researchers already knew that the risk of developing leukemia is increased after radiation and RAI treatment for WDTC.
However, the risk of AML following RAI treatment in WDTC survivors had not been fully characterized, according to Remco J. Molenaar, an MD/PhD candidate at Academic Medical Centre in Amsterdam, Netherlands.
Therefore, Molenaar and colleagues reviewed data from all 18 registries in the Surveillance Epidemiology and End Results database for WDTC cases treated solely with surgery or by surgery and RAI.
The researchers identified 148,215 patients who were diagnosed with WDTC from 1973 to 2014. Fifty-five percent were treated with surgery alone, and 45% were treated with surgery and RAI.
The median follow-up was 4.3 person-years. AML occurred in 44 patients in the surgery-only arm and 56 patients in the RAI arm.
A comparison to the background rates in the general population showed that patients receiving surgery plus RAI had an increased risk of developing AML (relative risk=5.6; 95% confidence interval [CI] 3.8, 8.1; P<0.0001), after correcting for age, sex, and year of WDTC diagnosis.
This risk peaked within the first 3 years following RAI and subsequently regressed to baseline rates.
In multivariate analysis that corrected for sex and WDTC tumor size, 3 variables emerged as independent predictors of AML development. There was an increased risk of AML associated with:
- Patient age (hazard ratio [HR]=1.03; 95% CI 1.02, 1.05; P<0.001)
- WDTC tumor stage (HR=1.36; 95% CI 1.04, 1.79; P=0.03)
- Receiving RAI after thyroidectomy vs thyroidectomy alone (HR=1.38; 95% CI 1.09, 1.75; P=0.007).
The researchers also found prognosis is significantly poorer in WDTC patients who develop AML following RAI and in patients with spontaneous AML development.
Case-control analyses revealed that WDTC patients who developed AML after surgery and RAI survived one-third as long as matched control patients who were successfully treated for WDTC but did not develop AML. The median overall survival was 7.4 years and 24.4 years, respectively (P<0.0001).
Patients who were diagnosed with AML after RAI treatment also had a significantly worse prognosis than patients with de novo AML. The median overall survival was 1.2 years and 3.5 years, respectively (P=0.004).
The researchers noted that rates of AML in WDTC survivors will likely continue to rise due to the increasing incidence of WDTC, the young ages at which most WDTC diagnoses are made, and the otherwise high survival rates of patients with WDTC.