User login
Death by Numbers
The Centers for Disease Control and Prevention’s (CDC) National Center for Health Statistics (NCHS) recently released “Deaths: Preliminary Data for 2004.” This report includes information from approximately 90% of the death records provided by all 50 states and the District of Columbia in 2004. The death certificate information provided by physicians, coroners, medical examiners, and funeral directors serves as the source for all death record information. A complete report is due to be released in May 2005 and will include data for the United States territories of Puerto Rico, the Virgin Islands, Guam, American Samoa, and the Northern Marianas.
This preliminary report contains information dealing with the absolute number of deaths, age-adjusted death rates, and life expectancy. The absolute number of deaths allows for the calculation of death rates based on total population figures using the 2000 census data and estimations for population changes in the intervening years. Age-adjusted death rates account for the changing age distribution of the population of the United States over time and make comparisons between years and tracking of trends more useful.
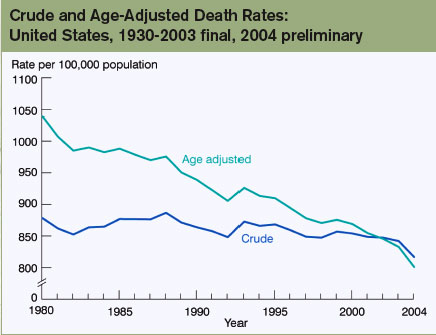
The absolute (crude) death rate in the United States for 2004 is reportedly expected to be 2,398,343 people. This is a decrease of 49,495 (about 2%) from the 2003 figures, one of the biggest year-to-year declines in decades. The age-adjusted death rate is down from 832.7/100,000 deaths in 2003 to 801.0/100,000 deaths in 2004, a drop of 3.8%. These rates in 2004, for both absolute and age adjusted deaths, represent all-time record lows and continuing a trend toward lower and lower rates of death. (See “Crude and Age-Adjusted Death Rates,” p. 26.) All racial groups for both genders analyzed showed decreases in death rates ranging from the largest decrease of 6.2% in Hispanic women to the smallest decrease of 3.2% in non-Hispanic white women.
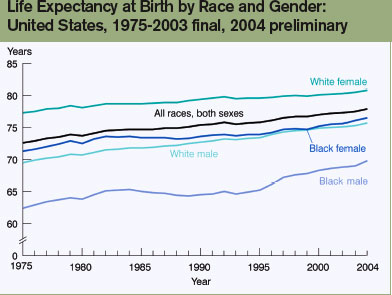
The preliminary estimate for life expectancy at birth in 2004 has improved to 77.9 years, the highest life expectancy recorded. Women continue to have an increased life expectancy compared with men (80.4 years versus 75.2 years) but this gender gap of 5.2 years is the smallest since 1946. Breakdown by race and gender for white and black men and women also shows gains in life expectancy for all groups with the largest gains appearing for black men with an increase of 0.8 years from 69.0 in 2003 to 69.8 in 2004. (See “Life Expectancy at Birth by Race and Gender,” above.) There remains a significant difference of 5.0 years (78.3 years versus 73.3 years) between white and black life expectancy.
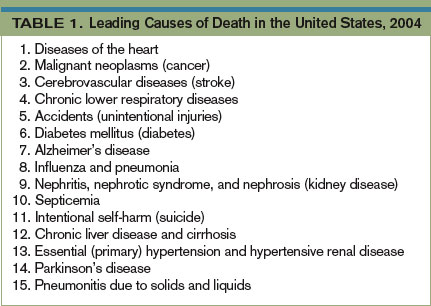
Also included in this report are the data dealing with cause of death and a listing of the 15 leading causes of death in the United States in 2004. (See Table 1, above.) These top 15 causes of death account for almost 83% of all deaths for 2004 in the United States. The preliminary figures show an increase in the number of deaths caused by hypertension—up 2.7% from 2003, and Alzheimer’s disease—up 1.4%. All other categories showed a decrease in the number of deaths, ranging from the smallest decline of 0.7% in kidney disease to the largest decline of 6.5% occurring in cerebrovascular disease. The only change in order of cause of death in the top 15 is the change of Alzheimer’s disease moving up from the number-eight position to number seven and a drop of influenza/pneumonia into the number-eight position. Also of note to geriatric hospitalists is cause of death number 15: aspiration. TH
Dr. Ruff is a resident, internal medicine, at the Mayo Clinic College of Medicine, Rochester, Minn.
Resource
- Miniño AM, Heron M, Smith BL. Deaths: Preliminary data for 2004. CDC. National Center for Health Statistics: Health E-Stats. Released April 19, 2006. Available at www.cdc.gov/nchs/products/pubs/pubd/hestats/prelimdeaths04/preliminarydeaths04.htm. Last accessed May 30, 2006.
The Centers for Disease Control and Prevention’s (CDC) National Center for Health Statistics (NCHS) recently released “Deaths: Preliminary Data for 2004.” This report includes information from approximately 90% of the death records provided by all 50 states and the District of Columbia in 2004. The death certificate information provided by physicians, coroners, medical examiners, and funeral directors serves as the source for all death record information. A complete report is due to be released in May 2005 and will include data for the United States territories of Puerto Rico, the Virgin Islands, Guam, American Samoa, and the Northern Marianas.
This preliminary report contains information dealing with the absolute number of deaths, age-adjusted death rates, and life expectancy. The absolute number of deaths allows for the calculation of death rates based on total population figures using the 2000 census data and estimations for population changes in the intervening years. Age-adjusted death rates account for the changing age distribution of the population of the United States over time and make comparisons between years and tracking of trends more useful.
The absolute (crude) death rate in the United States for 2004 is reportedly expected to be 2,398,343 people. This is a decrease of 49,495 (about 2%) from the 2003 figures, one of the biggest year-to-year declines in decades. The age-adjusted death rate is down from 832.7/100,000 deaths in 2003 to 801.0/100,000 deaths in 2004, a drop of 3.8%. These rates in 2004, for both absolute and age adjusted deaths, represent all-time record lows and continuing a trend toward lower and lower rates of death. (See “Crude and Age-Adjusted Death Rates,” p. 26.) All racial groups for both genders analyzed showed decreases in death rates ranging from the largest decrease of 6.2% in Hispanic women to the smallest decrease of 3.2% in non-Hispanic white women.
The preliminary estimate for life expectancy at birth in 2004 has improved to 77.9 years, the highest life expectancy recorded. Women continue to have an increased life expectancy compared with men (80.4 years versus 75.2 years) but this gender gap of 5.2 years is the smallest since 1946. Breakdown by race and gender for white and black men and women also shows gains in life expectancy for all groups with the largest gains appearing for black men with an increase of 0.8 years from 69.0 in 2003 to 69.8 in 2004. (See “Life Expectancy at Birth by Race and Gender,” above.) There remains a significant difference of 5.0 years (78.3 years versus 73.3 years) between white and black life expectancy.
Also included in this report are the data dealing with cause of death and a listing of the 15 leading causes of death in the United States in 2004. (See Table 1, above.) These top 15 causes of death account for almost 83% of all deaths for 2004 in the United States. The preliminary figures show an increase in the number of deaths caused by hypertension—up 2.7% from 2003, and Alzheimer’s disease—up 1.4%. All other categories showed a decrease in the number of deaths, ranging from the smallest decline of 0.7% in kidney disease to the largest decline of 6.5% occurring in cerebrovascular disease. The only change in order of cause of death in the top 15 is the change of Alzheimer’s disease moving up from the number-eight position to number seven and a drop of influenza/pneumonia into the number-eight position. Also of note to geriatric hospitalists is cause of death number 15: aspiration. TH
Dr. Ruff is a resident, internal medicine, at the Mayo Clinic College of Medicine, Rochester, Minn.
Resource
- Miniño AM, Heron M, Smith BL. Deaths: Preliminary data for 2004. CDC. National Center for Health Statistics: Health E-Stats. Released April 19, 2006. Available at www.cdc.gov/nchs/products/pubs/pubd/hestats/prelimdeaths04/preliminarydeaths04.htm. Last accessed May 30, 2006.