User login
Asthmatic Inpatient Influenza Immunization
Influenza is estimated to infect up to 40%‐54% of school‐age children during an influenza season.1, 2 Influenza infections result in missed school days, visits to primary care providers, prescriptions for antibiotics, hospitalizations, and secondary infections.310 Although influenza‐related mortality of pediatric patients is rare, influenza‐related morbidity of children and those secondarily infected is common and partially preventable.11
For at‐risk individuals, immunization against influenza is the best method of preventing morbidity. The Centers for Disease Control's Advisory Committee on Immunization Practice (CDC/ACIP) considers children with asthma at high risk of morbidity from influenza and since 1964 has recommended delivery of inactivated influenza vaccination to this population of patients. Even with this recommendation, the current level of adherence to yearly influenza vaccination of children with asthma is approximately 29%, according to the CDC analysis of the National Health Interview Survey.12 Although pediatric providers may prefer to provide preventive care in an ambulatory setting, the CDC/ACIP emphasizes the need for vaccination delivery wherever possible, including in acute‐care hospitals.11 Particularly in an acute‐care setting, vaccinating patients who are having an exacerbation of their asthma and who may have a compromised immune response may raise concerns. However, the vaccine has been shown to be efficacious even with pediatric asthmatics on a short course of corticosteroids.13, 14 Utilization of the inpatient visit as an opportunity to implement evidence‐based preventive care to pediatric asthmatics could have a beneficial effect on patient outcomes. Group‐based settings (school or health fair) are more cost effective than individual‐initiated settings (primary care) for influenza vaccination of pediatric patients.15 However, we found no studies investigating the effectiveness of vaccinating high‐risk patients in an acute‐care setting.
This study used established modeling techniques (decision and cost‐effectiveness analyses) to determine the potential clinical and cost benefits of vaccinating children against influenza during an asthma exacerbation in an acute‐care setting. We used decision analysis to determine the effectiveness of the intervention in improving the up‐to‐date (UTD) status of a hypothetical population. Based on this improvement in vaccination delivery, we completed a cost‐effectiveness analysis to determine direct and indirect costs, improvement in clinical outcomes attributable to influenza (clinic visits, antibiotic use, hospitalization, and secondary infections), and cost savings attributable to the intervention.
METHODS
Decision Analysis
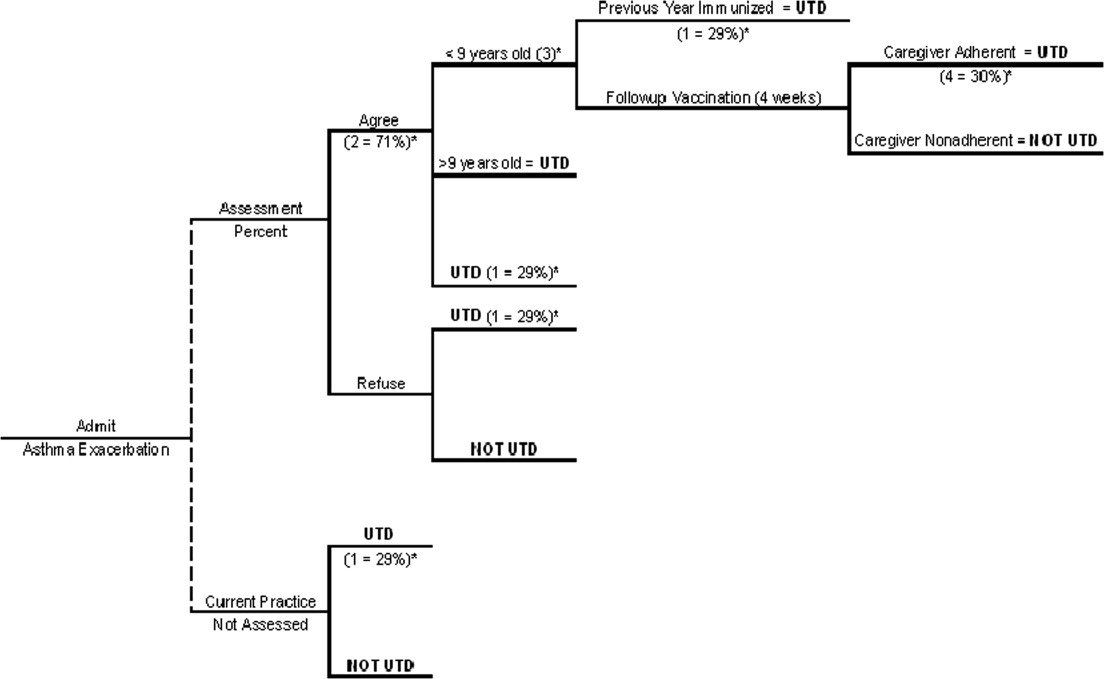
We generated a decision tree to represent an inpatient intervention to assess and deliver influenza vaccination to children with asthma in acute‐care hospitals (Fig. 1). The design of the decision tree intentionally began with a decision node in order to introduce different assessment rates. This approach was used in order to accurately represent an inpatient intervention (where 100% assessment is not always attained) and to assess how less‐than‐perfect rates of assessment of influenza vaccine status would affect the success of the intervention. Once the decision tree was created, we surveyed the literature to obtain data on the assumptions of the decision tree (See Table 1 for assumptions of decision analysis with corresponding numbering in Figure 1 Decision Tree) including percentage of children with asthma who receive the influenza vaccine (29%),12 percentages of patients and caregivers who would agree to be vaccinated in an acute‐care settings (71%),16 and rates of response to vaccine reminder recall systems in a primary care setting (30%)17 in order to account for populations that need a second dose of vaccine to become UTD. To estimate the percentage of children who would require a second vaccination at 4 weeks, we utilized the Healthcare Cost and Utilization Project Kids Inpatient Database (HCUP KID).18 Seventy‐three percent of children younger than 9 years old in the HCUP KID were discharged with a diagnosis of asthma. These patients would require a second vaccination after 4 weeks if they had not previously been immunized. After all the estimates were placed in the decision tree, a hypothetical cohort of children with asthma was introduced, and improvement in UTD status after the intervention was determined.

| Reference | ||
|---|---|---|
| Decision analysis | ||
| 1. Percentage of asthmatics UTD with influenza vaccination without increased inpatient assessment | 29% | 12 |
| 2. Percentage of caregivers who agree with vaccination in an acute‐care setting | 71% | 16 |
| 3. Percentage of asthma exacerbation discharges <9 years old | 73% | 18 |
| 4. Percentage of caregivers who respond to reminder‐recall systems for outpatient vaccination | 30% | 17 |
| Cost‐effectiveness analysis | ||
| 5. Prevalence of influenza in school‐age children over 1 season | 45% | 1 |
| 6. Vaccine efficacy | 15 | |
| Best case | 43% | |
| Base case | 56% | |
| Worst case | 75% | |
| 7. Risk of secondary transmission | 18% | 31, 32 |
| 8. Missed school days (per child per year) attributed to influenza | 0.79 | 29, 30 |
| 9. Percentage of caregivers who miss work to care for sick child | 53% | 6 |
Cost‐Effectiveness Analysis
The purpose of the cost‐effectiveness analysis was to evaluate potential cost savings attributable to improvement in vaccination delivery (UTD status). Direct and indirect costs were obtained by review of the current published literature pertaining to costs of influenza and influenza vaccination. The key assumptions for the cost‐effectiveness analysis are present in Table 1.
Vaccine Efficacy and Cost
Studies of influenza vaccine efficacy in those with asthma have had widely variable results on clinical outcomes.1923 Therefore, for the purpose of these analyses, we used a best‐case, worst‐case, base‐case vaccine efficacy approach as previously described.15 The vaccine efficacy base case was estimated as 56%, best case as 75%, and worst case as 43%. The primary cost‐effectiveness analysis was performed with the base‐case efficacy. Sensitivity analysis was performed by varying the vaccine efficacy between worst‐case efficacy and best‐case efficacy in order to determine effects on clinical outcomes and cost savings.
We determined the cost associated with vaccination assessment and delivery. Cost of only assessing a patient for vaccination without delivery was calculated as $5.32 on the basis of the assumption that a registered nurse (RN) would print a form (2 minutes), ask screening questions and wait for replies (5 minutes), and fax the form/order to the pharmacy and/or place it in the medical record (1 minute) at an RN salary of $40/hour. Assessment and administration of the vaccination was assumed to cost $18.84. This was based on additional nursing time of 10 minutes (1 minute to check arrival of the vaccination, 2 minutes to prepare it, 5 minutes to inject and dispose of it, and 1 minute to record delivery of the vaccination in the medical record) plus the cost of the vaccine (estimated as $6.75)24 and related supplies (estimated as $0.67 for the safety syringe, $0.01 for cotton balls, $0.01 for alcohol preps, and $0.065 for rubber gloves).25 The cost of vaccine and supplies was determined by reviewing pharmaceutical reference books and medical equipment billing Web sites. The indirect cost of delivery of the second vaccination in the outpatient setting to patients requiring 2 shots to become UTD was 3 hours of missed work per caregiver.
Influenza Prevalence and Morbidity
The prevalence of influenza in school‐age children is estimated at 40%54% among those not at high risk during influenza season.1 For this analysis we used 45%. Morbidity associated with influenza has been estimated as 120200 clinic visits and 65140 antibiotic prescriptions per 1000 children per year.9 This analysis used 150 clinic visits and 100 antibiotic prescriptions per 1000 children. The rate of hospitalization for influenza of high‐risk children per 100,000 is 1900 for those aged 0‐11 months, 800 for those aged 12 years, 320 for those aged 34 years, and 92 for those aged 514 years.8, 11 The risk of hospitalization for the model's hypothetical cohort was age‐adjusted using the age distribution found in the HCUP KID for children discharged with a primary diagnosis of asthma. The age distribution of children in the HCUP KID was 34% were 12 years, 15% were 34 years, and 51% were 514 years.18 Children aged 011 months were excluded because of the low likelihood that this age group was at risk for influenza complicated by asthma. The age‐adjusted risk for the hypothetical cohort in this analysis was 360 hospitalizations/100,000 children.
To investigate the effect of year‐to‐year variation in influenza prevalence and morbidity, the lowest and then highest estimates for these measures from previous studies were used in the model to determine the effect on the outcomes of cost per vaccination and cost per assessment. During this analysis all the measures were simultaneously entered at their lowest estimates to simulate a less active influenza season and then at their highest estimates to simulate a more active influenza season. The lowest and highest estimates of these assumptions were: influenza prevalence, 31% and 54%3; number of clinic visits, 120 to 200 per 1000 children8; and number of antibiotic prescriptions, 65 to 140 per 1000 children.8 No range was found in the literature for risk of hospitalization. Therefore, the standard 25% decrease and 25% increase were used as the lowest and highest estimates. The results of this analysis demonstrated the range of cost savings per year based on the prevalence and morbidity of influenza.
Direct and Indirect Cost of Influenza
Cost data were collected from multiple studies and inflated to 2006 dollars using the Bureau of Labor Statistics consumer price index for medical care and medical care services.26 The costs of a clinic visit and antibiotic prescription were assumed to be $5127 and $9.91,28 which were inflated to 2006 dollars: $70.09 and $13.76, respectively. Used as the mean cost for hospitalization in this analysis ($15,2695) was the more conservative estimate from 2 recent articles on determining the cost of hospitalization of high‐risk pediatric patients with influenza‐related illness.4, 5 Number of school days missed by children attributed to influenza has been previously established as 0.79 days per child per year.29, 30 The cost of a caregiver missing work to care for a child was assumed to be the median hourly wage of a child care provider according to the Bureau of Labor and Statistics 2005, which was $9.47/hour, or $9.94/hour in 2006 dollars. The model assumed that there was a 53% chance that a caregiver would need to miss work for a sick child.6 In addition, there was a risk of secondary transmission of 18%31, 32 to an average of 1.72 adults (percentage of 2‐parent households = 72%15). The cost of an adult secondary infection was $65.25, inflated to $99.49 in 2006 dollars. The estimate for the cost of a secondary infection was derived from a article by Nichol et al., who investigated the cost of influenza for healthy working adults.33 The total savings per vaccination of a healthy working adult was estimated as $46.85. This estimate included $10, the cost of the vaccination; $0.69, the cost of the side effects of the vaccine; and $7.71, the cost of missing work in order to receive the vaccination. A secondary case of influenza would be prevented without incurring these additional costs of vaccination, and therefore $65.25 (inflated to $99.49) was used in this analysis.
RESULTS
With existing data showing that only 29% of those with asthma are UTD on influenza vaccine in a given year, our decision analysis demonstrated that even modest increases in the rate of screening for influenza vaccine status among hospitalized patients with asthma can result in clinically significant increases in the rate of vaccine delivery. For example, screening of just 20% of hospitalized patients with asthma would result in 35% of the children ultimately being up to date for that influenza season, a 20% overall improvement. In the same manner, a 40% assessment rate would result in 41% of children ultimately becoming UTD, a 60% assessment rate in 47% ultimately becoming UTD, an 80% assessment rate in 53% ultimately becoming UTD, and a 100% assessment in 59% ultimately becoming UTD, which is double the baseline rate (Table 2 ).
| Percent assessment | Vaccinations delivered (per 1000 patients) | Postintervention UTD |
|---|---|---|
| ||
| No increased assessment | None inpatient | 29% |
| 10% | 59 | 32% |
| 20% | 119 | 35% |
| 30% | 178 | 38% |
| 40% | 237 | 41% |
| 50% | 252 | 44% |
| 60% | 356 | 47% |
| 70% | 415 | 50% |
| 80% | 475 | 53% |
| 90% | 534 | 56% |
| 100% | 593 | 59% |
| Direct cost of influenza | Indirect cost of influenza | Cost of inpatient vaccination | Total | Savings | |
|---|---|---|---|---|---|
| No increased assessment | $56.48 | $39.51 | $ 0 | $95.99 | Base |
| Intervention to increase assessment | $45.24 | $31.64 | $13.66 | $90.54 | $5.45 |
This cost analysis demonstrated cost savings of $5.45 per child assessed and $9.19 per child vaccinated (Table 3). The cost savings per child assessed was lower than per child vaccinated because of including the costs of assessment without delivery of vaccination. This estimated savings is lower than the previously published $34.79 per vaccination of school‐age children in a group setting but more comparable to the cost savings of $3.99 in an individual‐initiated setting.15
The cost savings with this intervention depends on the vaccine's efficacy, and efficacy can vary as a function of whether it is an epidemic season and the degree of matching between the prevalent influenza strains and the vaccine strains. At higher predicted levels of vaccination efficacy, UTD patients have improved, less negative outcomes from influenza, and the intervention results in higher cost savings (cost savings with base‐case vaccine efficacy of $5.45/child assessed increases to $11.93/child assessed with best‐case vaccine efficacy). No current research accurately predicts vaccine efficacy for each outcome in pediatric patients with asthma. Therefore, this study design varied vaccine efficacy during sensitivity analyses among 3 potential vaccine efficacy scenarios (best‐, base‐, and worst‐case scenarios).15 Varying the vaccine efficacy to the best‐case scenario resulted in a cost savings of $11.93 per child assessed and $20.13 per child vaccinated. Dropping the efficacy to the worst‐case scenario resulted in cost savings of $1.01 per child assessed and $1.71 per child vaccinated. If the vaccine efficacy was 40%, the intervention was cost neutral. It should be remembered that the goal of the health care system is to generate good health. A project that is cost neutral (cost of vaccination intervention = cost savings from illness prevention), such as this intervention with a vaccine efficacy of 40%, may still be considered cost effective because of the improvement in clinical outcomes. At a vaccine efficacy of 40%, this model predicts that clinic visits will decrease by 19/1000 children, unwarranted antibiotics will decrease by 12/1000 children, hospitalizations will decrease by 4/10,000 children, and secondary infections of adult caregivers will decrease by 17/1000 children, suggesting an overall benefit to the health care system and to patients.
The clinical improvement predicted by this model with base‐case vaccine efficacy and 100% assessment include: a decrease in clinic visits of 27/1000 children, decrease in antibiotic use of 75/1000 children, decrease in hospitalizations of 6/10,000 children, decrease in missed school days of 132/1000 children, and a decrease in secondary infections of adult caregivers of 23/1000 children assessed.
The total cost of vaccination in this intervention was estimated as $10,593 per 1000 children. A hospital that discharges fewer than 1000 children with asthma per year would accrue less direct cost yearly with this intervention ($1059 per 100 children). A portion of this cost could be recuperated through reimbursement for influenza vaccination via insurance payers and/or government programs to reimburse for childhood vaccinations.
The results from the investigation into the effect of year‐to‐year variation in influenza prevalence and morbidity (by using the lowest and highest estimates found in the literature) demonstrated the model to be sensitive to these estimates, but the intervention maintained a cost savings. In a year with low influenza prevalence and morbidity, the cost savings decreases to $1.89 per child assessed and $3.20 per child vaccinated. In a year with high influenza prevalence and morbidity, the cost savings would increase to $8.75 per child assessed and $14.77 per child vaccinated. This finding of cost savings even with low influenza prevalence and morbidity is consistent with previous studies of influenza vaccination of pediatric patients in group‐based settings.15
For all other estimates, traditional sensitivity analysis was performed, and the results continued to show cost savings during this procedure, suggesting that the conclusions based on this model are generalizable and robust.
DISCUSSION
Universal screening for influenza vaccine status and then delivery of the vaccine to those not UTD among hospitalized children with asthma has the potential to increase the percentage of these children receiving the influenza vaccine and to reduce costs. This model suggests that with 100% assessment of this difficult‐to‐reach population for being UTD with the influenza vaccine, it would be possible to achieve a vaccination rate of 59%, doubling the current yearly receipt of influenza vaccination of children admitted secondary to asthma. However, universal screening is not imperative to achieve significant clinical improvement and cost savings. The cost‐effectiveness analysis demonstrated that the cost savings would be $5.45 per child assessed and $9.19 per child vaccinated.
The cost savings in this analysis ($9.19/child vaccinated) is favorable but lower than a previous analysis of influenza vaccination of children in an unspecified group‐based setting ($34.79/child vaccinated).15 Multiple factors contributed to our lower cost savings. First, our model accounts for the cost of children becoming partially vaccinated, incurring the full cost for 1 vaccination without the resulting clinical benefit. Second, the model accommodates for nursing assessment without vaccination delivery. Most importantly, this model estimates direct cost of vaccination delivery more conservatively than other group‐based estimates ($18.84 vs. $4.31).15 Previous cost‐effective analyses of influenza vaccination referenced 2 articles from the mid‐1990s that used a direct cost for 1 vaccination of $4 for group‐based vaccination in an HMO34 and $10 for individual‐initiated vaccination.33 Our estimate of vaccine cost is more conservative than these studies but more likely to represent the cost of vaccination assessment and delivery in an acute‐care hospital setting.
As the model was created, it became apparent that vaccination in the inpatient setting would accrue less indirect costs as compared with an individual‐initiated outpatient setting. This is a result of there not being any incrementally increased loss of work by the family/caregiver in order to be vaccinated above that lost because of hospitalization of the child for asthma. This finding supports that there is cost savings by vaccinating pediatric patients while hospitalized and is consistent with previous literature on this subject.15
The use of modeling techniques to evaluate inpatient interventions has many benefits. Modeling techniques permit the generation of synthetic trials by utilizing the combined published data from multiple studies. This permits the investigator to apply findings to other populations with different risks or prognoses and to other settings, to extend the impact over time, and to display multiple outcomes together. This technique has the potential to be used in investigations of the theoretical benefit of a specific quality improvement intervention in an inpatient setting without the extensive cost of a clinical trial. In fact, preliminary analysis with modeling could improve the cost efficiency of quality improvement research. Modeling studies could demonstrate which interventions are most likely to generate cost savings and direct clinical investigation and funding.
Limitations of this project included the possibility of vaccine efficacy changing from year to year depending on the similarity of the viruses in the vaccine with the predominant infectious strains circulating that year, as observed in previous studies.11 In a year with a poor match, the cost savings would be reduced compared with that in years with a good match. In addition, influenza prevalence and morbidity affects this model and the cost savings of the intervention, but the analysis using the lowest estimates of prevalence and morbidity continued to demonstrate that the intervention was saving costs. This continued cost savings for a group‐based vaccination intervention during years when there is low prevalence and morbidity is consistent with previous reports in the literature for pediatric patients.15 Modeling techniques decrease the effect of year‐to‐year variation in vaccination match, prevalence, and morbidity and estimate results based on an average over multiple influenza seasons.
For children with asthma, the data are not well established about influenza vaccination's ability to improve specific clinical outcomes attributed to influenza illness (missed school days, clinic visits, antibiotic prescriptions, hospitalizations, and secondary infections). Acknowledging the limitations of these data, our model estimates the intervention's improvement in clinical outcomes by using published data on vaccine efficacy and varying the vaccine efficacy from worst case to base case to best case. In addition, with a vaccine efficacy of 40%, this intervention would be cost neutral. Regardless of concerns about vaccine efficacy, the CDC/ACIP recommends finding missed opportunities for vaccination to improve vaccination delivery and the ultimate UTD status of high‐risk children. Recently, the CDC/ACIP stated that influenza vaccination coverage among children with asthma is inadequate and that opportunities for vaccination during health‐care provider visits likely are being missed.12 This intervention to assess and deliver influenza vaccination to pediatric patients while hospitalized for an asthma exacerbation would allow all hospitals that treat children to participate in reaching the goal of the CDC/ACIP to reduce missed opportunities for influenza vaccination.
The direct cost of inpatient vaccination in this intervention would fall primarily on the hospital implementing the intervention ($10,593 per 1000 children). However, the Vaccines for Children program exists to offset the cost of immunizations to both patients and providers for the uninsured and children receiving Medicaid.11 If properly implemented by participating hospitals, this program would improve reimbursement for vaccination and therefore shift the cost away from the individual hospital. For example, if the intervention cost borne by a hospital were decreased by the direct cost of vaccination alone ($6.75), this model predicts the cost of a program per 1000 children would decrease from $10,593 to $7190. This cost reduction would depend on the percentage of patients uninsured or on Medicaid at a given hospital. Another approach to shifting cost from individual hospitals would be for policy makers to consider influenza vaccination of these high‐risk pediatric patients as a performance/quality measure and associate the measure with improved reimbursement to hospitals in order to compensate for the cost of the vaccination intervention.
CONCLUSIONS
Influenza immunization is an accepted method of prevention and is underutilized in children with asthma.12 This model suggests that an inpatient program to deliver influenza vaccination to hospitalized pediatric patients with asthma would be beneficial by producing better health outcomes and reducing health care costs. Further research should be performed to verify the assumptions used in this analysis for children with asthma.
Acknowledgements
The authors acknowledge all the individuals who participated in the Academic Generalist Fellowship in Health Services Research at the Medical University of South Carolina for their direct and indirect participation in the study.
- ,,.Longitudinal studies of types a and b influenza among Seattle schoolchildren and families.J Infect Dis.1976;134:362–369.
- ,,,,.Influenza virus infections in infants.Pediatr Infect Dis J.1997;16:1065–1068.
- ,.Economic impact of influenza vaccination in preschool children.Pediatrics.2000;106:973–976.
- ,.Cost of influenza hospitalization at a tertiary care children's hospital and its impact on the cost‐benefit analysis of the recommendation for universal influenza immunization in children age 6 to 23 months.J Pediatr.2005;147:807–811.
- ,,,,.Direct medical cost of influenza‐related hospitalizations in children.Pediatrics.2006;118:e1321–e1327.
- ,,,.School absenteeism, parental work loss, and acceptance of childhood influenza vaccination.Am J Med Sci.2001;321:178–180.
- ,,.Illness among schoolchildren during influenza season: effect on school absenteeism, parental absenteeism from work, and secondary illness in families.Arch Pediatr Adolesc Med.2002;156:986–991.
- ,,,,.The effect of influenza on hospitalizations, outpatient visits, and courses of antibiotics in children.N Engl J Med.2000;342:225–231.
- ,,,.The burden of influenza illness in children with asthma and other chronic medical conditions.J Pediatr.2000;137:856–864.
- ,,, et al.The underrecognized burden of influenza in young children.N Engl J Med.2006;355(1):31–40.
- ,,,,,.Prevention and control of influenza: recommendations of the Advisory Committee on Immunization Practices (ACIP).MMWR Recomm Rep.2006;55(RR‐10):1–42.
- ,,,.Influenza vaccination coverage among children with asthma—United States, 2004–05 influenza season.MMWR Weekly.2007;56(9):193–196.
- ,,,,.Effect of prednisone on response to influenza virus vaccine in asthmatic children.Arch Pediatr Adolesc Med.1998;152:1191–1195.
- ,,,,.Influenza vaccination of children during acute asthma exacerbation and concurrent prednisone therapy.Pediatrics.1996;98(2 Pt 1):196–200.
- ,,.Potential cost savings attributable to influenza vaccination of school‐aged children.Pediatrics.1999;103:e73.
- .Providing immunizations in a pediatric emergency department: underimmunization rates and parental acceptance.Pediatr Emerg Care.1999;15:255–259.
- ,,,.Improving influenza vaccination rates in children with asthma: a test of a computerized reminder system and an analysis of factors predicting vaccination compliance.Pediatrics.1992;90:871–875.
- HealthCare Cost and Utilization Project: Kids' Inpatient Database (KID)2000. Agency for Healthcare Research and Quality.
- ,,,,.Influenza vaccination in patients with asthma: effect on the frequency of upper respiratory tract infections and exacerbations.J Asthma.2004;41:279–283.
- ,,,,,.Clinical effectiveness of conventional influenza vaccination in asthmatic children.Epidemiol Infect.2002;128:205–211.
- ,,, et al.Influenza vaccination in asthmatic children: effects on quality of life and symptoms.Eur Respir J.2004;24:925–931.
- ,,, et al.Influenza vaccination in children with asthma: randomized double‐blind placebo‐controlled trial.Am J Respir Crit Care Med.2004;169:488–493.
- ,,, et al.Does influenza vaccination prevent asthma exacerbations in children?J Pediatr.2001;138:306–310.
- Red Book: Pharmacy's Fundamental Reference.2006 ed: Thomson Healthcare2006.
- Flu Vaccine Pre‐Book 2007‐08. Dubin Medical Incorporation. Available at: http://www.dubinmedical.com/news/index.htm. Accessed June 21,2007.
- Bureau of Labor Statistics Data. U.S. Department of Labor: Bureau of Labor Statistics; 2006. Available at: http://www.bls.gov. Accessed May 18,2007.
- Association Medical Association.Socioeconomics of medical practice, 1997.Am Med Assoc.1997;69(89):107.
- ,.The Cost of antibiotics in treating respiratory tract infections in a Medicaid population.Arch Fam Med.1998;7:45–49.
- ,,.Comparison of US inactivated split‐virus and Russian attenuated, cold‐adapted trivalent influenza vaccines in Russian schoolchildren.JInfect Dis.1996;173:453–456.
- ,.Current estimates from the National Health Interview Survey, 1994. National Health Statistics.Vital Health Stat.1995;10:193.
- ,,,,,.Influenza B virus infections in the community and the family. The epidemics of 1976‐1977 and 1979‐1980 in Houston, Texas.Am J Epidemiol.1983;118:313–325.
- ,,,,,.Emergence and apparent transmission of rimantidine‐resistant influenza a virus in families.N Engl J Med.1989;321:1696–1702.
- ,,, et al.The effectiveness ofvaccination against influenza in healthy, working adults.N Engl J Med.1995;333:889–893.
- ,,,.The efficacy and cost effectiveness of vaccination against influenza among elderly persons living in the community.N Engl J Med.1994;331:778–784.
Influenza is estimated to infect up to 40%‐54% of school‐age children during an influenza season.1, 2 Influenza infections result in missed school days, visits to primary care providers, prescriptions for antibiotics, hospitalizations, and secondary infections.310 Although influenza‐related mortality of pediatric patients is rare, influenza‐related morbidity of children and those secondarily infected is common and partially preventable.11
For at‐risk individuals, immunization against influenza is the best method of preventing morbidity. The Centers for Disease Control's Advisory Committee on Immunization Practice (CDC/ACIP) considers children with asthma at high risk of morbidity from influenza and since 1964 has recommended delivery of inactivated influenza vaccination to this population of patients. Even with this recommendation, the current level of adherence to yearly influenza vaccination of children with asthma is approximately 29%, according to the CDC analysis of the National Health Interview Survey.12 Although pediatric providers may prefer to provide preventive care in an ambulatory setting, the CDC/ACIP emphasizes the need for vaccination delivery wherever possible, including in acute‐care hospitals.11 Particularly in an acute‐care setting, vaccinating patients who are having an exacerbation of their asthma and who may have a compromised immune response may raise concerns. However, the vaccine has been shown to be efficacious even with pediatric asthmatics on a short course of corticosteroids.13, 14 Utilization of the inpatient visit as an opportunity to implement evidence‐based preventive care to pediatric asthmatics could have a beneficial effect on patient outcomes. Group‐based settings (school or health fair) are more cost effective than individual‐initiated settings (primary care) for influenza vaccination of pediatric patients.15 However, we found no studies investigating the effectiveness of vaccinating high‐risk patients in an acute‐care setting.
This study used established modeling techniques (decision and cost‐effectiveness analyses) to determine the potential clinical and cost benefits of vaccinating children against influenza during an asthma exacerbation in an acute‐care setting. We used decision analysis to determine the effectiveness of the intervention in improving the up‐to‐date (UTD) status of a hypothetical population. Based on this improvement in vaccination delivery, we completed a cost‐effectiveness analysis to determine direct and indirect costs, improvement in clinical outcomes attributable to influenza (clinic visits, antibiotic use, hospitalization, and secondary infections), and cost savings attributable to the intervention.
METHODS
Decision Analysis
We generated a decision tree to represent an inpatient intervention to assess and deliver influenza vaccination to children with asthma in acute‐care hospitals (Fig. 1). The design of the decision tree intentionally began with a decision node in order to introduce different assessment rates. This approach was used in order to accurately represent an inpatient intervention (where 100% assessment is not always attained) and to assess how less‐than‐perfect rates of assessment of influenza vaccine status would affect the success of the intervention. Once the decision tree was created, we surveyed the literature to obtain data on the assumptions of the decision tree (See Table 1 for assumptions of decision analysis with corresponding numbering in Figure 1 Decision Tree) including percentage of children with asthma who receive the influenza vaccine (29%),12 percentages of patients and caregivers who would agree to be vaccinated in an acute‐care settings (71%),16 and rates of response to vaccine reminder recall systems in a primary care setting (30%)17 in order to account for populations that need a second dose of vaccine to become UTD. To estimate the percentage of children who would require a second vaccination at 4 weeks, we utilized the Healthcare Cost and Utilization Project Kids Inpatient Database (HCUP KID).18 Seventy‐three percent of children younger than 9 years old in the HCUP KID were discharged with a diagnosis of asthma. These patients would require a second vaccination after 4 weeks if they had not previously been immunized. After all the estimates were placed in the decision tree, a hypothetical cohort of children with asthma was introduced, and improvement in UTD status after the intervention was determined.
| Reference | ||
|---|---|---|
| Decision analysis | ||
| 1. Percentage of asthmatics UTD with influenza vaccination without increased inpatient assessment | 29% | 12 |
| 2. Percentage of caregivers who agree with vaccination in an acute‐care setting | 71% | 16 |
| 3. Percentage of asthma exacerbation discharges <9 years old | 73% | 18 |
| 4. Percentage of caregivers who respond to reminder‐recall systems for outpatient vaccination | 30% | 17 |
| Cost‐effectiveness analysis | ||
| 5. Prevalence of influenza in school‐age children over 1 season | 45% | 1 |
| 6. Vaccine efficacy | 15 | |
| Best case | 43% | |
| Base case | 56% | |
| Worst case | 75% | |
| 7. Risk of secondary transmission | 18% | 31, 32 |
| 8. Missed school days (per child per year) attributed to influenza | 0.79 | 29, 30 |
| 9. Percentage of caregivers who miss work to care for sick child | 53% | 6 |
Cost‐Effectiveness Analysis
The purpose of the cost‐effectiveness analysis was to evaluate potential cost savings attributable to improvement in vaccination delivery (UTD status). Direct and indirect costs were obtained by review of the current published literature pertaining to costs of influenza and influenza vaccination. The key assumptions for the cost‐effectiveness analysis are present in Table 1.
Vaccine Efficacy and Cost
Studies of influenza vaccine efficacy in those with asthma have had widely variable results on clinical outcomes.1923 Therefore, for the purpose of these analyses, we used a best‐case, worst‐case, base‐case vaccine efficacy approach as previously described.15 The vaccine efficacy base case was estimated as 56%, best case as 75%, and worst case as 43%. The primary cost‐effectiveness analysis was performed with the base‐case efficacy. Sensitivity analysis was performed by varying the vaccine efficacy between worst‐case efficacy and best‐case efficacy in order to determine effects on clinical outcomes and cost savings.
We determined the cost associated with vaccination assessment and delivery. Cost of only assessing a patient for vaccination without delivery was calculated as $5.32 on the basis of the assumption that a registered nurse (RN) would print a form (2 minutes), ask screening questions and wait for replies (5 minutes), and fax the form/order to the pharmacy and/or place it in the medical record (1 minute) at an RN salary of $40/hour. Assessment and administration of the vaccination was assumed to cost $18.84. This was based on additional nursing time of 10 minutes (1 minute to check arrival of the vaccination, 2 minutes to prepare it, 5 minutes to inject and dispose of it, and 1 minute to record delivery of the vaccination in the medical record) plus the cost of the vaccine (estimated as $6.75)24 and related supplies (estimated as $0.67 for the safety syringe, $0.01 for cotton balls, $0.01 for alcohol preps, and $0.065 for rubber gloves).25 The cost of vaccine and supplies was determined by reviewing pharmaceutical reference books and medical equipment billing Web sites. The indirect cost of delivery of the second vaccination in the outpatient setting to patients requiring 2 shots to become UTD was 3 hours of missed work per caregiver.
Influenza Prevalence and Morbidity
The prevalence of influenza in school‐age children is estimated at 40%54% among those not at high risk during influenza season.1 For this analysis we used 45%. Morbidity associated with influenza has been estimated as 120200 clinic visits and 65140 antibiotic prescriptions per 1000 children per year.9 This analysis used 150 clinic visits and 100 antibiotic prescriptions per 1000 children. The rate of hospitalization for influenza of high‐risk children per 100,000 is 1900 for those aged 0‐11 months, 800 for those aged 12 years, 320 for those aged 34 years, and 92 for those aged 514 years.8, 11 The risk of hospitalization for the model's hypothetical cohort was age‐adjusted using the age distribution found in the HCUP KID for children discharged with a primary diagnosis of asthma. The age distribution of children in the HCUP KID was 34% were 12 years, 15% were 34 years, and 51% were 514 years.18 Children aged 011 months were excluded because of the low likelihood that this age group was at risk for influenza complicated by asthma. The age‐adjusted risk for the hypothetical cohort in this analysis was 360 hospitalizations/100,000 children.
To investigate the effect of year‐to‐year variation in influenza prevalence and morbidity, the lowest and then highest estimates for these measures from previous studies were used in the model to determine the effect on the outcomes of cost per vaccination and cost per assessment. During this analysis all the measures were simultaneously entered at their lowest estimates to simulate a less active influenza season and then at their highest estimates to simulate a more active influenza season. The lowest and highest estimates of these assumptions were: influenza prevalence, 31% and 54%3; number of clinic visits, 120 to 200 per 1000 children8; and number of antibiotic prescriptions, 65 to 140 per 1000 children.8 No range was found in the literature for risk of hospitalization. Therefore, the standard 25% decrease and 25% increase were used as the lowest and highest estimates. The results of this analysis demonstrated the range of cost savings per year based on the prevalence and morbidity of influenza.
Direct and Indirect Cost of Influenza
Cost data were collected from multiple studies and inflated to 2006 dollars using the Bureau of Labor Statistics consumer price index for medical care and medical care services.26 The costs of a clinic visit and antibiotic prescription were assumed to be $5127 and $9.91,28 which were inflated to 2006 dollars: $70.09 and $13.76, respectively. Used as the mean cost for hospitalization in this analysis ($15,2695) was the more conservative estimate from 2 recent articles on determining the cost of hospitalization of high‐risk pediatric patients with influenza‐related illness.4, 5 Number of school days missed by children attributed to influenza has been previously established as 0.79 days per child per year.29, 30 The cost of a caregiver missing work to care for a child was assumed to be the median hourly wage of a child care provider according to the Bureau of Labor and Statistics 2005, which was $9.47/hour, or $9.94/hour in 2006 dollars. The model assumed that there was a 53% chance that a caregiver would need to miss work for a sick child.6 In addition, there was a risk of secondary transmission of 18%31, 32 to an average of 1.72 adults (percentage of 2‐parent households = 72%15). The cost of an adult secondary infection was $65.25, inflated to $99.49 in 2006 dollars. The estimate for the cost of a secondary infection was derived from a article by Nichol et al., who investigated the cost of influenza for healthy working adults.33 The total savings per vaccination of a healthy working adult was estimated as $46.85. This estimate included $10, the cost of the vaccination; $0.69, the cost of the side effects of the vaccine; and $7.71, the cost of missing work in order to receive the vaccination. A secondary case of influenza would be prevented without incurring these additional costs of vaccination, and therefore $65.25 (inflated to $99.49) was used in this analysis.
RESULTS
With existing data showing that only 29% of those with asthma are UTD on influenza vaccine in a given year, our decision analysis demonstrated that even modest increases in the rate of screening for influenza vaccine status among hospitalized patients with asthma can result in clinically significant increases in the rate of vaccine delivery. For example, screening of just 20% of hospitalized patients with asthma would result in 35% of the children ultimately being up to date for that influenza season, a 20% overall improvement. In the same manner, a 40% assessment rate would result in 41% of children ultimately becoming UTD, a 60% assessment rate in 47% ultimately becoming UTD, an 80% assessment rate in 53% ultimately becoming UTD, and a 100% assessment in 59% ultimately becoming UTD, which is double the baseline rate (Table 2 ).
| Percent assessment | Vaccinations delivered (per 1000 patients) | Postintervention UTD |
|---|---|---|
| ||
| No increased assessment | None inpatient | 29% |
| 10% | 59 | 32% |
| 20% | 119 | 35% |
| 30% | 178 | 38% |
| 40% | 237 | 41% |
| 50% | 252 | 44% |
| 60% | 356 | 47% |
| 70% | 415 | 50% |
| 80% | 475 | 53% |
| 90% | 534 | 56% |
| 100% | 593 | 59% |
| Direct cost of influenza | Indirect cost of influenza | Cost of inpatient vaccination | Total | Savings | |
|---|---|---|---|---|---|
| No increased assessment | $56.48 | $39.51 | $ 0 | $95.99 | Base |
| Intervention to increase assessment | $45.24 | $31.64 | $13.66 | $90.54 | $5.45 |
This cost analysis demonstrated cost savings of $5.45 per child assessed and $9.19 per child vaccinated (Table 3). The cost savings per child assessed was lower than per child vaccinated because of including the costs of assessment without delivery of vaccination. This estimated savings is lower than the previously published $34.79 per vaccination of school‐age children in a group setting but more comparable to the cost savings of $3.99 in an individual‐initiated setting.15
The cost savings with this intervention depends on the vaccine's efficacy, and efficacy can vary as a function of whether it is an epidemic season and the degree of matching between the prevalent influenza strains and the vaccine strains. At higher predicted levels of vaccination efficacy, UTD patients have improved, less negative outcomes from influenza, and the intervention results in higher cost savings (cost savings with base‐case vaccine efficacy of $5.45/child assessed increases to $11.93/child assessed with best‐case vaccine efficacy). No current research accurately predicts vaccine efficacy for each outcome in pediatric patients with asthma. Therefore, this study design varied vaccine efficacy during sensitivity analyses among 3 potential vaccine efficacy scenarios (best‐, base‐, and worst‐case scenarios).15 Varying the vaccine efficacy to the best‐case scenario resulted in a cost savings of $11.93 per child assessed and $20.13 per child vaccinated. Dropping the efficacy to the worst‐case scenario resulted in cost savings of $1.01 per child assessed and $1.71 per child vaccinated. If the vaccine efficacy was 40%, the intervention was cost neutral. It should be remembered that the goal of the health care system is to generate good health. A project that is cost neutral (cost of vaccination intervention = cost savings from illness prevention), such as this intervention with a vaccine efficacy of 40%, may still be considered cost effective because of the improvement in clinical outcomes. At a vaccine efficacy of 40%, this model predicts that clinic visits will decrease by 19/1000 children, unwarranted antibiotics will decrease by 12/1000 children, hospitalizations will decrease by 4/10,000 children, and secondary infections of adult caregivers will decrease by 17/1000 children, suggesting an overall benefit to the health care system and to patients.
The clinical improvement predicted by this model with base‐case vaccine efficacy and 100% assessment include: a decrease in clinic visits of 27/1000 children, decrease in antibiotic use of 75/1000 children, decrease in hospitalizations of 6/10,000 children, decrease in missed school days of 132/1000 children, and a decrease in secondary infections of adult caregivers of 23/1000 children assessed.
The total cost of vaccination in this intervention was estimated as $10,593 per 1000 children. A hospital that discharges fewer than 1000 children with asthma per year would accrue less direct cost yearly with this intervention ($1059 per 100 children). A portion of this cost could be recuperated through reimbursement for influenza vaccination via insurance payers and/or government programs to reimburse for childhood vaccinations.
The results from the investigation into the effect of year‐to‐year variation in influenza prevalence and morbidity (by using the lowest and highest estimates found in the literature) demonstrated the model to be sensitive to these estimates, but the intervention maintained a cost savings. In a year with low influenza prevalence and morbidity, the cost savings decreases to $1.89 per child assessed and $3.20 per child vaccinated. In a year with high influenza prevalence and morbidity, the cost savings would increase to $8.75 per child assessed and $14.77 per child vaccinated. This finding of cost savings even with low influenza prevalence and morbidity is consistent with previous studies of influenza vaccination of pediatric patients in group‐based settings.15
For all other estimates, traditional sensitivity analysis was performed, and the results continued to show cost savings during this procedure, suggesting that the conclusions based on this model are generalizable and robust.
DISCUSSION
Universal screening for influenza vaccine status and then delivery of the vaccine to those not UTD among hospitalized children with asthma has the potential to increase the percentage of these children receiving the influenza vaccine and to reduce costs. This model suggests that with 100% assessment of this difficult‐to‐reach population for being UTD with the influenza vaccine, it would be possible to achieve a vaccination rate of 59%, doubling the current yearly receipt of influenza vaccination of children admitted secondary to asthma. However, universal screening is not imperative to achieve significant clinical improvement and cost savings. The cost‐effectiveness analysis demonstrated that the cost savings would be $5.45 per child assessed and $9.19 per child vaccinated.
The cost savings in this analysis ($9.19/child vaccinated) is favorable but lower than a previous analysis of influenza vaccination of children in an unspecified group‐based setting ($34.79/child vaccinated).15 Multiple factors contributed to our lower cost savings. First, our model accounts for the cost of children becoming partially vaccinated, incurring the full cost for 1 vaccination without the resulting clinical benefit. Second, the model accommodates for nursing assessment without vaccination delivery. Most importantly, this model estimates direct cost of vaccination delivery more conservatively than other group‐based estimates ($18.84 vs. $4.31).15 Previous cost‐effective analyses of influenza vaccination referenced 2 articles from the mid‐1990s that used a direct cost for 1 vaccination of $4 for group‐based vaccination in an HMO34 and $10 for individual‐initiated vaccination.33 Our estimate of vaccine cost is more conservative than these studies but more likely to represent the cost of vaccination assessment and delivery in an acute‐care hospital setting.
As the model was created, it became apparent that vaccination in the inpatient setting would accrue less indirect costs as compared with an individual‐initiated outpatient setting. This is a result of there not being any incrementally increased loss of work by the family/caregiver in order to be vaccinated above that lost because of hospitalization of the child for asthma. This finding supports that there is cost savings by vaccinating pediatric patients while hospitalized and is consistent with previous literature on this subject.15
The use of modeling techniques to evaluate inpatient interventions has many benefits. Modeling techniques permit the generation of synthetic trials by utilizing the combined published data from multiple studies. This permits the investigator to apply findings to other populations with different risks or prognoses and to other settings, to extend the impact over time, and to display multiple outcomes together. This technique has the potential to be used in investigations of the theoretical benefit of a specific quality improvement intervention in an inpatient setting without the extensive cost of a clinical trial. In fact, preliminary analysis with modeling could improve the cost efficiency of quality improvement research. Modeling studies could demonstrate which interventions are most likely to generate cost savings and direct clinical investigation and funding.
Limitations of this project included the possibility of vaccine efficacy changing from year to year depending on the similarity of the viruses in the vaccine with the predominant infectious strains circulating that year, as observed in previous studies.11 In a year with a poor match, the cost savings would be reduced compared with that in years with a good match. In addition, influenza prevalence and morbidity affects this model and the cost savings of the intervention, but the analysis using the lowest estimates of prevalence and morbidity continued to demonstrate that the intervention was saving costs. This continued cost savings for a group‐based vaccination intervention during years when there is low prevalence and morbidity is consistent with previous reports in the literature for pediatric patients.15 Modeling techniques decrease the effect of year‐to‐year variation in vaccination match, prevalence, and morbidity and estimate results based on an average over multiple influenza seasons.
For children with asthma, the data are not well established about influenza vaccination's ability to improve specific clinical outcomes attributed to influenza illness (missed school days, clinic visits, antibiotic prescriptions, hospitalizations, and secondary infections). Acknowledging the limitations of these data, our model estimates the intervention's improvement in clinical outcomes by using published data on vaccine efficacy and varying the vaccine efficacy from worst case to base case to best case. In addition, with a vaccine efficacy of 40%, this intervention would be cost neutral. Regardless of concerns about vaccine efficacy, the CDC/ACIP recommends finding missed opportunities for vaccination to improve vaccination delivery and the ultimate UTD status of high‐risk children. Recently, the CDC/ACIP stated that influenza vaccination coverage among children with asthma is inadequate and that opportunities for vaccination during health‐care provider visits likely are being missed.12 This intervention to assess and deliver influenza vaccination to pediatric patients while hospitalized for an asthma exacerbation would allow all hospitals that treat children to participate in reaching the goal of the CDC/ACIP to reduce missed opportunities for influenza vaccination.
The direct cost of inpatient vaccination in this intervention would fall primarily on the hospital implementing the intervention ($10,593 per 1000 children). However, the Vaccines for Children program exists to offset the cost of immunizations to both patients and providers for the uninsured and children receiving Medicaid.11 If properly implemented by participating hospitals, this program would improve reimbursement for vaccination and therefore shift the cost away from the individual hospital. For example, if the intervention cost borne by a hospital were decreased by the direct cost of vaccination alone ($6.75), this model predicts the cost of a program per 1000 children would decrease from $10,593 to $7190. This cost reduction would depend on the percentage of patients uninsured or on Medicaid at a given hospital. Another approach to shifting cost from individual hospitals would be for policy makers to consider influenza vaccination of these high‐risk pediatric patients as a performance/quality measure and associate the measure with improved reimbursement to hospitals in order to compensate for the cost of the vaccination intervention.
CONCLUSIONS
Influenza immunization is an accepted method of prevention and is underutilized in children with asthma.12 This model suggests that an inpatient program to deliver influenza vaccination to hospitalized pediatric patients with asthma would be beneficial by producing better health outcomes and reducing health care costs. Further research should be performed to verify the assumptions used in this analysis for children with asthma.
Acknowledgements
The authors acknowledge all the individuals who participated in the Academic Generalist Fellowship in Health Services Research at the Medical University of South Carolina for their direct and indirect participation in the study.
- ,,.Longitudinal studies of types a and b influenza among Seattle schoolchildren and families.J Infect Dis.1976;134:362–369.
- ,,,,.Influenza virus infections in infants.Pediatr Infect Dis J.1997;16:1065–1068.
- ,.Economic impact of influenza vaccination in preschool children.Pediatrics.2000;106:973–976.
- ,.Cost of influenza hospitalization at a tertiary care children's hospital and its impact on the cost‐benefit analysis of the recommendation for universal influenza immunization in children age 6 to 23 months.J Pediatr.2005;147:807–811.
- ,,,,.Direct medical cost of influenza‐related hospitalizations in children.Pediatrics.2006;118:e1321–e1327.
- ,,,.School absenteeism, parental work loss, and acceptance of childhood influenza vaccination.Am J Med Sci.2001;321:178–180.
- ,,.Illness among schoolchildren during influenza season: effect on school absenteeism, parental absenteeism from work, and secondary illness in families.Arch Pediatr Adolesc Med.2002;156:986–991.
- ,,,,.The effect of influenza on hospitalizations, outpatient visits, and courses of antibiotics in children.N Engl J Med.2000;342:225–231.
- ,,,.The burden of influenza illness in children with asthma and other chronic medical conditions.J Pediatr.2000;137:856–864.
- ,,, et al.The underrecognized burden of influenza in young children.N Engl J Med.2006;355(1):31–40.
- ,,,,,.Prevention and control of influenza: recommendations of the Advisory Committee on Immunization Practices (ACIP).MMWR Recomm Rep.2006;55(RR‐10):1–42.
- ,,,.Influenza vaccination coverage among children with asthma—United States, 2004–05 influenza season.MMWR Weekly.2007;56(9):193–196.
- ,,,,.Effect of prednisone on response to influenza virus vaccine in asthmatic children.Arch Pediatr Adolesc Med.1998;152:1191–1195.
- ,,,,.Influenza vaccination of children during acute asthma exacerbation and concurrent prednisone therapy.Pediatrics.1996;98(2 Pt 1):196–200.
- ,,.Potential cost savings attributable to influenza vaccination of school‐aged children.Pediatrics.1999;103:e73.
- .Providing immunizations in a pediatric emergency department: underimmunization rates and parental acceptance.Pediatr Emerg Care.1999;15:255–259.
- ,,,.Improving influenza vaccination rates in children with asthma: a test of a computerized reminder system and an analysis of factors predicting vaccination compliance.Pediatrics.1992;90:871–875.
- HealthCare Cost and Utilization Project: Kids' Inpatient Database (KID)2000. Agency for Healthcare Research and Quality.
- ,,,,.Influenza vaccination in patients with asthma: effect on the frequency of upper respiratory tract infections and exacerbations.J Asthma.2004;41:279–283.
- ,,,,,.Clinical effectiveness of conventional influenza vaccination in asthmatic children.Epidemiol Infect.2002;128:205–211.
- ,,, et al.Influenza vaccination in asthmatic children: effects on quality of life and symptoms.Eur Respir J.2004;24:925–931.
- ,,, et al.Influenza vaccination in children with asthma: randomized double‐blind placebo‐controlled trial.Am J Respir Crit Care Med.2004;169:488–493.
- ,,, et al.Does influenza vaccination prevent asthma exacerbations in children?J Pediatr.2001;138:306–310.
- Red Book: Pharmacy's Fundamental Reference.2006 ed: Thomson Healthcare2006.
- Flu Vaccine Pre‐Book 2007‐08. Dubin Medical Incorporation. Available at: http://www.dubinmedical.com/news/index.htm. Accessed June 21,2007.
- Bureau of Labor Statistics Data. U.S. Department of Labor: Bureau of Labor Statistics; 2006. Available at: http://www.bls.gov. Accessed May 18,2007.
- Association Medical Association.Socioeconomics of medical practice, 1997.Am Med Assoc.1997;69(89):107.
- ,.The Cost of antibiotics in treating respiratory tract infections in a Medicaid population.Arch Fam Med.1998;7:45–49.
- ,,.Comparison of US inactivated split‐virus and Russian attenuated, cold‐adapted trivalent influenza vaccines in Russian schoolchildren.JInfect Dis.1996;173:453–456.
- ,.Current estimates from the National Health Interview Survey, 1994. National Health Statistics.Vital Health Stat.1995;10:193.
- ,,,,,.Influenza B virus infections in the community and the family. The epidemics of 1976‐1977 and 1979‐1980 in Houston, Texas.Am J Epidemiol.1983;118:313–325.
- ,,,,,.Emergence and apparent transmission of rimantidine‐resistant influenza a virus in families.N Engl J Med.1989;321:1696–1702.
- ,,, et al.The effectiveness ofvaccination against influenza in healthy, working adults.N Engl J Med.1995;333:889–893.
- ,,,.The efficacy and cost effectiveness of vaccination against influenza among elderly persons living in the community.N Engl J Med.1994;331:778–784.
Copyright © 2008 Society of Hospital Medicine