User login
Race and Age-Related PSA Testing Disparities in Spinal Cord Injured Men: Analysis of National Veterans Health Administration Data
Prostate cancer will be diagnosed in 12.5% of men during their lifetime. It is the most commonly diagnosed solid organ cancer in men.1 However, prostate cancer screening for prostate-specific antigen (PSA) remains controversial due to concerns about overdiagnosis, as the overall risk of dying of prostate cancer is only 2.4%.1
To address the risk and benefits of PSA testing, in 2012 the US Preventive Services Task Force (USPSTF) recommended against routine PSA testing.2 Updated 2018 recommendations continued this recommendation in men aged > 70 years but acknowledged a small potential benefit in men aged 55 to 69 years and suggested individualized shared decision making between patient and clinician.3 In addition, American Urological Association (AUA) guidelines for the early detection of prostate cancer recommend against PSA screening in men aged < 40 years or those aged > 70 years, shared decision making for individuals aged 55 to 70 years or in high-risk men aged 40 to 55 years (ie, family history of prostate cancer or African American race).4 PSA screening is not recommended for men with a life expectancy shorter than 10 to 15 years aged > 70 years.4
The Veterans Health Administration (VHA) is the largest integrated health care system in the US.5 In addition, the US Department of Veterans Affairs (VA) Spinal Cord Injury and Disorders System of Care operates 25 centers throughout the US.6 Life expectancy following spinal cord injury (SCI) increased significantly through the 1980s but has since plateaued, with life expectancy being impacted by age at injury, completeness of injury, and neurologic level.7,8 As part of a program of uniform care, all persons with SCI followed at the Spinal Cord Injury and Disorders System of Care centers are offered comprehensive annual evaluations, including screening laboratory tests, such as PSA level.9
Patients with SCI present a unique challenge when interpreting PSA levels, given potentially confounding factors, including neurogenic bladder management, high rates of bacteriuria, urinary tract infections (UTIs), testosterone deficiency, and pelvic innervation that differs from the noninjured population.10,11 Unfortunately, the literature on prostate cancer prevalence and average PSA levels in patients with SCI is limited by the small scope of studies and inconsistent data.10-16 Therefore, the purpose of the current investigation was to quantify and analyze the rates of annual PSA testing for all men with SCI in the VHA.
Methods
Approval was granted by the Richmond VA Medical Center (VAMC) Institutional Review Board in Virginia, and by the VA Informatics and Computing Infrastructure (VINCI) data access request tracker system for extraction of data from the VA Corporate Data Warehouse. Microsoft Structured Query Language was used for data programming and query design. Statistical analysis was conducted using Stata version 15.1 with assistance from professional biostatisticians.
Only male veterans with a nervous system disorder affecting the spinal cord or with myelopathy were included, based on International Classification of Diseases (ICD) version 9 and 10 codes, corresponding to traumatic and nontraumatic myelopathy. Veterans diagnosed with myelopathy based on ICD codes corresponding to progressive or degenerative myelopathies, such as multiple sclerosis or amyotrophic lateral sclerosis, were excluded.
For each veteran, extracted data included the unique identification number, date of birth, ICD code, date ICD code first appeared, race, gender, death status (yes/no), date of death (when applicable), date of each PSA test, PSA test values, and the VAMC where each test was performed. Only tests for total PSA were included. The date that the ICD code first appeared served as an approximation for the date of SCI. The time frame for the study included all PSA tests in the VINCI database for 2000 through 2017. However, only post-SCI PSA tests were included in the analysis. Duplicate tests (same date/time) were eliminated.
Race is considered a risk factor for prostate cancer only for African American patients, likely due to racial health disparities.17 Given this, we chose to categorize race as either African American or other, with a third category for missing/inconsistent reporting. Age at time of the PSA test was categorized into 4 groups (≤ 39, 40-54, 55-69, and ≥ 70 years) based on AUA guidelines.4 The annual PSA testing rate was calculated for each veteran with SCI as the number of PSA tests per year. A mean annual PSA test rate was then calculated as the weighted (by exposure time) mean value for all annual PSA testing rates from 2000 through 2017 for each age group and race. Annual exposure was calculated for each veteran and defined as the number of days a veteran was eligible to have a PSA test. This started with the date of SCI diagnosis and ended with either the date of death or the date of last PSA. If a veteran moved from one age group to another in 1 year, the first part of this year’s exposure was included in the calculation of the annual PSA testing rate for the younger group and the second part was included for the calculation of the older group. For deceased veterans, the death date was excluded from the exposure period, and their exposure period ended on the day before death.
Statistical Analysis
To compare PSA testing rates between African American race and other races, Poisson regression was used with exposure treated as an offset (exposures were summed across years for each veteran). An indicator (dummy) variable for African American race vs other races was coded, and statistical significance was set at P < .05. To check sensitivity for the Poisson assumption that the mean was equal to the variance, negative binomial regression was used. To assess for geographic PSA testing rate variability, the data were further analyzed based on the locations where PSA tests were performed. This subanalysis was limited to veterans who had all PSA tests in a single station. For each station, the average PSA testing rate was calculated for each veteran, and the mean for all annual PSA testing rates was used to determine station-specific PSA testing rates.
Results
A total of 45,274 veterans were initially identified of which 367 females were excluded (Figure 1).

The PSA testing rate rose for veterans in the age groups ≤ 39, 40 to 54, and 55 to 69 years (Figure 2A). 
Of the cohort of 37,243 veterans, 28,396 (76.2%) had their post-SCI tests done at a single facility, 6770 (18.1%) at 2 locations, and 2077 (5.5%) at > 2 locations. Single-station group data were included in a subanalysis to determine the mean (SD) PSA testing rates, which for the 123 locations was 0.98 (0.36) tests per veteran per year (range, 0.2-3.0 tests per veteran per year).
To assess the impact of the 2012 USPSTF recommendations on PSA testing rates in veterans with SCI, mean PSA testing rates were calculated for 5 years before the recommendations (2007-2011) and compared with the average PSA testing rate for 5 years following the updated recommendations (2013-2017). The USPSTF updated its recommendation again in 2018 and acknowledged the potential benefit for PSA screening in certain patient populations.2,3 Surprisingly, and despite recommendations, the results show a significant increase in PSA testing rates in all age groups for all races (P < .001) (Figure 4).
Discussion
The goal of this study was to establish testing rates and analyze PSA testing trends across races and age groups in veterans with SCI. This is the largest cohort of patients with SCI analyzed in the literature. The key findings of this study were that despite clear AUA guidelines recommending against PSA testing in patients aged ≤ 39 years and ≥ 70 years, there are high rates of testing in veterans with SCI in these age groups (0.46 tests per year in those aged ≤ 39 years and 0.91 tests per year in those aged ≥ 70 years). In terms of race, as expected based on increased risk,
Prostate Cancer Incidence
Although the exact mechanism behind alterations in prostate function in the SCI population have yet to be fully elucidated, research suggests that the prostate behaves differently after SCI. Animal models of prostate gland denervation show decreased prostate volume and suggest that SCI may lead to a reduction in prostatic secretory function associated with autonomic dysfunction. Shim and colleagues hypothesized that impaired autonomic prostate innervation alters the prostatic volume and PSA in patients with SCI.10
Additional studies looking at actual PSA levels in men with SCI reveal conflicting data.10-15,20 Toricelli and colleagues retrospectively studied 140 men with SCI, of whom 34 had PSA levels available and found that mean PSA was not significantly different for patients with SCI compared with controls, but patients using clean intermittent catheterization had 2-fold higher PSA levels.21 In contrast, Konety and colleagues found that mean PSA was not significantly different from uninjured controls in their cohort of 79 patients with SCI, though they did find a correlation between indwelling catheter use and a higher PSA.22
Studies have shown an overall decreased risk of prostate cancer in patients with SCI, though the mechanism remains unclear. A large cohort study from Taiwan showed a lower risk of prostate cancer for 54,401 patients with SCI with an adjusted hazard ratio of 0.73.23 Patel and colleagues found the overall rate of prostate cancer in the population of veterans with SCI was lower than the general uninjured VA population, though this study was limited by scope with only 350 patients with SCI.24 A more recent systematic review and meta-analysis of 9 studies evaluating the prevalence of prostate cancer in men with SCI found a reduction of up to 65% in the risk of prostate cancer in men with SCI, and PSA was found to be a poor screening tool for prostate cancer due to large study heterogeneity.16
PSA Screening
This study identified widespread overscreening using the PSA test in veterans with SCI, which is likely attributable to many factors. Per VHA Directive 1176, all eligible veterans are offered yearly interdisciplinary comprehensive evaluations, including laboratory testing, and as such veterans with SCI have high rates of annual visit attendance due to the complexity of their care.9 PSA testing is included in the standard battery of laboratory tests ordered for all patients with SCI during their annual examinations. Additionally, many SCI specialists use the PSA level in patients with SCI for identifying cystitis or prostatitis in patients with colonization who may not experience typical symptoms. Everaert and colleagues demonstrated the clinical utility for localizing UTIs to the upper or lower tract, with elevated PSA indicating prostatitis. They found that serum PSA has a sensitivity of 68% and a specificity of 100% in the differential diagnosis of prostatitis and pyelonephritis.25 As such, the high PSA screening rates may be reflective of diagnostic use for infection rather than for cancer screening.
Likely as a response to the USPSTF recommendations, there has been a national slow decline in overall PSA screening rates since 2012.26-28 A study from Vetterlein and colleagues examining changes in the PSA screening trends related to USPSTF recommendations found an 8.5% decline in overall PSA screening from 2012 to 2014.29 However, the increase in PSA testing across all ages and races in the VA population with SCI over the same period is not entirely understood and suggests the need for further research and education in this area.
Limitations
This study is limited by the use of data identified by ICD codes rather than by review of individual health records. This required the use of decision algorithms for data points, such as the date of SCI. In addition, analysis was not able to capture shared decision making that may have contributed to PSA screening outside the recommended age ranges based on additional risk factors, such as family history of lethal malignancy. Furthermore, a detailed attempt to define specific age-adjusted PSA levels was beyond the scope of this study but will be addressed in later publications. In addition, we did not exclude individuals with a diagnosis of prostate adenocarcinoma, prostatitis, or recurrent UTIs because the onset, duration, and severity of disease could not be definitively ascertained. Finally, veterans with SCI are unique and may not be reflective of individuals with SCI who do not receive care within the VA. However, despite these limitations, this is, to our knowledge, the largest and most comprehensive study evaluating PSA testing rates in individuals with SCI.
Conclusions
Currently, PSA screening is recommended following shared decision making for patients at average risk aged 55 to 70 years. Patients with SCI experience many conditions that may affect PSA values, but data regarding normal PSA ranges and rates of prostate cancer in this population remain sparse. The study demonstrated high rates of overtesting in veterans with SCI, higher than expected testing rates in African American veterans, a paradoxical increase in PSA testing rates after the 2012 publication of the USPSTF PSA guidelines, and wide variability in testing rates depending on VA location.
African American men were tested at higher rates across all age groups, including in patients aged > 70 years. To balance the benefits of detecting clinically significant prostate cancer vs the risks of invasive testing in high-risk populations with SCI, more work is needed to determine the clinical impact of screening practices. Future work is currently ongoing to define age-based PSA values in patients with SCI.
Acknowledgments
This research was supported in part through funding from the Center for Rehabilitation Science and Engineering, Virginia Commonwealth University Health System.
1. American Cancer Society. Key statistics for prostate cancer. Updated January 12, 2023. Accessed June 2, 2023. https://www.cancer.org/cancer/prostate-cancer/about/key-statistics.html
2. Moyer VA; U.S. Preventive Services Task Force. Screening for prostate cancer: U.S. Preventive Services Task Force recommendation statement. Ann Intern Med. 2012;157(2):120-134. doi:10.7326/0003-4819-157-2-201207170-00459
3. US Preventive Services Task Force, Grossman DC, Curry SJ, et al. Screening for Prostate Cancer: US Preventive Services Task Force Recommendation Statement. JAMA. 2018;319(18):1901-1913. doi:10.1001/jama.2018.3710
4. Carter HB, Albertsen PC, Barry MJ, et al. Early detection of prostate cancer: AUA Guideline. J Urol. 2013;190(2):419-426. doi:10.1016/j.juro.2013.04.119
5. US Department of Veterans Affairs, Veterans Health Administration. Updated August 15, 2022. Accessed June 2, 2023. https://www.va.gov/health/aboutVHA.asp
6. US Department of Veterans Affairs. Spinal cord injuries and disorders system of care. Updated January 31, 2022. Accessed June 2, 2023. https://www.sci.va.gov/VAs_SCID_System_of_Care.asp
7. DeVivo MJ, Chen Y, Wen H. Cause of death trends among persons with spinal cord injury in the United States: 1960-2017. Arch Phys Med Rehabil. 2022;103(4):634-641. doi:10.1016/j.apmr.2021.09.019
8. Cao Y, DiPiro N, Krause JS. Health factors and spinal cord injury: a prospective study of risk of cause-specific mortality. Spinal Cord. 2019;57(7):594-602. doi:10.1038/s41393-019-0264-6
9. US Department of Veterans Affairs, Veterans Health Administration. VHA Directive 1176(2): Spinal Cord Injuries and Disorders System of Care. Published September 30, 2019. Accessed June 2, 2023. https://www.va.gov/vhapublications/ViewPublication.asp?pub_ID=8523
10. Shim HB, Jung TY, Lee JK, Ku JH. Prostate activity and prostate cancer in spinal cord injury. Prostate Cancer Prostatic Dis. 2006;9(2):115-120. doi:10.1038/sj.pcan.4500865
11. Lynne CM, Aballa TC, Wang TJ, Rittenhouse HG, Ferrell SM, Brackett NL. Serum and semen prostate specific antigen concentrations are different in young spinal cord injured men compared to normal controls. J Urol. 1999;162(1):89-91. doi:10.1097/00005392-199907000-00022
12. Bartoletti R, Gavazzi A, Cai T, et al. Prostate growth and prevalence of prostate diseases in early onset spinal cord injuries. Eur Urol. 2009;56(1):142-148. doi:10.1016/j.eururo.2008.01.088
13. Pannek J, Berges RR, Cubick G, Meindl R, Senge T. Prostate size and PSA serum levels in male patients with spinal cord injury. Urology. 2003;62(5):845-848. doi:10.1016/s0090-4295(03)00654-x
14. Pramudji CK, Mutchnik SE, DeConcini D, Boone TB. Prostate cancer screening with prostate specific antigen in spinal cord injured men. J Urol. 2002;167(3):1303-1305.
15. Alexandrino AP, Rodrigues MA, Matsuo T. Evaluation of serum and seminal levels of prostate specific antigen in men with spinal cord injury. J Urol. 2004;171(6 Pt 1):2230-2232. doi:10.1097/01.ju.0000125241.77517.10
16. Barbonetti A, D’Andrea S, Martorella A, Felzani G, Francavilla S, Francavilla F. Risk of prostate cancer in men with spinal cord injury: a systematic review and meta-analysis. Asian J Androl. 2018;20(6):555-560. doi:10.4103/aja.aja_31_18
17. Vince RA Jr, Jiang R, Bank M, et al. Evaluation of social determinants of health and prostate cancer outcomes among black and white patients: a systematic review and meta-analysis. JAMA Netw Open. 2023;6(1):e2250416. Published 2023 Jan 3. doi:10.1001/jamanetworkopen.2022.50416
18. Smith ZL, Eggener SE, Murphy AB. African-American prostate cancer disparities. Curr Urol Rep. 2017;18(10):81. Published 2017 Aug 14. doi:10.1007/s11934-017-0724-5
19. Jeong SH, Werneburg GT, Abouassaly R, Wood H. Acquired and congenital spinal cord injury is associated with lower likelihood of prostate specific antigen screening. Urology. 2022;164:178-183. doi:10.1016/j.urology.2022.01.044
20. Benaim EA, Montoya JD, Saboorian MH, Litwiller S, Roehrborn CG. Characterization of prostate size, PSA and endocrine profiles in patients with spinal cord injuries. Prostate Cancer Prostatic Dis. 1998;1(5):250-255. doi:10.1038/sj.pcan.4500246
21. Torricelli FC, Lucon M, Vicentini F, Gomes CM, Srougi M, Bruschini H. PSA levels in men with spinal cord injury and under intermittent catheterization. Neurourol Urodyn. 2011;30(8):1522-1524. doi:10.1002/nau.21119
22. Konety BR, Nguyen TT, Brenes G, et al. Evaluation of the effect of spinal cord injury on serum PSA levels. Urology. 2000;56(1):82-86. doi:10.1016/s0090-4295(00)00548-3
23. Lee WY, Sun LM, Lin CL, et al. Risk of prostate and bladder cancers in patients with spinal cord injury: a population-based cohort study. Urol Oncol. 2014;32(1):51.e1-51.e517. doi:10.1016/j.urolonc.2013.07.019
24. Patel N, Ngo K, Hastings J, Ketchum N, Sepahpanah F. Prevalence of prostate cancer in patients with chronic spinal cord injury. PM R. 2011;3(7):633-636. doi:10.1016/j.pmrj.2011.04.024
25. Everaert K, Oostra C, Delanghe J, Vande Walle J, Van Laere M, Oosterlinck W. Diagnosis and localization of a complicated urinary tract infection in neurogenic bladder disease by tubular proteinuria and serum prostate specific antigen. Spinal Cord. 1998;36(1):33-38. doi:10.1038/sj.sc.3100520
26. Drazer MW, Huo D, Eggener SE. National prostate cancer screening rates after the 2012 US Preventive Services Task Force recommendation discouraging prostate-specific antigen-based screening. J Clin Oncol. 2015;33(22):2416-2423. doi:10.1200/JCO.2015.61.6532
27. Sammon JD, Abdollah F, Choueiri TK, et al. Prostate-specific antigen screening after 2012 US Preventive Services Task Force recommendations. JAMA. 2015;314(19):2077-2079. doi:10.1001/jama.2015.7273
28. Jemal A, Fedewa SA, Ma J, et al. Prostate cancer incidence and PSA testing patterns in relation to USPSTF screening recommendations. JAMA. 2015;314(19):2054-2061. doi:10.1001/jama.2015.14905
29. Vetterlein MW, Dalela D, Sammon JD, et al. State-by-state variation in prostate-specific antigen screening trends following the 2011 United States Preventive Services Task Force panel update. Urology. 2018;112:56-65. doi:10.1016/j.urology.2017.08.055
Prostate cancer will be diagnosed in 12.5% of men during their lifetime. It is the most commonly diagnosed solid organ cancer in men.1 However, prostate cancer screening for prostate-specific antigen (PSA) remains controversial due to concerns about overdiagnosis, as the overall risk of dying of prostate cancer is only 2.4%.1
To address the risk and benefits of PSA testing, in 2012 the US Preventive Services Task Force (USPSTF) recommended against routine PSA testing.2 Updated 2018 recommendations continued this recommendation in men aged > 70 years but acknowledged a small potential benefit in men aged 55 to 69 years and suggested individualized shared decision making between patient and clinician.3 In addition, American Urological Association (AUA) guidelines for the early detection of prostate cancer recommend against PSA screening in men aged < 40 years or those aged > 70 years, shared decision making for individuals aged 55 to 70 years or in high-risk men aged 40 to 55 years (ie, family history of prostate cancer or African American race).4 PSA screening is not recommended for men with a life expectancy shorter than 10 to 15 years aged > 70 years.4
The Veterans Health Administration (VHA) is the largest integrated health care system in the US.5 In addition, the US Department of Veterans Affairs (VA) Spinal Cord Injury and Disorders System of Care operates 25 centers throughout the US.6 Life expectancy following spinal cord injury (SCI) increased significantly through the 1980s but has since plateaued, with life expectancy being impacted by age at injury, completeness of injury, and neurologic level.7,8 As part of a program of uniform care, all persons with SCI followed at the Spinal Cord Injury and Disorders System of Care centers are offered comprehensive annual evaluations, including screening laboratory tests, such as PSA level.9
Patients with SCI present a unique challenge when interpreting PSA levels, given potentially confounding factors, including neurogenic bladder management, high rates of bacteriuria, urinary tract infections (UTIs), testosterone deficiency, and pelvic innervation that differs from the noninjured population.10,11 Unfortunately, the literature on prostate cancer prevalence and average PSA levels in patients with SCI is limited by the small scope of studies and inconsistent data.10-16 Therefore, the purpose of the current investigation was to quantify and analyze the rates of annual PSA testing for all men with SCI in the VHA.
Methods
Approval was granted by the Richmond VA Medical Center (VAMC) Institutional Review Board in Virginia, and by the VA Informatics and Computing Infrastructure (VINCI) data access request tracker system for extraction of data from the VA Corporate Data Warehouse. Microsoft Structured Query Language was used for data programming and query design. Statistical analysis was conducted using Stata version 15.1 with assistance from professional biostatisticians.
Only male veterans with a nervous system disorder affecting the spinal cord or with myelopathy were included, based on International Classification of Diseases (ICD) version 9 and 10 codes, corresponding to traumatic and nontraumatic myelopathy. Veterans diagnosed with myelopathy based on ICD codes corresponding to progressive or degenerative myelopathies, such as multiple sclerosis or amyotrophic lateral sclerosis, were excluded.
For each veteran, extracted data included the unique identification number, date of birth, ICD code, date ICD code first appeared, race, gender, death status (yes/no), date of death (when applicable), date of each PSA test, PSA test values, and the VAMC where each test was performed. Only tests for total PSA were included. The date that the ICD code first appeared served as an approximation for the date of SCI. The time frame for the study included all PSA tests in the VINCI database for 2000 through 2017. However, only post-SCI PSA tests were included in the analysis. Duplicate tests (same date/time) were eliminated.
Race is considered a risk factor for prostate cancer only for African American patients, likely due to racial health disparities.17 Given this, we chose to categorize race as either African American or other, with a third category for missing/inconsistent reporting. Age at time of the PSA test was categorized into 4 groups (≤ 39, 40-54, 55-69, and ≥ 70 years) based on AUA guidelines.4 The annual PSA testing rate was calculated for each veteran with SCI as the number of PSA tests per year. A mean annual PSA test rate was then calculated as the weighted (by exposure time) mean value for all annual PSA testing rates from 2000 through 2017 for each age group and race. Annual exposure was calculated for each veteran and defined as the number of days a veteran was eligible to have a PSA test. This started with the date of SCI diagnosis and ended with either the date of death or the date of last PSA. If a veteran moved from one age group to another in 1 year, the first part of this year’s exposure was included in the calculation of the annual PSA testing rate for the younger group and the second part was included for the calculation of the older group. For deceased veterans, the death date was excluded from the exposure period, and their exposure period ended on the day before death.
Statistical Analysis
To compare PSA testing rates between African American race and other races, Poisson regression was used with exposure treated as an offset (exposures were summed across years for each veteran). An indicator (dummy) variable for African American race vs other races was coded, and statistical significance was set at P < .05. To check sensitivity for the Poisson assumption that the mean was equal to the variance, negative binomial regression was used. To assess for geographic PSA testing rate variability, the data were further analyzed based on the locations where PSA tests were performed. This subanalysis was limited to veterans who had all PSA tests in a single station. For each station, the average PSA testing rate was calculated for each veteran, and the mean for all annual PSA testing rates was used to determine station-specific PSA testing rates.
Results
A total of 45,274 veterans were initially identified of which 367 females were excluded (Figure 1).
The PSA testing rate rose for veterans in the age groups ≤ 39, 40 to 54, and 55 to 69 years (Figure 2A).
Of the cohort of 37,243 veterans, 28,396 (76.2%) had their post-SCI tests done at a single facility, 6770 (18.1%) at 2 locations, and 2077 (5.5%) at > 2 locations. Single-station group data were included in a subanalysis to determine the mean (SD) PSA testing rates, which for the 123 locations was 0.98 (0.36) tests per veteran per year (range, 0.2-3.0 tests per veteran per year).
To assess the impact of the 2012 USPSTF recommendations on PSA testing rates in veterans with SCI, mean PSA testing rates were calculated for 5 years before the recommendations (2007-2011) and compared with the average PSA testing rate for 5 years following the updated recommendations (2013-2017). The USPSTF updated its recommendation again in 2018 and acknowledged the potential benefit for PSA screening in certain patient populations.2,3 Surprisingly, and despite recommendations, the results show a significant increase in PSA testing rates in all age groups for all races (P < .001) (Figure 4).
Discussion
The goal of this study was to establish testing rates and analyze PSA testing trends across races and age groups in veterans with SCI. This is the largest cohort of patients with SCI analyzed in the literature. The key findings of this study were that despite clear AUA guidelines recommending against PSA testing in patients aged ≤ 39 years and ≥ 70 years, there are high rates of testing in veterans with SCI in these age groups (0.46 tests per year in those aged ≤ 39 years and 0.91 tests per year in those aged ≥ 70 years). In terms of race, as expected based on increased risk,
Prostate Cancer Incidence
Although the exact mechanism behind alterations in prostate function in the SCI population have yet to be fully elucidated, research suggests that the prostate behaves differently after SCI. Animal models of prostate gland denervation show decreased prostate volume and suggest that SCI may lead to a reduction in prostatic secretory function associated with autonomic dysfunction. Shim and colleagues hypothesized that impaired autonomic prostate innervation alters the prostatic volume and PSA in patients with SCI.10
Additional studies looking at actual PSA levels in men with SCI reveal conflicting data.10-15,20 Toricelli and colleagues retrospectively studied 140 men with SCI, of whom 34 had PSA levels available and found that mean PSA was not significantly different for patients with SCI compared with controls, but patients using clean intermittent catheterization had 2-fold higher PSA levels.21 In contrast, Konety and colleagues found that mean PSA was not significantly different from uninjured controls in their cohort of 79 patients with SCI, though they did find a correlation between indwelling catheter use and a higher PSA.22
Studies have shown an overall decreased risk of prostate cancer in patients with SCI, though the mechanism remains unclear. A large cohort study from Taiwan showed a lower risk of prostate cancer for 54,401 patients with SCI with an adjusted hazard ratio of 0.73.23 Patel and colleagues found the overall rate of prostate cancer in the population of veterans with SCI was lower than the general uninjured VA population, though this study was limited by scope with only 350 patients with SCI.24 A more recent systematic review and meta-analysis of 9 studies evaluating the prevalence of prostate cancer in men with SCI found a reduction of up to 65% in the risk of prostate cancer in men with SCI, and PSA was found to be a poor screening tool for prostate cancer due to large study heterogeneity.16
PSA Screening
This study identified widespread overscreening using the PSA test in veterans with SCI, which is likely attributable to many factors. Per VHA Directive 1176, all eligible veterans are offered yearly interdisciplinary comprehensive evaluations, including laboratory testing, and as such veterans with SCI have high rates of annual visit attendance due to the complexity of their care.9 PSA testing is included in the standard battery of laboratory tests ordered for all patients with SCI during their annual examinations. Additionally, many SCI specialists use the PSA level in patients with SCI for identifying cystitis or prostatitis in patients with colonization who may not experience typical symptoms. Everaert and colleagues demonstrated the clinical utility for localizing UTIs to the upper or lower tract, with elevated PSA indicating prostatitis. They found that serum PSA has a sensitivity of 68% and a specificity of 100% in the differential diagnosis of prostatitis and pyelonephritis.25 As such, the high PSA screening rates may be reflective of diagnostic use for infection rather than for cancer screening.
Likely as a response to the USPSTF recommendations, there has been a national slow decline in overall PSA screening rates since 2012.26-28 A study from Vetterlein and colleagues examining changes in the PSA screening trends related to USPSTF recommendations found an 8.5% decline in overall PSA screening from 2012 to 2014.29 However, the increase in PSA testing across all ages and races in the VA population with SCI over the same period is not entirely understood and suggests the need for further research and education in this area.
Limitations
This study is limited by the use of data identified by ICD codes rather than by review of individual health records. This required the use of decision algorithms for data points, such as the date of SCI. In addition, analysis was not able to capture shared decision making that may have contributed to PSA screening outside the recommended age ranges based on additional risk factors, such as family history of lethal malignancy. Furthermore, a detailed attempt to define specific age-adjusted PSA levels was beyond the scope of this study but will be addressed in later publications. In addition, we did not exclude individuals with a diagnosis of prostate adenocarcinoma, prostatitis, or recurrent UTIs because the onset, duration, and severity of disease could not be definitively ascertained. Finally, veterans with SCI are unique and may not be reflective of individuals with SCI who do not receive care within the VA. However, despite these limitations, this is, to our knowledge, the largest and most comprehensive study evaluating PSA testing rates in individuals with SCI.
Conclusions
Currently, PSA screening is recommended following shared decision making for patients at average risk aged 55 to 70 years. Patients with SCI experience many conditions that may affect PSA values, but data regarding normal PSA ranges and rates of prostate cancer in this population remain sparse. The study demonstrated high rates of overtesting in veterans with SCI, higher than expected testing rates in African American veterans, a paradoxical increase in PSA testing rates after the 2012 publication of the USPSTF PSA guidelines, and wide variability in testing rates depending on VA location.
African American men were tested at higher rates across all age groups, including in patients aged > 70 years. To balance the benefits of detecting clinically significant prostate cancer vs the risks of invasive testing in high-risk populations with SCI, more work is needed to determine the clinical impact of screening practices. Future work is currently ongoing to define age-based PSA values in patients with SCI.
Acknowledgments
This research was supported in part through funding from the Center for Rehabilitation Science and Engineering, Virginia Commonwealth University Health System.
1. American Cancer Society. Key statistics for prostate cancer. Updated January 12, 2023. Accessed June 2, 2023. https://www.cancer.org/cancer/prostate-cancer/about/key-statistics.html
2. Moyer VA; U.S. Preventive Services Task Force. Screening for prostate cancer: U.S. Preventive Services Task Force recommendation statement. Ann Intern Med. 2012;157(2):120-134. doi:10.7326/0003-4819-157-2-201207170-00459
3. US Preventive Services Task Force, Grossman DC, Curry SJ, et al. Screening for Prostate Cancer: US Preventive Services Task Force Recommendation Statement. JAMA. 2018;319(18):1901-1913. doi:10.1001/jama.2018.3710
4. Carter HB, Albertsen PC, Barry MJ, et al. Early detection of prostate cancer: AUA Guideline. J Urol. 2013;190(2):419-426. doi:10.1016/j.juro.2013.04.119
5. US Department of Veterans Affairs, Veterans Health Administration. Updated August 15, 2022. Accessed June 2, 2023. https://www.va.gov/health/aboutVHA.asp
6. US Department of Veterans Affairs. Spinal cord injuries and disorders system of care. Updated January 31, 2022. Accessed June 2, 2023. https://www.sci.va.gov/VAs_SCID_System_of_Care.asp
7. DeVivo MJ, Chen Y, Wen H. Cause of death trends among persons with spinal cord injury in the United States: 1960-2017. Arch Phys Med Rehabil. 2022;103(4):634-641. doi:10.1016/j.apmr.2021.09.019
8. Cao Y, DiPiro N, Krause JS. Health factors and spinal cord injury: a prospective study of risk of cause-specific mortality. Spinal Cord. 2019;57(7):594-602. doi:10.1038/s41393-019-0264-6
9. US Department of Veterans Affairs, Veterans Health Administration. VHA Directive 1176(2): Spinal Cord Injuries and Disorders System of Care. Published September 30, 2019. Accessed June 2, 2023. https://www.va.gov/vhapublications/ViewPublication.asp?pub_ID=8523
10. Shim HB, Jung TY, Lee JK, Ku JH. Prostate activity and prostate cancer in spinal cord injury. Prostate Cancer Prostatic Dis. 2006;9(2):115-120. doi:10.1038/sj.pcan.4500865
11. Lynne CM, Aballa TC, Wang TJ, Rittenhouse HG, Ferrell SM, Brackett NL. Serum and semen prostate specific antigen concentrations are different in young spinal cord injured men compared to normal controls. J Urol. 1999;162(1):89-91. doi:10.1097/00005392-199907000-00022
12. Bartoletti R, Gavazzi A, Cai T, et al. Prostate growth and prevalence of prostate diseases in early onset spinal cord injuries. Eur Urol. 2009;56(1):142-148. doi:10.1016/j.eururo.2008.01.088
13. Pannek J, Berges RR, Cubick G, Meindl R, Senge T. Prostate size and PSA serum levels in male patients with spinal cord injury. Urology. 2003;62(5):845-848. doi:10.1016/s0090-4295(03)00654-x
14. Pramudji CK, Mutchnik SE, DeConcini D, Boone TB. Prostate cancer screening with prostate specific antigen in spinal cord injured men. J Urol. 2002;167(3):1303-1305.
15. Alexandrino AP, Rodrigues MA, Matsuo T. Evaluation of serum and seminal levels of prostate specific antigen in men with spinal cord injury. J Urol. 2004;171(6 Pt 1):2230-2232. doi:10.1097/01.ju.0000125241.77517.10
16. Barbonetti A, D’Andrea S, Martorella A, Felzani G, Francavilla S, Francavilla F. Risk of prostate cancer in men with spinal cord injury: a systematic review and meta-analysis. Asian J Androl. 2018;20(6):555-560. doi:10.4103/aja.aja_31_18
17. Vince RA Jr, Jiang R, Bank M, et al. Evaluation of social determinants of health and prostate cancer outcomes among black and white patients: a systematic review and meta-analysis. JAMA Netw Open. 2023;6(1):e2250416. Published 2023 Jan 3. doi:10.1001/jamanetworkopen.2022.50416
18. Smith ZL, Eggener SE, Murphy AB. African-American prostate cancer disparities. Curr Urol Rep. 2017;18(10):81. Published 2017 Aug 14. doi:10.1007/s11934-017-0724-5
19. Jeong SH, Werneburg GT, Abouassaly R, Wood H. Acquired and congenital spinal cord injury is associated with lower likelihood of prostate specific antigen screening. Urology. 2022;164:178-183. doi:10.1016/j.urology.2022.01.044
20. Benaim EA, Montoya JD, Saboorian MH, Litwiller S, Roehrborn CG. Characterization of prostate size, PSA and endocrine profiles in patients with spinal cord injuries. Prostate Cancer Prostatic Dis. 1998;1(5):250-255. doi:10.1038/sj.pcan.4500246
21. Torricelli FC, Lucon M, Vicentini F, Gomes CM, Srougi M, Bruschini H. PSA levels in men with spinal cord injury and under intermittent catheterization. Neurourol Urodyn. 2011;30(8):1522-1524. doi:10.1002/nau.21119
22. Konety BR, Nguyen TT, Brenes G, et al. Evaluation of the effect of spinal cord injury on serum PSA levels. Urology. 2000;56(1):82-86. doi:10.1016/s0090-4295(00)00548-3
23. Lee WY, Sun LM, Lin CL, et al. Risk of prostate and bladder cancers in patients with spinal cord injury: a population-based cohort study. Urol Oncol. 2014;32(1):51.e1-51.e517. doi:10.1016/j.urolonc.2013.07.019
24. Patel N, Ngo K, Hastings J, Ketchum N, Sepahpanah F. Prevalence of prostate cancer in patients with chronic spinal cord injury. PM R. 2011;3(7):633-636. doi:10.1016/j.pmrj.2011.04.024
25. Everaert K, Oostra C, Delanghe J, Vande Walle J, Van Laere M, Oosterlinck W. Diagnosis and localization of a complicated urinary tract infection in neurogenic bladder disease by tubular proteinuria and serum prostate specific antigen. Spinal Cord. 1998;36(1):33-38. doi:10.1038/sj.sc.3100520
26. Drazer MW, Huo D, Eggener SE. National prostate cancer screening rates after the 2012 US Preventive Services Task Force recommendation discouraging prostate-specific antigen-based screening. J Clin Oncol. 2015;33(22):2416-2423. doi:10.1200/JCO.2015.61.6532
27. Sammon JD, Abdollah F, Choueiri TK, et al. Prostate-specific antigen screening after 2012 US Preventive Services Task Force recommendations. JAMA. 2015;314(19):2077-2079. doi:10.1001/jama.2015.7273
28. Jemal A, Fedewa SA, Ma J, et al. Prostate cancer incidence and PSA testing patterns in relation to USPSTF screening recommendations. JAMA. 2015;314(19):2054-2061. doi:10.1001/jama.2015.14905
29. Vetterlein MW, Dalela D, Sammon JD, et al. State-by-state variation in prostate-specific antigen screening trends following the 2011 United States Preventive Services Task Force panel update. Urology. 2018;112:56-65. doi:10.1016/j.urology.2017.08.055
Antibiotic Therapy and Bacterial Resistance in Patients With Spinal Cord Injury
Nosocomial urinary tract infections (UTIs) are often associated with significant morbidity, mortality, and health care costs.1,2 Patients with spinal cord injury (SCI) often have indwelling or intermittent urinary catheters and are prone to have asymptomatic bacteriuria and UTIs. As a result, they frequently receive antimicrobial therapy and have a higher prevalence of antibiotic resistant urinary tract isolates compared with patients without SCI.3-5 Unfortunately, data are lacking to provide guidance for optimal treatment and duration for UTIs in patients with SCI.
Many studies have evaluated patient propensity for development of antibiotic resistance in UTIs. Age > 65 years, use of a urinary catheter, previous hospitalization, and prior antimicrobial use have been identified as common risk factors.6-8 Waites and colleagues evaluated antimicrobial resistance of urinary tract organisms in outpatients with SCI and found that 33% of urinary cultures isolated multidrug-resistant microorganisms. The authors demonstrated a relationship between antimicrobial resistance and broad spectrum and prophylactic use of antibiotics.3,9
This study sought to determine the incidence of resistance acquisition by comparing susceptibility profiles of the same organisms isolated from the same patient in consecutive episodes of bacteriuria. Given that prior antimicrobial use was identified as a common risk factor for antibiotic resistance in previous reports, this study also sought to determine patterns of antibiotic use in patients with SCI at the VA North Texas Health Care System (VANTHCS) in Dallas, Texas, to evaluate whether any correlations between antibiotic use and resistance acquisition exist. A secondary objective included identification of other risk factors that may increase acquisition of resistance.
Study Design
This study was a retrospective chart review approved by the Institutional Review Board at the VANTHCS. Since computerized charting was available beginning July 2003, the VA Computerized Patient Record System was queried to identify male or female adult (aged ≥ 18 years) veterans admitted to the SCI inpatient unit between July 1, 2003, and December 31, 2009, for review. Patients who had an ICD-9 code consistent with paraplegia, tetraplegia, or quadriplegia and 2 consecutive urine cultures that isolated the same organism within 6 months of each other were included. Males with a diagnosis of epididymitis or prostatitis were excluded.
The following data were collected for analysis: gender, age, weight, height, American Spinal Injury Association (ASIA) Impairment Scale Grades (A-E), duration of hospitalization in the SCI unit, the presence and type of urinary catheter, microbiology and antibiotic regimen, past medical history, previous antibiotic history, comorbidities, and concomitant drug therapy. The presence and type of urinary catheter was determined by the primary investigator and verified by the physician who oversaw care of patients with SCI.
All antimicrobial sensitivity testing was performed via the Microscan (Microscan Systems, Inc., Renton, WA) automated testing system. Acquisition of antibiotic resistance was defined as an increase of at least 2 dilutions in the breakpoint or change on the susceptibility panel from Susceptible (S) to Resistant (R) on the repeat urine culture.
Analysis of Resistance
Continuous parameters were reported as mean (standard deviation [SD]), and discrete parameters were reported as a percentage. Analyses of variance (ANOVA) were computed to evaluate the difference in the mean of the continuous parameters. The Mann-Whitney U test replaced the ANOVA when a dependent variable was not normally distributed. Associations between pairs of discrete parameters were tested with the Pearson chi-square test. Logistic regression analyses were performed to determine the associations between potential risk factors (age, ASIA grade, antibiotic duration, class of antibiotic) and antibiotic resistance. The study alpha was α < .05. All analyses were performed with SPSS 20.0 for Windows.
Three hundred fifty-five veterans admitted to the SCI unit during the study period were initially identified. Of those, 269 did not meet inclusion criteria and were excluded. The most common reason for exclusion was absence of a second positive urine culture with isolation of the same organism. Other reasons for exclusion included no urine cultures completed while admitted to the SCI unit or no diagnosis of SCI.
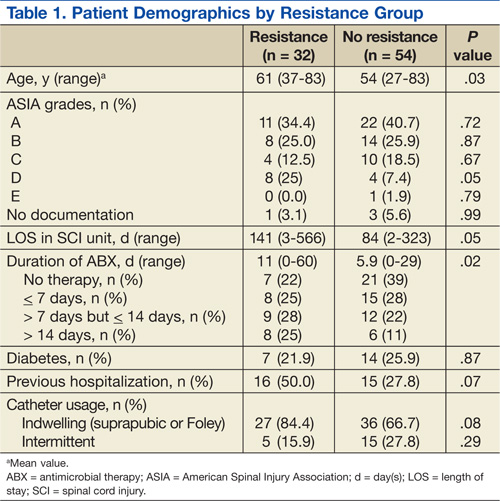
A total of 86 subjects, mean aged 56.7 years (SD, 14.2), were included in the study. Subjects were primarily men (93%) with a mean body mass index of 25.5 (SD, 7). Most of the subjects were classified Complete on the ASIA scale, meaning no motor strength or sensation below their neurologic level of injury (ASIA A; 38.4%), followed by Sensory Incomplete (ASIA B; 25.6%), Motor Incomplete-Low Muscle Strength (ASIA C; 16.3%), Motor Incomplete-High Muscle Strength (ASIA D; 14%), and Normal (ASIA E; 1.2%).
Both groups (resistance and no resistance) had similar baseline characteristics, and no differences were found for the following characteristics: ASIA grade, length of stay (LOS), presence of or control of diabetes, and presence of an indwelling urinary catheter (Table 1). However, veterans in the resistance group were significantly older than those in the no resistance group (aged 61 years vs aged 54 years; P = .03) and spent more time housed in the SCI unit with a mean LOS of 141 days vs 84 days (P = .049). Urinary pathogens developed resistance in 32 patients (37.2%, resistance group), and 54 patients (62.8%, no resistance group) did not.
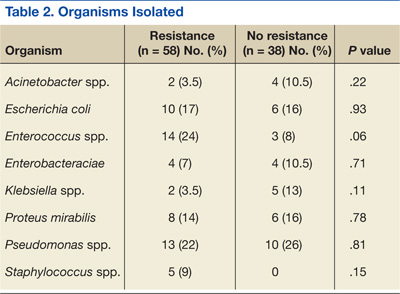
No significant differences in the types of organisms isolated were noted between the groups (Table 2). The most common pathogens isolated were Pseudomonas aeruginosa (24%), Enterococcus spp. (18%), Escherichia coli (17%), Proteus spp. (14%), Klebsiella spp. (7%), and Acinetobacter spp. (6%).
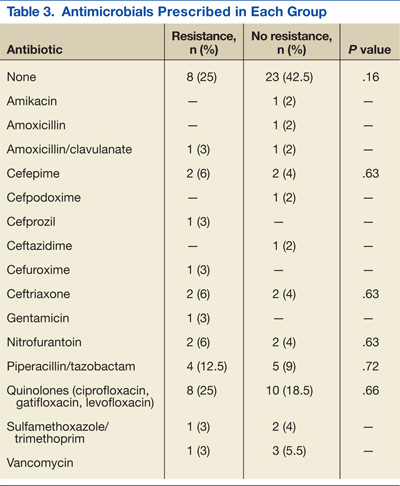
Thirty-six percent of the pathogens in the first cultures were not treated with any antibiotics, because they were considered as colonizers or contaminants. Only 61% of pathogens in the no resistance group vs 78% in the resistance group were exposed to antimicrobial treatment. In those veterans who were treated, antibiotic usage on the first urine culture was assessed to determine whether any relationship existed between receipt of a particular antimicrobial class and development of resistance. Fluoroquinolones were the most commonly prescribed antimicrobials in both the resistance and no resistance groups (Table 3).
Four risk factors (ASIA grade, antibiotic treatment duration, prior use of a cephalosporin, and prior use of penicillin) were initially identified by logistic regression analyses as being associated with resistance development. Since veterans in the resistance group were significantly older than those in the no resistance group, the analysis was repeated with age as a covariate to independently assess the association between the risk factors and resistance. After controlling for age, no significant association between the ASIA grade and resistance was identified (adjusted odds ratio [OR], 1.03; 95% confidence interval [CI]: 0.66 – 1.6). Median duration of antibiotic treatment was 6 days in all patients, 3.5 days in the no resistance group, and 9 days in the resistance group. Longer duration of treatment significantly predicted resistance (adjusted OR, 1.07; P = .03; 95% CI: 1.01 – 1.03). For every additional day the patient was on an antibiotic, he or she was 7% more likely to develop resistance.
The incidence of resistant organisms after exposure to a cephalosporin was not statistically different between groups (adjusted OR, 1.74; P = .36; 95% CI: 1.0 – 1.2). In the resistance group, 28% of the antibiotics prescribed were cephalosporins (cefuroxime, ceftriaxone, ceftazidime, and cefepime), which were used for Proteus mirabilis, Escherichia coli, Klebsiella pneumoniae, and Pseudomonas aeruginosa. In the no resistance group, 17% of the antibiotics prescribed were cephalosporins (cefepime only) and were used for Proteus mirabilis.
Organisms treated with penicillin were significantly less likely to become resistant (adjusted OR, 0.26; P = .04; 95% CI: 0.07 - 0.96). In the resistance group, 16% of the antibiotics were penicillins (piperacillin/tazobactam), which were used for Escherichia coli, Enterococcus faecalis, Acinetobacter baumannii, Pseudomonas aeruginosa, and Klebsiella pneumoniae. In the no resistance group, 22% of the antibiotics were penicillins (amoxicillin, amoxicillin/clavulanate and piperacillin/tazobactam), which were used for Proteus mirabilis, Enterococcus faecalis, and Acinetobacter baumannii.
Discussion
Longer duration of treatment significantly increased resistance on the subsequent culture in this study. For every additional day the patient was on an antibiotic, he or she was 7% more likely to develop a resistance. However, the potential impact of using a given antibiotic class on the acquisition of resistance in patients with SCI who had a UTI was not demonstrated. Surprisingly, the use of a cephalosporin was not associated with an increased incidence of resistance in this study, which was inconsistent with the findings from other studies.10 Weber and colleagues evaluated nosocomial infections in the intensive care unit. The authors suggested that restriction on the use of third-generation cephalosporins might decrease antibiotic resistance, especially in extended spectrum beta-lactamase producing gram-negative bacilli.11
The difference in this study may be explained by the lower incidence of Escherichia coli and Klebsiella pneumoniae, which are known to exhibit inducible resistance on exposure to third-generation cephalosporins. Conversely, it was found that patients treated with a penicillin were significantly less likely to develop resistant organisms from subsequent cultures. The most common penicillin used in this study’s patient population was piperacillin/tazobactam.
For complicated UTIs including pyelonephritis, the European Association of Urology (EAU) guidelines for the management of urinary and male genital tract infections recommend treatment for 3 to 5 days after defervescence or control of complicating factors.12 These recommendations could lead to much shorter treatment durations than the traditional 14-day “standard” course often prescribed. One meta-analysis recommends a 5-day course for UTIs without fever in patients with SCI vs a 14-day course for patients with fever.13 Due to the lack of data, care often varies based on the patient’s clinical status, provider experience, and opinions. The Pannek study surveyed 16 centers that specialized in SCI care. When compared with the recommendations in the EAU guidelines, the study found providers in > 50% of the responding facilities overtreated UTIs.14
Limitations
This study has several limitations. First, the sample size was much smaller than expected. Of the 355 charts reviewed, only 86 met all the criteria to be included, which limited analysis. Additionally, given the retrospective nature of the study, it was impossible to determine provider rationale for the treatment. Since a diagnosis of UTI in patients with SCI often cannot be done with conventional methods due to lack of symptoms, many investigators have emphasized the use of quantitative urinalysis to differentiate true infection vs contamination.15-17
According to the National Institute on Disability and Rehabilitation Research consensus conference recommendations, the definition of significant bacteriuria will vary, depending on the method of bladder drainage.18 While this study reviewed microbiologic cultures and the type of patient’s urinary catheter, the method of bladder drainage in the context of quantitative urinalysis was not evaluated, which limited the interpretation of microbiologic data.
It was also impossible to determine whether bacteria were cleared by the initial treatment, leading to new bacterial strains with a multidrug resistance, or whether patients relapsed. While antibiotic selection was appropriate for antimicrobial coverage, this study was not designed to detect potential inadequacies in dosing, which could also affect resistance. Last, since no genetic evaluation of the microorganisms was done, the authors cannot be sure whether the microorganisms noted on the first urine culture were of the same genetic makeup as those identified in the second urine culture.
Conclusion
Optimal duration of therapy for treatment of UTIs in patients with SCI is unclear. Despite its limitations, the study suggests exposure to longer antibiotic treatment courses may lead to increased antimicrobial resistance in the urinary tract organisms in this patient population. Further investigation with a larger sample size is required to confirm these findings.
Author disclosures
Dr. Bedimo received research grant funding from Janssen Pharmaceuticals and Merck and Company. He also serves as an ad hoc scientific advisor for Viiv Healthcare, Gilead Science, and BMD Science. All other authors report no actual or potential conflicts of interest with regard to this article.
Disclaimer
The opinions expressed herein are those of the authors and do not necessarily reflect those of Federal Practitioner, Frontline Medical Communications Inc., the U.S. Government, or any of its agencies. This article may discuss unlabeled or investigational use of certain drugs. Please review complete prescribing information for specific drugs or drug combinations—including indications, contraindications, warnings, and adverse effects—before administering pharmacologic therapy to patients.
References
1. Saint S, Lipsky BA. Preventing catheter-related bacteriuria: Should we? Can we? How? Arch Intern Med. 1999;159(8):800-808.
2. Laupland KB, Bagshaw SM, Gregson DB, Kirkpatrick AW, Ross T, Church DL. Intensive care unit-acquired urinary tract infections in a regional critical care system. Crit Care. 2005;9(2):R60-R65.
3. Girard R, Mazoyer MA, Plauchu MM, Rode G. High prevalence of nosocomial infections in rehabilitation units accounted for by urinary tract infections in patients with spinal cord injury. J Hosp Infect. 2006;62(4):473-479.
4. Cardenas DD, Hooton TM. Urinary tract infection in persons with spinal cord injury. Arch Phys Med Rehabil. 1995;76(3):272-280.
5. Salomon J, Gory A, Bernard L, Ruffion A, Denys P, Chartier-Kastler E. [Urinary tract infection and neurogenic bladder]. Prog Urol. 2007;17(3):448-453.
6. Ena J, Amador C, Martinez C, Ortiz de la Tabla V. Risk factors for acquisition of urinary tract infections caused by ciprofloxacin resistant Escherichia coli. J Urol. 1995;153(1):117-120.
7. Allen UD, MacDonald N, Fuite L, Chan F, Stephens D. Risk factors for resistance to “first-line” antimicrobials among urinary tract isolates of Escherichia coli in children. CMAJ. 1999;160(10):1436-1440.
8. De Mouy D, Cavallo JD, Armengaud M, et al. [Urinary tract infection in an urban population: Etiology and antibiotic sensitivity as a function of patient history]. Presse Med. 1999;28(30):1624-1628.
9. Waites KB, Chen Y, DeVivo MJ, Canupp KC, Moser SA. Antimicrobial resistance in gram-negative bacteria isolated from the urinary tract in community-residing persons with spinal cord injury. Arch Phys Med Rehabil. 2000;81(6):764-769.
10. Shah PS, Cannon JP, Sullivan CL, Nemchausky B, Pachucki CT. Controlling antimicrobial use and decreasing microbiological laboratory tests for urinary tract infections in spinal-cord-injury patients with chronic indwelling catheters. Am J Health Syst Pharm. 2005;62(1):74-77.
11. Weber DJ, Raasch R, Rutala WA. Nosocomial infections in the ICU: The growing importance of antibiotic-resistant pathogens. Chest. 1999;115(suppl 3):34S-41S.
12. Naber KG, Bergman B, Bishop MC, et al; Urinary Tract Infection (UTI) Working Group of the Health Care Office (HCO) of the European Association of Urology (EAU). EAU guidelines for the management of urinary and male genital tract infections. Urinary Tract Infection (UTI) Working Group of the Health Care Office (HCO) of the European Association of Urology (EAU). Eur Urol. 2001;40(5):576-588.
13. Everaert K, Lumen N, Kerckhaert W, Willaert P, van Driel M. Urinary tract infections in spinal cord injury: Prevention and treatment guidelines. Acta Clin Belg. 2009;64(4):335-340.
14. Pannek J. Treatment of urinary tract infection in persons with spinal cord injury: Guidelines, evidence, and clinical practice. A questionnaire-based survey and review of the literature. J Spinal Cord Med. 2011;34(1):11-15.
15. Musher DM, Thorsteinsson SB, Airola VM II. Quantitative urinalysis. Diagnosing urinary tract infection in men. JAMA. 1976;236(18):2069-2072.
16. Deresinski SC, Perkash I. Urinary tract infections in male spinal cord injured patients. Part two: Diagnostic value of symptoms and of quantitative urinalysis. J Am Paraplegia Soc. 1985;8(1):7-10.
17. Deresinski SC, Perkash I. Urinary tract infections in male spinal cord injured patients. Part one: Bacteriologic diagnosis. J Am Paraplegia Soc. 1985;8(1):4-6.
18. Garcia Leoni ME, Esclarin De Ruz A. Management of urinary tract infection in patients with spinal cord injuries. Clin Microbiol Infect. 2003;9(8):780-785.
Nosocomial urinary tract infections (UTIs) are often associated with significant morbidity, mortality, and health care costs.1,2 Patients with spinal cord injury (SCI) often have indwelling or intermittent urinary catheters and are prone to have asymptomatic bacteriuria and UTIs. As a result, they frequently receive antimicrobial therapy and have a higher prevalence of antibiotic resistant urinary tract isolates compared with patients without SCI.3-5 Unfortunately, data are lacking to provide guidance for optimal treatment and duration for UTIs in patients with SCI.
Many studies have evaluated patient propensity for development of antibiotic resistance in UTIs. Age > 65 years, use of a urinary catheter, previous hospitalization, and prior antimicrobial use have been identified as common risk factors.6-8 Waites and colleagues evaluated antimicrobial resistance of urinary tract organisms in outpatients with SCI and found that 33% of urinary cultures isolated multidrug-resistant microorganisms. The authors demonstrated a relationship between antimicrobial resistance and broad spectrum and prophylactic use of antibiotics.3,9
This study sought to determine the incidence of resistance acquisition by comparing susceptibility profiles of the same organisms isolated from the same patient in consecutive episodes of bacteriuria. Given that prior antimicrobial use was identified as a common risk factor for antibiotic resistance in previous reports, this study also sought to determine patterns of antibiotic use in patients with SCI at the VA North Texas Health Care System (VANTHCS) in Dallas, Texas, to evaluate whether any correlations between antibiotic use and resistance acquisition exist. A secondary objective included identification of other risk factors that may increase acquisition of resistance.
Study Design
This study was a retrospective chart review approved by the Institutional Review Board at the VANTHCS. Since computerized charting was available beginning July 2003, the VA Computerized Patient Record System was queried to identify male or female adult (aged ≥ 18 years) veterans admitted to the SCI inpatient unit between July 1, 2003, and December 31, 2009, for review. Patients who had an ICD-9 code consistent with paraplegia, tetraplegia, or quadriplegia and 2 consecutive urine cultures that isolated the same organism within 6 months of each other were included. Males with a diagnosis of epididymitis or prostatitis were excluded.
The following data were collected for analysis: gender, age, weight, height, American Spinal Injury Association (ASIA) Impairment Scale Grades (A-E), duration of hospitalization in the SCI unit, the presence and type of urinary catheter, microbiology and antibiotic regimen, past medical history, previous antibiotic history, comorbidities, and concomitant drug therapy. The presence and type of urinary catheter was determined by the primary investigator and verified by the physician who oversaw care of patients with SCI.
All antimicrobial sensitivity testing was performed via the Microscan (Microscan Systems, Inc., Renton, WA) automated testing system. Acquisition of antibiotic resistance was defined as an increase of at least 2 dilutions in the breakpoint or change on the susceptibility panel from Susceptible (S) to Resistant (R) on the repeat urine culture.
Analysis of Resistance
Continuous parameters were reported as mean (standard deviation [SD]), and discrete parameters were reported as a percentage. Analyses of variance (ANOVA) were computed to evaluate the difference in the mean of the continuous parameters. The Mann-Whitney U test replaced the ANOVA when a dependent variable was not normally distributed. Associations between pairs of discrete parameters were tested with the Pearson chi-square test. Logistic regression analyses were performed to determine the associations between potential risk factors (age, ASIA grade, antibiotic duration, class of antibiotic) and antibiotic resistance. The study alpha was α < .05. All analyses were performed with SPSS 20.0 for Windows.
Three hundred fifty-five veterans admitted to the SCI unit during the study period were initially identified. Of those, 269 did not meet inclusion criteria and were excluded. The most common reason for exclusion was absence of a second positive urine culture with isolation of the same organism. Other reasons for exclusion included no urine cultures completed while admitted to the SCI unit or no diagnosis of SCI.
A total of 86 subjects, mean aged 56.7 years (SD, 14.2), were included in the study. Subjects were primarily men (93%) with a mean body mass index of 25.5 (SD, 7). Most of the subjects were classified Complete on the ASIA scale, meaning no motor strength or sensation below their neurologic level of injury (ASIA A; 38.4%), followed by Sensory Incomplete (ASIA B; 25.6%), Motor Incomplete-Low Muscle Strength (ASIA C; 16.3%), Motor Incomplete-High Muscle Strength (ASIA D; 14%), and Normal (ASIA E; 1.2%).
Both groups (resistance and no resistance) had similar baseline characteristics, and no differences were found for the following characteristics: ASIA grade, length of stay (LOS), presence of or control of diabetes, and presence of an indwelling urinary catheter (Table 1). However, veterans in the resistance group were significantly older than those in the no resistance group (aged 61 years vs aged 54 years; P = .03) and spent more time housed in the SCI unit with a mean LOS of 141 days vs 84 days (P = .049). Urinary pathogens developed resistance in 32 patients (37.2%, resistance group), and 54 patients (62.8%, no resistance group) did not.
No significant differences in the types of organisms isolated were noted between the groups (Table 2). The most common pathogens isolated were Pseudomonas aeruginosa (24%), Enterococcus spp. (18%), Escherichia coli (17%), Proteus spp. (14%), Klebsiella spp. (7%), and Acinetobacter spp. (6%).
Thirty-six percent of the pathogens in the first cultures were not treated with any antibiotics, because they were considered as colonizers or contaminants. Only 61% of pathogens in the no resistance group vs 78% in the resistance group were exposed to antimicrobial treatment. In those veterans who were treated, antibiotic usage on the first urine culture was assessed to determine whether any relationship existed between receipt of a particular antimicrobial class and development of resistance. Fluoroquinolones were the most commonly prescribed antimicrobials in both the resistance and no resistance groups (Table 3).
Four risk factors (ASIA grade, antibiotic treatment duration, prior use of a cephalosporin, and prior use of penicillin) were initially identified by logistic regression analyses as being associated with resistance development. Since veterans in the resistance group were significantly older than those in the no resistance group, the analysis was repeated with age as a covariate to independently assess the association between the risk factors and resistance. After controlling for age, no significant association between the ASIA grade and resistance was identified (adjusted odds ratio [OR], 1.03; 95% confidence interval [CI]: 0.66 – 1.6). Median duration of antibiotic treatment was 6 days in all patients, 3.5 days in the no resistance group, and 9 days in the resistance group. Longer duration of treatment significantly predicted resistance (adjusted OR, 1.07; P = .03; 95% CI: 1.01 – 1.03). For every additional day the patient was on an antibiotic, he or she was 7% more likely to develop resistance.
The incidence of resistant organisms after exposure to a cephalosporin was not statistically different between groups (adjusted OR, 1.74; P = .36; 95% CI: 1.0 – 1.2). In the resistance group, 28% of the antibiotics prescribed were cephalosporins (cefuroxime, ceftriaxone, ceftazidime, and cefepime), which were used for Proteus mirabilis, Escherichia coli, Klebsiella pneumoniae, and Pseudomonas aeruginosa. In the no resistance group, 17% of the antibiotics prescribed were cephalosporins (cefepime only) and were used for Proteus mirabilis.
Organisms treated with penicillin were significantly less likely to become resistant (adjusted OR, 0.26; P = .04; 95% CI: 0.07 - 0.96). In the resistance group, 16% of the antibiotics were penicillins (piperacillin/tazobactam), which were used for Escherichia coli, Enterococcus faecalis, Acinetobacter baumannii, Pseudomonas aeruginosa, and Klebsiella pneumoniae. In the no resistance group, 22% of the antibiotics were penicillins (amoxicillin, amoxicillin/clavulanate and piperacillin/tazobactam), which were used for Proteus mirabilis, Enterococcus faecalis, and Acinetobacter baumannii.
Discussion
Longer duration of treatment significantly increased resistance on the subsequent culture in this study. For every additional day the patient was on an antibiotic, he or she was 7% more likely to develop a resistance. However, the potential impact of using a given antibiotic class on the acquisition of resistance in patients with SCI who had a UTI was not demonstrated. Surprisingly, the use of a cephalosporin was not associated with an increased incidence of resistance in this study, which was inconsistent with the findings from other studies.10 Weber and colleagues evaluated nosocomial infections in the intensive care unit. The authors suggested that restriction on the use of third-generation cephalosporins might decrease antibiotic resistance, especially in extended spectrum beta-lactamase producing gram-negative bacilli.11
The difference in this study may be explained by the lower incidence of Escherichia coli and Klebsiella pneumoniae, which are known to exhibit inducible resistance on exposure to third-generation cephalosporins. Conversely, it was found that patients treated with a penicillin were significantly less likely to develop resistant organisms from subsequent cultures. The most common penicillin used in this study’s patient population was piperacillin/tazobactam.
For complicated UTIs including pyelonephritis, the European Association of Urology (EAU) guidelines for the management of urinary and male genital tract infections recommend treatment for 3 to 5 days after defervescence or control of complicating factors.12 These recommendations could lead to much shorter treatment durations than the traditional 14-day “standard” course often prescribed. One meta-analysis recommends a 5-day course for UTIs without fever in patients with SCI vs a 14-day course for patients with fever.13 Due to the lack of data, care often varies based on the patient’s clinical status, provider experience, and opinions. The Pannek study surveyed 16 centers that specialized in SCI care. When compared with the recommendations in the EAU guidelines, the study found providers in > 50% of the responding facilities overtreated UTIs.14
Limitations
This study has several limitations. First, the sample size was much smaller than expected. Of the 355 charts reviewed, only 86 met all the criteria to be included, which limited analysis. Additionally, given the retrospective nature of the study, it was impossible to determine provider rationale for the treatment. Since a diagnosis of UTI in patients with SCI often cannot be done with conventional methods due to lack of symptoms, many investigators have emphasized the use of quantitative urinalysis to differentiate true infection vs contamination.15-17
According to the National Institute on Disability and Rehabilitation Research consensus conference recommendations, the definition of significant bacteriuria will vary, depending on the method of bladder drainage.18 While this study reviewed microbiologic cultures and the type of patient’s urinary catheter, the method of bladder drainage in the context of quantitative urinalysis was not evaluated, which limited the interpretation of microbiologic data.
It was also impossible to determine whether bacteria were cleared by the initial treatment, leading to new bacterial strains with a multidrug resistance, or whether patients relapsed. While antibiotic selection was appropriate for antimicrobial coverage, this study was not designed to detect potential inadequacies in dosing, which could also affect resistance. Last, since no genetic evaluation of the microorganisms was done, the authors cannot be sure whether the microorganisms noted on the first urine culture were of the same genetic makeup as those identified in the second urine culture.
Conclusion
Optimal duration of therapy for treatment of UTIs in patients with SCI is unclear. Despite its limitations, the study suggests exposure to longer antibiotic treatment courses may lead to increased antimicrobial resistance in the urinary tract organisms in this patient population. Further investigation with a larger sample size is required to confirm these findings.
Author disclosures
Dr. Bedimo received research grant funding from Janssen Pharmaceuticals and Merck and Company. He also serves as an ad hoc scientific advisor for Viiv Healthcare, Gilead Science, and BMD Science. All other authors report no actual or potential conflicts of interest with regard to this article.
Disclaimer
The opinions expressed herein are those of the authors and do not necessarily reflect those of Federal Practitioner, Frontline Medical Communications Inc., the U.S. Government, or any of its agencies. This article may discuss unlabeled or investigational use of certain drugs. Please review complete prescribing information for specific drugs or drug combinations—including indications, contraindications, warnings, and adverse effects—before administering pharmacologic therapy to patients.
References
1. Saint S, Lipsky BA. Preventing catheter-related bacteriuria: Should we? Can we? How? Arch Intern Med. 1999;159(8):800-808.
2. Laupland KB, Bagshaw SM, Gregson DB, Kirkpatrick AW, Ross T, Church DL. Intensive care unit-acquired urinary tract infections in a regional critical care system. Crit Care. 2005;9(2):R60-R65.
3. Girard R, Mazoyer MA, Plauchu MM, Rode G. High prevalence of nosocomial infections in rehabilitation units accounted for by urinary tract infections in patients with spinal cord injury. J Hosp Infect. 2006;62(4):473-479.
4. Cardenas DD, Hooton TM. Urinary tract infection in persons with spinal cord injury. Arch Phys Med Rehabil. 1995;76(3):272-280.
5. Salomon J, Gory A, Bernard L, Ruffion A, Denys P, Chartier-Kastler E. [Urinary tract infection and neurogenic bladder]. Prog Urol. 2007;17(3):448-453.
6. Ena J, Amador C, Martinez C, Ortiz de la Tabla V. Risk factors for acquisition of urinary tract infections caused by ciprofloxacin resistant Escherichia coli. J Urol. 1995;153(1):117-120.
7. Allen UD, MacDonald N, Fuite L, Chan F, Stephens D. Risk factors for resistance to “first-line” antimicrobials among urinary tract isolates of Escherichia coli in children. CMAJ. 1999;160(10):1436-1440.
8. De Mouy D, Cavallo JD, Armengaud M, et al. [Urinary tract infection in an urban population: Etiology and antibiotic sensitivity as a function of patient history]. Presse Med. 1999;28(30):1624-1628.
9. Waites KB, Chen Y, DeVivo MJ, Canupp KC, Moser SA. Antimicrobial resistance in gram-negative bacteria isolated from the urinary tract in community-residing persons with spinal cord injury. Arch Phys Med Rehabil. 2000;81(6):764-769.
10. Shah PS, Cannon JP, Sullivan CL, Nemchausky B, Pachucki CT. Controlling antimicrobial use and decreasing microbiological laboratory tests for urinary tract infections in spinal-cord-injury patients with chronic indwelling catheters. Am J Health Syst Pharm. 2005;62(1):74-77.
11. Weber DJ, Raasch R, Rutala WA. Nosocomial infections in the ICU: The growing importance of antibiotic-resistant pathogens. Chest. 1999;115(suppl 3):34S-41S.
12. Naber KG, Bergman B, Bishop MC, et al; Urinary Tract Infection (UTI) Working Group of the Health Care Office (HCO) of the European Association of Urology (EAU). EAU guidelines for the management of urinary and male genital tract infections. Urinary Tract Infection (UTI) Working Group of the Health Care Office (HCO) of the European Association of Urology (EAU). Eur Urol. 2001;40(5):576-588.
13. Everaert K, Lumen N, Kerckhaert W, Willaert P, van Driel M. Urinary tract infections in spinal cord injury: Prevention and treatment guidelines. Acta Clin Belg. 2009;64(4):335-340.
14. Pannek J. Treatment of urinary tract infection in persons with spinal cord injury: Guidelines, evidence, and clinical practice. A questionnaire-based survey and review of the literature. J Spinal Cord Med. 2011;34(1):11-15.
15. Musher DM, Thorsteinsson SB, Airola VM II. Quantitative urinalysis. Diagnosing urinary tract infection in men. JAMA. 1976;236(18):2069-2072.
16. Deresinski SC, Perkash I. Urinary tract infections in male spinal cord injured patients. Part two: Diagnostic value of symptoms and of quantitative urinalysis. J Am Paraplegia Soc. 1985;8(1):7-10.
17. Deresinski SC, Perkash I. Urinary tract infections in male spinal cord injured patients. Part one: Bacteriologic diagnosis. J Am Paraplegia Soc. 1985;8(1):4-6.
18. Garcia Leoni ME, Esclarin De Ruz A. Management of urinary tract infection in patients with spinal cord injuries. Clin Microbiol Infect. 2003;9(8):780-785.