User login
Inpatient Glycemic Control Outcomes
The concept of improved inpatient diabetes control has been gaining attention in hospitals nationwide as a mechanism for improving patient outcomes, decreasing readmission rates, reducing cost of care, and shortening hospital length of stay.14 The growing recognition that glycemic control is a critical element of inpatient care has prompted several national agencies, including the National Quality Forum (NQF), University Health System Consortium (UHC), Centers for Medicare and Medicaid Services (CMS), and the Joint Commission (JC) to make inpatient diabetes control a focus of quality improvement efforts and outcomes tracking.1 There is a national trend toward the use of intravenous insulin infusion for tight glycemic control of stress‐induced hyperglycemia in postoperative intensive care unit (ICU) and medical ICU patients.5, 6 Consequently, there is a need for the development of a standardized approach for performance evaluation of subcutaneous and intravenous insulin protocols, while ensuring patient safety issues. The analysis of glucose outcomes is based on the systematic analysis of blood glucose (BG) performance metrics known as glucometrics.7, 8 This has provided a means to measure the success of hospital quality improvement programs over time.
The 2008 American Diabetes Association (ADA) Clinical Practice Recommendations endorse BG goals for the critically ill to be maintained as close as possible to 110 mg/dL (6.1 mmol/L) and generally <140 mg/dL (7.8 mmol/L).2 The American Association of Clinical Endocrinologists/The American College of Endocrinology guidelines recommend for ICU care BG in the range of 80110 mg/dL.1, 4 Regarding the non‐critically ill patients, the ADA recommends targets for fasting BG of <126 mg/dL (7.0 mmol/L) and all random BG 180200 mg/dL (1011.1 mmol/L).2 A limitation for these BG goals is hypoglycemia; the ADA endorses that hospitals try to achieve these lower BG values through quality improvement initiatives devised to systematically and safely reduce the BG targets.2
Materials and Methods
The Medical University of South Carolina (MUSC) is a 709‐bed tertiary‐care medical/surgical center located in Charleston, South Carolina. The medical center consists of 6 adult ICUs: medical intensive care unit, coronary care unit, cardiothoracic intensive care unit, neurosurgical intensive care unit, neurosurgical trauma intensive care unit, and surgical trauma intensive care unit. Overall, 14% of patients are in the ICUs, and 86% of patients are on the wards. MUSC has an extensive referral network including neighboring hospitals, rehabilitation centers, outpatient specialty treatment and imaging centers, and doctors' offices.
MUSC Hospital Diabetes Task Force
In 2003, the Medical Executive Committee (MEC) and the Medical Director of the MUSC Medical Center mandated that a Hospital Diabetes Task Force (HDTF) be created to improve the care of patients with diabetes hospitalized at our facility. The initial goal of the HDTF was to develop a multidisciplinary team that would address the barriers to achieving glycemic control in the inpatient setting. Chaired by an endocrinologist, the HDTF currently consists of representatives from medicine (endocrinology and hospital medicine), surgery, nursing, diabetes education, nutrition, hospital administration, pharmacy, house staff, and laboratory medicine. The HDTF has been responsible for developing and overseeing the implementation of standardized nursing flow sheets for diabetic patients, order sets for subcutaneous and intravenous insulin administration, protocols for management of hypoglycemia and hyperglycemia, and systems tracking outcomes for quality improvement. The HDTF has also taken the lead in educating physician and nursing staff in the proper use of the new protocols and procedures.
Development of Hypoglycemia Protocol
The task force began with the hypoglycemia policy that was currently in place at the time. Initially developed in 1993, the policy outlined guidelines for the nursing staff to follow in the treatment of hypoglycemia. Over the course of 6 months, the task force revised the policy as well as the hypoglycemia protocol based on the following principles:
Nurse‐initiated orders for treatment of hypoglycemia throughout the hospital.
Standardized treatment for hypoglycemia based on patient type and degree of hypoglycemia.
Availability of glucose tablets, glucagon, and intravenous 50% dextrose (D50%) in easily accessible areas on all units.
Linkage of the hypoglycemia protocol to all insulin orders.
Extensive education of hypoglycemia symptom recognition and treatment.
Linkage of the hypoglycemia protocol to nursing documentation.
Development of carbohydrate counting in the hospital.
The assumption was that a major revision of the hypoglycemia protocol, based on these principles, would ensure better patient safety against hypoglycemic events, especially in light of the intensive medical management of glycemic control. On October 1, 2004, MUSC instituted a nurse‐initiated order for a hospital‐based hypoglycemia protocol to begin treatment for all BG <70 mg/dL. The hypoglycemia protocol became a part of the online adult insulin prescribing system so that when the physician signed the adult online insulin orders, the hypoglycemia protocol was ordered at the same time. Nursing units were stocked with glucose tablets, intramuscular glucagon, and D50% for consistent treatment of hypoglycemia.
Modifications to the hypoglycemia protocol included the following: in July 2006changing to specific aliquots of D50% for treatment of hypoglycemia to avoid overcorrection of low BG; reinforcing the need with the nursing staff to recheck BG 15 minutes after an episode of hypoglycemia; listing of juice as a last form of treatment for hypoglycemia; and in May 2007instituting a hypoglycemia prevention policy along with a hypoglycemia treatment policy (see Table 1 for hypoglycemia treatment protocol).
| Patient Characteristics | Action To Be Taken |
|---|---|
| |
| The patient is unable to eat or swallow safely | Administer dextrose 50% by intravenous push as follows: |
| The patient is NPO | 15 mL (7.5 g) for BG 6069 mg/dL |
| OR | 20 mL (10 g) for BG 5059 mg/dL |
| The patient is unconscious | 25 mL (12.5 g) for BG 3049 mg/dL |
| AND | 30 mL (15 g) for BG <30 mg/dL |
| The patient has intravenous access | Assess unconscious patient for adequate airway, breathing, and circulation |
| If possible place patient in a lateral recumbent position to decrease aspiration | |
| Place patient on seizure precautions | |
| Recheck BG every 15 minutes and repeat treatment until BG is greater than 70 mg/dL | |
| The patient is unable to eat or swallow safely | Administer 1 mg glucagon intramuscularly |
| The patient is NPO | Assess patient for adequate airway, breathing, and circulation |
| OR | Place patient in a lateral recumbent position to decrease aspiration |
| The patient is unconscious | Place patient on seizure precautions |
| AND | Establish intravenous access |
| The patient does not have intravenous access | Recheck BG and consciousness every 5 minutes and repeat treatment until BG is greater than 70 and patient is awake |
| The patient is able to eat and swallow safely | Feed with 15 grams of carbohydrate in order of preference from the following: |
| OR | Fast Fifteen: 3 glucose tablets |
| The patient has a patent nasogastric tube | 1 tablespoon of sugar (3 packets) |
| 4 oz (120 mL) of regular soda | |
| 4 oz (120 mL) of juice | |
| Recheck BG in 15 minutes and repeat treatment until BG is greater than 70 mg/dL | |
| It will be necessary to give the patient extra food after blood glucose is greater than 70 mg/dL if hypoglycemia occurs greater than 1 hour from meal or occurs during sleeping hours. Feed the | |
| patient 1 of the following: | |
| 8 oz (1 cup) of whole milk | |
| 6 saltine crackers with 2 tablespoons of peanut butter | |
| 6 saltine crackers with 1 oz. cheese | |
Education of Hospital Personnel
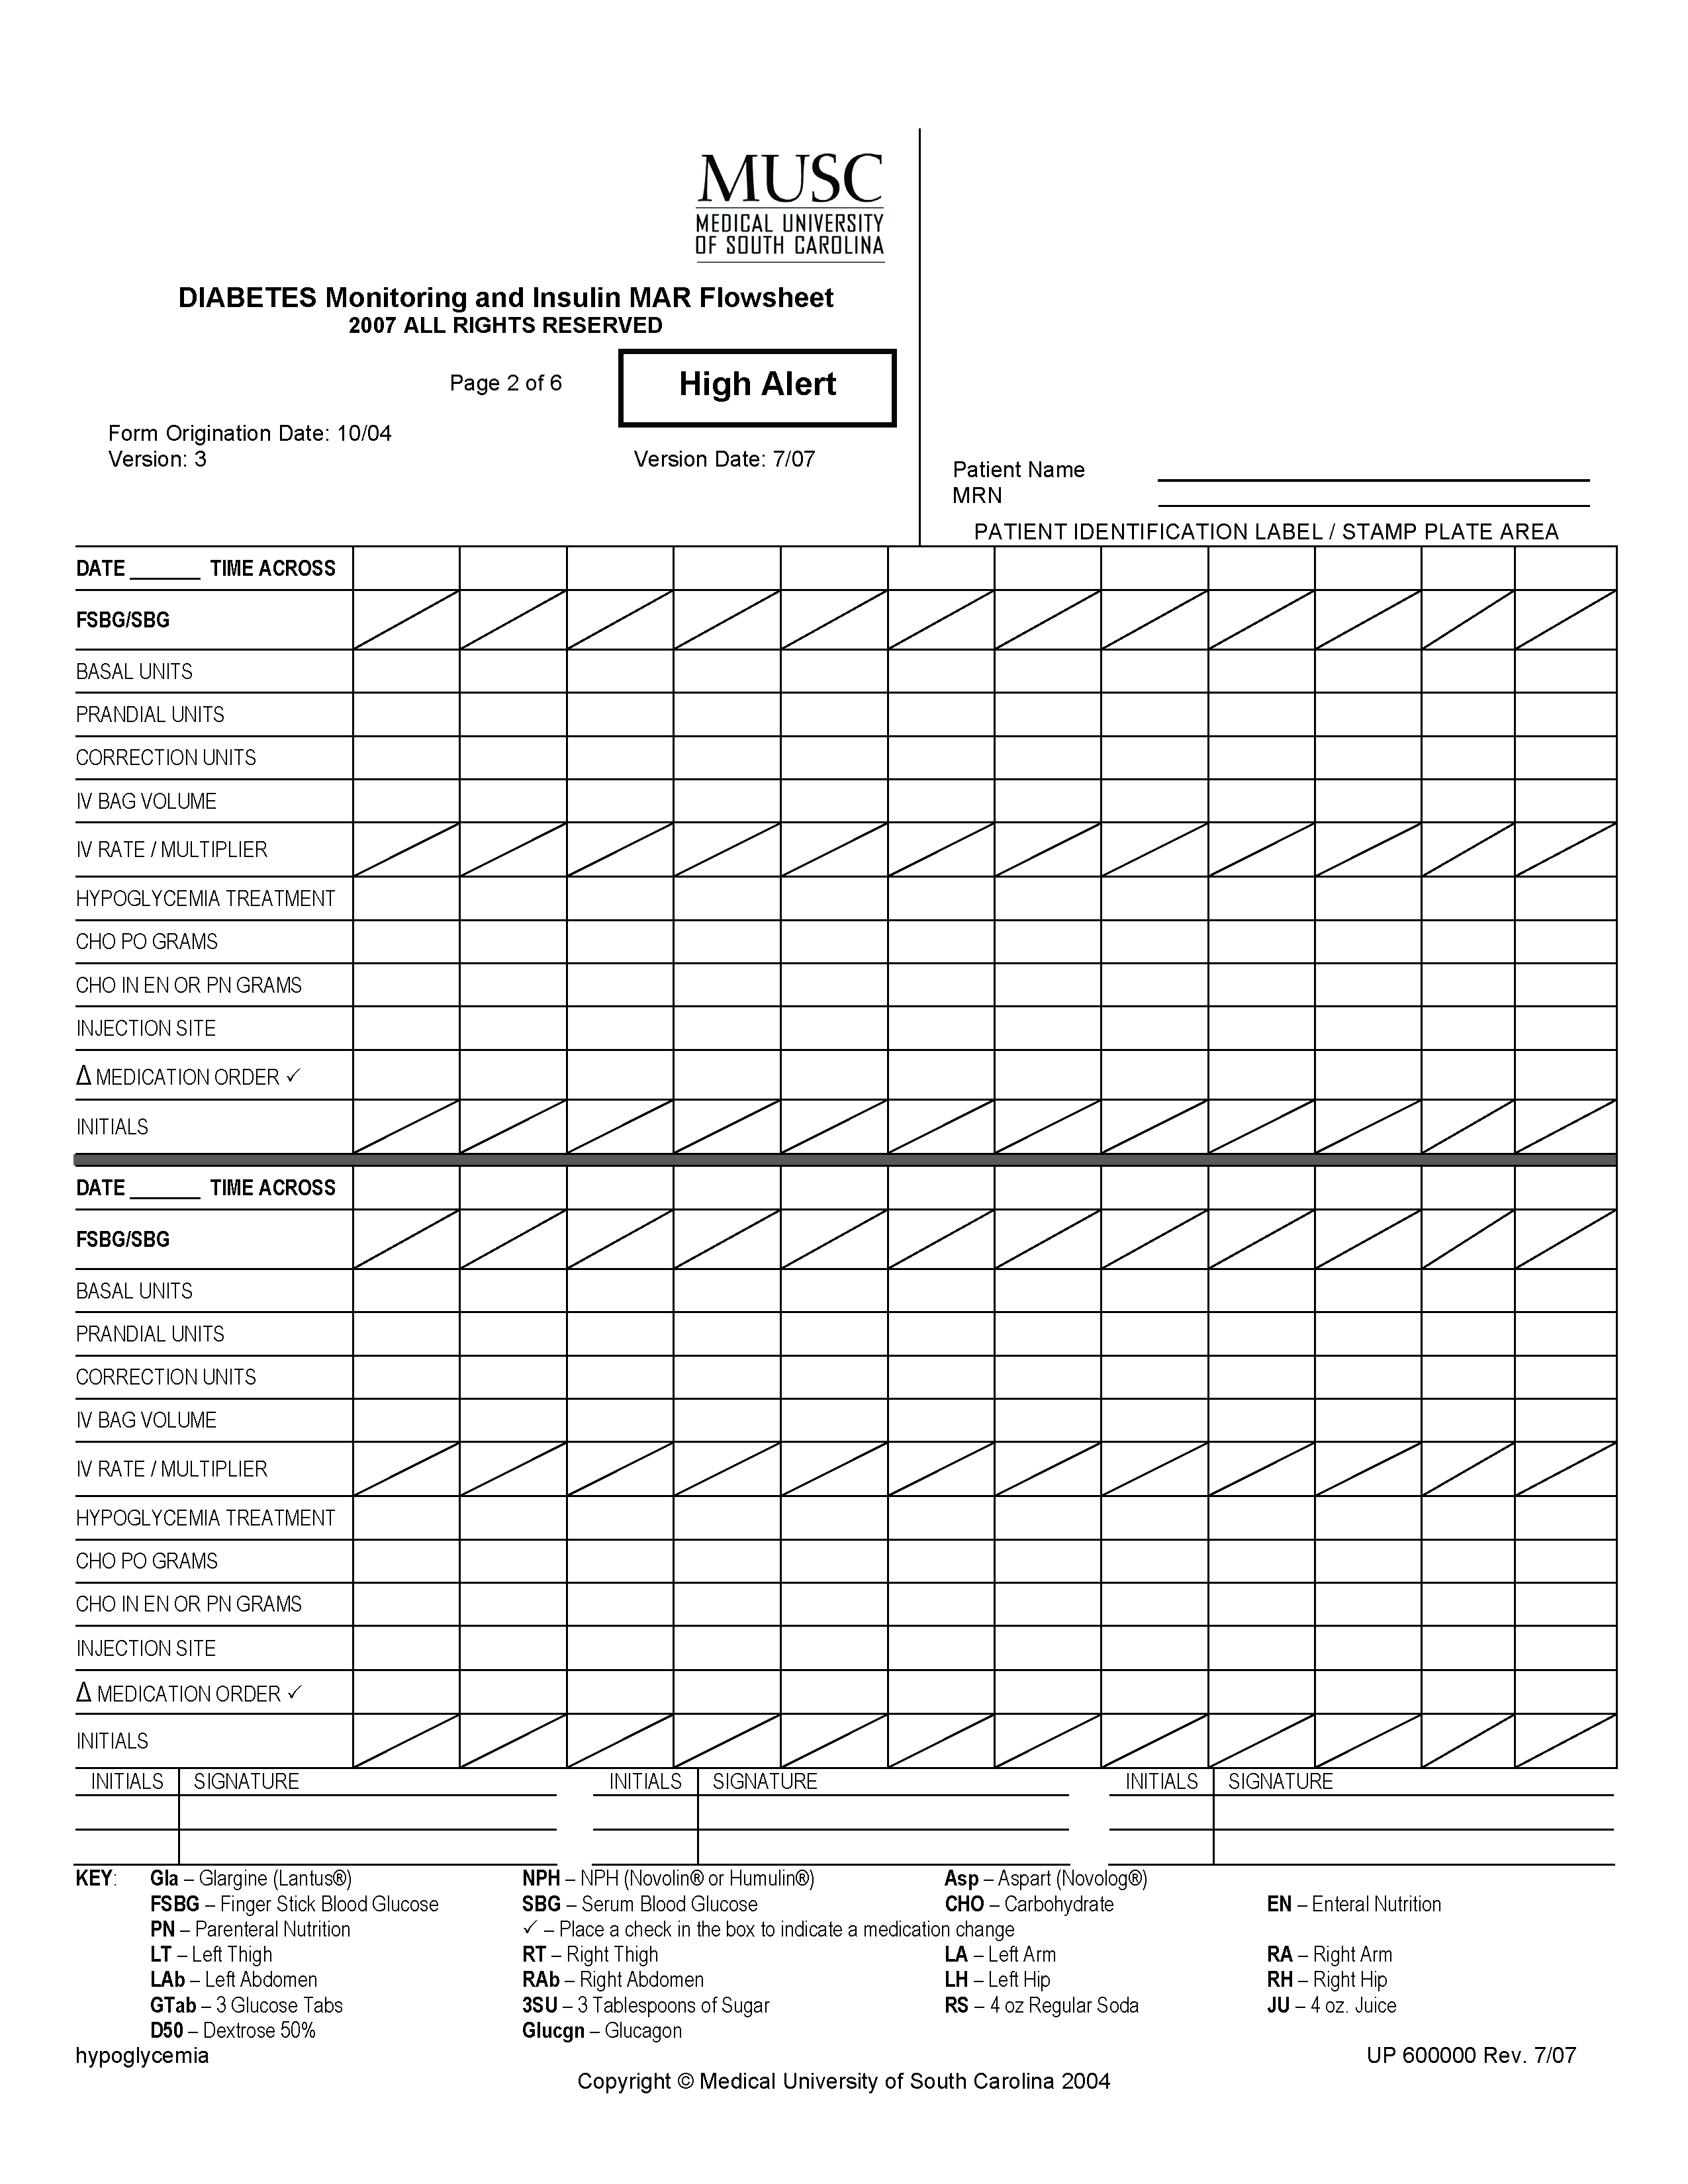
In addition to the development of the hypoglycemia protocol and a nursing flow sheet dedicated specifically to the use of insulinthe insulin Medication Administration Record (MAR) (Supporting Figure 1)a key piece in the implementation strategy was the development of an educational program for the nurses, house staff, and medical personnel about policies and procedures. Many in‐service sessions were conducted to outline the protocols and to troubleshoot any difficulties.9 The key champion for training the nurses was a hospital RN Certified Diabetes Educator (CDE) who was instrumental in obtaining in‐hospital nursing support for the protocols. A series of 30‐minute to 60‐minute in‐service sessions were conducted for nursing staff on each unit before the protocols were launched. To ensure that these in‐services were presented to as many staff as possible, the sessions were repeated at least two times for each shift. An important aspect of the education was the understanding of the different types of insulin and the concepts addressing the ways insulin can be used for maintenance of euglycemia: basal, prandial, and correction.14, 10, 11 This education also included information regarding ADA BG targets, characteristics of an insulin‐deficient patient, defining type 1 and type 2 diabetes, a review about insulin requirements during health and illness, treatment of hypoglycemia, information about insulin products, the concept of carbohydrate counting, and proper documentation of patient treatment.2, 1214
Subcutaneous Insulin Protocol
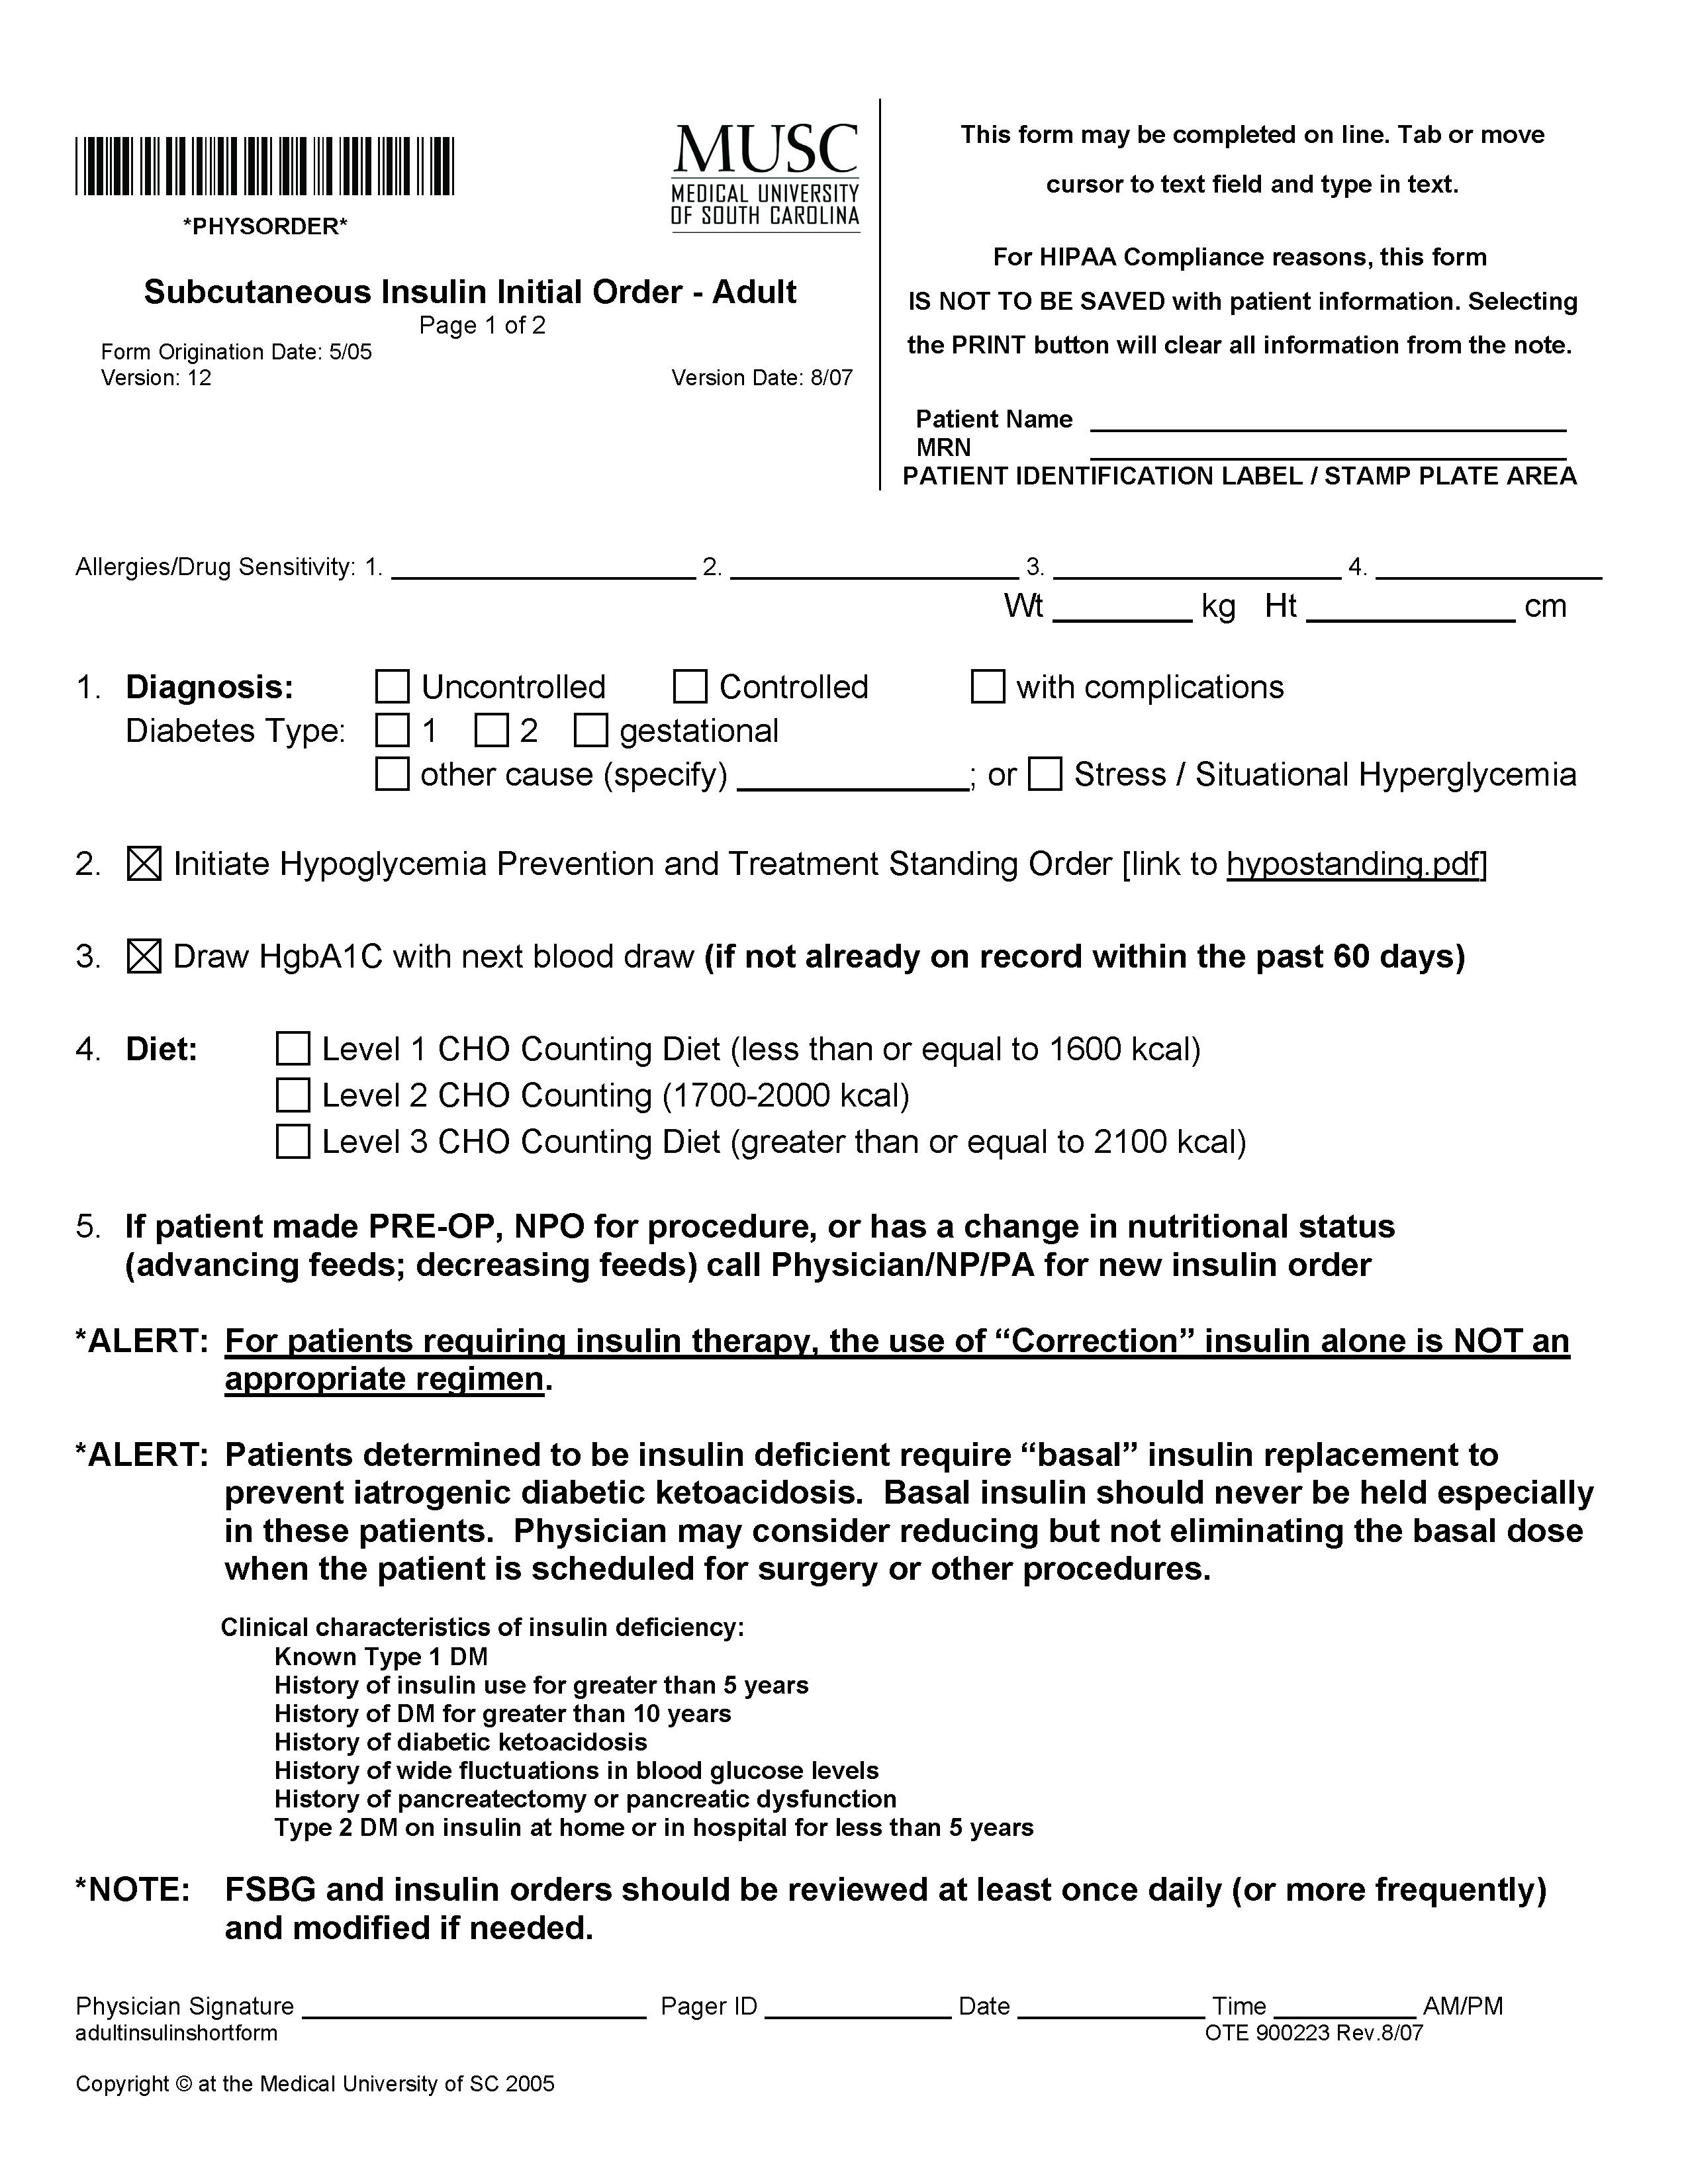
The protocols for subcutaneous (SC) insulin developed by the HDTF targeted a BG range of 70140 mg/dL on the medical surgical floors (Supporting Figure 2). The forms developed were based on scheduled or programmed insulin, which consists of basal and prandial/nutritional insulin with SC correction‐dose insulin.15 Correction or supplemental insulin is used to treat elevated BGs that occur before meals or between meals. If used at bedtime, the correction insulin is lowered to prevent nocturnal hypoglycemia. Correction‐dose insulin is different from sliding‐scale insulin, which is a predetermined amount of insulin used to treat hyperglycemia without regard to prior insulin administration or timing of food intake.15 When patients are hospitalized, scheduled and correction insulin doses are raised to cover the increased insulin needs of basal, prandial, and nutritional dosing in the hospital settting.3 As routine process of care, oral antihyperglycemic agents were recommended to be stopped at the time of hospital admission.
In January 2006, MUSC instituted a surveillance plan with nursing CDEs who reviewed charts for events of hypoglycemia and hyperglycemia: BG < 60 mg/dL and two BGs >200 mg/dL, respectively. In January 2006, all sliding‐scale insulin protocols were eliminated and replaced with basal, prandial, and correction insulin protocols. In July 2006, MUSC eliminated SC regular insulin use and replaced it with SC analog insulin use, except for a rare patient exception.
To reduce insulin errors, our hospital formulary was restricted to the following insulin use: SC glargine, SC neutral protamine hagedorn (NPH), SC aspartame, and intravenous (IV) regular (Table 2 shows the time line for hospital upgrades, with dates).
| Date | Intervention |
|---|---|
| September 2003 | Formation of HDTF |
| October 2004 | Initiation of hypoglycemia protocol: MD standing order for nurse‐driven hypoglycemia protocol |
| January‐May 2005 | Intensive nursing education: how to Rx hypoglycemia, nursing flow sheet (insulin MAR), patient education record, CHO counting, insulin concepts |
| October 2005 | Began using IVIIC in CT Surgery |
| January 2006 | Surveillance plan with CDE chart checks: hypoglycemia <60 mg/dL and hyperglycemia two BGs >200 mg/dL |
| January 2006 | All sliding‐scale insulin protocols eliminated and replaced with preprinted protocols basal dose based on body weight, prandial dose based on body weight, and correction dose based on total daily dose of insulin |
| February 2006 | All adult ICUs using IVIIC with BG checks q 2‐4 hour |
| June 2006 | Stress need to use juice last in Rx hypoglycemia, so not to over treat patients |
| July 2006 | Use aliquots D50 to Rx different severities of hypoglycemia |
| July 2006 | Elimination of SC regular insulin and replace it with SC insulin analog use. Hospital formulary restricted to: SC glargine, SC NPH, SC aspart, and IV regular insulin |
| July 2006 | Increase frequency BG checks while using IVIIC: check BG q1 hour |
| July 2006 | Eliminate SC Novolin 70/30 from hospital formulary and replace with SC Novolog 70/30 |
| September 2006 | Implement insulin pump initiation/orders |
| May 2007 | Institute hypoglycemia prevention policy along with hypoglycemia treatment policy |
| June 2007 | Stress difference between juices: apple/orange juice: 15 g; and prune, cranberry, grape juice: 23 g |
Intravenous Insulin Protocol
The HDTF initially reviewed 15 evidence‐based protocols and identified 5 desirable protocol characteristics. These characteristics included easy physician ordering (requiring only a signature), ability to quickly reach and maintain a BG target range, minimal risk for hypoglycemic events, adaptability for use anywhere in the hospital setting, and acceptance and implementation by nursing staff.16
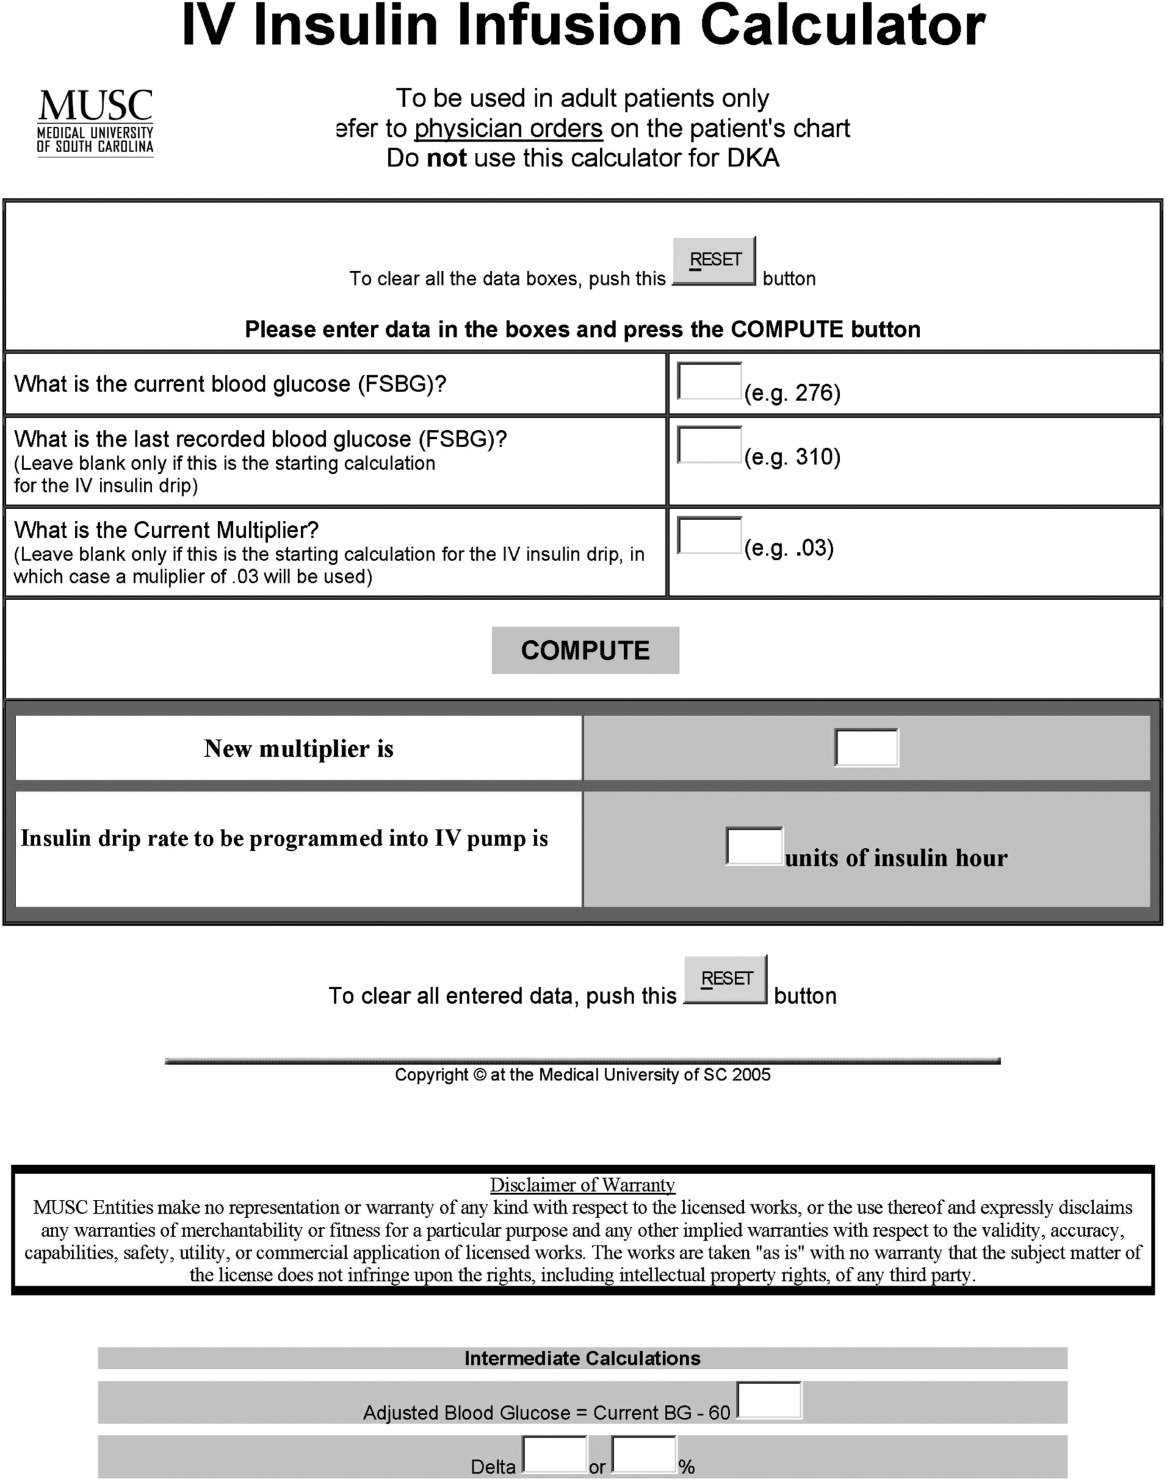
The IV protocol, a web‐based calculator (Figure 1), was developed based on the concept of the multiplier by White et al.17 For this protocol, the IV infusion (IVI) rate is changed based on a formula that uses a multiplier (a surrogate for insulin sensitivity factor) and the difference between measured BG and target blood glucose (TBG). The calculator uses the following mathematical formula: rate of insulin infusion/hour = (current BG 60 mg/dL) 0.03.18, 19 Additionally, the protocol requires that enough insulin be infused to address severe hyperglycemia at initiation with a rapid reduction in the insulin infusion rate as BG normalizes. The protocol also permits an adjustment of the insulin rate by tenths of a unit per hour to maintain the BG in the center of the target range. The main variant of this protocol is the value of the starting multiplier. The web‐based calculator is currently being used in all 6 adult ICUs and on all of the adult medical‐surgical floors at MUSC.
In early 2006, all adult ICUs were using our in‐house, web‐based intravenous insulin infusion calculator (IVIIC), which prompted more BG readings with intensification of insulin drip use.19 Specifically, initial monitoring for the IVIIC included BG readings every 24 hours. To avoid hypoglycemic events from occurring with the intensification of BG readings for the IVIIC, the BG monitoring frequency was increased to every hour in July 2006. Initial treatment for hypoglycemia was D50% (12.525 g), which tended to overcorrect BG. In July 2006, we revised the protocol using aliquots of D50% specific to the BG reading.19 This action has resulted in decreasing the glycemic excursions observed due to overcorrection of hypoglycemia.
BG target ranges to match the level of care are as follows: intensive care unit (80110 mg/dL); labor and delivery (70110 mg/dL); adult medical/surgical floors (80140 mg/dL); diabetic ketoacidosis (DKA)/hyperosmolar nonketotic coma (HHNK) (150200 mg/dL); neurosurgery ICU (90120 mg/dL); and perioperative patients (140180 mg/dL).20 These BG targets were created to satisfy the clinical requests of specific departments at MUSC. We have restricted starting the multiplier for DKA/HHNK at 0.01, to affect a slower rate of change and the multiplier for all others is set at 0.03.
Transition From Intravenous to Subcutaneous Insulin
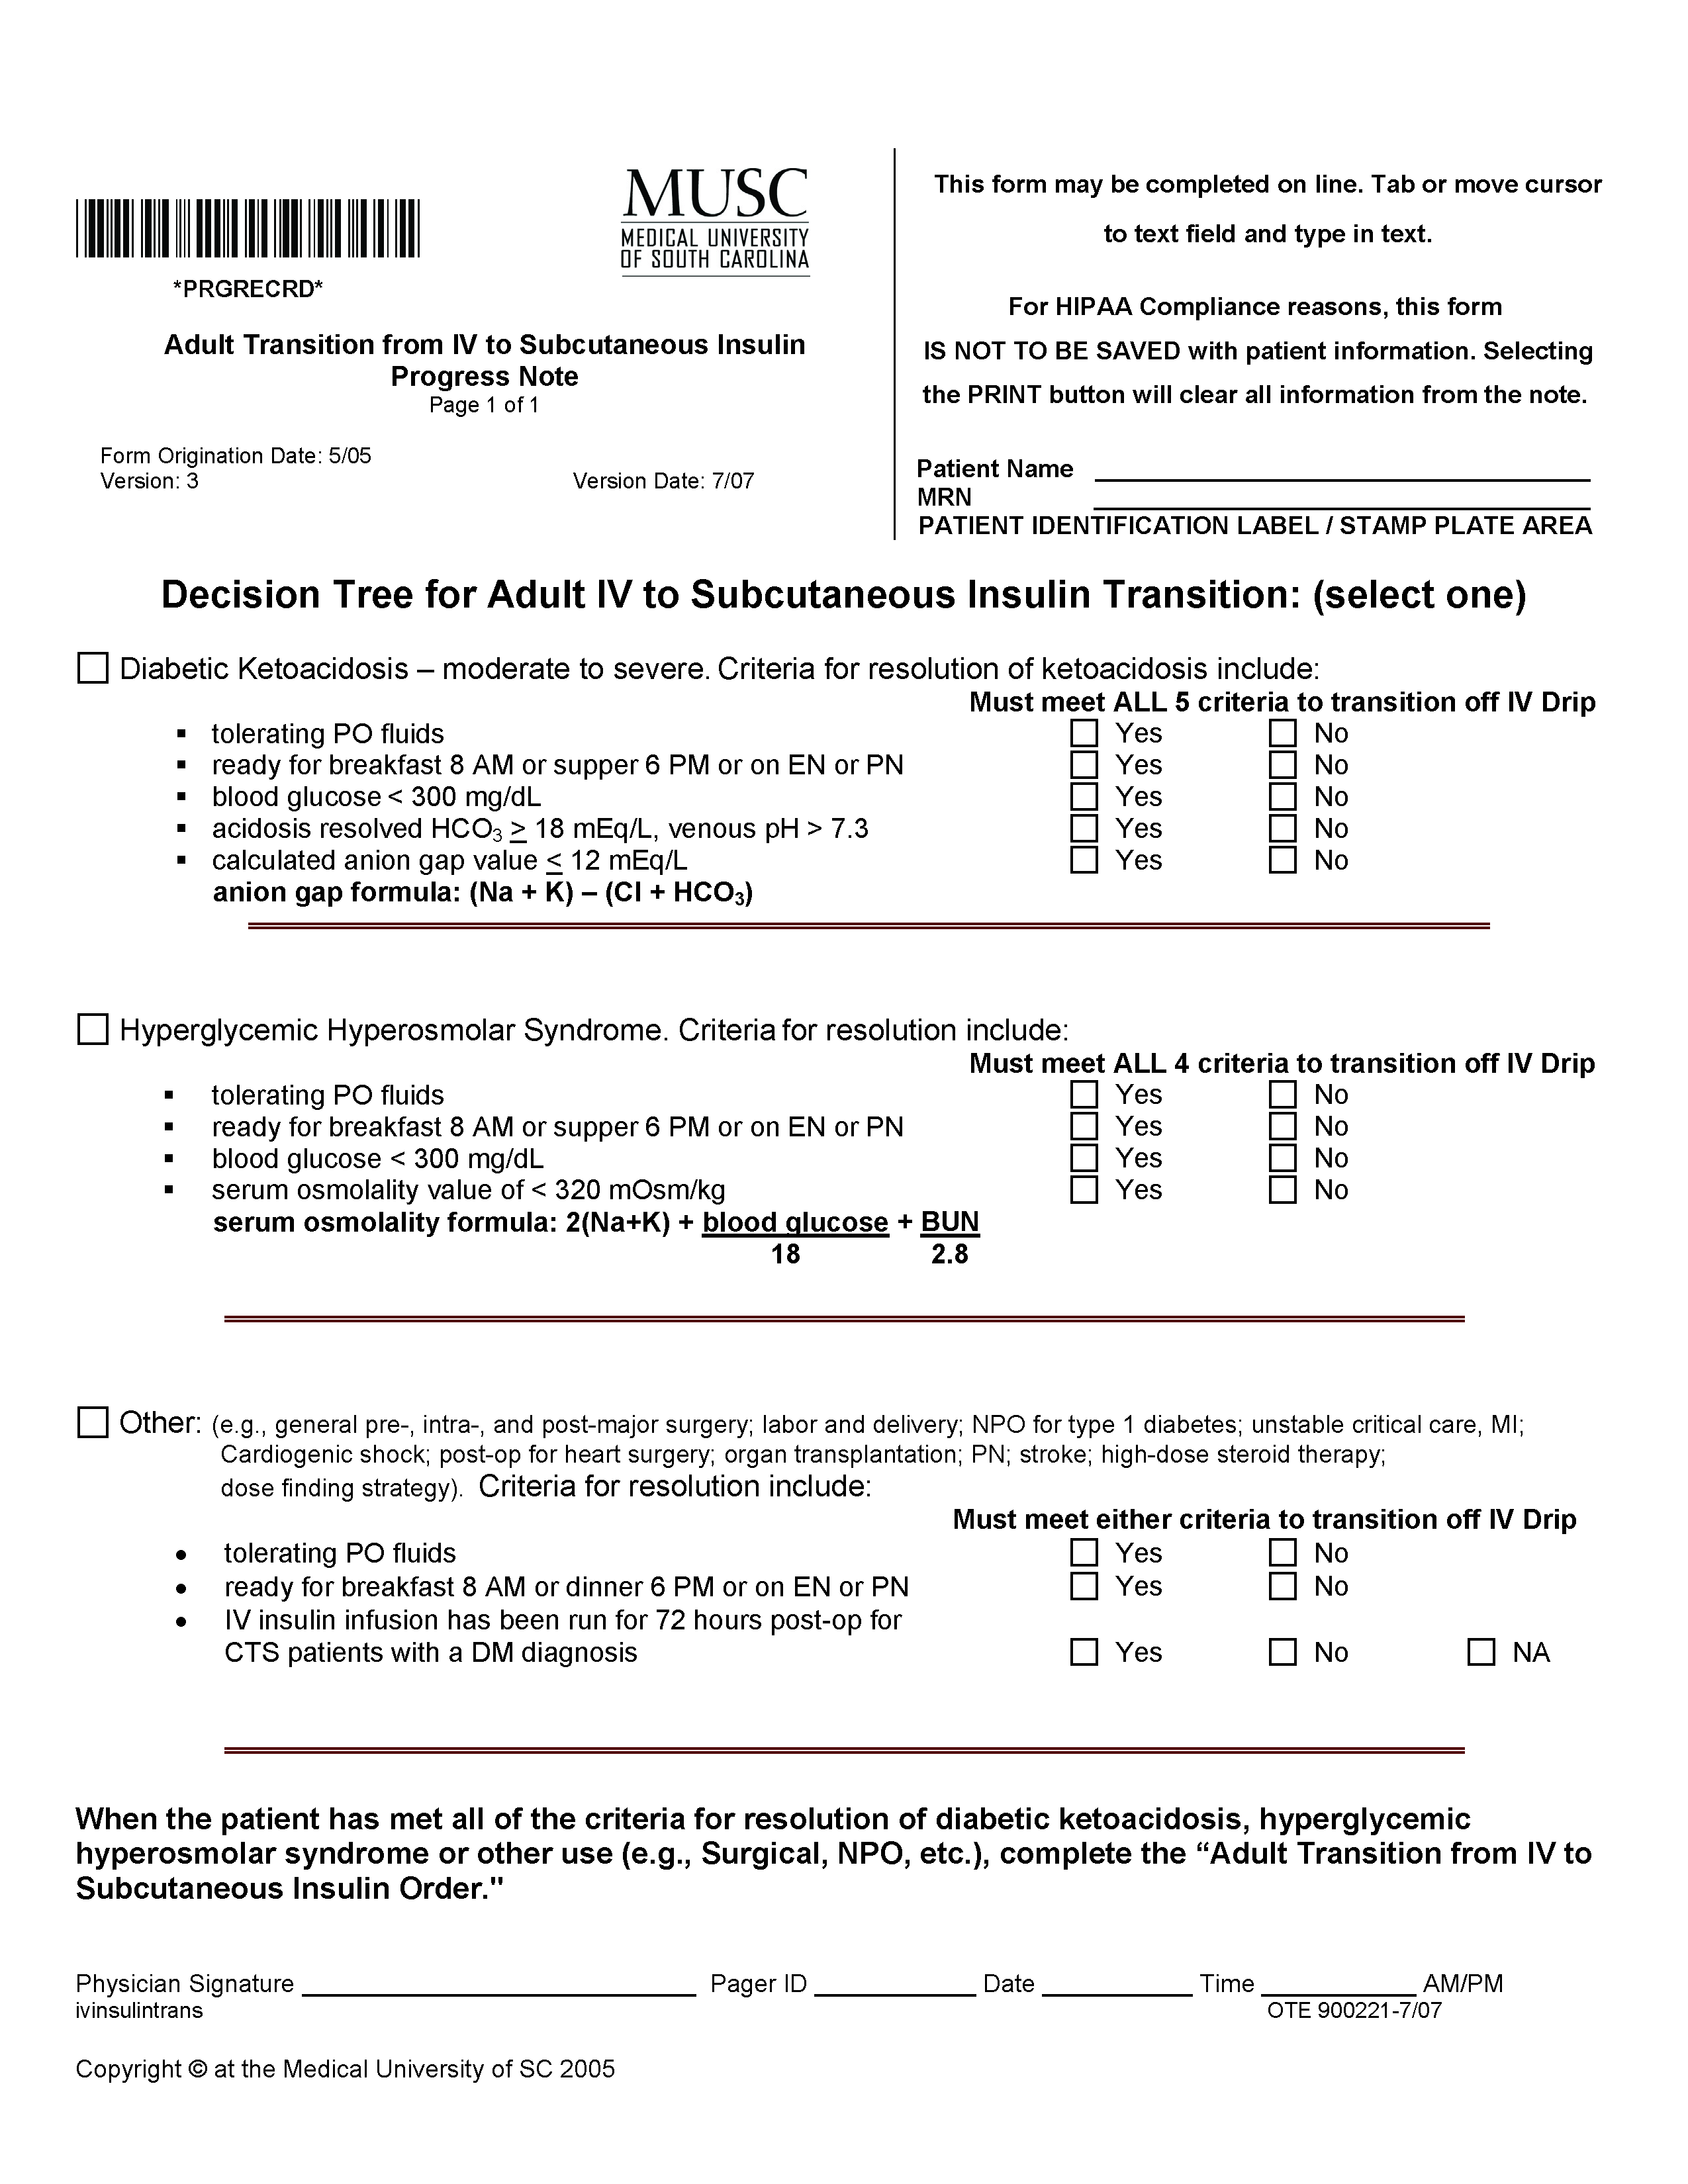
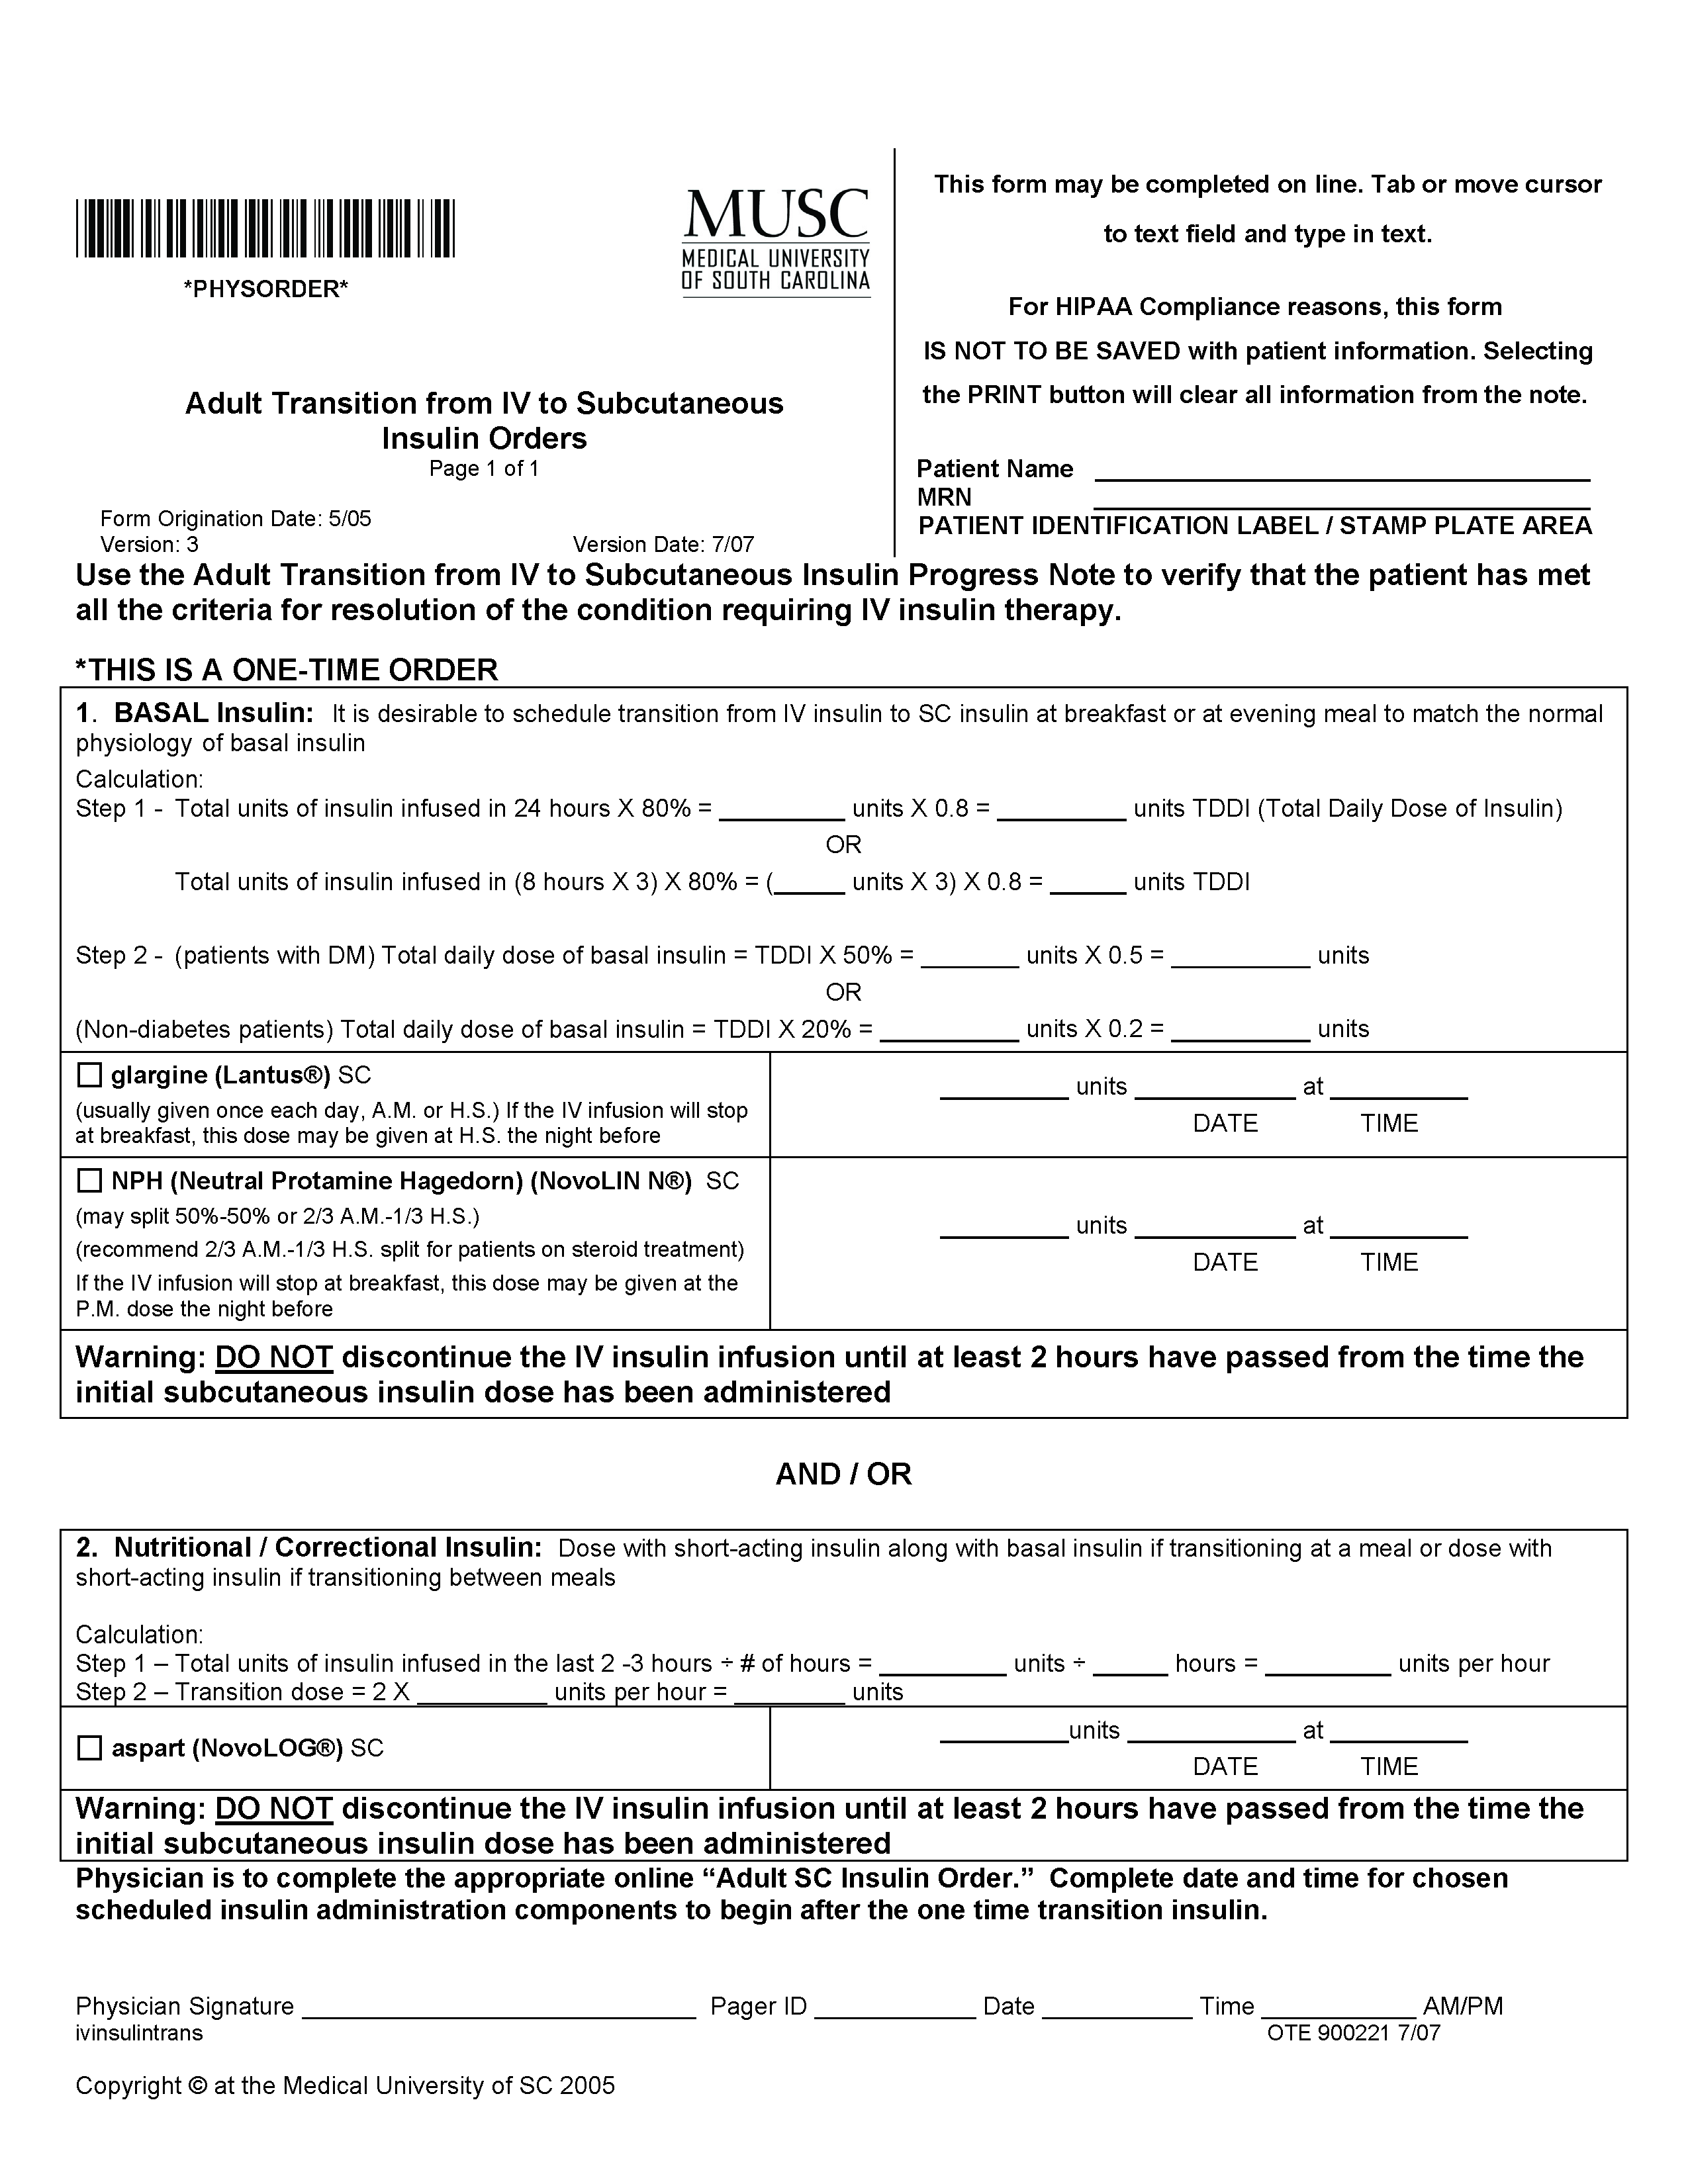
At MUSC, IV insulin therapy reverts to an SC insulin therapy protocol when the patient resumes PO feedings, discontinues pressor support, or stops volume resuscitation21 (see Supporting Figure 3 for the IV to SC insulin transition form). While preparing to stop IV insulin, SC insulinparticularly basal insulinshould begin at least 23 hours prior to discontinuing IV insulin. A short‐acting or rapid‐acting insulin may be given 12 hours SC prior to stopping IV insulin. This is particularly true for patients who are at risk for ketoacidosis, such as patients with type 1 diabetes.21 Recommendations for scheduled insulin administration include basal and prandial and correction doses of insulin to cover glycemic excursions. A minority of patients with stress hyperglycemia will not require conversion to SC insulin when discontinuing IV insulin therapy; however, BG monitoring and administration of correction insulin is recommended.
Data Collection
A retrospective chart review was approved by the MUSC Institutional Review Board, and the requirement of patient consent was waived. A database query against the hospital's electronic medical record was used to supply the data for this study. In particular, a complete listing of all finger‐stick BG measurements taken during June 2004 (preimplementation), June 2005 (implementation), and June 2006 and 2007 (postimplementation) was used. The sample included all inpatient stays for patients who had a documented history of diabetes or at least 1 BG reading in excess of 180 during the inpatient stay. Finger‐stick BG measurements taken within 50 minutes of another reading were excluded from the analysis to account for the increased testing frequency that occurs, per protocol, after detection of a hypoglycemic or hyperglycemic event. Finger‐stick BG levels were measured by the Abbott Precision PCX and downloaded directly into the university's electronic medical record.
Statistical Analysis and Considerations
Sample size estimation
A preliminary study of hypoglycemic rates in 2004 and 2005 was used to plan this analysis.22 In this preliminary study, 295 of 13,366 BG readings were mildly hypoglycemic before the glycemic protocol, yielding an estimated rate of 22.1 per 1,000 measurements. During the glycemic protocol implementation period (June 2005), an estimated rate per 1,000 measurements of 18.9 (289/15,324) was obtained. Using the binomial approximation to the Poisson, it was estimated that 30,499 additional BG measurements were needed to detect, with 80% power and a type I error rate of 0.05 (two‐sided), a rate ratio as small as 1.17 (22.1 per 1,000/18.9 per 1,000). Based on the number of BG measurements obtained in the preliminary study (14,000/month), two additional months of postintervention data were deemed necessary. Data from June 2006 and June 2007 were used to test the maintenance effects of the implemented glycemic management protocol.
Primary analysis
Mild, moderate, and severe hypoglycemia were defined as BG readings 5069 mg/dL, 4049 mg/dL, and <40 mg/dL, respectively.23 BG readings 250 mg/dL or higher were considered hyperglycemic. These events were summarized by the methods suggested for an inpatient setting.7 The first method treated each BG as an independent observation (i.e., ward‐level analysis for which the denominator was the total number of BG readings). This analysis represents a census, so statistical comparisons are not warranted (i.e., the population parameters are obtained), but the generalizability of the findings is limited accordingly. For the formal analysis of the prevalence of glycemic events by year, the patient‐day analysis was used. For this analysis, data were aggregated by each unique patient‐day. For each patient‐day, descriptive statistics were tabulated on the raw BG readings. For the determination of patient‐day occurrence of hypoglycemic events, the three hypoglycemic severities (mild, moderate, and severe) were treated as ordinal variables such that if a patient had a severe hypoglycemic episode on a given day, he was considered to have also had moderate and mild hypoglycemia for that day. This strategy was undertaken based on the belief that if a person had a worse outcome, then the less severe outcome also occurred during the same patient day.
The primary hypothesis was that the nurse‐driven hypoglycemia protocol implemented by 2005 would result in tighter BG control (lower rates of hyperglycemia and hypoglycemia) after implementation. To test this hypothesis, the patient‐day summary of BG readings was used to estimate the odds of an event for each year. The odds of developing mild (BG 5069 mg/dL), moderate (BG 4049 mg/dL), and severe (BG < 40 mg/dL) hypoglycemic events were compared using generalized estimating equations for correlated binary data.24 This analysis accounted for the clustering of observations (patient‐day summaries) within patient stay by modeling the correlation of outcomes within a patient stay. In addition to hypoglycemia, the proportion of patient days with a mean BG between 70180 mg/dL and the proportion of patients experiencing hyperglycemia (BG 250 mg/dL) was examined, and these results were analyzed using the same methodology used for the hypoglycemia endpoints. All analyses were conducted using SAS version 9.1.3 using the procedure GENMOD, a generalized linear modeling procedure in SAS/STAT.
Results
The baseline demographic characteristics of the four study groups are shown in Table 3. The four groups were found to be similar for gender distribution, mean age, and racial distribution. There were significant differences observed among hospital stay characteristics, insulin drip use, history of diabetes, ventilator support, kidney failure, dialysis, total parenteral nutrition (TPN), and red blood cell (RBC) transfusions. Overall, insulin drip use tended to increase over time. The percentage of patients with diabetes on admission or diagnosed during admission tended to decrease over time. This was likely due to an increase in the diagnosis and treatment of stress/steroid‐induced hyperglycemia during the hospital stay.
| Variable | All Years Combined (n = 2102)* | 2004 (n = 434) | 2005 (n = 486) | 2006 (n = 609) | 2007 (n = 573) | P value |
|---|---|---|---|---|---|---|
| ||||||
| Sex, male n (%) | 959 (45.6) | 186 (42.9) | 214 (44.0) | 292 (48.0) | 267 (46.6) | 0.34 |
| Age (years), mean (SD) | 56.8 | 57.6 (14.8) | 58.0 (15.8) | 56.7 (16.1) | 55.4 (16.4) | 0.092 |
| Race | ||||||
| Caucasian | 1000 (47.6%) | 202 (46.5%) | 217 (44.7%) | 300 (49.3%) | 281 (49.0%) | 0.64 |
| African American | 1059 (50.4%) | 226 (52.1%) | 255 (52.5%) | 299 (49.1%) | 279 (48.7%) | |
| Hispanic | 26 (1.2%) | 4 (0.9%) | 8 (1.6%) | 5 (0.8%) | 9 (1.6%) | |
| Other | 17 (0.8%) | 2 (0.5%) | 6 (1.2%) | 5 (0.8%) | 4 (0.7%) | |
| Hospital stay characteristics n (%) | ||||||
| Floor only | 1630 (77.6%) | 355 (81.8)% | 389 (80.0%) | 430 (70.6%) | 456 (79.6%) | <0.001 |
| ICU only | 57 (2.7%) | 8 (1.8%) | 6 (1.2%) | 27 (4.4%) | 16 (2.8%) | |
| Floor and ICU | 415 (19.7%) | 71 (16.4%) | 91 (18.7%) | 152 (25.0%) | 101 (17.6%) | |
| Clinical characteristics n (%) | ||||||
| Insulin drip, floor and ICU | 306 (14.6%) | 38 (8.8%) | 52 (10.7%) | 106 (17.4%) | 110 (19.2%) | <0.001 |
| Insulin drip, floor patients only | 70 (4.3%) | 4 (1.1%) | 9 (2.3%) | 22 (5.1%) | 35 (7.7%) | <0.001 |
| History of diabetes | 1677 (79.8%) | 392 (90.3%) | 431 (88.7%) | 442 (72.6%) | 412 (71.9%) | <0.001 |
| Ventilator support | 319 (15.2%) | 44 (10.1%) | 64 (13.2%) | 135 (22.2%) | 76 (13.3%) | <0.001 |
| Kidney failure | 250 (11.9%) | 41 (9.5%) | 52 (10.7%) | 95 (15.6%) | 62 (10.8%) | 0.008 |
| Dialysis | 94 (4.5%) | 21 (4.8%) | 18 (3.7%) | 38 (6.2%) | 17 (3.0%) | 0.040 |
| Total parenteral nutrition | 128 (6.1%) | 27 (6.2%) | 18 (3.7%) | 55 (9.0%) | 28 (4.9%) | 0.001 |
| Red blood cell transfusions | 507 (24.1%) | 96 (22.1%) | 107 (22.0%) | 178 (29.2%) | 126 (22.0%) | 0.007 |
A total of 11,715 patient‐days, consisting of 56,401 individual BG readings obtained from 2,215 unique patients, were distributed across the 4 years. Table 4 presents the year‐specific patient‐day analysis. While the prevalence of mild (BG 5069 mg/dL) hypoglycemia was found to increase over the years studied (P < 0.01), the percentage of patient‐days with a mean BG in the range of 70180 mg/dL increased over the period of study (P < 0.01). The total hypoglycemia events <60 mg/dL are presented as comparative data to other studies.7 The percent of patient days with at least one BG < 70 mg/dL (reported in Table 4 as mild events) ranged from 3.72 in 2005 to as high as 10.71 in 2007; however, approximately one‐half of the hypoglycemic events are attributable to readings from BG 6069 since the proportion of patient days with a BG < 60 mg/dL was approximately one‐half that for BG < 70 mg/dL (Table 4). The prevalence of patient days with at least one moderate (BG 4049 mg/dL) or severe (BG < 40 mg/dL) hypoglycemia event was not found to increase in a linear manner. There was a statistical trend for potentially nonlinear relationship of year with moderate hypoglycemia and hyperglycemia.
| Year (number of patient days) | Tests of significance* | |||||
|---|---|---|---|---|---|---|
| Measure | 2004 (n = 2176) | 2005 (n = 2259) | 2006 (n = 3525) | 2007 (n = 3755) | Linear trend | Type 3 test |
| ||||||
| BG mean (SD) (mg/dL) | 156 (82) | 152 (72) | 154 (51) | 149 (51) | 0.85 | 0.23 |
| BG median [IQR] (mg/dL) | 136 [105, 186] | 136 [105, 181] | 144 [120, 177] | 137 [114, 169] | N/A | N/A |
| BG readings per patient‐day [mean (SD)] | 3.9 (2.4) | 4.2 (2.9) | 4.9 (3.4) | 5.7 (4.6) | N/A | N/A |
| % Patient‐days with mean BG in range (70‐180 mg/dL) | 69.53 | 72.82 | 76.68 | 79.79 | <0.01 | <0.01 |
| % BGs <60 mg/dL | 3.31 | 1.90 | 5.36 | 5.27 | <0.01 | <0.01 |
| % Mild hypoglycemia (50‐69 mg/dL) | 6.20 | 3.72 | 10.24 | 10.71 | <0.01 | <0.01 |
| % Moderate hypoglycemia (40‐49 mg/dL) | 1.88 | 0.84 | 2.75 | 2.08 | 0.15 | <0.01 |
| % Severe hypoglycemia (<40 mg/dL) | 0.69 | 0.44 | 0.96 | 0.75 | 0.49 | 0.37 |
| % Hyperglycemia (250 mg/dL) | 14.71 | 11.73 | 16.85 | 15.15 | 0.23 | 0.02 |
Immediately following the implementation (year 2005), post hoc comparisons suggested that the rate of moderate hypoglycemia was lowest relative to the 3 other years, but no other statistical differences were observed. The year 2005 also had the lowest proportion of patient days with at least 1 hyperglycemic event.
The individual BG readings for the 2215 unique patients were also individually analyzed according to the methods of Goldberg et al.7 Even though no statistical tests were performed at the ward level, the descriptive data presented in Table 5 are consistent with the analysis of the patient‐day data. Several important features of the data are illustrated by Table 5. Most notably, the glycemic control at the hospital level is improved. The percentage of BG readings in the range of 70180 mg/dL increased annually whereas the mean BG values, the coefficient of variation, and the interquartile range (IQR) decreased annually.
| Year (number of blood glucose readings) | ||||
|---|---|---|---|---|
| 2004 (n = 8,504) | 2005 (n = 9,396) | 2006 (n = 17,098) | 2007 (n = 21,403) | |
| ||||
| Number of patients | 434 | 486 | 612 | 683 |
| BG mean (SD) (mg/dL) | 156 (85) | 154 (81) | 149 (61) | 138 (57) |
| Coefficient of variation | 0.55 | 0.53 | 0.41 | 0.41 |
| Median BG [IQR] (mg/dL) | 135 [101‐186] | 134 [103‐183] | 136 [108‐176] | 124 [101‐160] |
| % BGs in range (70‐180 mg/dL) | 68.09 | 71.80 | 73.71 | 80.41 |
| % Mild hypoglycemia (50‐69 mg/dL) | 3.35 | 2.01 | 2.57 | 2.30 |
| % Moderate hypoglycemia (40‐49 mg/dL) | 0.95 | 0.29 | 0.47 | 0.26 |
| % Severe hypoglycemia (<40 mg/dL) | 0.67 | 0.36 | 0.24 | 0.15 |
| % Hyperglycemia (250 mg/dL) | 10.23 | 9.08 | 6.43 | 4.83 |
Conclusions
Collectively, we have shown that implementing standardized insulin order sets including hypoglycemia, SC insulin, IV insulin, and IV to SC insulin transition treatment protocols at MUSC may generate the expected benefits for patient safety for this population of patients. The primary hypothesis that the rate of hypoglycemia and hyperglycemia would be lower after the implementation of these protocols was supported by the data, because the overall blood glucose control was markedly improved as a result of the protocols. However, the effect was strongest in 2005 (immediately following the protocol's implementation) and appeared to diminish some with time.
There were several other quality improvement measures initiated at MUSC that likely contributed to the decreasing rates of hypoglycemia and hyperglycemia. For example, comparing June 2004 with June 2007, the number of patients tested increased from 434 to 683. This increase could be attributed, in part, to a trend on medical/surgical services toward an increased focus on glucose monitoring.
When intensive glycemic control programs are implemented, hospitals should have a standardized, nurse‐driven hypoglycemia protocol.11 The success of such a hypoglycemia treatment protocol is demonstrated by the improvement observed at MUSC since the protocol was first implemented in October 2004.22
There are limitations that warrant consideration. A key limitation is that other procedural changes may have occurred during the years of study. Because the initial focus of the HDTF was to reduce hypoglycemic and hyperglycemic events, a multipronged approach was used, beginning with the treatment protocol but followed by other changes. These changes, while unmeasured in the current study, could have influenced the rate of hypoglycemia and hyperglycemia. Therefore, although the protocol that we developed has sound theoretical underpinnings, the improvement in glycemic control at other hospitals may vary. Second, because this was initially regarded as a quality improvement project for hospitalized patients with hypoglycemia and hyperglycemia, we did not evaluate morbidity, mortality, or other clinical outcome data other than BG targets and incidences of hypoglycemia and hyperglycemia. Third, there was no concurrent control group established for this study, rather the study used a retrospective, nonrandomized design with a historical control. As previously mentioned, we cannot rule out the idea that other changes occurred between the preprotocol and postprotocol interval to influence our results. Finally, there are statistical limitations to the research.
One limitation regarding the analysis of the BG data was the potential for an increased type I error (ie, false‐positive result) due to clustering of BG values within a patient and increased monitoring frequencies when a hypoglycemic or hyperglycemic event was observed. The generalized estimating equations directly addressed the first concern. In particular, the effective sample size for each participant was a function of the number of patient‐days and the correlation of patient‐day summaries. Therefore, patients with several highly‐correlated outcomes would contribute less to the analysis than other patients with the same number of patient‐days that were correlated to a lesser extent. As for the second concern, the patient‐day frequencies alleviate this problem and avoid the length‐of‐stay bias associated with a patient‐level (or patient‐stay) analysis. Power was less than planned due in part to the use of the patient‐day analysis instead of the originally designed ward‐level analysis. The change in the statistical design was a response to emerging evidence in the literature.7
In conclusion, the hypothesis that MUSC patients benefit from the use of standardized insulin order sets, hypoglycemia, and hyperglycemia treatment protocols, is supported by the data collected in this study. Because it has been recommended that a hypoglycemia and hyperglycemia prevention protocol as well as a hypoglycemia and hyperglycemia treatment protocol be in place, the HDTF will be focusing on the actual prevention of the hypoglycemic and hyperglycemic incidents occurring in the first place.2, 25 This may result in further reductions of hypoglycemic and hyperglycemic events. We have recently implemented hypoglycemia and hyperglycemia prevention policies at MUSC.
- Ace ADA Task Force on Inpatient Diabetes.American College of Endocrinology and American Diabetes Association Consensus Statement on Inpatient Diabetes and Glycemic Control.Endocr Pract.2006;12(4):458–468.
- ADA Writing Group.Standards of Medical Care in Diabetes—2008.Diabetes Care.2008;31(suppl 1):S12–S54.
- ,,, et al.Management of diabetes and hyperglycemia in hospitals.Diabetes Care.2004;27(2):553–591.
- ,,, et al.American College of Endocrinology Position Statement on Inpatient Diabetes and Metabolic Control.Endocr Pract.2004;10(suppl 2):4–9.
- ,,, et al.Intensive insulin therapy in the critically ill patients.N Engl J Med.2001;345:1359–1367.
- ,,, et al.Intensive insulin therapy in the medical ICU.N Engl J Med.2006;354(5):449–461.
- ,,, et al.“Glucometrics”: assessing the quality of inpatient glucose management.Diabetes Technol Ther.2006;8(5):560–569.
- .Society of Hospital Medicine Glycemic Control Task Force, Track Performance; Introducing Glucometrics. SHM;2007.
- ,,,.New insulin infusion protocol improves blood glucose control in hospitalized patients without increasing hypoglycemia.Jt Comm J Qual Patient Saf.2005;31(3):141–147.
- ,.The new insulin analogs: using a team approach to implement basal‐bolus insulin therapy.Pract Diabetol.2004; June:28–37.
- ,,.Practical Management of Inpatient Hyperglycemia.Lakeville, CT:Hilliard Publishing, LLC;2005.
- ,,.Hypoglycemia in hospitalized patients. causes and outcomes.N Engl J Med.1986;315(20):1245–1250.
- .Acute hypoglycemia: keeping the bottom from falling out.Nursing.1995;25(2):41–48; quiz 50.
- ,.Myths and facts about diabetic hypoglycemia.Nursing.1994;24(6):67.
- ,.Subcutaneous insulin therapy in the hospital setting: issues, concerns, and implementation.Endocr Pract.2004;10(suppl 2):81–88.
- ,,.Glucommander: a computer‐directed intravenous insulin system shown to be safe, simple, and effective in 120,618 h of operation.Diabetes Care.2005;28(10):2418–2423.
- ,,.Practical closed‐loop insulin delivery. a system for the maintenance of overnight euglycemia and the calculation of basal insulin requirements in insulin‐dependent diabetics.Ann Intern Med.1982;97:210–213.
- .Strategies for controlling glucose in the intensive care unit.Clin Pulmon Med.2006;13(6):332–347.
- ,,, et al.Outcomes of a cardiothoracic intensive care web‐based online intravenous insulin infusion calculator study at a medical university hospital.Diabetes Technol Ther.2007;9(6):523–534.
- ,,,.Outcomes of a nursing in‐service to evaluate acceptance of a web‐based insulin infusion calculator.J Diabetes Sci Technol.2008;2(3):376–383.
- ,,,.Intravenous insulin infusion therapy: indications, methods, and transition to subcutaneous insulin therapy.Endocr Pract.2004;10(suppl 2):71–80.
- ,,, et al.Outcomes of a hypoglycemia treatment protocol in a medical university hospital [Abstract].Diabetes.2006;55:203OR.
- ,,,,.Evolution of a diabetes inpatient safety committee.Endocr Pract.2006;12(suppl 3):91–99.
- ,.Longitudinal data analysis for discrete and continuous outcomes.Biometrics.1986;42(1):121–130.
- ,,, et al.Hospital hypoglycemia: not only treatment but also prevention.Endocr Pract.2004;10(suppl 2):89–99.
The concept of improved inpatient diabetes control has been gaining attention in hospitals nationwide as a mechanism for improving patient outcomes, decreasing readmission rates, reducing cost of care, and shortening hospital length of stay.14 The growing recognition that glycemic control is a critical element of inpatient care has prompted several national agencies, including the National Quality Forum (NQF), University Health System Consortium (UHC), Centers for Medicare and Medicaid Services (CMS), and the Joint Commission (JC) to make inpatient diabetes control a focus of quality improvement efforts and outcomes tracking.1 There is a national trend toward the use of intravenous insulin infusion for tight glycemic control of stress‐induced hyperglycemia in postoperative intensive care unit (ICU) and medical ICU patients.5, 6 Consequently, there is a need for the development of a standardized approach for performance evaluation of subcutaneous and intravenous insulin protocols, while ensuring patient safety issues. The analysis of glucose outcomes is based on the systematic analysis of blood glucose (BG) performance metrics known as glucometrics.7, 8 This has provided a means to measure the success of hospital quality improvement programs over time.
The 2008 American Diabetes Association (ADA) Clinical Practice Recommendations endorse BG goals for the critically ill to be maintained as close as possible to 110 mg/dL (6.1 mmol/L) and generally <140 mg/dL (7.8 mmol/L).2 The American Association of Clinical Endocrinologists/The American College of Endocrinology guidelines recommend for ICU care BG in the range of 80110 mg/dL.1, 4 Regarding the non‐critically ill patients, the ADA recommends targets for fasting BG of <126 mg/dL (7.0 mmol/L) and all random BG 180200 mg/dL (1011.1 mmol/L).2 A limitation for these BG goals is hypoglycemia; the ADA endorses that hospitals try to achieve these lower BG values through quality improvement initiatives devised to systematically and safely reduce the BG targets.2
Materials and Methods
The Medical University of South Carolina (MUSC) is a 709‐bed tertiary‐care medical/surgical center located in Charleston, South Carolina. The medical center consists of 6 adult ICUs: medical intensive care unit, coronary care unit, cardiothoracic intensive care unit, neurosurgical intensive care unit, neurosurgical trauma intensive care unit, and surgical trauma intensive care unit. Overall, 14% of patients are in the ICUs, and 86% of patients are on the wards. MUSC has an extensive referral network including neighboring hospitals, rehabilitation centers, outpatient specialty treatment and imaging centers, and doctors' offices.
MUSC Hospital Diabetes Task Force
In 2003, the Medical Executive Committee (MEC) and the Medical Director of the MUSC Medical Center mandated that a Hospital Diabetes Task Force (HDTF) be created to improve the care of patients with diabetes hospitalized at our facility. The initial goal of the HDTF was to develop a multidisciplinary team that would address the barriers to achieving glycemic control in the inpatient setting. Chaired by an endocrinologist, the HDTF currently consists of representatives from medicine (endocrinology and hospital medicine), surgery, nursing, diabetes education, nutrition, hospital administration, pharmacy, house staff, and laboratory medicine. The HDTF has been responsible for developing and overseeing the implementation of standardized nursing flow sheets for diabetic patients, order sets for subcutaneous and intravenous insulin administration, protocols for management of hypoglycemia and hyperglycemia, and systems tracking outcomes for quality improvement. The HDTF has also taken the lead in educating physician and nursing staff in the proper use of the new protocols and procedures.
Development of Hypoglycemia Protocol
The task force began with the hypoglycemia policy that was currently in place at the time. Initially developed in 1993, the policy outlined guidelines for the nursing staff to follow in the treatment of hypoglycemia. Over the course of 6 months, the task force revised the policy as well as the hypoglycemia protocol based on the following principles:
Nurse‐initiated orders for treatment of hypoglycemia throughout the hospital.
Standardized treatment for hypoglycemia based on patient type and degree of hypoglycemia.
Availability of glucose tablets, glucagon, and intravenous 50% dextrose (D50%) in easily accessible areas on all units.
Linkage of the hypoglycemia protocol to all insulin orders.
Extensive education of hypoglycemia symptom recognition and treatment.
Linkage of the hypoglycemia protocol to nursing documentation.
Development of carbohydrate counting in the hospital.
The assumption was that a major revision of the hypoglycemia protocol, based on these principles, would ensure better patient safety against hypoglycemic events, especially in light of the intensive medical management of glycemic control. On October 1, 2004, MUSC instituted a nurse‐initiated order for a hospital‐based hypoglycemia protocol to begin treatment for all BG <70 mg/dL. The hypoglycemia protocol became a part of the online adult insulin prescribing system so that when the physician signed the adult online insulin orders, the hypoglycemia protocol was ordered at the same time. Nursing units were stocked with glucose tablets, intramuscular glucagon, and D50% for consistent treatment of hypoglycemia.
Modifications to the hypoglycemia protocol included the following: in July 2006changing to specific aliquots of D50% for treatment of hypoglycemia to avoid overcorrection of low BG; reinforcing the need with the nursing staff to recheck BG 15 minutes after an episode of hypoglycemia; listing of juice as a last form of treatment for hypoglycemia; and in May 2007instituting a hypoglycemia prevention policy along with a hypoglycemia treatment policy (see Table 1 for hypoglycemia treatment protocol).
| Patient Characteristics | Action To Be Taken |
|---|---|
| |
| The patient is unable to eat or swallow safely | Administer dextrose 50% by intravenous push as follows: |
| The patient is NPO | 15 mL (7.5 g) for BG 6069 mg/dL |
| OR | 20 mL (10 g) for BG 5059 mg/dL |
| The patient is unconscious | 25 mL (12.5 g) for BG 3049 mg/dL |
| AND | 30 mL (15 g) for BG <30 mg/dL |
| The patient has intravenous access | Assess unconscious patient for adequate airway, breathing, and circulation |
| If possible place patient in a lateral recumbent position to decrease aspiration | |
| Place patient on seizure precautions | |
| Recheck BG every 15 minutes and repeat treatment until BG is greater than 70 mg/dL | |
| The patient is unable to eat or swallow safely | Administer 1 mg glucagon intramuscularly |
| The patient is NPO | Assess patient for adequate airway, breathing, and circulation |
| OR | Place patient in a lateral recumbent position to decrease aspiration |
| The patient is unconscious | Place patient on seizure precautions |
| AND | Establish intravenous access |
| The patient does not have intravenous access | Recheck BG and consciousness every 5 minutes and repeat treatment until BG is greater than 70 and patient is awake |
| The patient is able to eat and swallow safely | Feed with 15 grams of carbohydrate in order of preference from the following: |
| OR | Fast Fifteen: 3 glucose tablets |
| The patient has a patent nasogastric tube | 1 tablespoon of sugar (3 packets) |
| 4 oz (120 mL) of regular soda | |
| 4 oz (120 mL) of juice | |
| Recheck BG in 15 minutes and repeat treatment until BG is greater than 70 mg/dL | |
| It will be necessary to give the patient extra food after blood glucose is greater than 70 mg/dL if hypoglycemia occurs greater than 1 hour from meal or occurs during sleeping hours. Feed the | |
| patient 1 of the following: | |
| 8 oz (1 cup) of whole milk | |
| 6 saltine crackers with 2 tablespoons of peanut butter | |
| 6 saltine crackers with 1 oz. cheese | |
Education of Hospital Personnel
In addition to the development of the hypoglycemia protocol and a nursing flow sheet dedicated specifically to the use of insulinthe insulin Medication Administration Record (MAR) (Supporting Figure 1)a key piece in the implementation strategy was the development of an educational program for the nurses, house staff, and medical personnel about policies and procedures. Many in‐service sessions were conducted to outline the protocols and to troubleshoot any difficulties.9 The key champion for training the nurses was a hospital RN Certified Diabetes Educator (CDE) who was instrumental in obtaining in‐hospital nursing support for the protocols. A series of 30‐minute to 60‐minute in‐service sessions were conducted for nursing staff on each unit before the protocols were launched. To ensure that these in‐services were presented to as many staff as possible, the sessions were repeated at least two times for each shift. An important aspect of the education was the understanding of the different types of insulin and the concepts addressing the ways insulin can be used for maintenance of euglycemia: basal, prandial, and correction.14, 10, 11 This education also included information regarding ADA BG targets, characteristics of an insulin‐deficient patient, defining type 1 and type 2 diabetes, a review about insulin requirements during health and illness, treatment of hypoglycemia, information about insulin products, the concept of carbohydrate counting, and proper documentation of patient treatment.2, 1214
Subcutaneous Insulin Protocol
The protocols for subcutaneous (SC) insulin developed by the HDTF targeted a BG range of 70140 mg/dL on the medical surgical floors (Supporting Figure 2). The forms developed were based on scheduled or programmed insulin, which consists of basal and prandial/nutritional insulin with SC correction‐dose insulin.15 Correction or supplemental insulin is used to treat elevated BGs that occur before meals or between meals. If used at bedtime, the correction insulin is lowered to prevent nocturnal hypoglycemia. Correction‐dose insulin is different from sliding‐scale insulin, which is a predetermined amount of insulin used to treat hyperglycemia without regard to prior insulin administration or timing of food intake.15 When patients are hospitalized, scheduled and correction insulin doses are raised to cover the increased insulin needs of basal, prandial, and nutritional dosing in the hospital settting.3 As routine process of care, oral antihyperglycemic agents were recommended to be stopped at the time of hospital admission.
In January 2006, MUSC instituted a surveillance plan with nursing CDEs who reviewed charts for events of hypoglycemia and hyperglycemia: BG < 60 mg/dL and two BGs >200 mg/dL, respectively. In January 2006, all sliding‐scale insulin protocols were eliminated and replaced with basal, prandial, and correction insulin protocols. In July 2006, MUSC eliminated SC regular insulin use and replaced it with SC analog insulin use, except for a rare patient exception.
To reduce insulin errors, our hospital formulary was restricted to the following insulin use: SC glargine, SC neutral protamine hagedorn (NPH), SC aspartame, and intravenous (IV) regular (Table 2 shows the time line for hospital upgrades, with dates).
| Date | Intervention |
|---|---|
| September 2003 | Formation of HDTF |
| October 2004 | Initiation of hypoglycemia protocol: MD standing order for nurse‐driven hypoglycemia protocol |
| January‐May 2005 | Intensive nursing education: how to Rx hypoglycemia, nursing flow sheet (insulin MAR), patient education record, CHO counting, insulin concepts |
| October 2005 | Began using IVIIC in CT Surgery |
| January 2006 | Surveillance plan with CDE chart checks: hypoglycemia <60 mg/dL and hyperglycemia two BGs >200 mg/dL |
| January 2006 | All sliding‐scale insulin protocols eliminated and replaced with preprinted protocols basal dose based on body weight, prandial dose based on body weight, and correction dose based on total daily dose of insulin |
| February 2006 | All adult ICUs using IVIIC with BG checks q 2‐4 hour |
| June 2006 | Stress need to use juice last in Rx hypoglycemia, so not to over treat patients |
| July 2006 | Use aliquots D50 to Rx different severities of hypoglycemia |
| July 2006 | Elimination of SC regular insulin and replace it with SC insulin analog use. Hospital formulary restricted to: SC glargine, SC NPH, SC aspart, and IV regular insulin |
| July 2006 | Increase frequency BG checks while using IVIIC: check BG q1 hour |
| July 2006 | Eliminate SC Novolin 70/30 from hospital formulary and replace with SC Novolog 70/30 |
| September 2006 | Implement insulin pump initiation/orders |
| May 2007 | Institute hypoglycemia prevention policy along with hypoglycemia treatment policy |
| June 2007 | Stress difference between juices: apple/orange juice: 15 g; and prune, cranberry, grape juice: 23 g |
Intravenous Insulin Protocol
The HDTF initially reviewed 15 evidence‐based protocols and identified 5 desirable protocol characteristics. These characteristics included easy physician ordering (requiring only a signature), ability to quickly reach and maintain a BG target range, minimal risk for hypoglycemic events, adaptability for use anywhere in the hospital setting, and acceptance and implementation by nursing staff.16
The IV protocol, a web‐based calculator (Figure 1), was developed based on the concept of the multiplier by White et al.17 For this protocol, the IV infusion (IVI) rate is changed based on a formula that uses a multiplier (a surrogate for insulin sensitivity factor) and the difference between measured BG and target blood glucose (TBG). The calculator uses the following mathematical formula: rate of insulin infusion/hour = (current BG 60 mg/dL) 0.03.18, 19 Additionally, the protocol requires that enough insulin be infused to address severe hyperglycemia at initiation with a rapid reduction in the insulin infusion rate as BG normalizes. The protocol also permits an adjustment of the insulin rate by tenths of a unit per hour to maintain the BG in the center of the target range. The main variant of this protocol is the value of the starting multiplier. The web‐based calculator is currently being used in all 6 adult ICUs and on all of the adult medical‐surgical floors at MUSC.
In early 2006, all adult ICUs were using our in‐house, web‐based intravenous insulin infusion calculator (IVIIC), which prompted more BG readings with intensification of insulin drip use.19 Specifically, initial monitoring for the IVIIC included BG readings every 24 hours. To avoid hypoglycemic events from occurring with the intensification of BG readings for the IVIIC, the BG monitoring frequency was increased to every hour in July 2006. Initial treatment for hypoglycemia was D50% (12.525 g), which tended to overcorrect BG. In July 2006, we revised the protocol using aliquots of D50% specific to the BG reading.19 This action has resulted in decreasing the glycemic excursions observed due to overcorrection of hypoglycemia.
BG target ranges to match the level of care are as follows: intensive care unit (80110 mg/dL); labor and delivery (70110 mg/dL); adult medical/surgical floors (80140 mg/dL); diabetic ketoacidosis (DKA)/hyperosmolar nonketotic coma (HHNK) (150200 mg/dL); neurosurgery ICU (90120 mg/dL); and perioperative patients (140180 mg/dL).20 These BG targets were created to satisfy the clinical requests of specific departments at MUSC. We have restricted starting the multiplier for DKA/HHNK at 0.01, to affect a slower rate of change and the multiplier for all others is set at 0.03.
Transition From Intravenous to Subcutaneous Insulin
At MUSC, IV insulin therapy reverts to an SC insulin therapy protocol when the patient resumes PO feedings, discontinues pressor support, or stops volume resuscitation21 (see Supporting Figure 3 for the IV to SC insulin transition form). While preparing to stop IV insulin, SC insulinparticularly basal insulinshould begin at least 23 hours prior to discontinuing IV insulin. A short‐acting or rapid‐acting insulin may be given 12 hours SC prior to stopping IV insulin. This is particularly true for patients who are at risk for ketoacidosis, such as patients with type 1 diabetes.21 Recommendations for scheduled insulin administration include basal and prandial and correction doses of insulin to cover glycemic excursions. A minority of patients with stress hyperglycemia will not require conversion to SC insulin when discontinuing IV insulin therapy; however, BG monitoring and administration of correction insulin is recommended.
Data Collection
A retrospective chart review was approved by the MUSC Institutional Review Board, and the requirement of patient consent was waived. A database query against the hospital's electronic medical record was used to supply the data for this study. In particular, a complete listing of all finger‐stick BG measurements taken during June 2004 (preimplementation), June 2005 (implementation), and June 2006 and 2007 (postimplementation) was used. The sample included all inpatient stays for patients who had a documented history of diabetes or at least 1 BG reading in excess of 180 during the inpatient stay. Finger‐stick BG measurements taken within 50 minutes of another reading were excluded from the analysis to account for the increased testing frequency that occurs, per protocol, after detection of a hypoglycemic or hyperglycemic event. Finger‐stick BG levels were measured by the Abbott Precision PCX and downloaded directly into the university's electronic medical record.
Statistical Analysis and Considerations
Sample size estimation
A preliminary study of hypoglycemic rates in 2004 and 2005 was used to plan this analysis.22 In this preliminary study, 295 of 13,366 BG readings were mildly hypoglycemic before the glycemic protocol, yielding an estimated rate of 22.1 per 1,000 measurements. During the glycemic protocol implementation period (June 2005), an estimated rate per 1,000 measurements of 18.9 (289/15,324) was obtained. Using the binomial approximation to the Poisson, it was estimated that 30,499 additional BG measurements were needed to detect, with 80% power and a type I error rate of 0.05 (two‐sided), a rate ratio as small as 1.17 (22.1 per 1,000/18.9 per 1,000). Based on the number of BG measurements obtained in the preliminary study (14,000/month), two additional months of postintervention data were deemed necessary. Data from June 2006 and June 2007 were used to test the maintenance effects of the implemented glycemic management protocol.
Primary analysis
Mild, moderate, and severe hypoglycemia were defined as BG readings 5069 mg/dL, 4049 mg/dL, and <40 mg/dL, respectively.23 BG readings 250 mg/dL or higher were considered hyperglycemic. These events were summarized by the methods suggested for an inpatient setting.7 The first method treated each BG as an independent observation (i.e., ward‐level analysis for which the denominator was the total number of BG readings). This analysis represents a census, so statistical comparisons are not warranted (i.e., the population parameters are obtained), but the generalizability of the findings is limited accordingly. For the formal analysis of the prevalence of glycemic events by year, the patient‐day analysis was used. For this analysis, data were aggregated by each unique patient‐day. For each patient‐day, descriptive statistics were tabulated on the raw BG readings. For the determination of patient‐day occurrence of hypoglycemic events, the three hypoglycemic severities (mild, moderate, and severe) were treated as ordinal variables such that if a patient had a severe hypoglycemic episode on a given day, he was considered to have also had moderate and mild hypoglycemia for that day. This strategy was undertaken based on the belief that if a person had a worse outcome, then the less severe outcome also occurred during the same patient day.
The primary hypothesis was that the nurse‐driven hypoglycemia protocol implemented by 2005 would result in tighter BG control (lower rates of hyperglycemia and hypoglycemia) after implementation. To test this hypothesis, the patient‐day summary of BG readings was used to estimate the odds of an event for each year. The odds of developing mild (BG 5069 mg/dL), moderate (BG 4049 mg/dL), and severe (BG < 40 mg/dL) hypoglycemic events were compared using generalized estimating equations for correlated binary data.24 This analysis accounted for the clustering of observations (patient‐day summaries) within patient stay by modeling the correlation of outcomes within a patient stay. In addition to hypoglycemia, the proportion of patient days with a mean BG between 70180 mg/dL and the proportion of patients experiencing hyperglycemia (BG 250 mg/dL) was examined, and these results were analyzed using the same methodology used for the hypoglycemia endpoints. All analyses were conducted using SAS version 9.1.3 using the procedure GENMOD, a generalized linear modeling procedure in SAS/STAT.
Results
The baseline demographic characteristics of the four study groups are shown in Table 3. The four groups were found to be similar for gender distribution, mean age, and racial distribution. There were significant differences observed among hospital stay characteristics, insulin drip use, history of diabetes, ventilator support, kidney failure, dialysis, total parenteral nutrition (TPN), and red blood cell (RBC) transfusions. Overall, insulin drip use tended to increase over time. The percentage of patients with diabetes on admission or diagnosed during admission tended to decrease over time. This was likely due to an increase in the diagnosis and treatment of stress/steroid‐induced hyperglycemia during the hospital stay.
| Variable | All Years Combined (n = 2102)* | 2004 (n = 434) | 2005 (n = 486) | 2006 (n = 609) | 2007 (n = 573) | P value |
|---|---|---|---|---|---|---|
| ||||||
| Sex, male n (%) | 959 (45.6) | 186 (42.9) | 214 (44.0) | 292 (48.0) | 267 (46.6) | 0.34 |
| Age (years), mean (SD) | 56.8 | 57.6 (14.8) | 58.0 (15.8) | 56.7 (16.1) | 55.4 (16.4) | 0.092 |
| Race | ||||||
| Caucasian | 1000 (47.6%) | 202 (46.5%) | 217 (44.7%) | 300 (49.3%) | 281 (49.0%) | 0.64 |
| African American | 1059 (50.4%) | 226 (52.1%) | 255 (52.5%) | 299 (49.1%) | 279 (48.7%) | |
| Hispanic | 26 (1.2%) | 4 (0.9%) | 8 (1.6%) | 5 (0.8%) | 9 (1.6%) | |
| Other | 17 (0.8%) | 2 (0.5%) | 6 (1.2%) | 5 (0.8%) | 4 (0.7%) | |
| Hospital stay characteristics n (%) | ||||||
| Floor only | 1630 (77.6%) | 355 (81.8)% | 389 (80.0%) | 430 (70.6%) | 456 (79.6%) | <0.001 |
| ICU only | 57 (2.7%) | 8 (1.8%) | 6 (1.2%) | 27 (4.4%) | 16 (2.8%) | |
| Floor and ICU | 415 (19.7%) | 71 (16.4%) | 91 (18.7%) | 152 (25.0%) | 101 (17.6%) | |
| Clinical characteristics n (%) | ||||||
| Insulin drip, floor and ICU | 306 (14.6%) | 38 (8.8%) | 52 (10.7%) | 106 (17.4%) | 110 (19.2%) | <0.001 |
| Insulin drip, floor patients only | 70 (4.3%) | 4 (1.1%) | 9 (2.3%) | 22 (5.1%) | 35 (7.7%) | <0.001 |
| History of diabetes | 1677 (79.8%) | 392 (90.3%) | 431 (88.7%) | 442 (72.6%) | 412 (71.9%) | <0.001 |
| Ventilator support | 319 (15.2%) | 44 (10.1%) | 64 (13.2%) | 135 (22.2%) | 76 (13.3%) | <0.001 |
| Kidney failure | 250 (11.9%) | 41 (9.5%) | 52 (10.7%) | 95 (15.6%) | 62 (10.8%) | 0.008 |
| Dialysis | 94 (4.5%) | 21 (4.8%) | 18 (3.7%) | 38 (6.2%) | 17 (3.0%) | 0.040 |
| Total parenteral nutrition | 128 (6.1%) | 27 (6.2%) | 18 (3.7%) | 55 (9.0%) | 28 (4.9%) | 0.001 |
| Red blood cell transfusions | 507 (24.1%) | 96 (22.1%) | 107 (22.0%) | 178 (29.2%) | 126 (22.0%) | 0.007 |
A total of 11,715 patient‐days, consisting of 56,401 individual BG readings obtained from 2,215 unique patients, were distributed across the 4 years. Table 4 presents the year‐specific patient‐day analysis. While the prevalence of mild (BG 5069 mg/dL) hypoglycemia was found to increase over the years studied (P < 0.01), the percentage of patient‐days with a mean BG in the range of 70180 mg/dL increased over the period of study (P < 0.01). The total hypoglycemia events <60 mg/dL are presented as comparative data to other studies.7 The percent of patient days with at least one BG < 70 mg/dL (reported in Table 4 as mild events) ranged from 3.72 in 2005 to as high as 10.71 in 2007; however, approximately one‐half of the hypoglycemic events are attributable to readings from BG 6069 since the proportion of patient days with a BG < 60 mg/dL was approximately one‐half that for BG < 70 mg/dL (Table 4). The prevalence of patient days with at least one moderate (BG 4049 mg/dL) or severe (BG < 40 mg/dL) hypoglycemia event was not found to increase in a linear manner. There was a statistical trend for potentially nonlinear relationship of year with moderate hypoglycemia and hyperglycemia.
| Year (number of patient days) | Tests of significance* | |||||
|---|---|---|---|---|---|---|
| Measure | 2004 (n = 2176) | 2005 (n = 2259) | 2006 (n = 3525) | 2007 (n = 3755) | Linear trend | Type 3 test |
| ||||||
| BG mean (SD) (mg/dL) | 156 (82) | 152 (72) | 154 (51) | 149 (51) | 0.85 | 0.23 |
| BG median [IQR] (mg/dL) | 136 [105, 186] | 136 [105, 181] | 144 [120, 177] | 137 [114, 169] | N/A | N/A |
| BG readings per patient‐day [mean (SD)] | 3.9 (2.4) | 4.2 (2.9) | 4.9 (3.4) | 5.7 (4.6) | N/A | N/A |
| % Patient‐days with mean BG in range (70‐180 mg/dL) | 69.53 | 72.82 | 76.68 | 79.79 | <0.01 | <0.01 |
| % BGs <60 mg/dL | 3.31 | 1.90 | 5.36 | 5.27 | <0.01 | <0.01 |
| % Mild hypoglycemia (50‐69 mg/dL) | 6.20 | 3.72 | 10.24 | 10.71 | <0.01 | <0.01 |
| % Moderate hypoglycemia (40‐49 mg/dL) | 1.88 | 0.84 | 2.75 | 2.08 | 0.15 | <0.01 |
| % Severe hypoglycemia (<40 mg/dL) | 0.69 | 0.44 | 0.96 | 0.75 | 0.49 | 0.37 |
| % Hyperglycemia (250 mg/dL) | 14.71 | 11.73 | 16.85 | 15.15 | 0.23 | 0.02 |
Immediately following the implementation (year 2005), post hoc comparisons suggested that the rate of moderate hypoglycemia was lowest relative to the 3 other years, but no other statistical differences were observed. The year 2005 also had the lowest proportion of patient days with at least 1 hyperglycemic event.
The individual BG readings for the 2215 unique patients were also individually analyzed according to the methods of Goldberg et al.7 Even though no statistical tests were performed at the ward level, the descriptive data presented in Table 5 are consistent with the analysis of the patient‐day data. Several important features of the data are illustrated by Table 5. Most notably, the glycemic control at the hospital level is improved. The percentage of BG readings in the range of 70180 mg/dL increased annually whereas the mean BG values, the coefficient of variation, and the interquartile range (IQR) decreased annually.
| Year (number of blood glucose readings) | ||||
|---|---|---|---|---|
| 2004 (n = 8,504) | 2005 (n = 9,396) | 2006 (n = 17,098) | 2007 (n = 21,403) | |
| ||||
| Number of patients | 434 | 486 | 612 | 683 |
| BG mean (SD) (mg/dL) | 156 (85) | 154 (81) | 149 (61) | 138 (57) |
| Coefficient of variation | 0.55 | 0.53 | 0.41 | 0.41 |
| Median BG [IQR] (mg/dL) | 135 [101‐186] | 134 [103‐183] | 136 [108‐176] | 124 [101‐160] |
| % BGs in range (70‐180 mg/dL) | 68.09 | 71.80 | 73.71 | 80.41 |
| % Mild hypoglycemia (50‐69 mg/dL) | 3.35 | 2.01 | 2.57 | 2.30 |
| % Moderate hypoglycemia (40‐49 mg/dL) | 0.95 | 0.29 | 0.47 | 0.26 |
| % Severe hypoglycemia (<40 mg/dL) | 0.67 | 0.36 | 0.24 | 0.15 |
| % Hyperglycemia (250 mg/dL) | 10.23 | 9.08 | 6.43 | 4.83 |
Conclusions
Collectively, we have shown that implementing standardized insulin order sets including hypoglycemia, SC insulin, IV insulin, and IV to SC insulin transition treatment protocols at MUSC may generate the expected benefits for patient safety for this population of patients. The primary hypothesis that the rate of hypoglycemia and hyperglycemia would be lower after the implementation of these protocols was supported by the data, because the overall blood glucose control was markedly improved as a result of the protocols. However, the effect was strongest in 2005 (immediately following the protocol's implementation) and appeared to diminish some with time.
There were several other quality improvement measures initiated at MUSC that likely contributed to the decreasing rates of hypoglycemia and hyperglycemia. For example, comparing June 2004 with June 2007, the number of patients tested increased from 434 to 683. This increase could be attributed, in part, to a trend on medical/surgical services toward an increased focus on glucose monitoring.
When intensive glycemic control programs are implemented, hospitals should have a standardized, nurse‐driven hypoglycemia protocol.11 The success of such a hypoglycemia treatment protocol is demonstrated by the improvement observed at MUSC since the protocol was first implemented in October 2004.22
There are limitations that warrant consideration. A key limitation is that other procedural changes may have occurred during the years of study. Because the initial focus of the HDTF was to reduce hypoglycemic and hyperglycemic events, a multipronged approach was used, beginning with the treatment protocol but followed by other changes. These changes, while unmeasured in the current study, could have influenced the rate of hypoglycemia and hyperglycemia. Therefore, although the protocol that we developed has sound theoretical underpinnings, the improvement in glycemic control at other hospitals may vary. Second, because this was initially regarded as a quality improvement project for hospitalized patients with hypoglycemia and hyperglycemia, we did not evaluate morbidity, mortality, or other clinical outcome data other than BG targets and incidences of hypoglycemia and hyperglycemia. Third, there was no concurrent control group established for this study, rather the study used a retrospective, nonrandomized design with a historical control. As previously mentioned, we cannot rule out the idea that other changes occurred between the preprotocol and postprotocol interval to influence our results. Finally, there are statistical limitations to the research.
One limitation regarding the analysis of the BG data was the potential for an increased type I error (ie, false‐positive result) due to clustering of BG values within a patient and increased monitoring frequencies when a hypoglycemic or hyperglycemic event was observed. The generalized estimating equations directly addressed the first concern. In particular, the effective sample size for each participant was a function of the number of patient‐days and the correlation of patient‐day summaries. Therefore, patients with several highly‐correlated outcomes would contribute less to the analysis than other patients with the same number of patient‐days that were correlated to a lesser extent. As for the second concern, the patient‐day frequencies alleviate this problem and avoid the length‐of‐stay bias associated with a patient‐level (or patient‐stay) analysis. Power was less than planned due in part to the use of the patient‐day analysis instead of the originally designed ward‐level analysis. The change in the statistical design was a response to emerging evidence in the literature.7
In conclusion, the hypothesis that MUSC patients benefit from the use of standardized insulin order sets, hypoglycemia, and hyperglycemia treatment protocols, is supported by the data collected in this study. Because it has been recommended that a hypoglycemia and hyperglycemia prevention protocol as well as a hypoglycemia and hyperglycemia treatment protocol be in place, the HDTF will be focusing on the actual prevention of the hypoglycemic and hyperglycemic incidents occurring in the first place.2, 25 This may result in further reductions of hypoglycemic and hyperglycemic events. We have recently implemented hypoglycemia and hyperglycemia prevention policies at MUSC.
- Ace ADA Task Force on Inpatient Diabetes.American College of Endocrinology and American Diabetes Association Consensus Statement on Inpatient Diabetes and Glycemic Control.Endocr Pract.2006;12(4):458–468.
- ADA Writing Group.Standards of Medical Care in Diabetes—2008.Diabetes Care.2008;31(suppl 1):S12–S54.
- ,,, et al.Management of diabetes and hyperglycemia in hospitals.Diabetes Care.2004;27(2):553–591.
- ,,, et al.American College of Endocrinology Position Statement on Inpatient Diabetes and Metabolic Control.Endocr Pract.2004;10(suppl 2):4–9.
- ,,, et al.Intensive insulin therapy in the critically ill patients.N Engl J Med.2001;345:1359–1367.
- ,,, et al.Intensive insulin therapy in the medical ICU.N Engl J Med.2006;354(5):449–461.
- ,,, et al.“Glucometrics”: assessing the quality of inpatient glucose management.Diabetes Technol Ther.2006;8(5):560–569.
- .Society of Hospital Medicine Glycemic Control Task Force, Track Performance; Introducing Glucometrics. SHM;2007.
- ,,,.New insulin infusion protocol improves blood glucose control in hospitalized patients without increasing hypoglycemia.Jt Comm J Qual Patient Saf.2005;31(3):141–147.
- ,.The new insulin analogs: using a team approach to implement basal‐bolus insulin therapy.Pract Diabetol.2004; June:28–37.
- ,,.Practical Management of Inpatient Hyperglycemia.Lakeville, CT:Hilliard Publishing, LLC;2005.
- ,,.Hypoglycemia in hospitalized patients. causes and outcomes.N Engl J Med.1986;315(20):1245–1250.
- .Acute hypoglycemia: keeping the bottom from falling out.Nursing.1995;25(2):41–48; quiz 50.
- ,.Myths and facts about diabetic hypoglycemia.Nursing.1994;24(6):67.
- ,.Subcutaneous insulin therapy in the hospital setting: issues, concerns, and implementation.Endocr Pract.2004;10(suppl 2):81–88.
- ,,.Glucommander: a computer‐directed intravenous insulin system shown to be safe, simple, and effective in 120,618 h of operation.Diabetes Care.2005;28(10):2418–2423.
- ,,.Practical closed‐loop insulin delivery. a system for the maintenance of overnight euglycemia and the calculation of basal insulin requirements in insulin‐dependent diabetics.Ann Intern Med.1982;97:210–213.
- .Strategies for controlling glucose in the intensive care unit.Clin Pulmon Med.2006;13(6):332–347.
- ,,, et al.Outcomes of a cardiothoracic intensive care web‐based online intravenous insulin infusion calculator study at a medical university hospital.Diabetes Technol Ther.2007;9(6):523–534.
- ,,,.Outcomes of a nursing in‐service to evaluate acceptance of a web‐based insulin infusion calculator.J Diabetes Sci Technol.2008;2(3):376–383.
- ,,,.Intravenous insulin infusion therapy: indications, methods, and transition to subcutaneous insulin therapy.Endocr Pract.2004;10(suppl 2):71–80.
- ,,, et al.Outcomes of a hypoglycemia treatment protocol in a medical university hospital [Abstract].Diabetes.2006;55:203OR.
- ,,,,.Evolution of a diabetes inpatient safety committee.Endocr Pract.2006;12(suppl 3):91–99.
- ,.Longitudinal data analysis for discrete and continuous outcomes.Biometrics.1986;42(1):121–130.
- ,,, et al.Hospital hypoglycemia: not only treatment but also prevention.Endocr Pract.2004;10(suppl 2):89–99.
Copyright © 2009 Society of Hospital Medicine