User login
Comorbidity Coding and Its Impact on Hospital Complexity: Reply
Authors' Response
We agree with the valid comments made by Dr. Kerguelen and will respond to each set of questions in order.
Regarding the first set of questions on how we knew that our CMI was low and our patient acuity was under- represented, the University of Miami Health System is a designated cancer center with a Prospective Payment System exempt model (PPS exempt), and is one of 11 hospitals in the United States excluded for payment under the Inpatient Prospective Payment System. We know, therefore, that we care for a very complex patient population. Additionally, we benchmark ourselves against other academic medical centers (AMCs) with similarly complex patients and had noted that our patients appeared “less complex.” Specifically, our baseline CMI was 1.77 in early 2018 compared with an overall higher CMI for the AMC cohort; also, the total number of diagnoses we captured was lower than that in other AMCs. These 2 facts together alerted us that we likely had coding and clinical documentation improvement (CDI) opportunities. We recognized that our complexity was not being captured both because the clinical information was not documented in a manner readily translatable to ICD-10 codes and codes were missed when the documentation did exist. To remedy these problems, we implemented multiple immediate “fixes,” which included revamping our CDI efforts, re-education, and enhancements to our electronic health record for providers, CDIs, and coders. Since publication of our article, our CMI has continued to increase month over month, up to 2.57 most recently in May 2022, as we have continued to focus on several additional initiatives to impact both better documentation and coding.
The second set of questions asked whether the perceived low CMI was causing problems with payers and about the risk of artificially increasing the CMI through overdiagnosis as well as audit mechanisms to avoid this, and changes in expected mortality and observed mortality. To our knowledge, the lower CMI did not cause any problems with payers, but this is something we are currently tracking. Coding and documentation are constantly audited both internally (by our quality department) and externally (using Inter-Rater Reliability audits and validation), with no noted trend or targeted opportunities. We only include comorbidities that are current, actively monitored/managed, and pertinent to the care of our patients. We have not noted a change in denials, which gives us confidence we are not now overdiagnosing.
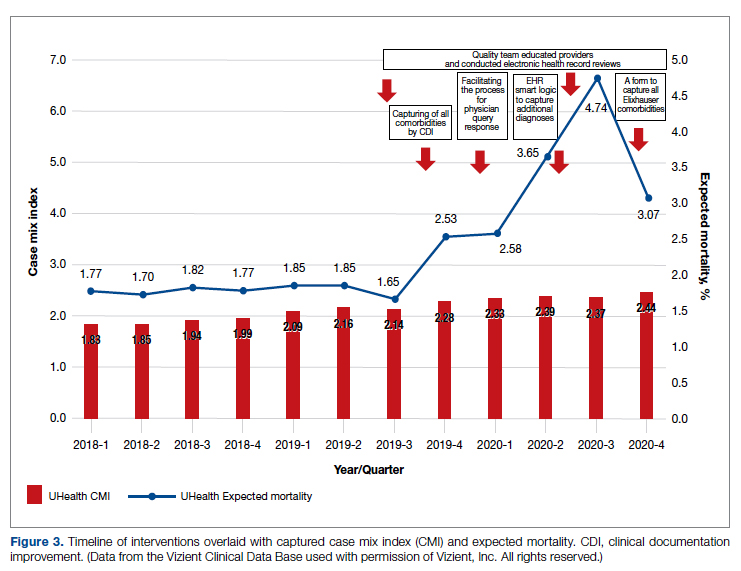
Our observed mortality has also increased. We, like all institutions, experienced the confounding factor of the COVID-19 pandemic, which coincided with the higher observed mortality over the course of the past 2 years. While the observed mortality (indicating sicker patients assuming no worsening of care processes) may partly explain our increased coding complexity, our decreasing mortality index (observed:expected mortality) suggests that our efforts to improve documentation and coding likely reflect improved capture of missed complexity (Figure).

We understand the concerns raised by Dr. Kerguelen about potential mis(over)coding. As part of this quality initiative, therefore, we plan long-term evaluations of our processes and metrics to better determine and guide our understanding of the impact of what we have already implemented and future interventions. In fact, we are in the process of analyzing additional interventions and hope to share results from these evaluations soon.
Marie Anne Sosa, MD
Tanira Ferreira, MD
Hayley Gershengorn, MD
Melissa Soto
Estin Kelly
Ameena Shrestha
Julianne Burgos
Sandeep Devabhaktuni
Dipen Parekh, MD
Maritza Suarez, MD
University of Miami Hospital and Clinics, Miami, FL
mxs2157@med.miami.edu
Disclosures: None reported.
Authors' Response
We agree with the valid comments made by Dr. Kerguelen and will respond to each set of questions in order.
Regarding the first set of questions on how we knew that our CMI was low and our patient acuity was under- represented, the University of Miami Health System is a designated cancer center with a Prospective Payment System exempt model (PPS exempt), and is one of 11 hospitals in the United States excluded for payment under the Inpatient Prospective Payment System. We know, therefore, that we care for a very complex patient population. Additionally, we benchmark ourselves against other academic medical centers (AMCs) with similarly complex patients and had noted that our patients appeared “less complex.” Specifically, our baseline CMI was 1.77 in early 2018 compared with an overall higher CMI for the AMC cohort; also, the total number of diagnoses we captured was lower than that in other AMCs. These 2 facts together alerted us that we likely had coding and clinical documentation improvement (CDI) opportunities. We recognized that our complexity was not being captured both because the clinical information was not documented in a manner readily translatable to ICD-10 codes and codes were missed when the documentation did exist. To remedy these problems, we implemented multiple immediate “fixes,” which included revamping our CDI efforts, re-education, and enhancements to our electronic health record for providers, CDIs, and coders. Since publication of our article, our CMI has continued to increase month over month, up to 2.57 most recently in May 2022, as we have continued to focus on several additional initiatives to impact both better documentation and coding.
The second set of questions asked whether the perceived low CMI was causing problems with payers and about the risk of artificially increasing the CMI through overdiagnosis as well as audit mechanisms to avoid this, and changes in expected mortality and observed mortality. To our knowledge, the lower CMI did not cause any problems with payers, but this is something we are currently tracking. Coding and documentation are constantly audited both internally (by our quality department) and externally (using Inter-Rater Reliability audits and validation), with no noted trend or targeted opportunities. We only include comorbidities that are current, actively monitored/managed, and pertinent to the care of our patients. We have not noted a change in denials, which gives us confidence we are not now overdiagnosing.
Our observed mortality has also increased. We, like all institutions, experienced the confounding factor of the COVID-19 pandemic, which coincided with the higher observed mortality over the course of the past 2 years. While the observed mortality (indicating sicker patients assuming no worsening of care processes) may partly explain our increased coding complexity, our decreasing mortality index (observed:expected mortality) suggests that our efforts to improve documentation and coding likely reflect improved capture of missed complexity (Figure).
We understand the concerns raised by Dr. Kerguelen about potential mis(over)coding. As part of this quality initiative, therefore, we plan long-term evaluations of our processes and metrics to better determine and guide our understanding of the impact of what we have already implemented and future interventions. In fact, we are in the process of analyzing additional interventions and hope to share results from these evaluations soon.
Marie Anne Sosa, MD
Tanira Ferreira, MD
Hayley Gershengorn, MD
Melissa Soto
Estin Kelly
Ameena Shrestha
Julianne Burgos
Sandeep Devabhaktuni
Dipen Parekh, MD
Maritza Suarez, MD
University of Miami Hospital and Clinics, Miami, FL
mxs2157@med.miami.edu
Disclosures: None reported.
Improving Hospital Metrics Through the Implementation of a Comorbidity Capture Tool and Other Quality Initiatives
From the University of Miami Miller School of Medicine (Drs. Sosa, Ferreira, Gershengorn, Soto, Parekh, and Suarez), and the Quality Department of the University of Miami Hospital and Clinics (Estin Kelly, Ameena Shrestha, Julianne Burgos, and Sandeep Devabhaktuni), Miami, FL.
Abstract
Background: Case mix index (CMI) and expected mortality are determined based on comorbidities. Improving documentation and coding can impact performance indicators. During and prior to 2018, our patient acuity was under-represented, with low expected mortality and CMI. Those metrics motivated our quality team to develop the quality initiatives reported here.
Objectives: We sought to assess the impact of quality initiatives on number of comorbidities, diagnoses, CMI, and expected mortality at the University of Miami Health System.
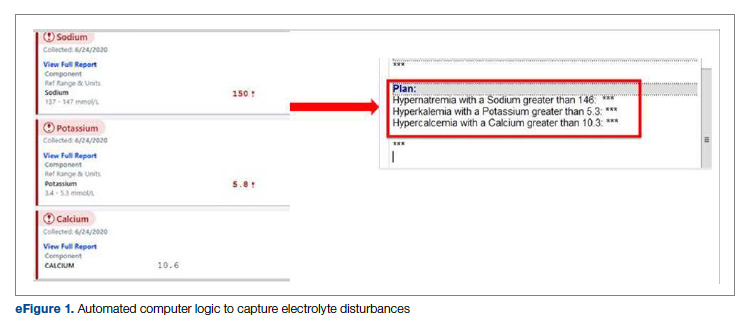
Design: We conducted an observational study of a series of quality initiatives: (1) education of clinical documentation specialists (CDS) to capture comorbidities (10/2019); (2) facilitating the process for physician query response (2/2020); (3) implementation of computer logic to capture electrolyte disturbances and renal dysfunction (8/2020); (4) development of a tool to capture Elixhauser comorbidities (11/2020); and (5) provider education and electronic health record reviews by the quality team.
Setting and participants: All admissions during 2019 and 2020 at University of Miami Health System. The health system includes 2 academic inpatient facilities, a 560-bed tertiary hospital, and a 40-bed cancer facility. Our hospital is 1 of the 11 PPS-Exempt Cancer Hospitals and is the South Florida’s only NCI-Designated Cancer Center.
Conclusion:
Keywords: PS/QI, coding, case mix index, comorbidities, mortality.
Adoption of comprehensive electronic health record (EHR) systems by US hospitals, defined as an EHR capable of meeting all core meaningful-use metrics including evaluation and tracking of quality metrics, has been steadily increasing.3,4 Many institutions have looked to EHR system transitions as an inflection point to expand clinical documentation improvement (CDI) efforts. Over the past several years, our institution, an academic medical center, has endeavored to fully transition to a comprehensive EHR system (Epic from Epic Systems Corporation). Part of the purpose of this transition was to help study and improve outcomes, reduce readmissions, improve quality of care, and meet performance indicators.
Prior to 2019, our hospital’s patient acuity was low, with a CMI consistently below 2, ranging from 1.81 to 1.99, and an expected mortality consistently below 1.9%, ranging from 1.65% to 1.85%. Our concern that these values underestimated the real severity of illness of our patient population prompted the development of a quality improvement plan. In this report, we describe the processes we undertook to improve documentation and coding of comorbid illness, and report on the impact of these initiatives on performance indicators. We hypothesized that our initiatives would have a significant impact on our ability to capture patient complexity, and thus impact our CMI and expected mortality.
Methods
In the fall of 2019, we embarked on a multifaceted quality improvement project aimed at improving comorbidity capture for patients hospitalized at our institution. The health system includes 2 academic inpatient facilities, a 560-bed tertiary hospital and a 40-bed cancer facility. Since September 2017, we have used Epic as our EHR. In August 2019, we started working with Vizient Clinical Data Base5 to allow benchmarking with peer institutions. We assessed the impact of this initiative with a pre/post study design.
Quality Initiatives
This quality improvement project consisted of a series of 5 targeted interventions coupled with continuous monitoring and education.
1. Comorbidity coding. In October 2019, we met with the clinical documentation specialists (CDS) and the coding team to educate them on the value of coding all comorbidities that have an impact on
2. Physician query. In October 2019, we modified the process for physician query response, allowing physicians to answer queries in the EHR through a reply tool incorporated into the query and accept answers in the body of the Epic message as an active part of the EHR.
3. EHR logic. In August 2020, we developed an EHR smart logic to automatically capture fluid and electrolyte disturbances and renal dysfunction, based on the most recent laboratory values. The logic automatically populated potentially appropriate diagnoses in the assessment and plan of provider notes, which require provider acknowledgment and which providers are able to modify
4. Comorbidity capture tool. In November 2020, we developed a standardized tool to allow providers to easily capture Elixhauser comorbidities (eFigure 2). The Elixhauser index is a method for measuring comorbidities based on International Classification of Diseases, Ninth Revision, Clinical Modification and International Classification of Disease, Tenth Revision diagnosis codes found in administrative data1-6 and is used by US News & World Report and Vizient to assess comorbidity burden. Our tool automatically captures diagnoses recorded in previous documentation and allows providers to easily provide the management plan for each; this information is automatically pulled into the provider note.
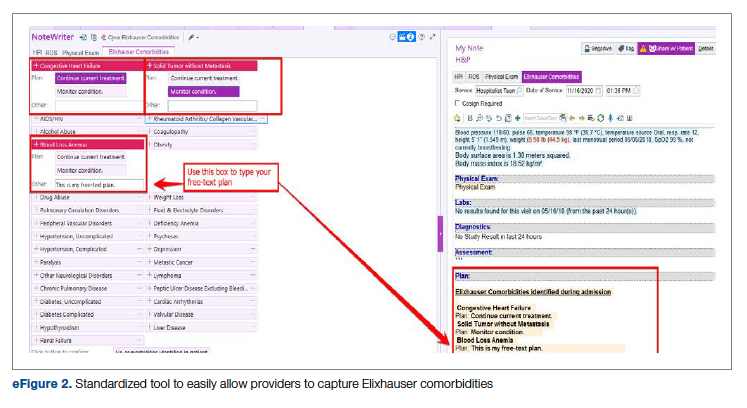
The development of this tool used an existing functionality within the Epic EHR called SmartForms, SmartData Elements, and SmartLinks. The only cost of tool development was the time invested—124 hours inclusive of 4 hours of staff education. Specifically, a panel of experts (including physicians of different specialties, an analyst, and representatives from the quality office) met weekly for 30 minutes per week over 5 weeks to agree on specific clinical criteria and guide the EHR build analyst. Individual panel members confirmed and validated design requirements (in 15 hours over 5 weeks). Our senior clinical analyst II dedicated 80 hours to actual build time, 15 hours to design time, and 25 hours to tailor the function to our institution’s workflow. This tool was introduced in November 2020; completion was optional at the time of hospital admission but mandatory at discharge to ensure compliance.
5. Quality team
Assessment of Quality Initiatives’ Impact
Data on the number of comorbidities and performance indicators were obtained retrospectively. The data included all hospital admissions from 2019 and 2020 divided into 2 periods: pre-intervention from January 1, 2019 through September 30, 2019, and intervention from October 1, 2019 through December 31, 2020. The primary outcome of this observational study was the rate of comorbidity capture during the intervention period. Comorbidity capture was assessed using the Vizient Clinical Data Base (CDB) health care performance tool.5 Vizient CDB uses the Agency for Healthcare Research and Quality Elixhauser index, which includes 29 of the initial 31 comorbidities described by Elixhauser,6 as it combines hypertension with and without complications into one. We secondarily aimed to examine the impact of the quality improvement initiatives on several institutional-level performance indicators, including total number of diagnoses, comorbidities or complications (CC), major comorbidities or complications (MCC), CMI, and expected mortality.
Case mix index is the average Medicare Severity-DRG (MS-DRG) weighted across all hospital discharges (appropriate to their discharge date). The expected mortality represents the average expected number of deaths based on diagnosed conditions, age, and gender within the same time frame, and it is based on coded diagnosis; we obtained the mortality index by dividing the observed mortality by the expected mortality. The Vizient CDB Mortality Risk Adjustment Model was used to assign an expected mortality (0%-100%) to each case based on factors such as demographics, admission type, diagnoses, and procedures.
Standard statistics were used to measure the outcomes. We used Excel to compare pre-intervention and intervention period characteristics and outcomes, using t-testing for continuous variables and Chi-square testing for categorial outcomes. P values <0.05 were considered statistically significant.
The study was reviewed by the institutional review board (IRB) of our institution (IRB ID: 20210070). The IRB determined that the proposed activity was not research involving human subjects, as defined by the Department of Health and Human Services and US Food and Drug Administration regulations, and that IRB review and approval by the organization were not required.
Results
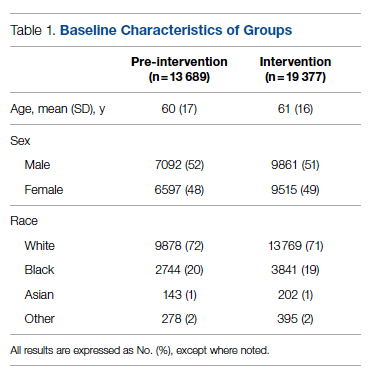
The health system had a total of 33 066 admissions during the study period—13 689 pre-intervention (January 1, 2019 through September 30, 2019) and 19,377 during the intervention period (October 1, 2019 to December 31, 2020). Demographics were similar among the pre-intervention and intervention periods: mean age was 60 years and 61 years, 52% and 51% of patients were male, 72% and 71% were White, and 20% and 19% were Black, respectively (Table 1).
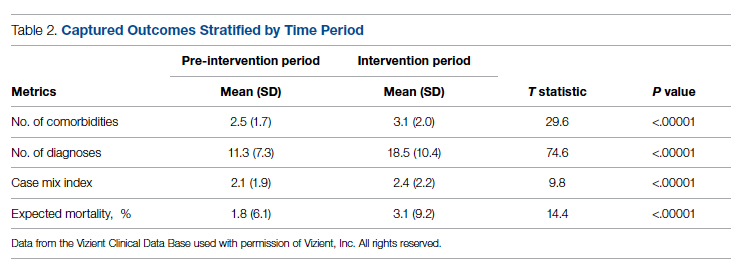
The multifaceted intervention resulted in a significant improvement in the primary outcome: mean comorbidity capture increased from 2.5 (SD, 1.7) before the intervention to 3.1 (SD, 2.0) during the intervention (P < .00001). Secondary outcomes also improved. The mean number of secondary diagnoses for admissions increased from 11.3 (SD, 7.3) prior to the intervention to 18.5 (SD, 10.4) (P < .00001) during the intervention period. The mean CMI increased from 2.1 (SD, 1.9) to 2.4 (SD, 2.2) post intervention (P < .00001), an increase during the intervention period of 14%. The expected mortality increased from 1.8% (SD, 6.1%) to 3.1% (SD, 9.2%) after the intervention (P < .00001) (Table 2).
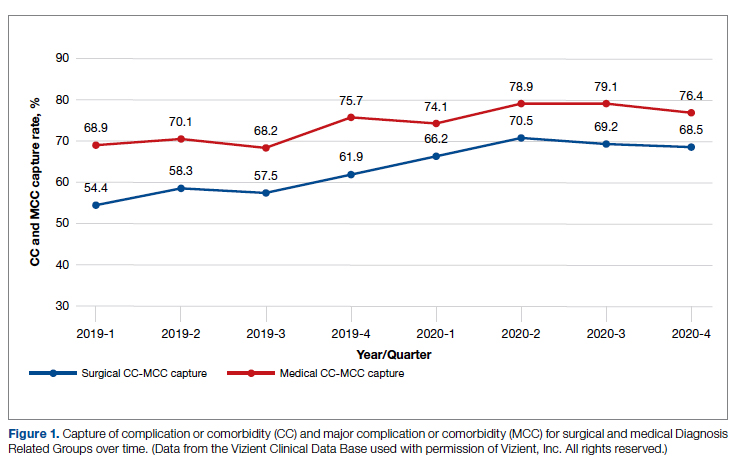
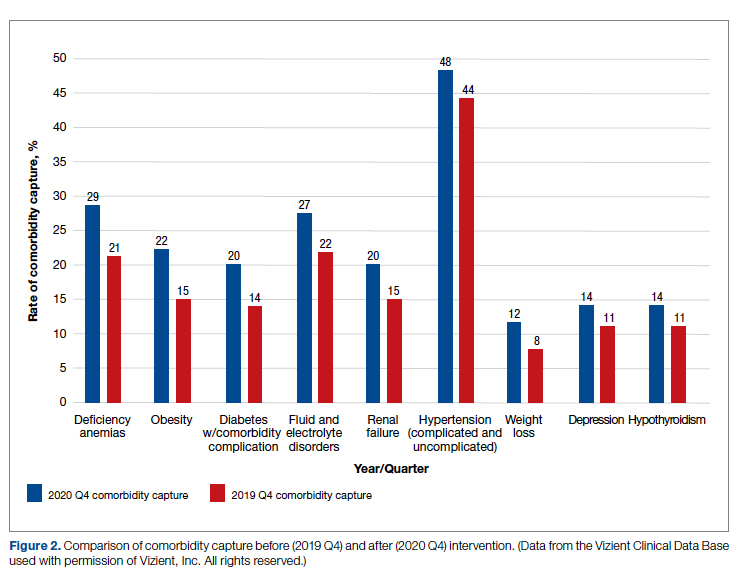
There was an overall observed improvement in percentage of discharges with documented CC and MCC for both surgical and medical specialties. Both CC and MCC increased for surgical specialties, from 54.4% to 68.5%, and for medical specialties, from 68.9% to 76.4%. (Figure 1). The diagnoses that were captured more consistently included deficiency anemia, obesity, diabetes with complications, fluid and electrolyte disorders and renal failure, hypertension, weight loss, depression, and hypothyroidism (Figure 2).
During the 9-month pre-intervention period (January 1 through September 30, 2019), there were 2795 queries, with an agreed volume of 1823; the agreement rate was 65% and the average provider turnaround time was 12.53 days. In the 15-month postintervention period, there were 10 216 queries, with an agreed volume of 6802 at 66%. We created a policy to encourage responses no later than 10 days after the query, and our average turnaround time decreased by more than 50% to 5.86 days. The average number of monthly queries increased by 55%, from an average of 311 monthly queries in the pre-intervention period to an average of 681 per month in the postintervention period. The more common queries that had an impact on CMI included sepsis, antineoplastic chemotherapy–induced pancytopenia, acute posthemorrhagic anemia, malnutrition, hyponatremia, and metabolic encephalopathy.
Discussion
The need for accurate documentation by physicians has been recognized for many years.7
With the growing complexity of the documentation and coding process, it is difficult for clinicians to keep up with the terminology required by the Centers for Medicare and Medicaid Services (CMS). Several different methods to improve documentation have been proposed. Prior interventions to standardize documentation templates in the trauma service have shown improvement in CMI.8 An educational program on coding for internal medicine that included a lecture series and creation of a laminated pocket card listing common CMS diagnoses, CC, and MCC has been implemented, with an improvement in the capture rate of CC and MCC from 42% to 48% and an impact on expected mortality.9 This program resulted in a 30% decrease in the median quarterly mortality index and an increase in CMI from 1.27 to 1.36.
Our results show that there was an increase in comorbidities documentation of admitted patients after all interventions were implemented, more accurately reflecting the complexity of our patient population in a tertiary care academic medical center. Our CMI increased by 14% during the intervention period. The estimated CMI dollar impact increased by 75% from the pre-intervention period (adjusted for PPS-exempt hospital). The hospital-expected mortality increased from 1.77 to 3.07 (peak at 4.74 during third quarter of 2020) during the implementation period, which is a key driver of quality rankings for national outcomes reporting services such as US News & World Report.
There was increased physician satisfaction as a result of the change of functionality of the query response system, and no additional monetary provider incentive for complete documentation was allocated, apart from education and 1:1 support that improved physician engagement. Our next steps include the implementation of an advanced program to concurrently and automatically capture and nudge providers to respond and complete their documentation in real time.
Limitations
The limitations of our study include those inherent to a retrospective review and are associative and observational in nature. Although we used expected mortality and CMI as a surrogate for patient acuity for comparison, there was no way to control for actual changes in patient acuity that contributed to the increase in CMI, although we believe that the population we served and the services provided and their structure did not change significantly during the intervention period. Additionally, the observed increase in CMI during the implementation period may be a result of described variabilities in CMI and would be better studied over a longer period. Also, during the year of our interventions, 2020, we were affected by the COVID-19 pandemic. Patients with COVID-19 are known to carry a lower-than-expected mortality, and that could have had a negative impact on our results. In fact, we did observe a decrease in our expected mortality during the last quarter of 2020, which correlated with one of our regional peaks for COVID-19, and that could be a confounding factor. While the described intervention process is potentially applicable to multiple EHR systems, the exact form to capture the Elixhauser comorbidities was built into the Epic EHR, limiting external applicability of this tool to other EHR software.
Conclusion
A continuous comprehensive series of interventions substantially increased our patient acuity scores. The increased scores have implications for reimbursement and quality comparisons for hospitals and physicians. Our institution can now be stratified more accurately with our peers and other hospitals. Accurate medical record documentation has become increasingly important, but also increasingly complex. Leveraging the EHR through quality initiatives that facilitate the workflow for providers can have an impact on documentation, coding, and ultimately risk-adjusted outcomes data that influence institutional reputation.
Corresponding author: Marie Anne Sosa, MD; 1120 NW 14th St., Suite 809, Miami, FL, 33134; mxs2157@med.miami.edu
Disclosures: None reported.
doi:10.12788/jcom.0088
1. Elixhauser A, Steiner C, Harris DR, Coffey RM. Comorbidity measures for use with administrative data. Med Care. 1998;36(1):8-27. doi:10.1097/00005650-199801000-00004.
2. Sehgal AR. The role of reputation in U.S. News & World Report’s rankings of the top 50 American hospitals. Ann Intern Med. 2010;152(8):521-525. doi:10.7326/0003-4819-152-8-201004200-00009
3. Jha AK, DesRoches CM, Campbell EG, et al. Use of electronic health records in U.S. hospitals. N Engl J Med. 2009;360(16):1628-1638. doi:10.1056/NEJMsa0900592.
4. Adler-Milstein J, DesRoches CM, Kralovec, et al. Electronic health record adoption in US hospitals: progress continues, but challenges persist. Health Aff (Millwood). 2015;34(12):2174-2180. doi:10.1377/hlthaff.2015.0992
5. Vizient Clinical Data Base/Resource ManagerTM. Irving, TX: Vizient, Inc.; 2019. Accessed March 10, 2022. https://www.vizientinc.com
6. Moore BJ, White S, Washington R, Coenen N, Elixhauser A. Identifying increased risk of readmission and in-hospital mortality using hospital administrative data: the AHRQ Elixhauser Comorbidity Index. Med Care. 2017;55(7):698-705. doi:10.1097/MLR.0000000000000735
7. Payne T. Improving clinical documentation in an EMR world. Healthc Financ Manage. 2010;64(2):70-74.
8. Barnes SL, Waterman M, Macintyre D, Coughenour J, Kessel J. Impact of standardized trauma documentation to the hospital’s bottom line. Surgery. 2010;148(4):793-797. doi:10.1016/j.surg.2010.07.040
9. Spellberg B, Harrington D, Black S, Sue D, Stringer W, Witt M. Capturing the diagnosis: an internal medicine education program to improve documentation. Am J Med. 2013;126(8):739-743.e1. doi:10.1016/j.amjmed.2012.11.035
From the University of Miami Miller School of Medicine (Drs. Sosa, Ferreira, Gershengorn, Soto, Parekh, and Suarez), and the Quality Department of the University of Miami Hospital and Clinics (Estin Kelly, Ameena Shrestha, Julianne Burgos, and Sandeep Devabhaktuni), Miami, FL.
Abstract
Background: Case mix index (CMI) and expected mortality are determined based on comorbidities. Improving documentation and coding can impact performance indicators. During and prior to 2018, our patient acuity was under-represented, with low expected mortality and CMI. Those metrics motivated our quality team to develop the quality initiatives reported here.
Objectives: We sought to assess the impact of quality initiatives on number of comorbidities, diagnoses, CMI, and expected mortality at the University of Miami Health System.
Design: We conducted an observational study of a series of quality initiatives: (1) education of clinical documentation specialists (CDS) to capture comorbidities (10/2019); (2) facilitating the process for physician query response (2/2020); (3) implementation of computer logic to capture electrolyte disturbances and renal dysfunction (8/2020); (4) development of a tool to capture Elixhauser comorbidities (11/2020); and (5) provider education and electronic health record reviews by the quality team.
Setting and participants: All admissions during 2019 and 2020 at University of Miami Health System. The health system includes 2 academic inpatient facilities, a 560-bed tertiary hospital, and a 40-bed cancer facility. Our hospital is 1 of the 11 PPS-Exempt Cancer Hospitals and is the South Florida’s only NCI-Designated Cancer Center.
Conclusion:
Keywords: PS/QI, coding, case mix index, comorbidities, mortality.
Adoption of comprehensive electronic health record (EHR) systems by US hospitals, defined as an EHR capable of meeting all core meaningful-use metrics including evaluation and tracking of quality metrics, has been steadily increasing.3,4 Many institutions have looked to EHR system transitions as an inflection point to expand clinical documentation improvement (CDI) efforts. Over the past several years, our institution, an academic medical center, has endeavored to fully transition to a comprehensive EHR system (Epic from Epic Systems Corporation). Part of the purpose of this transition was to help study and improve outcomes, reduce readmissions, improve quality of care, and meet performance indicators.
Prior to 2019, our hospital’s patient acuity was low, with a CMI consistently below 2, ranging from 1.81 to 1.99, and an expected mortality consistently below 1.9%, ranging from 1.65% to 1.85%. Our concern that these values underestimated the real severity of illness of our patient population prompted the development of a quality improvement plan. In this report, we describe the processes we undertook to improve documentation and coding of comorbid illness, and report on the impact of these initiatives on performance indicators. We hypothesized that our initiatives would have a significant impact on our ability to capture patient complexity, and thus impact our CMI and expected mortality.
Methods
In the fall of 2019, we embarked on a multifaceted quality improvement project aimed at improving comorbidity capture for patients hospitalized at our institution. The health system includes 2 academic inpatient facilities, a 560-bed tertiary hospital and a 40-bed cancer facility. Since September 2017, we have used Epic as our EHR. In August 2019, we started working with Vizient Clinical Data Base5 to allow benchmarking with peer institutions. We assessed the impact of this initiative with a pre/post study design.
Quality Initiatives
This quality improvement project consisted of a series of 5 targeted interventions coupled with continuous monitoring and education.
1. Comorbidity coding. In October 2019, we met with the clinical documentation specialists (CDS) and the coding team to educate them on the value of coding all comorbidities that have an impact on
2. Physician query. In October 2019, we modified the process for physician query response, allowing physicians to answer queries in the EHR through a reply tool incorporated into the query and accept answers in the body of the Epic message as an active part of the EHR.
3. EHR logic. In August 2020, we developed an EHR smart logic to automatically capture fluid and electrolyte disturbances and renal dysfunction, based on the most recent laboratory values. The logic automatically populated potentially appropriate diagnoses in the assessment and plan of provider notes, which require provider acknowledgment and which providers are able to modify
4. Comorbidity capture tool. In November 2020, we developed a standardized tool to allow providers to easily capture Elixhauser comorbidities (eFigure 2). The Elixhauser index is a method for measuring comorbidities based on International Classification of Diseases, Ninth Revision, Clinical Modification and International Classification of Disease, Tenth Revision diagnosis codes found in administrative data1-6 and is used by US News & World Report and Vizient to assess comorbidity burden. Our tool automatically captures diagnoses recorded in previous documentation and allows providers to easily provide the management plan for each; this information is automatically pulled into the provider note.
The development of this tool used an existing functionality within the Epic EHR called SmartForms, SmartData Elements, and SmartLinks. The only cost of tool development was the time invested—124 hours inclusive of 4 hours of staff education. Specifically, a panel of experts (including physicians of different specialties, an analyst, and representatives from the quality office) met weekly for 30 minutes per week over 5 weeks to agree on specific clinical criteria and guide the EHR build analyst. Individual panel members confirmed and validated design requirements (in 15 hours over 5 weeks). Our senior clinical analyst II dedicated 80 hours to actual build time, 15 hours to design time, and 25 hours to tailor the function to our institution’s workflow. This tool was introduced in November 2020; completion was optional at the time of hospital admission but mandatory at discharge to ensure compliance.
5. Quality team
Assessment of Quality Initiatives’ Impact
Data on the number of comorbidities and performance indicators were obtained retrospectively. The data included all hospital admissions from 2019 and 2020 divided into 2 periods: pre-intervention from January 1, 2019 through September 30, 2019, and intervention from October 1, 2019 through December 31, 2020. The primary outcome of this observational study was the rate of comorbidity capture during the intervention period. Comorbidity capture was assessed using the Vizient Clinical Data Base (CDB) health care performance tool.5 Vizient CDB uses the Agency for Healthcare Research and Quality Elixhauser index, which includes 29 of the initial 31 comorbidities described by Elixhauser,6 as it combines hypertension with and without complications into one. We secondarily aimed to examine the impact of the quality improvement initiatives on several institutional-level performance indicators, including total number of diagnoses, comorbidities or complications (CC), major comorbidities or complications (MCC), CMI, and expected mortality.
Case mix index is the average Medicare Severity-DRG (MS-DRG) weighted across all hospital discharges (appropriate to their discharge date). The expected mortality represents the average expected number of deaths based on diagnosed conditions, age, and gender within the same time frame, and it is based on coded diagnosis; we obtained the mortality index by dividing the observed mortality by the expected mortality. The Vizient CDB Mortality Risk Adjustment Model was used to assign an expected mortality (0%-100%) to each case based on factors such as demographics, admission type, diagnoses, and procedures.
Standard statistics were used to measure the outcomes. We used Excel to compare pre-intervention and intervention period characteristics and outcomes, using t-testing for continuous variables and Chi-square testing for categorial outcomes. P values <0.05 were considered statistically significant.
The study was reviewed by the institutional review board (IRB) of our institution (IRB ID: 20210070). The IRB determined that the proposed activity was not research involving human subjects, as defined by the Department of Health and Human Services and US Food and Drug Administration regulations, and that IRB review and approval by the organization were not required.
Results
The health system had a total of 33 066 admissions during the study period—13 689 pre-intervention (January 1, 2019 through September 30, 2019) and 19,377 during the intervention period (October 1, 2019 to December 31, 2020). Demographics were similar among the pre-intervention and intervention periods: mean age was 60 years and 61 years, 52% and 51% of patients were male, 72% and 71% were White, and 20% and 19% were Black, respectively (Table 1).
The multifaceted intervention resulted in a significant improvement in the primary outcome: mean comorbidity capture increased from 2.5 (SD, 1.7) before the intervention to 3.1 (SD, 2.0) during the intervention (P < .00001). Secondary outcomes also improved. The mean number of secondary diagnoses for admissions increased from 11.3 (SD, 7.3) prior to the intervention to 18.5 (SD, 10.4) (P < .00001) during the intervention period. The mean CMI increased from 2.1 (SD, 1.9) to 2.4 (SD, 2.2) post intervention (P < .00001), an increase during the intervention period of 14%. The expected mortality increased from 1.8% (SD, 6.1%) to 3.1% (SD, 9.2%) after the intervention (P < .00001) (Table 2).
There was an overall observed improvement in percentage of discharges with documented CC and MCC for both surgical and medical specialties. Both CC and MCC increased for surgical specialties, from 54.4% to 68.5%, and for medical specialties, from 68.9% to 76.4%. (Figure 1). The diagnoses that were captured more consistently included deficiency anemia, obesity, diabetes with complications, fluid and electrolyte disorders and renal failure, hypertension, weight loss, depression, and hypothyroidism (Figure 2).
During the 9-month pre-intervention period (January 1 through September 30, 2019), there were 2795 queries, with an agreed volume of 1823; the agreement rate was 65% and the average provider turnaround time was 12.53 days. In the 15-month postintervention period, there were 10 216 queries, with an agreed volume of 6802 at 66%. We created a policy to encourage responses no later than 10 days after the query, and our average turnaround time decreased by more than 50% to 5.86 days. The average number of monthly queries increased by 55%, from an average of 311 monthly queries in the pre-intervention period to an average of 681 per month in the postintervention period. The more common queries that had an impact on CMI included sepsis, antineoplastic chemotherapy–induced pancytopenia, acute posthemorrhagic anemia, malnutrition, hyponatremia, and metabolic encephalopathy.
Discussion
The need for accurate documentation by physicians has been recognized for many years.7
With the growing complexity of the documentation and coding process, it is difficult for clinicians to keep up with the terminology required by the Centers for Medicare and Medicaid Services (CMS). Several different methods to improve documentation have been proposed. Prior interventions to standardize documentation templates in the trauma service have shown improvement in CMI.8 An educational program on coding for internal medicine that included a lecture series and creation of a laminated pocket card listing common CMS diagnoses, CC, and MCC has been implemented, with an improvement in the capture rate of CC and MCC from 42% to 48% and an impact on expected mortality.9 This program resulted in a 30% decrease in the median quarterly mortality index and an increase in CMI from 1.27 to 1.36.
Our results show that there was an increase in comorbidities documentation of admitted patients after all interventions were implemented, more accurately reflecting the complexity of our patient population in a tertiary care academic medical center. Our CMI increased by 14% during the intervention period. The estimated CMI dollar impact increased by 75% from the pre-intervention period (adjusted for PPS-exempt hospital). The hospital-expected mortality increased from 1.77 to 3.07 (peak at 4.74 during third quarter of 2020) during the implementation period, which is a key driver of quality rankings for national outcomes reporting services such as US News & World Report.
There was increased physician satisfaction as a result of the change of functionality of the query response system, and no additional monetary provider incentive for complete documentation was allocated, apart from education and 1:1 support that improved physician engagement. Our next steps include the implementation of an advanced program to concurrently and automatically capture and nudge providers to respond and complete their documentation in real time.
Limitations
The limitations of our study include those inherent to a retrospective review and are associative and observational in nature. Although we used expected mortality and CMI as a surrogate for patient acuity for comparison, there was no way to control for actual changes in patient acuity that contributed to the increase in CMI, although we believe that the population we served and the services provided and their structure did not change significantly during the intervention period. Additionally, the observed increase in CMI during the implementation period may be a result of described variabilities in CMI and would be better studied over a longer period. Also, during the year of our interventions, 2020, we were affected by the COVID-19 pandemic. Patients with COVID-19 are known to carry a lower-than-expected mortality, and that could have had a negative impact on our results. In fact, we did observe a decrease in our expected mortality during the last quarter of 2020, which correlated with one of our regional peaks for COVID-19, and that could be a confounding factor. While the described intervention process is potentially applicable to multiple EHR systems, the exact form to capture the Elixhauser comorbidities was built into the Epic EHR, limiting external applicability of this tool to other EHR software.
Conclusion
A continuous comprehensive series of interventions substantially increased our patient acuity scores. The increased scores have implications for reimbursement and quality comparisons for hospitals and physicians. Our institution can now be stratified more accurately with our peers and other hospitals. Accurate medical record documentation has become increasingly important, but also increasingly complex. Leveraging the EHR through quality initiatives that facilitate the workflow for providers can have an impact on documentation, coding, and ultimately risk-adjusted outcomes data that influence institutional reputation.
Corresponding author: Marie Anne Sosa, MD; 1120 NW 14th St., Suite 809, Miami, FL, 33134; mxs2157@med.miami.edu
Disclosures: None reported.
doi:10.12788/jcom.0088
1. Elixhauser A, Steiner C, Harris DR, Coffey RM. Comorbidity measures for use with administrative data. Med Care. 1998;36(1):8-27. doi:10.1097/00005650-199801000-00004.
2. Sehgal AR. The role of reputation in U.S. News & World Report’s rankings of the top 50 American hospitals. Ann Intern Med. 2010;152(8):521-525. doi:10.7326/0003-4819-152-8-201004200-00009
3. Jha AK, DesRoches CM, Campbell EG, et al. Use of electronic health records in U.S. hospitals. N Engl J Med. 2009;360(16):1628-1638. doi:10.1056/NEJMsa0900592.
4. Adler-Milstein J, DesRoches CM, Kralovec, et al. Electronic health record adoption in US hospitals: progress continues, but challenges persist. Health Aff (Millwood). 2015;34(12):2174-2180. doi:10.1377/hlthaff.2015.0992
5. Vizient Clinical Data Base/Resource ManagerTM. Irving, TX: Vizient, Inc.; 2019. Accessed March 10, 2022. https://www.vizientinc.com
6. Moore BJ, White S, Washington R, Coenen N, Elixhauser A. Identifying increased risk of readmission and in-hospital mortality using hospital administrative data: the AHRQ Elixhauser Comorbidity Index. Med Care. 2017;55(7):698-705. doi:10.1097/MLR.0000000000000735
7. Payne T. Improving clinical documentation in an EMR world. Healthc Financ Manage. 2010;64(2):70-74.
8. Barnes SL, Waterman M, Macintyre D, Coughenour J, Kessel J. Impact of standardized trauma documentation to the hospital’s bottom line. Surgery. 2010;148(4):793-797. doi:10.1016/j.surg.2010.07.040
9. Spellberg B, Harrington D, Black S, Sue D, Stringer W, Witt M. Capturing the diagnosis: an internal medicine education program to improve documentation. Am J Med. 2013;126(8):739-743.e1. doi:10.1016/j.amjmed.2012.11.035