User login
For which patients is maternal oxygen supplementation of value?
Raghuraman N, Temming LA, Doering MM, et al. Maternal oxygen supplementation compared with room air for intrauterine resuscitation: a systematic review and meta-analysis. JAMA Pediatr. January 4, 2021. doi:10.1001/jamapediatrics.2020.5351.
EXPERT COMMENTARY
Maternal oxygen supplementation is widely used in labor for nonreassuring fetal heart rate (FHR) tracings, although its efficacy is uncertain for preventing fetal acidosis, operative intervention, or sequelae of neonatal encephalopathy. Recently, Raghuraman and colleagues reported the results of a systematic review and meta-analysis that included 16 randomized controlled trials. A total of 1,078 women were included in the oxygen group and 974 in the room air group. The primary outcome was umbilical artery pH; 14 trials reported on this outcome.
After analyzing the pooled and stratified results of the effect of maternal oxygen supplementation versus room air on umbilical artery gas measures, the authors concluded that peripartum oxygen supplementation is not associated with clinically relevant improvement in umbilical artery pH. They acknowledged, however, that the published studies were heterogeneous, lacked data on the association of oxygen supplementation with neonatal outcome, and did not assess oxygen use for abnormal FHR tracings, except for one trial with category II FHR tracings.
Effects of O2 supplementation
As maternal arterial hemoglobin is nearly saturated under normal conditions, maternal hyperoxia produces only modest increases in umbilical vein P
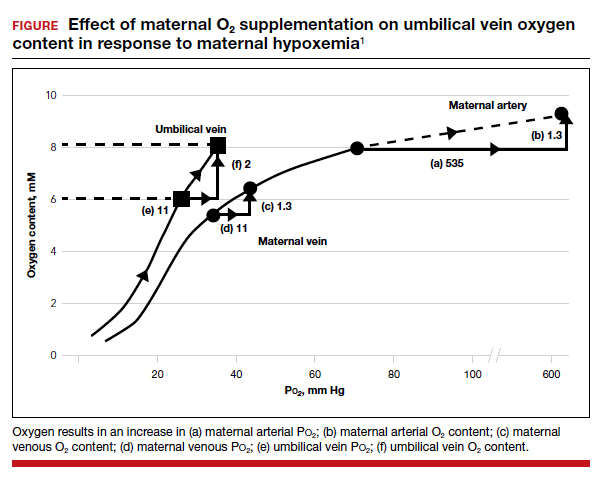
Fetal hypoxemia and acidosis can result from an interruption or an impairment of the mother-to-placenta-to-fetus oxygen pathway. With some interruptions of the oxygen pathway, such as placental abruption and complete cord occlusion–induced bradycardia, there would be less impact of maternal hyperoxia. By contrast, with other oxygen pathway impairments, such as reduced oxygen transfer with placental insufficiency, maternal hyperoxia can be of greater value by increasing maternal uterine artery and vein P
Continue to: Circumstances that may benefit from O2 supplementation...
Circumstances that may benefit from O2 supplementation
Late FHR decelerations reflect impairment of oxygen transfer and thus represent the heart rate pattern that is most likely to benefit from maternal hyperoxia. However, recurrent late decelerations occur in less than 2% of low-risk patients in labor,3 and severe levels of acidosis (umbilical artery pH <7.0 or base deficit [BD] ≥12 mmol/L) occur in only 1% to 2% of near-term or term deliveries.4,5
Variable decelerations also reflect fetal hypoxia and are much more common than late decelerations, so they also may benefit from O2 supplementation. Regardless, O2 supplementation should be seen only as a temporizing strategy while other resuscitative actions are initiated, including preparation for operative delivery, if indicated.
In a prior study by Raghuraman and colleagues (1 of only 4 studies that met selection criteria of oxygen supplementation for patients in labor), newborns of patients not receiving oxygen demonstrated 95% confidence limits of umbilical artery pH (7.24–7.28) and BD (2.9–4.3) well within the normal range.6 Thus, the low prevalence of cases in which a benefit might be anticipated and the low incidence of severe acidosis challenges the design of prospective studies to detect statistically and clinically significant changes in blood gas measures and newborn outcomes.
The normal mild fetal acidosis that develops during labor is likely a result of recurrent interruption of uterine placental blood flow during uterine contractions7 and is unlikely to benefit from maternal hyperoxia. Similarly, as placental oxygen transfer is predominantly flow rather than diffusion limited,8 oxygen supplementation is unlikely to improve severe variable FHR decelerations. Thus, a randomized study of hyperoxia in unselected laboring patients is unlikely to have a measurable effect on clinically significant acidosis.
Oxygen transport pathway guides treatment
For the present, an understanding of oxygen transport can guide clinical oxygen use. Thus, mothers with relative hypoxemia will unquestionably benefit with supplemental oxygen administration. Similarly, fetuses at risk for placental dysfunction (for example, growth restriction, postterm) and particularly those manifesting evidence of impaired oxygen transport (that is, late decelerations) may be most likely to benefit from the increased O2 gradient. For patients with reduced maternal uterine perfusion (such as hypotension or hypovolemia), pressors and/or fluid volume are likely to be more effective, while amnioinfusion is of greater value for umbilical cord compression patterns. A reduction in uterine activity may be of benefit to all fetuses exhibiting compromise. Due to the modest impact on fetal oxygen content, maternal hyperoxia does not produce significant fetal oxidative stress as measured by fetal malondialdehyde levels.
In view of the lack of demonstrated adverse effects of maternal supplemental oxygen, clinicians should not hesitate to use it. However, clinicians should recognize that supplemental oxygen is likely to be of value only in patients with significant impairment in the oxygen pathway, and they should choose additional intrauterine resuscitative measures focused on the etiology.
MICHAEL G. ROSS, MD, MPH,
AND BRYAN S. RICHARDSON, MD
- McNanley T, Woods J. Placental physiology. Glob Libr Women’s Med. (ISSN: 1756-2228). 2008. doi: 10.3843 /GLOWM.10195.
- Richardson BS. Fetal adaptive responses to asphyxia. Clin Perinatol. 1989;16:595-611.
- Sameshima H, Ikenoue T. Predictive value of late decelerations of fetal acidemia in unselective low-risk pregnancies. Am J Perinatol. 2005;22:19-23.
- Yeh P, Emary K, Impey L. The relationship between umbilical cord arterial pH and serious adverse neonatal outcome: analysis of 51,519 consecutive validated samples. BJOG. 2012;119:824-831.
- Kelly R, Ramaiah SM, Sheridan H, et al. Dose-dependent relationship between acidosis at birth and likelihood of death or cerebral palsy. Arch Dis Child Fetal Neonatal Ed. 2018;103:F567-F572.
- Raghuraman N, Wan L, Temming LA, et al. Effect of oxygen vs room air on intrauterine fetal resuscitation: a randomized noninferiority clinical trial. JAMA Pediatr. 2018;172:818-823.
- Ramsey EM, Corner JW Jr, Donner MW. Serial and cineradioangiographic visualization of maternal circulation in the primate (hemochorial) placenta. Am J Obstet Gynecol. 1963;86:213-225.
- Nye GA, Ingram E, Johnstone ED, et al. Human placental oxygenation in late gestation: experimental and theoretical approaches. J Physiol. 2018;596:5523-5534.
Raghuraman N, Temming LA, Doering MM, et al. Maternal oxygen supplementation compared with room air for intrauterine resuscitation: a systematic review and meta-analysis. JAMA Pediatr. January 4, 2021. doi:10.1001/jamapediatrics.2020.5351.
EXPERT COMMENTARY
Maternal oxygen supplementation is widely used in labor for nonreassuring fetal heart rate (FHR) tracings, although its efficacy is uncertain for preventing fetal acidosis, operative intervention, or sequelae of neonatal encephalopathy. Recently, Raghuraman and colleagues reported the results of a systematic review and meta-analysis that included 16 randomized controlled trials. A total of 1,078 women were included in the oxygen group and 974 in the room air group. The primary outcome was umbilical artery pH; 14 trials reported on this outcome.
After analyzing the pooled and stratified results of the effect of maternal oxygen supplementation versus room air on umbilical artery gas measures, the authors concluded that peripartum oxygen supplementation is not associated with clinically relevant improvement in umbilical artery pH. They acknowledged, however, that the published studies were heterogeneous, lacked data on the association of oxygen supplementation with neonatal outcome, and did not assess oxygen use for abnormal FHR tracings, except for one trial with category II FHR tracings.
Effects of O2 supplementation
As maternal arterial hemoglobin is nearly saturated under normal conditions, maternal hyperoxia produces only modest increases in umbilical vein P
Fetal hypoxemia and acidosis can result from an interruption or an impairment of the mother-to-placenta-to-fetus oxygen pathway. With some interruptions of the oxygen pathway, such as placental abruption and complete cord occlusion–induced bradycardia, there would be less impact of maternal hyperoxia. By contrast, with other oxygen pathway impairments, such as reduced oxygen transfer with placental insufficiency, maternal hyperoxia can be of greater value by increasing maternal uterine artery and vein P
Continue to: Circumstances that may benefit from O2 supplementation...
Circumstances that may benefit from O2 supplementation
Late FHR decelerations reflect impairment of oxygen transfer and thus represent the heart rate pattern that is most likely to benefit from maternal hyperoxia. However, recurrent late decelerations occur in less than 2% of low-risk patients in labor,3 and severe levels of acidosis (umbilical artery pH <7.0 or base deficit [BD] ≥12 mmol/L) occur in only 1% to 2% of near-term or term deliveries.4,5
Variable decelerations also reflect fetal hypoxia and are much more common than late decelerations, so they also may benefit from O2 supplementation. Regardless, O2 supplementation should be seen only as a temporizing strategy while other resuscitative actions are initiated, including preparation for operative delivery, if indicated.
In a prior study by Raghuraman and colleagues (1 of only 4 studies that met selection criteria of oxygen supplementation for patients in labor), newborns of patients not receiving oxygen demonstrated 95% confidence limits of umbilical artery pH (7.24–7.28) and BD (2.9–4.3) well within the normal range.6 Thus, the low prevalence of cases in which a benefit might be anticipated and the low incidence of severe acidosis challenges the design of prospective studies to detect statistically and clinically significant changes in blood gas measures and newborn outcomes.
The normal mild fetal acidosis that develops during labor is likely a result of recurrent interruption of uterine placental blood flow during uterine contractions7 and is unlikely to benefit from maternal hyperoxia. Similarly, as placental oxygen transfer is predominantly flow rather than diffusion limited,8 oxygen supplementation is unlikely to improve severe variable FHR decelerations. Thus, a randomized study of hyperoxia in unselected laboring patients is unlikely to have a measurable effect on clinically significant acidosis.
Oxygen transport pathway guides treatment
For the present, an understanding of oxygen transport can guide clinical oxygen use. Thus, mothers with relative hypoxemia will unquestionably benefit with supplemental oxygen administration. Similarly, fetuses at risk for placental dysfunction (for example, growth restriction, postterm) and particularly those manifesting evidence of impaired oxygen transport (that is, late decelerations) may be most likely to benefit from the increased O2 gradient. For patients with reduced maternal uterine perfusion (such as hypotension or hypovolemia), pressors and/or fluid volume are likely to be more effective, while amnioinfusion is of greater value for umbilical cord compression patterns. A reduction in uterine activity may be of benefit to all fetuses exhibiting compromise. Due to the modest impact on fetal oxygen content, maternal hyperoxia does not produce significant fetal oxidative stress as measured by fetal malondialdehyde levels.
In view of the lack of demonstrated adverse effects of maternal supplemental oxygen, clinicians should not hesitate to use it. However, clinicians should recognize that supplemental oxygen is likely to be of value only in patients with significant impairment in the oxygen pathway, and they should choose additional intrauterine resuscitative measures focused on the etiology.
MICHAEL G. ROSS, MD, MPH,
AND BRYAN S. RICHARDSON, MD
- McNanley T, Woods J. Placental physiology. Glob Libr Women’s Med. (ISSN: 1756-2228). 2008. doi: 10.3843 /GLOWM.10195.
- Richardson BS. Fetal adaptive responses to asphyxia. Clin Perinatol. 1989;16:595-611.
- Sameshima H, Ikenoue T. Predictive value of late decelerations of fetal acidemia in unselective low-risk pregnancies. Am J Perinatol. 2005;22:19-23.
- Yeh P, Emary K, Impey L. The relationship between umbilical cord arterial pH and serious adverse neonatal outcome: analysis of 51,519 consecutive validated samples. BJOG. 2012;119:824-831.
- Kelly R, Ramaiah SM, Sheridan H, et al. Dose-dependent relationship between acidosis at birth and likelihood of death or cerebral palsy. Arch Dis Child Fetal Neonatal Ed. 2018;103:F567-F572.
- Raghuraman N, Wan L, Temming LA, et al. Effect of oxygen vs room air on intrauterine fetal resuscitation: a randomized noninferiority clinical trial. JAMA Pediatr. 2018;172:818-823.
- Ramsey EM, Corner JW Jr, Donner MW. Serial and cineradioangiographic visualization of maternal circulation in the primate (hemochorial) placenta. Am J Obstet Gynecol. 1963;86:213-225.
- Nye GA, Ingram E, Johnstone ED, et al. Human placental oxygenation in late gestation: experimental and theoretical approaches. J Physiol. 2018;596:5523-5534.
How to differentiate maternal from fetal heart rate patterns on electronic fetal monitoring
Continuous electronic fetal heart rate monitoring (EFM) is used in the vast majority of all labors in the United States. With the use of EFM categories and definitions from the American College of Obstetricians and Gynecologists, the National Institutes of Health, and the Society for Maternal-Fetal Medicine, clinicians can now better define and communicate tracing assessments. Except for reducing neonatal seizure activity, however, EFM use during labor has not been demonstrated to significantly improve fetal and neonatal outcomes, yet EFM is associated with an increase in cesarean deliveries and instrument-assisted vaginal births.1
The negative predictive value of EFM for fetal hypoxia/acidosis is high, but its positive predictive value is only 30%, and the false-positive rate is as high as 60%.2 Although a false-positive assessment may result in a potentially unnecessary operative vaginal or cesarean delivery, a falsely reassuring strip may produce devastating consequences in the newborn and, not infrequently, medical malpractice liability. One etiology associated with falsely reassuring assessments is that of EFM monitoring of the maternal heart rate and the failure to recognize the tracing as maternal.
In this article, I discuss the mechanisms and periods of labor that often are associated with the maternal heart rate masquerading as the fetal heart rate. I review common EFM patterns associated with the maternal heart rate so as to aid in recognizing the maternal heart rate. In addition, I provide 3 case scenarios that illustrate the simple yet critical steps that clinicians can take to remedy the situation. Being aware of the potential for a maternal heart rate recording, investigating the EFM signals, and correcting the monitoring can help prevent significant morbidity.
CASE 1 EFM shows seesaw decelerations and returns to baseline rate
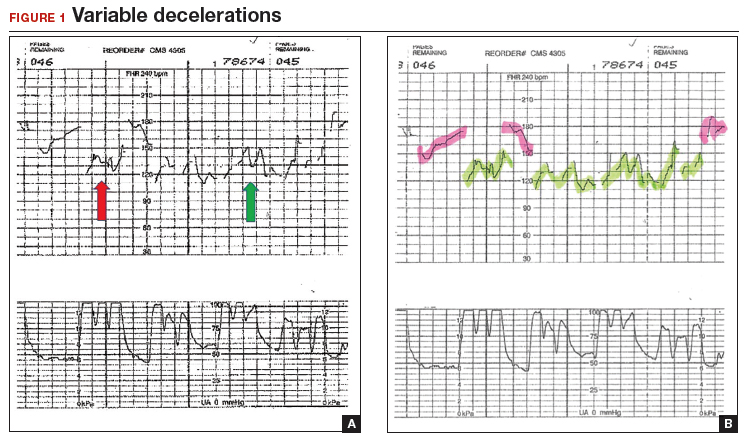
A 29-year-old woman (G3P2) at 39 weeks’ gestation was admitted to the hospital with spontaneous labor. Continuous EFM external monitoring was initiated. After membranes spontaneously ruptured at 4 cm dilation, an epidural was placed. Throughout the active phase of labor, the fetus demonstrated intermittent mild variable decelerations, and the fetal heart rate baseline increased to 180 beats per minute (BPM). With complete dilation, the patient initiated pushing. During the first several pushes, the EFM demonstrated an initial heart rate deceleration, and a loss of signal, but the heart rate returned to a baseline rate of 150 BPM. With the patient’s continued pushing efforts, the EFM baseline increased to 180 BPM, with evidence of variable decelerations to a nadir of 120 BPM, although with some signal gaps (FIGURE 1, red arrow). The tracing then appeared to have a baseline of 120 BPM with variability or accelerations (FIGURE 1, green arrow) before shifting again to 170 to 180 BPM.
What was happening?
Why does the EFM record the maternal heart rate?
Most commonly, EFM recording of the maternal heart rate occurs during the second stage of labor. Early in labor, the normal fetal heart rate (110–160 BPM) typically exceeds the basal maternal heart rate. However, in the presence of chorioamnionitis and maternal fever or with the stress of maternal pushing, the maternal heart rate frequently approaches or exceeds that of the fetal heart rate. The maximum maternal heart rate can be estimated as 220 BPM minus the maternal age. Thus, the heart rate in a 20-year-old gravida may reach rates of 160 to 180 BPM, equivalent to 80% to 90% of her maximum heart rate during second-stage pushing.
The external Doppler fetal monitor, having a somewhat narrow acoustic window, may lose the focus on the fetal heart as a result of descent of the baby, the abdominal shape-altering effect of uterine contractions, and the patient’s pushing. During the second stage, the EFM may record the maternal heart rate from the uterine arteries. Although some clinicians claim to differentiate the maternal from the fetal heart rate by the “whooshing” maternal uterine artery signal as compared with the “thumping” fetal heart rate signal, this auditory assessment is unproven and likely unreliable.
CASE 1 Problem recognized and addressed
In this case, the obstetrician recognized that “slipping” from the fetal to the maternal heart rate recording occurred with the onset of maternal pushing. After the pushing ceased, the maternal heart rate slipped back to the fetal heart rate. With the next several contractions, only the maternal heart rate was recorded. A fetal scalp electrode was then placed, and fetal variable decelerations were recognized. In view of the category II EFM recording, a vacuum procedure was performed from +3 station and a female infant was delivered. She had Apgar scores of 6 and 8 at 1 and 5 minutes, respectively, and she did well in the nursery.
Read what happened in Case 2 when the EFM demonstrated breaks in the tracing
CASE 2 EFM tracings belie the clinical situation
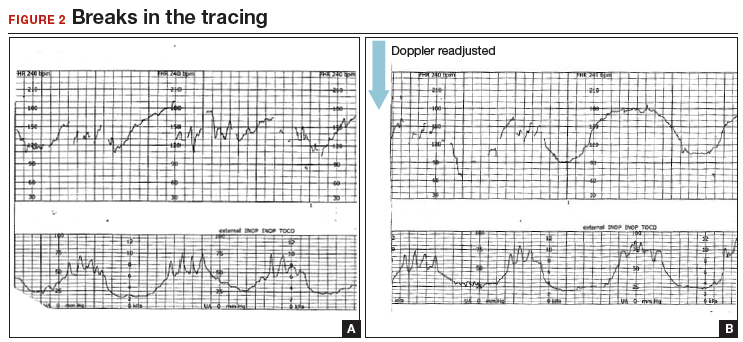
A 20-year-old woman (G1P0) presented for induction of labor at 41 weeks’ gestation. Continuous EFM recording was initiated, and the patient was given dinoprostone and, subsequently, oxytocin. Rupture of membranes at 3 cm demonstrated a small amount of fluid with thick meconium. The patient progressed to complete dilation and developed a temperature of 38.5°C; the EFM baseline increased to 180 BPM. Throughout the first hour of the second stage of labor, the EFM demonstrated breaks in the tracing and a heart rate of 130 to 150 BPM with each pushing effort (FIGURE 2A). The Doppler monitor was subsequently adjusted to focus on the fetal heart and repetitive late decelerations were observed (FIGURE 2B). An emergent cesarean delivery was performed. A depressed newborn male was delivered, with Apgar scores of 2 and 4 at 1 and 5 minutes, respectively, and significant metabolic acidosis.
What happened?
Fetal versus maternal responses to pushing
The fetal variable deceleration pattern is well recognized by clinicians. As a result of umbilical cord occlusion (due to compression, stretching, or twisting of the cord), fetal variable decelerations have a typical pattern. An initial acceleration shoulder resulting from umbilical vein occlusion (due to reduced venous return) is followed by an umbilical artery occlusion–induced sharp deceleration. The relief of the occlusion allows the sharp return toward baseline with the secondary shoulder overshoot.
In some cases, partial umbilical cord occlusion that affects only the fetal umbilical vein may result in an acceleration, although these usually resolve or evolve into variable decelerations within 30 minutes. By contrast, the maternal heart rate typically increases with contractions and with maternal pushing efforts. Thus, a repetitive pattern of heart rate accelerations with each contraction should warn of a possible maternal heart rate recording.
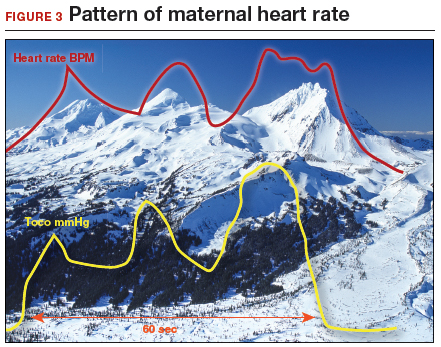
How maternal heart rate responds to pushing. Maternal pushing is a Valsalva maneuver. Although there are 4 classic cardiovascular phases of Valsalva responses, the typical maternal pushing effort results in an increase in the maternal heart rate. With the common sequence of three 10-second pushes during each contraction, the maternal heart rate often exhibits 3 acceleration and deceleration responses. The maternal heart rate tracing looks similar to the shape of the Three Sisters mountain peaks in Oregon (FIGURE 3). Due to Valsalva physiology, the 3 peaks of the Sisters mirror the 3 uterine wave form peaks, although with a 5- to 10-second delay in the heart rate responses (mountain peaks) from the pushing efforts.
Pre- and postcontraction changes offer clues. Several classic findings aid in differentiating the maternal from the fetal heart rate. If the tracing is maternal, typically the heart rate gradually decreases following the end of the contraction/pushing and continues to decrease until the start of the next contraction/pushing, at which time it increases. During the push, the Three Sisters wave form, with the 5- to 10-second offset, should alert the clinician to possible maternal heart rate recordings. By contrast, the fetal heart rate variable deceleration typically increases following the end of the maternal contraction/pushing and is either stable or increases further (variable with slow recovery) prior to the next uterine contraction/pushing effort. These differences in the patterns of precontraction and postcontraction changes can be very valuable in differentiating periods of maternal versus fetal heart rate recordings.
With “slipping” between fetal and maternal recording, it is not uncommon to record fetal heart rate between contractions, slip to the maternal heart rate during the pushing effort, and return again to the fetal heart rate with the end of the contraction. When confounded with the potential for other EFM artifacts, including doubling of a low maternal or fetal heart rate, or halving of a tachycardic signal, it is not surprising that it is challenging to recognize an EFM maternal heart rate recording.
CASE 2 Check the monitor for accurate focus
A retrospective analysis of this case revealed that the maternal heart rate was recorded with each contraction throughout the second stage. The actual fetal heart rate pattern of decelerations was revealed with the refocusing of the Doppler monitor.
Read how subtle slipping manifested in the EFM tracing of Case 3
CASE 3 Low fetal heart rate and variability during contractions
A 22-year-old woman (G2P1) in spontaneous labor at term progressed to complete dilation. Fetal heart rate accelerations occurred for approximately 30 minutes. With the advent of pushing, the fetal heart rate showed a rate of 130 to 140 BPM and mild decelerations with each contraction (FIGURE 4A). As the second stage progressed, the tracing demonstrated an undulating baseline heart rate between 100 and 130 BPM with possible variability during contractions (FIGURE 4B). This pattern continued for an additional 60 minutes. At vaginal delivery, the ObGyn was surprised to deliver a depressed newborn with Apgar scores of 1 and 3 at 1 and 5 minutes, respectively.
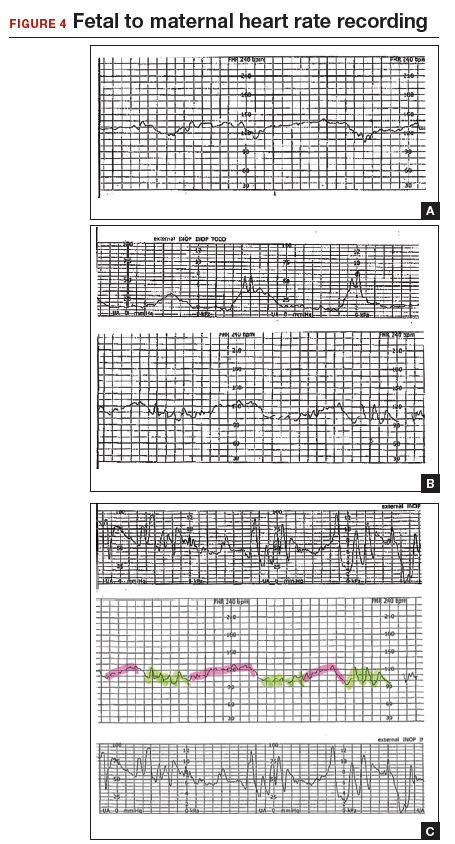
Slipping from the fetal to the maternal heart rate may be imperceptible
In contrast to the breaks in the tracings seen in Case 1 and Case 2, the EFM tracing in Case 3 appears continuous. Yet, slipping from the fetal to the maternal recording was occurring.
As seen in FIGURE 4C, the maternal heart rate with variability was recorded during pushing efforts, and the fetal heart rate was seen rising back toward a baseline between contractions. Note that the fetal heart rate did not reach a level baseline, but rather decelerated with the next contraction. The slipping to the maternal heart rate occurred without a perceptible break in the recording, making this tracing extremely difficult to interpret.
CASE 3 Be ever vigilant
The lack of recognition that the EFM recording had slipped to the maternal heart rate resulted in fetal and newborn hypoxia and acidosis, accounting for the infant’s low Apgar scores.
Read how using 3 steps can help you distinguish fetal from maternal heart rate patterns
Follow 3 steps to discern fetal vs maternal heart rate
These cases illustrate the difficulties in recognizing maternal heart rate patterns on the fetal monitor tracing. The 3 simple steps described below can aid in differentiating maternal from fetal heart rate patterns.
1 Be aware and alert
Recognize that EFM monitoring of the maternal heart rate may occur during periods of monitoring, particularly in second-stage labor. Often, the recorded tracing is a mix of fetal and maternal patterns. Remember that the maternal heart rate may increase markedly during the second stage and rise even higher during pushing efforts. When presented with a tracing that ostensibly represents the fetus, it may be challenging for the clinician to question that assumption. Thus, be aware that tracings may not represent what they seem to be.
Often, clinicians view only the 10-minute portion of the tracing displayed on the monitor screen. I recommend, however, that clinicians review the tracing over the past 30 to 60 minutes, or since their last EFM assessment, for an understanding of the recent fetal baseline heart rate and decelerations.
2 Investigate
Although it is sometimes challenging to recognize EFM maternal heart rate recordings, this is relatively easy to investigate. Even without a pulse oximeter in place, carefully examine the EFM recording for maternal signs to determine if the maternal heart rate is within the range of the recording. You can confirm that the recording is maternal through 1 of 3 easy measures:
- First, check the maternal radial pulse and correlate it with the heart rate baseline.
- Second, place a maternal electrocardiographic (EKG) heart rate monitor.
- Last, and often the simplest approach for continuous tracings, place a finger pulse oximeter to provide a continuous maternal pulse reading. Should the maternal heart rate superimpose on the EFM recording, maternal patterns are likely being detected. However, since the pulse oximeter and EFM Doppler devices use different technologies, they will provide similar—but not precisely identical—heart rate numerical readings if both are assessing the maternal heart rate. In that case, take steps to assure that the EFM truly is recording the fetal heart rate.
3 Treat and correct
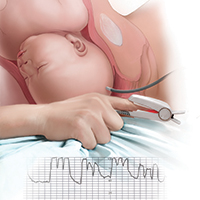
If the EFM is recording a maternal signal or if a significant question remains, place a fetal scalp electrode (unless contraindicated), as this may likely occur during the second stage. Alternatively, place a maternal surface fetal EKG monitor, or use ultrasonography to visually assess the fetal heart rate in real time.
Key point summary
The use of a maternal finger pulse oximeter, combined with a careful assessment of the EFM tracing, and/or a fetal scalp electrode are appropriate measures for confirming a fetal heart rate recording.
The 3 steps described (be aware and alert, investigate, treat and correct) can help you effectively monitor the fetal heart rate and avoid the potentially dangerous outcomes that might occur when the maternal heart rate masquerades as the fetal heart rate.
Share your thoughts! Send your Letter to the Editor to rbarbieri@mdedge.com. Please include your name and the city and state in which you practice.
- Alfirevic Z, Devane D, Gyte GM, Cuthbert A. Continuous cardiotocography (CTG) as a form of electronic fetal monitoring (EFM) for fetal assessment during labour. Cochrane Database Syst Rev. 2017; doi:10.1002/14651858.CD006066.pub3.
- Pinas A, Chandraharan E. Continuous cardiotocography during labour: analysis, classification and management. Best Pract Res Clin Obstet Gynaecol. 2016;30:33–47.

Dr. Ross is Distinguished Professor of Obstetrics and Gynecology and Public Health, Geffen School of Medicine at UCLA and Fielding School of Public Health at UCLA, Los Angeles, California.
The author reports no financial relationships relevant to this article.
Dr. Ross is Distinguished Professor of Obstetrics and Gynecology and Public Health, Geffen School of Medicine at UCLA and Fielding School of Public Health at UCLA, Los Angeles, California.
The author reports no financial relationships relevant to this article.
Dr. Ross is Distinguished Professor of Obstetrics and Gynecology and Public Health, Geffen School of Medicine at UCLA and Fielding School of Public Health at UCLA, Los Angeles, California.
The author reports no financial relationships relevant to this article.
Continuous electronic fetal heart rate monitoring (EFM) is used in the vast majority of all labors in the United States. With the use of EFM categories and definitions from the American College of Obstetricians and Gynecologists, the National Institutes of Health, and the Society for Maternal-Fetal Medicine, clinicians can now better define and communicate tracing assessments. Except for reducing neonatal seizure activity, however, EFM use during labor has not been demonstrated to significantly improve fetal and neonatal outcomes, yet EFM is associated with an increase in cesarean deliveries and instrument-assisted vaginal births.1
The negative predictive value of EFM for fetal hypoxia/acidosis is high, but its positive predictive value is only 30%, and the false-positive rate is as high as 60%.2 Although a false-positive assessment may result in a potentially unnecessary operative vaginal or cesarean delivery, a falsely reassuring strip may produce devastating consequences in the newborn and, not infrequently, medical malpractice liability. One etiology associated with falsely reassuring assessments is that of EFM monitoring of the maternal heart rate and the failure to recognize the tracing as maternal.
In this article, I discuss the mechanisms and periods of labor that often are associated with the maternal heart rate masquerading as the fetal heart rate. I review common EFM patterns associated with the maternal heart rate so as to aid in recognizing the maternal heart rate. In addition, I provide 3 case scenarios that illustrate the simple yet critical steps that clinicians can take to remedy the situation. Being aware of the potential for a maternal heart rate recording, investigating the EFM signals, and correcting the monitoring can help prevent significant morbidity.
CASE 1 EFM shows seesaw decelerations and returns to baseline rate
A 29-year-old woman (G3P2) at 39 weeks’ gestation was admitted to the hospital with spontaneous labor. Continuous EFM external monitoring was initiated. After membranes spontaneously ruptured at 4 cm dilation, an epidural was placed. Throughout the active phase of labor, the fetus demonstrated intermittent mild variable decelerations, and the fetal heart rate baseline increased to 180 beats per minute (BPM). With complete dilation, the patient initiated pushing. During the first several pushes, the EFM demonstrated an initial heart rate deceleration, and a loss of signal, but the heart rate returned to a baseline rate of 150 BPM. With the patient’s continued pushing efforts, the EFM baseline increased to 180 BPM, with evidence of variable decelerations to a nadir of 120 BPM, although with some signal gaps (FIGURE 1, red arrow). The tracing then appeared to have a baseline of 120 BPM with variability or accelerations (FIGURE 1, green arrow) before shifting again to 170 to 180 BPM.
What was happening?
Why does the EFM record the maternal heart rate?
Most commonly, EFM recording of the maternal heart rate occurs during the second stage of labor. Early in labor, the normal fetal heart rate (110–160 BPM) typically exceeds the basal maternal heart rate. However, in the presence of chorioamnionitis and maternal fever or with the stress of maternal pushing, the maternal heart rate frequently approaches or exceeds that of the fetal heart rate. The maximum maternal heart rate can be estimated as 220 BPM minus the maternal age. Thus, the heart rate in a 20-year-old gravida may reach rates of 160 to 180 BPM, equivalent to 80% to 90% of her maximum heart rate during second-stage pushing.
The external Doppler fetal monitor, having a somewhat narrow acoustic window, may lose the focus on the fetal heart as a result of descent of the baby, the abdominal shape-altering effect of uterine contractions, and the patient’s pushing. During the second stage, the EFM may record the maternal heart rate from the uterine arteries. Although some clinicians claim to differentiate the maternal from the fetal heart rate by the “whooshing” maternal uterine artery signal as compared with the “thumping” fetal heart rate signal, this auditory assessment is unproven and likely unreliable.
CASE 1 Problem recognized and addressed
In this case, the obstetrician recognized that “slipping” from the fetal to the maternal heart rate recording occurred with the onset of maternal pushing. After the pushing ceased, the maternal heart rate slipped back to the fetal heart rate. With the next several contractions, only the maternal heart rate was recorded. A fetal scalp electrode was then placed, and fetal variable decelerations were recognized. In view of the category II EFM recording, a vacuum procedure was performed from +3 station and a female infant was delivered. She had Apgar scores of 6 and 8 at 1 and 5 minutes, respectively, and she did well in the nursery.
Read what happened in Case 2 when the EFM demonstrated breaks in the tracing
CASE 2 EFM tracings belie the clinical situation
A 20-year-old woman (G1P0) presented for induction of labor at 41 weeks’ gestation. Continuous EFM recording was initiated, and the patient was given dinoprostone and, subsequently, oxytocin. Rupture of membranes at 3 cm demonstrated a small amount of fluid with thick meconium. The patient progressed to complete dilation and developed a temperature of 38.5°C; the EFM baseline increased to 180 BPM. Throughout the first hour of the second stage of labor, the EFM demonstrated breaks in the tracing and a heart rate of 130 to 150 BPM with each pushing effort (FIGURE 2A). The Doppler monitor was subsequently adjusted to focus on the fetal heart and repetitive late decelerations were observed (FIGURE 2B). An emergent cesarean delivery was performed. A depressed newborn male was delivered, with Apgar scores of 2 and 4 at 1 and 5 minutes, respectively, and significant metabolic acidosis.
What happened?
Fetal versus maternal responses to pushing
The fetal variable deceleration pattern is well recognized by clinicians. As a result of umbilical cord occlusion (due to compression, stretching, or twisting of the cord), fetal variable decelerations have a typical pattern. An initial acceleration shoulder resulting from umbilical vein occlusion (due to reduced venous return) is followed by an umbilical artery occlusion–induced sharp deceleration. The relief of the occlusion allows the sharp return toward baseline with the secondary shoulder overshoot.
In some cases, partial umbilical cord occlusion that affects only the fetal umbilical vein may result in an acceleration, although these usually resolve or evolve into variable decelerations within 30 minutes. By contrast, the maternal heart rate typically increases with contractions and with maternal pushing efforts. Thus, a repetitive pattern of heart rate accelerations with each contraction should warn of a possible maternal heart rate recording.
How maternal heart rate responds to pushing. Maternal pushing is a Valsalva maneuver. Although there are 4 classic cardiovascular phases of Valsalva responses, the typical maternal pushing effort results in an increase in the maternal heart rate. With the common sequence of three 10-second pushes during each contraction, the maternal heart rate often exhibits 3 acceleration and deceleration responses. The maternal heart rate tracing looks similar to the shape of the Three Sisters mountain peaks in Oregon (FIGURE 3). Due to Valsalva physiology, the 3 peaks of the Sisters mirror the 3 uterine wave form peaks, although with a 5- to 10-second delay in the heart rate responses (mountain peaks) from the pushing efforts.
Pre- and postcontraction changes offer clues. Several classic findings aid in differentiating the maternal from the fetal heart rate. If the tracing is maternal, typically the heart rate gradually decreases following the end of the contraction/pushing and continues to decrease until the start of the next contraction/pushing, at which time it increases. During the push, the Three Sisters wave form, with the 5- to 10-second offset, should alert the clinician to possible maternal heart rate recordings. By contrast, the fetal heart rate variable deceleration typically increases following the end of the maternal contraction/pushing and is either stable or increases further (variable with slow recovery) prior to the next uterine contraction/pushing effort. These differences in the patterns of precontraction and postcontraction changes can be very valuable in differentiating periods of maternal versus fetal heart rate recordings.
With “slipping” between fetal and maternal recording, it is not uncommon to record fetal heart rate between contractions, slip to the maternal heart rate during the pushing effort, and return again to the fetal heart rate with the end of the contraction. When confounded with the potential for other EFM artifacts, including doubling of a low maternal or fetal heart rate, or halving of a tachycardic signal, it is not surprising that it is challenging to recognize an EFM maternal heart rate recording.
CASE 2 Check the monitor for accurate focus
A retrospective analysis of this case revealed that the maternal heart rate was recorded with each contraction throughout the second stage. The actual fetal heart rate pattern of decelerations was revealed with the refocusing of the Doppler monitor.
Read how subtle slipping manifested in the EFM tracing of Case 3
CASE 3 Low fetal heart rate and variability during contractions
A 22-year-old woman (G2P1) in spontaneous labor at term progressed to complete dilation. Fetal heart rate accelerations occurred for approximately 30 minutes. With the advent of pushing, the fetal heart rate showed a rate of 130 to 140 BPM and mild decelerations with each contraction (FIGURE 4A). As the second stage progressed, the tracing demonstrated an undulating baseline heart rate between 100 and 130 BPM with possible variability during contractions (FIGURE 4B). This pattern continued for an additional 60 minutes. At vaginal delivery, the ObGyn was surprised to deliver a depressed newborn with Apgar scores of 1 and 3 at 1 and 5 minutes, respectively.
Slipping from the fetal to the maternal heart rate may be imperceptible
In contrast to the breaks in the tracings seen in Case 1 and Case 2, the EFM tracing in Case 3 appears continuous. Yet, slipping from the fetal to the maternal recording was occurring.
As seen in FIGURE 4C, the maternal heart rate with variability was recorded during pushing efforts, and the fetal heart rate was seen rising back toward a baseline between contractions. Note that the fetal heart rate did not reach a level baseline, but rather decelerated with the next contraction. The slipping to the maternal heart rate occurred without a perceptible break in the recording, making this tracing extremely difficult to interpret.
CASE 3 Be ever vigilant
The lack of recognition that the EFM recording had slipped to the maternal heart rate resulted in fetal and newborn hypoxia and acidosis, accounting for the infant’s low Apgar scores.
Read how using 3 steps can help you distinguish fetal from maternal heart rate patterns
Follow 3 steps to discern fetal vs maternal heart rate
These cases illustrate the difficulties in recognizing maternal heart rate patterns on the fetal monitor tracing. The 3 simple steps described below can aid in differentiating maternal from fetal heart rate patterns.
1 Be aware and alert
Recognize that EFM monitoring of the maternal heart rate may occur during periods of monitoring, particularly in second-stage labor. Often, the recorded tracing is a mix of fetal and maternal patterns. Remember that the maternal heart rate may increase markedly during the second stage and rise even higher during pushing efforts. When presented with a tracing that ostensibly represents the fetus, it may be challenging for the clinician to question that assumption. Thus, be aware that tracings may not represent what they seem to be.
Often, clinicians view only the 10-minute portion of the tracing displayed on the monitor screen. I recommend, however, that clinicians review the tracing over the past 30 to 60 minutes, or since their last EFM assessment, for an understanding of the recent fetal baseline heart rate and decelerations.
2 Investigate
Although it is sometimes challenging to recognize EFM maternal heart rate recordings, this is relatively easy to investigate. Even without a pulse oximeter in place, carefully examine the EFM recording for maternal signs to determine if the maternal heart rate is within the range of the recording. You can confirm that the recording is maternal through 1 of 3 easy measures:
- First, check the maternal radial pulse and correlate it with the heart rate baseline.
- Second, place a maternal electrocardiographic (EKG) heart rate monitor.
- Last, and often the simplest approach for continuous tracings, place a finger pulse oximeter to provide a continuous maternal pulse reading. Should the maternal heart rate superimpose on the EFM recording, maternal patterns are likely being detected. However, since the pulse oximeter and EFM Doppler devices use different technologies, they will provide similar—but not precisely identical—heart rate numerical readings if both are assessing the maternal heart rate. In that case, take steps to assure that the EFM truly is recording the fetal heart rate.
3 Treat and correct
If the EFM is recording a maternal signal or if a significant question remains, place a fetal scalp electrode (unless contraindicated), as this may likely occur during the second stage. Alternatively, place a maternal surface fetal EKG monitor, or use ultrasonography to visually assess the fetal heart rate in real time.
Key point summary
The use of a maternal finger pulse oximeter, combined with a careful assessment of the EFM tracing, and/or a fetal scalp electrode are appropriate measures for confirming a fetal heart rate recording.
The 3 steps described (be aware and alert, investigate, treat and correct) can help you effectively monitor the fetal heart rate and avoid the potentially dangerous outcomes that might occur when the maternal heart rate masquerades as the fetal heart rate.
Share your thoughts! Send your Letter to the Editor to rbarbieri@mdedge.com. Please include your name and the city and state in which you practice.
- Alfirevic Z, Devane D, Gyte GM, Cuthbert A. Continuous cardiotocography (CTG) as a form of electronic fetal monitoring (EFM) for fetal assessment during labour. Cochrane Database Syst Rev. 2017; doi:10.1002/14651858.CD006066.pub3.
- Pinas A, Chandraharan E. Continuous cardiotocography during labour: analysis, classification and management. Best Pract Res Clin Obstet Gynaecol. 2016;30:33–47.
How and when umbilical cord gas analysis can justify your obstetric management
Umbilical cord blood (cord) gas values can aid both in understanding the cause of an infant’s acidosis and in providing reassurance that acute acidosis or asphyxia is not responsible for a compromised infant with a low Apgar score. Together with other clinical measurements (including fetal heart rate [FHR] tracings, Apgar scores, newborn nucleated red cell counts, and neonatal imaging), cord gas analysis can be remarkably helpful in determining the cause for a depressed newborn. It can help us determine, for example, if infant compromise was a result of an asphyxial event, and we often can differentiate whether the event was acute, prolonged, or occurred prior to presentation in labor. We further can use cord gas values to assess whether a decision for operative intervention for nonreassuring fetal well-being was appropriate (see “Brain injury at birth: Cord gas values presented as evidence at trial”). In addition, cord gas analysis can complement methods for determining fetal acidosis changes during labor, enabling improved assessment of FHR tracings.1−3
At 40 weeks' gestation, a woman presented to the hospital because of decreased fetal movement. On arrival, an external fetal heart-rate (FHR) monitor showed nonreassuring tracings, evidenced by absent to minimal variability and subtle decelerations occurring at 10- to 15-minute intervals. The on-call ObGyn requested induction of labor with oxytocin, and a low-dose infusion (1 mU/min) was initiated. An internal FHR monitor was then placed and late decelerations were observed with the first 2 induced contractions. The oxytocin infusion was discontinued and the ObGyn performed an emergency cesarean delivery. The infant's Apgar scores were 1, 2, and 2 at 1, 5, and 10 minutes, respectively. Cord samples were obtained and values from the umbilical artery were as follows: pH, 6.86; Pco2, 55 mm Hg; Po2, 6 mm Hg; and BDECF, 21.1 mmol/L. Values from the umbilical vein were: pH, 6.94; Pco2, 45 mm Hg; Po2, 17 mm Hg; and BDECF, 20.0 mmol/L. The infant was later diagnosed with a hypoxic brain injury resulting in cerebral palsy. At trial years later, the boy had cognitive and physical limitations and required 24-hour care.
The parents claimed that the ObGyn should have performed a cesarean delivery earlier when the external FHR monitor showed nonreassuring tracings.
The hospital and physician claimed that, while tracings were consistently nonreassuring, they were stable. They maintained that the child's brain damage was not due to a delivery delay, as the severe level of acidosis in both the umbilical artery and vein could not be a result of the few heart rate decelerations during the 2-hour period of monitoring prior to delivery. They argued that the clinical picture indicated a pre-hospital hypoxic event associated with decreased fetal movement.
A defense verdict was returned.
Case assessment
Cord gas results, together with other measures (eg, infant nucleated red blood cells, brain imaging) can aid the ObGyn in medicolegal cases. However, they are not always protective of adverse judgment.
I recommend checking umbilical cord blood gas values on all operative vaginal deliveries, cesarean deliveries for fetal concern, abnormal FHR patterns, clinical chorioamnionitis, multifetal gestations, premature deliveries, and all infants with low Apgar scores at 1 or 5 minutes. If you think you may need a cord gas analysis, go ahead and obtain it. Cord gas analysis often will aid in justifying your management or provide insight into the infant’s status.
Controversy remains as to the benefit of universal cord gas analysis. Assuming a variable cost of $15 for 2 (artery and vein) blood gas samples per neonate,4 the annual cost in the United States would be approximately $60 million. This would likely be cost effective as a result of medicolegal and educational benefits as well as potential improvements in perinatal outcome5 and reductions in special care nursery admissions.4
CASE 1: A newborn with unexpected acidosis
A 29-year-old woman (G2P1) at 38 weeks’ gestation was admitted to the hospital following an office visit during which oligohydramnios (amniotic fluid index, 3.5 cm) was found. The patient had a history of a prior cesarean delivery for failure to progress, and she desired a repeat cesarean delivery. Fetal monitoring revealed a heart rate of 140 beats per minute with moderate variability and uterine contractions every 3 to 5 minutes associated with moderate variable decelerations. A decision was made to proceed with the surgery. Blood samples were drawn for laboratory analysis, monitoring was discontinued, and the patient was taken to the operating room. An epidural anesthetic was placed and the cesarean delivery proceeded.
On uterine incision, there was no evidence of abruption or uterine rupture, but thick meconium-stained amniotic fluid was observed. A depressed infant was delivered, the umbilical cord clamped, and the infant handed to the pediatric team. Cord samples were obtained and values from the umbilical artery were as follows: pH, 6.80; P
What happened?
Read how to use cord gas values in practice
Using cord gas values in practice
Before analyzing the circumstances in Case 1,it is important to consider several key questions, including:
- What are the normal levels of cord pH, O2, CO2, and base deficit (BD)?
- How does cord gas indicate what happened during labor?
- What are the preventable errors in cord gas sampling or interpretation?
For a review of fetal cord gas physiology, see “Physiology of fetal cord gases: The basics”.
A review of basic fetal cord gas physiology will assist in understanding how values are interpreted.
Umbilical cord O2 and CO2
Fetal cord gas values result from the rapid transfer of gases and the slow clearance of acid across the placenta. Approximately 10% of maternal blood flow supplies the uteroplacental circulation, with the near-term placenta receiving approximately 70% of the uterine blood flow.1 Of the oxygen delivered, a surprising 50% provides for placental metabolism and 50% for the fetus. On the fetal side, 40% of fetal cardiac output supplies the umbilical circulation. Oxygen and carbon dioxide pass readily across the placental layers; exchange is limited by the amount of blood flow on both the maternal and the fetal side (flow limited). In the human placenta, maternal blood and fetal blood effectively travel in the same direction (concurrent exchange); thus, umbilical vein O2 and CO2 equilibrate with that in the maternal uterine vein.
Most of the O2 in fetal blood is carried by hemoglobin. Because of the markedly greater affinity of fetal hemoglobin for O2, the saturation curve is shifted to the left, resulting in increased hemoglobin saturation at the relatively low levels of fetal Po2. This greater affinity for oxygen results from the unique fetal hemoglobin gamma (γ) subunit, as compared with the adult beta (ß) subunit. Fetal hemoglobin has a reduced interaction with 2,3-bisphosphoglycerate, which itself decreases the affinity of adult hemoglobin for oxygen.
The majority of CO2 (85%) is carried as part of the bicarbonate buffer system. Fetal CO2 is converted into carbonic acid (H2CO3) in the red cell and dissociates into hydrogen (H+) and bicarbonate (HCO3−) ions, which diffuse out of the cell. When fetal blood reaches the placenta, this process is reversed and CO2 diffuses across the placenta to the maternal circulation. The production of H+ ions from CO2 explains the development of respiratory acidosis from high Pco2. In contrast, anaerobic metabolism, which produces lactic acid, results in metabolic acidosis.
Difference between pH and BD
The pH is calculated as the inverse log of the H+ ion concentration; thus, the pH falls as the H+ ion concentration exponentially increases, whether due to respiratory or metabolic acidosis. To quantify the more important metabolic acidosis, we use BD, which is a measure of how much of bicarbonate buffer base has been used by (lactic) acid. The BD and the base excess (BE) may be used interchangeably, with BE representing a negative number. Although BD represents the metabolic component of acidosis, a correction may be required to account for high levels of fetal Pco2 (see Case 1). In this situation, a more accurate measure is BD extracellular fluid (BDECF).
Why not just use pH? There are 2 major limitations to using pH as a measure of fetal or newborn acidosis. First, pH may be influenced by both respiratory and metabolic alterations, although only metabolic acidosis is associated with fetal neurologic injury.2 Furthermore, as pH is a log function, it does not change linearly with the amount of acid produced. In contrast to pH, BD is a measure of metabolic acidosis and changes in direct proportion to fetal acid production.
What about lactate? Measurements of lactate may also be included in blood gas analyses. Under hypoxic conditions, excess pyruvate is converted into lactate and released from the cell along with H+, resulting in acidosis. However, levels of umbilical cord lactate associated with neonatal hypoxic injury have not been established to the same degree as have pH or BD. Nevertheless, lactate has been measured in fetal scalp blood samples and offers the potential as a marker of fetal hypoxemia and acidosis.3
References
- Assali NS. Dynamics of the uteroplacental circulation in health and disease. Am J Perinatol. 1989;6(2):105-109.
- Low JA, Panagiotopoulos C, Derrick EJ. Newborn complications after intrapartum asphyxia with metabolic acidosis in the term fetus. Am J Obstet Gynecol. 1994;170(4):1081-1087.
- Mancho JP, Gamboa SM, Gimenez OR, Esteras RC, Solanilla BR, Mateo SC. Diagnostic accuracy of fetal scalp lactate for intrapartum acidosis compared with scalp pH [published online ahead of print October 8, 2016]. J Perinatal Med. doi: 10.1515/jpm-2016-004.
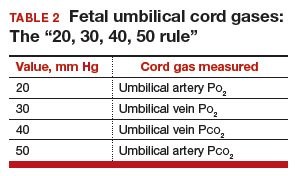
Normal values: The “20, 30, 40, 50 rule”
Among the values reported for umbilical blood gas, the pH, P
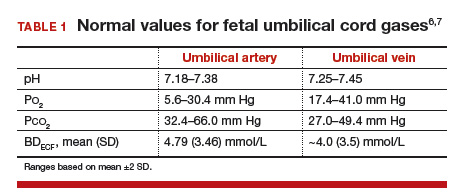
I recommend using the “20, 30, 40, 50 rule” as a simple tool for remembering normal umbilical artery and vein P
- P
o 2 values are lower than Pco 2 values; thus, the 20 and 30 represent Po 2 values - as fetal umbilical artery P
o 2 is lower than umbilical vein Po 2, 20 mm Hg represents the umbilical artery and 30 mm Hg represents the vein - P
co 2 values are higher in the umbilical artery than in the vein; thus, 50 mm Hg represents the umbilical artery and 40 mm Hg represents the umbilical vein.
Umbilical cord BD values change in relation to labor and FHR decelerations.8 Prior to labor, the normal fetus has a slight degree of acidosis (BD, 2 mmol/L). During the latent phase of labor, fetal BD typically does not change. With the increased frequency of contractions, BD may increase 1 mmol/L for every 3 to 6 hours during the active phase and up to 1 mmol/L per hour during the second stage, depending on FHR responses. Thus, following vaginal delivery the average umbilical artery BD is approximately 5 mmol/L and the umbilical vein BD is approximately 4 mmol/L. As lactate crosses the placenta slowly, BD values are typically only 1 mmol/L less in the umbilical vein than in the artery, unless there has been an obstruction to placental flow (see Case 1).
For pH, the umbilical artery value is always lower than that of the vein, a result of both the higher umbilical artery P
Possible causes of abnormal cord gas values
Because of the nearly fully saturated maternal hemoglobin under normal conditions, fetal arterial and venous P
In contrast, reduced fetal P
Effect of maternal oxygen administration on fetal oxygenation
Although maternal oxygen administration is commonly used during labor and delivery, controversy remains as to the benefit of oxygen supplementation.10 In a normal mother with oxygen saturation above 95%, the administration of oxygen will increase maternal arterial P
However, maternal oxygen supplementation may have marked benefit in cases in which maternal arterial P
How did the Case 1 circumstances lead to newborn acidosis?
Most noticeable in this case is the large difference in BD between the umbilical artery and vein and the high P
Whereas BD normally is only about 1 mmol/L greater in the umbilical artery versus in the vein, occasionally the arterial value is markedly greater than the vein value. This can occur when there is a cessation of blood flow through the placenta, as a result of complete umbilical cord obstruction, or when there is a uterine abruption. In these situations, the umbilical vein (which has not had blood flow) represents the fetal status prior to the occlusion event. In contrast, despite bradycardia, fetal heart pulsations mix blood within the umbilical artery and therefore the artery generally represents the fetal status at the time of birth.
In response to complete cord occlusion, fetal BD increases by approximately 1 mmol/L every 2 minutes. Consequently, an 8 mmol/L difference in BD between the umbilical artery and vein is consistent with a 16-minute period of umbilical occlusion or placental abruption. Also in response to complete umbilical cord occlusion, P
The umbilical vein BD is also elevated for early labor. This value suggests that repetitive, intermittent cord occlusions (evident on the initial fetal monitor tracing) likely resulted in this moderate acidosis prior to the complete cord occlusion in the final 16 minutes.
Thus, BD and P
Read more cases plus procedures, equipment for cord sampling
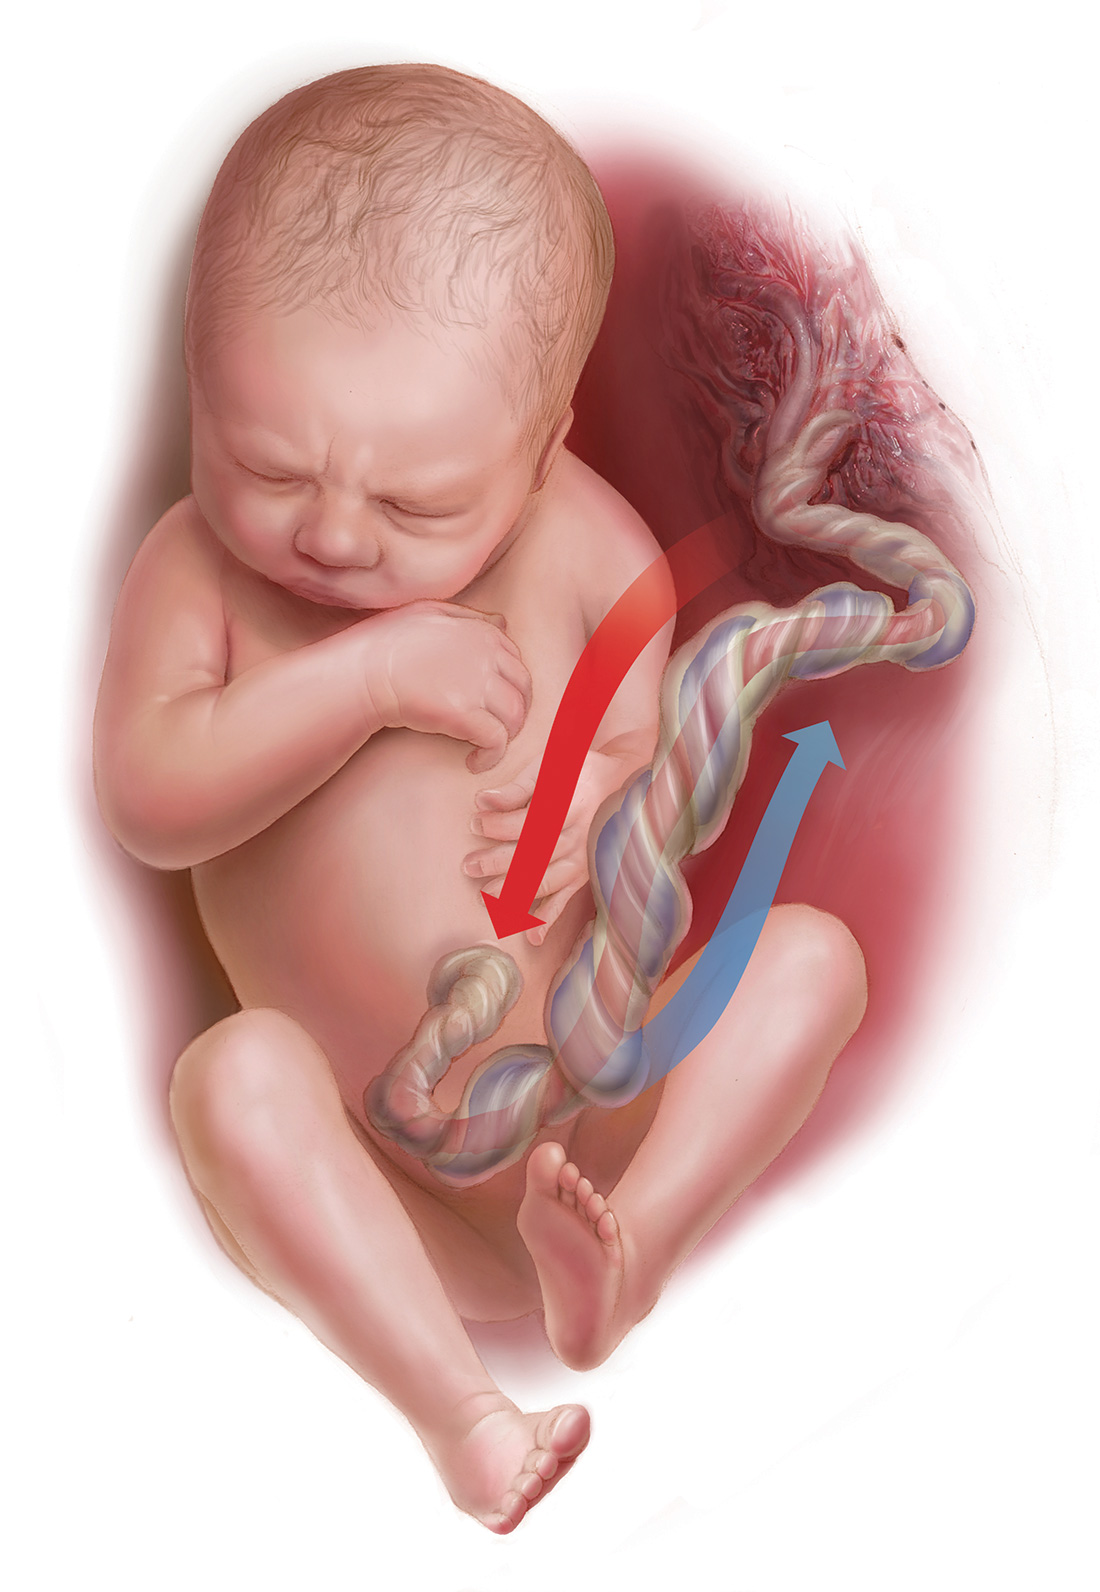
CASE 2: An infant with unusual umbilical artery values
An infant born via vacuum delivery for a prolonged second stage of labor had 1- and 5-minute Apgar scores of 8 and 9, respectively. Cord gas values were obtained, and analysis revealed that for the umbilical artery, the pH was 7.29; P
The resident asked, “How is the P
The curious Case 2 values suggest an air bubble
Although it is possible that the aberrant values in Case 2 could have resulted from switching the artery and vein samples, the pH is lower in the artery, and both the artery P
Related article:
Is neonatal injury more likely outside of a 30-minute decision-to-incision time interval for cesarean delivery?
CASE 3: A vigorous baby with significant acidosis
A baby with 1- and 5-minute Apgar scores of 9 and 9 was delivered by cesarean and remained vigorous. Umbilical cord analysis revealed an umbilical artery pH level of 7.15, with normal P
Was there a collection error in Case 3?
On occasion, a falsely low pH level and, thus, a falsely elevated BD may result from excessive heparin in the collection syringe. Heparin is acidotic and should be used only to coat the syringe. Although syringes in current use are often pre-heparinized, if one is drawing up heparin into the syringe, it should be coated and then fully expelled.
Umbilical cord sampling: Procedures and equipment
Many issues remain regarding the optimal storage of cord samples. Ideally, a doubly clamped section of the cord promptly should be sampled into glass syringes that can be placed on ice and rapidly measured for cord values.
Stability of umbilical cord samples within the cord is within 20 to 30 minutes. Delayed sampling of clamped cord sections generally has minimal effect on pH and P
Plastic syringes can introduce interference. Several studies have demonstrated that collection of samples in plastic may result in an increase in P
Use glass, and “ice” the sample if necessary. Although it has been suggested that placing samples on ice minimizes metabolism, the cooled plastic may in fact be more susceptible to oxygen diffusion. Thus, unless samples will be analyzed promptly, it is best to use glass syringes on ice.13,14
Related article:
Protecting the newborn brain—the final frontier in obstetric and neonatal care
What if the umbilical cord is torn?
Sometimes the umbilical cord is torn and discarded or cannot be accessed for other reasons. A sample can still be obtained, however, by aspirating the placental surface artery and vein vessels. Although there is some potential variance in pH, P
How do you obtain cord analysis when delaying cord clamping?
The American College of Obstetricians and Gynecologists (ACOG) now advises delayed cord clamping in term and preterm deliveries, which raises the question of how you obtain a blood sample in this setting. Importantly, ACOG recommends delayed cord clamping only in vigorous infants,16 whereas potentially compromised infants should be transferred rapidly for newborn care. Although several studies have demonstrated some variation in cord gas values with delayed cord clamping,17–21 clamping after pulsation has ceased or after the recommended 30 to 60 seconds following birth results in minimal change in BD values. Thus, do not hesitate to perform delayed cord clamping in vigorous infants.
Share your thoughts! Send your Letter to the Editor to rbarbieri@frontlinemedcom.com. Please include your name and the city and state in which you practice.
- Ross MG, Gala R. Use of umbilical artery base excess: algorithm for the timing of hypoxic injury. Am J Obstet Gynecol. 2002;187(1):1–9.
- Uccella S, Cromi A, Colombo G, et al. Prediction of fetal base excess values at birth using an algorithm to interpret fetal heart rate tracings: a retrospective validation. BJOG. 2012;119(13):1657–1664.
- Uccella S, Cromi A, Colombo GF, et al. Interobserver reliability to interpret intrapartum electronic fetal heart rate monitoring: does a standardized algorithm improve agreement among clinicians? J Obstet Gynaecol. 2015;35(3):241–245.
- White CR, Doherty DA, Cannon JW, Kohan R, Newnham JP, Pennell CE. Cost effectiveness of universal umbilical cord blood gas and lactate analysis in a tertiary level maternity unit. J Perinat Med. 2016;44(5):573–584.
- White CR, Doherty DA, Henderson JJ, Kohan R, Newnham JP, Pennell CE. Benefits of introducing universal umbilical cord blood gas and lactate analysis into an obstetric unit. Aust N Z J Obstet Gynaecol. 2010;50(4):318–328.
- Yeomans ER, Hauth JC, Gilstrap LC III, Strickland DM. Umbilical cord pH, Pco2, and bicarbonate following uncomplicated term vaginal deliveries. Am J Obstet Gynecol. 1985;151(6):798–800.
- Wiberg N, Källén K, Olofsson P. Base deficit estimation in umbilical cord blood is influenced by gestational age, choice of fetal fluid compartment, and algorithm for calculation. Am J Obstet Gynecol. 2006;195(6):1651–1656.
- Ross MG, Gala R. Use of umbilical artery base excess: algorithm for the timing of hypoxic injury. Am J Obstet Gynecol. 2002;187(1):1–9.
- Executive summary: Neonatal encephalopathy and neurologic outcome, second edition. Report of the American College of Obstetricians and Gynecologists’ Task Force on Neonatal Encephalopathy. Obstet Gynecol. 2014;123(4):896-901.
- Hamel MS, Anderson BL, Rouse DJ. Oxygen for intrauterine resuscitation: of unproved benefit and potentially harmful. Am J Obstet Gynecol. 2014;211(2):124–127.
- Owen P, Farrell TA, Steyn W. Umbilical cord blood gas analysis; a comparison of two simple methods of sample storage. Early Hum Dev. 1995;42(1):67–71.
- Armstrong L, Stenson B. Effect of delayed sampling on umbilical cord arterial and venous lactate and blood gases in clamped and unclamped vessels. Arch Dis Child Fetal Neonatal Ed. 2006;91(5):F342–F345.
- White CR, Mok T, Doherty DA, Henderson JJ, Newnham JP, Pennell CE. The effect of time, temperature and storage device on umbilical cord blood gas and lactate measurement: a randomized controlled trial. J Matern Fetal Neonatal Med. 2012;25(6):587–594.
- Knowles TP, Mullin RA, Hunter JA, Douce FH. Effects of syringe material, sample storage time, and temperature on blood gases and oxygen saturation in arterialized human blood samples. Respir Care. 2006;51(7):732–736.
- Nodwell A, Carmichael L, Ross M, Richardson B. Placental compared with umbilical cord blood to assess fetal blood gas and acid-base status. Obstet Gynecol. 2005;105(1):129–138.
- American College of Obstetricians and Gynecologists. ACOG Committee Opinion No. 684. Delayed umbilical cord clamping after birth. Obstet Gynecol. 2017;129(1):e5–e10.
- De Paco C, Florido J, Garrido MC, Prados S, Navarrete L. Umbilical cord blood acid-base and gas analysis after early versus delayed cord clamping in neonates at term. Arch Gynecol Obstet. 2011;283(5):1011–1014.
- Valero J, Desantes D, Perales-Puchalt A, Rubio J, Diago Almela VJ, Perales A. Effect of delayed umbilical cord clamping on blood gas analysis. Eur J Obstet Gynecol Reprod Biol. 2012;162(1): 21–23.
- Andersson O, Hellström-Westas L, Andersson D, Clausen J, Domellöf M. Effects of delayed compared with early umbilical cord clamping on maternal postpartum hemorrhage and cord blood gas sampling: a randomized trial. Acta Obstet Gynecol Scand. 2013;92(5):567–574.
- Wiberg N, Källén K, Olofsson P. Delayed umbilical cord clamping at birth has effects on arterial and venous blood gases and lactate concentrations. BJOG. 2008;115(6):697–703.
- Mokarami P, Wiberg N, Olofsson P. Hidden acidosis: an explanation of acid-base and lactate changes occurring in umbilical cord blood after delayed sampling. BJOG. 2013;120(8):996–1002.
Dr. Ross is Distinguished Professor of Obstetrics and Gynecology and Public Health, Geffen School of Medicine at UCLA, Fielding School of Public Health at UCLA, Department of Obstetrics and Gynecology, Harbor/UCLA Medical Center, Torrance, California.
The author reports no financial relationships relevant to this article.
Umbilical cord blood (cord) gas values can aid both in understanding the cause of an infant’s acidosis and in providing reassurance that acute acidosis or asphyxia is not responsible for a compromised infant with a low Apgar score. Together with other clinical measurements (including fetal heart rate [FHR] tracings, Apgar scores, newborn nucleated red cell counts, and neonatal imaging), cord gas analysis can be remarkably helpful in determining the cause for a depressed newborn. It can help us determine, for example, if infant compromise was a result of an asphyxial event, and we often can differentiate whether the event was acute, prolonged, or occurred prior to presentation in labor. We further can use cord gas values to assess whether a decision for operative intervention for nonreassuring fetal well-being was appropriate (see “Brain injury at birth: Cord gas values presented as evidence at trial”). In addition, cord gas analysis can complement methods for determining fetal acidosis changes during labor, enabling improved assessment of FHR tracings.1−3
At 40 weeks' gestation, a woman presented to the hospital because of decreased fetal movement. On arrival, an external fetal heart-rate (FHR) monitor showed nonreassuring tracings, evidenced by absent to minimal variability and subtle decelerations occurring at 10- to 15-minute intervals. The on-call ObGyn requested induction of labor with oxytocin, and a low-dose infusion (1 mU/min) was initiated. An internal FHR monitor was then placed and late decelerations were observed with the first 2 induced contractions. The oxytocin infusion was discontinued and the ObGyn performed an emergency cesarean delivery. The infant's Apgar scores were 1, 2, and 2 at 1, 5, and 10 minutes, respectively. Cord samples were obtained and values from the umbilical artery were as follows: pH, 6.86; Pco2, 55 mm Hg; Po2, 6 mm Hg; and BDECF, 21.1 mmol/L. Values from the umbilical vein were: pH, 6.94; Pco2, 45 mm Hg; Po2, 17 mm Hg; and BDECF, 20.0 mmol/L. The infant was later diagnosed with a hypoxic brain injury resulting in cerebral palsy. At trial years later, the boy had cognitive and physical limitations and required 24-hour care.
The parents claimed that the ObGyn should have performed a cesarean delivery earlier when the external FHR monitor showed nonreassuring tracings.
The hospital and physician claimed that, while tracings were consistently nonreassuring, they were stable. They maintained that the child's brain damage was not due to a delivery delay, as the severe level of acidosis in both the umbilical artery and vein could not be a result of the few heart rate decelerations during the 2-hour period of monitoring prior to delivery. They argued that the clinical picture indicated a pre-hospital hypoxic event associated with decreased fetal movement.
A defense verdict was returned.
Case assessment
Cord gas results, together with other measures (eg, infant nucleated red blood cells, brain imaging) can aid the ObGyn in medicolegal cases. However, they are not always protective of adverse judgment.
I recommend checking umbilical cord blood gas values on all operative vaginal deliveries, cesarean deliveries for fetal concern, abnormal FHR patterns, clinical chorioamnionitis, multifetal gestations, premature deliveries, and all infants with low Apgar scores at 1 or 5 minutes. If you think you may need a cord gas analysis, go ahead and obtain it. Cord gas analysis often will aid in justifying your management or provide insight into the infant’s status.
Controversy remains as to the benefit of universal cord gas analysis. Assuming a variable cost of $15 for 2 (artery and vein) blood gas samples per neonate,4 the annual cost in the United States would be approximately $60 million. This would likely be cost effective as a result of medicolegal and educational benefits as well as potential improvements in perinatal outcome5 and reductions in special care nursery admissions.4
CASE 1: A newborn with unexpected acidosis
A 29-year-old woman (G2P1) at 38 weeks’ gestation was admitted to the hospital following an office visit during which oligohydramnios (amniotic fluid index, 3.5 cm) was found. The patient had a history of a prior cesarean delivery for failure to progress, and she desired a repeat cesarean delivery. Fetal monitoring revealed a heart rate of 140 beats per minute with moderate variability and uterine contractions every 3 to 5 minutes associated with moderate variable decelerations. A decision was made to proceed with the surgery. Blood samples were drawn for laboratory analysis, monitoring was discontinued, and the patient was taken to the operating room. An epidural anesthetic was placed and the cesarean delivery proceeded.
On uterine incision, there was no evidence of abruption or uterine rupture, but thick meconium-stained amniotic fluid was observed. A depressed infant was delivered, the umbilical cord clamped, and the infant handed to the pediatric team. Cord samples were obtained and values from the umbilical artery were as follows: pH, 6.80; P
What happened?
Read how to use cord gas values in practice
Using cord gas values in practice
Before analyzing the circumstances in Case 1,it is important to consider several key questions, including:
- What are the normal levels of cord pH, O2, CO2, and base deficit (BD)?
- How does cord gas indicate what happened during labor?
- What are the preventable errors in cord gas sampling or interpretation?
For a review of fetal cord gas physiology, see “Physiology of fetal cord gases: The basics”.
A review of basic fetal cord gas physiology will assist in understanding how values are interpreted.
Umbilical cord O2 and CO2
Fetal cord gas values result from the rapid transfer of gases and the slow clearance of acid across the placenta. Approximately 10% of maternal blood flow supplies the uteroplacental circulation, with the near-term placenta receiving approximately 70% of the uterine blood flow.1 Of the oxygen delivered, a surprising 50% provides for placental metabolism and 50% for the fetus. On the fetal side, 40% of fetal cardiac output supplies the umbilical circulation. Oxygen and carbon dioxide pass readily across the placental layers; exchange is limited by the amount of blood flow on both the maternal and the fetal side (flow limited). In the human placenta, maternal blood and fetal blood effectively travel in the same direction (concurrent exchange); thus, umbilical vein O2 and CO2 equilibrate with that in the maternal uterine vein.
Most of the O2 in fetal blood is carried by hemoglobin. Because of the markedly greater affinity of fetal hemoglobin for O2, the saturation curve is shifted to the left, resulting in increased hemoglobin saturation at the relatively low levels of fetal Po2. This greater affinity for oxygen results from the unique fetal hemoglobin gamma (γ) subunit, as compared with the adult beta (ß) subunit. Fetal hemoglobin has a reduced interaction with 2,3-bisphosphoglycerate, which itself decreases the affinity of adult hemoglobin for oxygen.
The majority of CO2 (85%) is carried as part of the bicarbonate buffer system. Fetal CO2 is converted into carbonic acid (H2CO3) in the red cell and dissociates into hydrogen (H+) and bicarbonate (HCO3−) ions, which diffuse out of the cell. When fetal blood reaches the placenta, this process is reversed and CO2 diffuses across the placenta to the maternal circulation. The production of H+ ions from CO2 explains the development of respiratory acidosis from high Pco2. In contrast, anaerobic metabolism, which produces lactic acid, results in metabolic acidosis.
Difference between pH and BD
The pH is calculated as the inverse log of the H+ ion concentration; thus, the pH falls as the H+ ion concentration exponentially increases, whether due to respiratory or metabolic acidosis. To quantify the more important metabolic acidosis, we use BD, which is a measure of how much of bicarbonate buffer base has been used by (lactic) acid. The BD and the base excess (BE) may be used interchangeably, with BE representing a negative number. Although BD represents the metabolic component of acidosis, a correction may be required to account for high levels of fetal Pco2 (see Case 1). In this situation, a more accurate measure is BD extracellular fluid (BDECF).
Why not just use pH? There are 2 major limitations to using pH as a measure of fetal or newborn acidosis. First, pH may be influenced by both respiratory and metabolic alterations, although only metabolic acidosis is associated with fetal neurologic injury.2 Furthermore, as pH is a log function, it does not change linearly with the amount of acid produced. In contrast to pH, BD is a measure of metabolic acidosis and changes in direct proportion to fetal acid production.
What about lactate? Measurements of lactate may also be included in blood gas analyses. Under hypoxic conditions, excess pyruvate is converted into lactate and released from the cell along with H+, resulting in acidosis. However, levels of umbilical cord lactate associated with neonatal hypoxic injury have not been established to the same degree as have pH or BD. Nevertheless, lactate has been measured in fetal scalp blood samples and offers the potential as a marker of fetal hypoxemia and acidosis.3
References
- Assali NS. Dynamics of the uteroplacental circulation in health and disease. Am J Perinatol. 1989;6(2):105-109.
- Low JA, Panagiotopoulos C, Derrick EJ. Newborn complications after intrapartum asphyxia with metabolic acidosis in the term fetus. Am J Obstet Gynecol. 1994;170(4):1081-1087.
- Mancho JP, Gamboa SM, Gimenez OR, Esteras RC, Solanilla BR, Mateo SC. Diagnostic accuracy of fetal scalp lactate for intrapartum acidosis compared with scalp pH [published online ahead of print October 8, 2016]. J Perinatal Med. doi: 10.1515/jpm-2016-004.
Normal values: The “20, 30, 40, 50 rule”
Among the values reported for umbilical blood gas, the pH, P
I recommend using the “20, 30, 40, 50 rule” as a simple tool for remembering normal umbilical artery and vein P
- P
o 2 values are lower than Pco 2 values; thus, the 20 and 30 represent Po 2 values - as fetal umbilical artery P
o 2 is lower than umbilical vein Po 2, 20 mm Hg represents the umbilical artery and 30 mm Hg represents the vein - P
co 2 values are higher in the umbilical artery than in the vein; thus, 50 mm Hg represents the umbilical artery and 40 mm Hg represents the umbilical vein.
Umbilical cord BD values change in relation to labor and FHR decelerations.8 Prior to labor, the normal fetus has a slight degree of acidosis (BD, 2 mmol/L). During the latent phase of labor, fetal BD typically does not change. With the increased frequency of contractions, BD may increase 1 mmol/L for every 3 to 6 hours during the active phase and up to 1 mmol/L per hour during the second stage, depending on FHR responses. Thus, following vaginal delivery the average umbilical artery BD is approximately 5 mmol/L and the umbilical vein BD is approximately 4 mmol/L. As lactate crosses the placenta slowly, BD values are typically only 1 mmol/L less in the umbilical vein than in the artery, unless there has been an obstruction to placental flow (see Case 1).
For pH, the umbilical artery value is always lower than that of the vein, a result of both the higher umbilical artery P
Possible causes of abnormal cord gas values
Because of the nearly fully saturated maternal hemoglobin under normal conditions, fetal arterial and venous P
In contrast, reduced fetal P
Effect of maternal oxygen administration on fetal oxygenation
Although maternal oxygen administration is commonly used during labor and delivery, controversy remains as to the benefit of oxygen supplementation.10 In a normal mother with oxygen saturation above 95%, the administration of oxygen will increase maternal arterial P
However, maternal oxygen supplementation may have marked benefit in cases in which maternal arterial P
How did the Case 1 circumstances lead to newborn acidosis?
Most noticeable in this case is the large difference in BD between the umbilical artery and vein and the high P
Whereas BD normally is only about 1 mmol/L greater in the umbilical artery versus in the vein, occasionally the arterial value is markedly greater than the vein value. This can occur when there is a cessation of blood flow through the placenta, as a result of complete umbilical cord obstruction, or when there is a uterine abruption. In these situations, the umbilical vein (which has not had blood flow) represents the fetal status prior to the occlusion event. In contrast, despite bradycardia, fetal heart pulsations mix blood within the umbilical artery and therefore the artery generally represents the fetal status at the time of birth.
In response to complete cord occlusion, fetal BD increases by approximately 1 mmol/L every 2 minutes. Consequently, an 8 mmol/L difference in BD between the umbilical artery and vein is consistent with a 16-minute period of umbilical occlusion or placental abruption. Also in response to complete umbilical cord occlusion, P
The umbilical vein BD is also elevated for early labor. This value suggests that repetitive, intermittent cord occlusions (evident on the initial fetal monitor tracing) likely resulted in this moderate acidosis prior to the complete cord occlusion in the final 16 minutes.
Thus, BD and P
Read more cases plus procedures, equipment for cord sampling
CASE 2: An infant with unusual umbilical artery values
An infant born via vacuum delivery for a prolonged second stage of labor had 1- and 5-minute Apgar scores of 8 and 9, respectively. Cord gas values were obtained, and analysis revealed that for the umbilical artery, the pH was 7.29; P
The resident asked, “How is the P
The curious Case 2 values suggest an air bubble
Although it is possible that the aberrant values in Case 2 could have resulted from switching the artery and vein samples, the pH is lower in the artery, and both the artery P
Related article:
Is neonatal injury more likely outside of a 30-minute decision-to-incision time interval for cesarean delivery?
CASE 3: A vigorous baby with significant acidosis
A baby with 1- and 5-minute Apgar scores of 9 and 9 was delivered by cesarean and remained vigorous. Umbilical cord analysis revealed an umbilical artery pH level of 7.15, with normal P
Was there a collection error in Case 3?
On occasion, a falsely low pH level and, thus, a falsely elevated BD may result from excessive heparin in the collection syringe. Heparin is acidotic and should be used only to coat the syringe. Although syringes in current use are often pre-heparinized, if one is drawing up heparin into the syringe, it should be coated and then fully expelled.
Umbilical cord sampling: Procedures and equipment
Many issues remain regarding the optimal storage of cord samples. Ideally, a doubly clamped section of the cord promptly should be sampled into glass syringes that can be placed on ice and rapidly measured for cord values.
Stability of umbilical cord samples within the cord is within 20 to 30 minutes. Delayed sampling of clamped cord sections generally has minimal effect on pH and P
Plastic syringes can introduce interference. Several studies have demonstrated that collection of samples in plastic may result in an increase in P
Use glass, and “ice” the sample if necessary. Although it has been suggested that placing samples on ice minimizes metabolism, the cooled plastic may in fact be more susceptible to oxygen diffusion. Thus, unless samples will be analyzed promptly, it is best to use glass syringes on ice.13,14
Related article:
Protecting the newborn brain—the final frontier in obstetric and neonatal care
What if the umbilical cord is torn?
Sometimes the umbilical cord is torn and discarded or cannot be accessed for other reasons. A sample can still be obtained, however, by aspirating the placental surface artery and vein vessels. Although there is some potential variance in pH, P
How do you obtain cord analysis when delaying cord clamping?
The American College of Obstetricians and Gynecologists (ACOG) now advises delayed cord clamping in term and preterm deliveries, which raises the question of how you obtain a blood sample in this setting. Importantly, ACOG recommends delayed cord clamping only in vigorous infants,16 whereas potentially compromised infants should be transferred rapidly for newborn care. Although several studies have demonstrated some variation in cord gas values with delayed cord clamping,17–21 clamping after pulsation has ceased or after the recommended 30 to 60 seconds following birth results in minimal change in BD values. Thus, do not hesitate to perform delayed cord clamping in vigorous infants.
Share your thoughts! Send your Letter to the Editor to rbarbieri@frontlinemedcom.com. Please include your name and the city and state in which you practice.
- Ross MG, Gala R. Use of umbilical artery base excess: algorithm for the timing of hypoxic injury. Am J Obstet Gynecol. 2002;187(1):1–9.
- Uccella S, Cromi A, Colombo G, et al. Prediction of fetal base excess values at birth using an algorithm to interpret fetal heart rate tracings: a retrospective validation. BJOG. 2012;119(13):1657–1664.
- Uccella S, Cromi A, Colombo GF, et al. Interobserver reliability to interpret intrapartum electronic fetal heart rate monitoring: does a standardized algorithm improve agreement among clinicians? J Obstet Gynaecol. 2015;35(3):241–245.
- White CR, Doherty DA, Cannon JW, Kohan R, Newnham JP, Pennell CE. Cost effectiveness of universal umbilical cord blood gas and lactate analysis in a tertiary level maternity unit. J Perinat Med. 2016;44(5):573–584.
- White CR, Doherty DA, Henderson JJ, Kohan R, Newnham JP, Pennell CE. Benefits of introducing universal umbilical cord blood gas and lactate analysis into an obstetric unit. Aust N Z J Obstet Gynaecol. 2010;50(4):318–328.
- Yeomans ER, Hauth JC, Gilstrap LC III, Strickland DM. Umbilical cord pH, Pco2, and bicarbonate following uncomplicated term vaginal deliveries. Am J Obstet Gynecol. 1985;151(6):798–800.
- Wiberg N, Källén K, Olofsson P. Base deficit estimation in umbilical cord blood is influenced by gestational age, choice of fetal fluid compartment, and algorithm for calculation. Am J Obstet Gynecol. 2006;195(6):1651–1656.
- Ross MG, Gala R. Use of umbilical artery base excess: algorithm for the timing of hypoxic injury. Am J Obstet Gynecol. 2002;187(1):1–9.
- Executive summary: Neonatal encephalopathy and neurologic outcome, second edition. Report of the American College of Obstetricians and Gynecologists’ Task Force on Neonatal Encephalopathy. Obstet Gynecol. 2014;123(4):896-901.
- Hamel MS, Anderson BL, Rouse DJ. Oxygen for intrauterine resuscitation: of unproved benefit and potentially harmful. Am J Obstet Gynecol. 2014;211(2):124–127.
- Owen P, Farrell TA, Steyn W. Umbilical cord blood gas analysis; a comparison of two simple methods of sample storage. Early Hum Dev. 1995;42(1):67–71.
- Armstrong L, Stenson B. Effect of delayed sampling on umbilical cord arterial and venous lactate and blood gases in clamped and unclamped vessels. Arch Dis Child Fetal Neonatal Ed. 2006;91(5):F342–F345.
- White CR, Mok T, Doherty DA, Henderson JJ, Newnham JP, Pennell CE. The effect of time, temperature and storage device on umbilical cord blood gas and lactate measurement: a randomized controlled trial. J Matern Fetal Neonatal Med. 2012;25(6):587–594.
- Knowles TP, Mullin RA, Hunter JA, Douce FH. Effects of syringe material, sample storage time, and temperature on blood gases and oxygen saturation in arterialized human blood samples. Respir Care. 2006;51(7):732–736.
- Nodwell A, Carmichael L, Ross M, Richardson B. Placental compared with umbilical cord blood to assess fetal blood gas and acid-base status. Obstet Gynecol. 2005;105(1):129–138.
- American College of Obstetricians and Gynecologists. ACOG Committee Opinion No. 684. Delayed umbilical cord clamping after birth. Obstet Gynecol. 2017;129(1):e5–e10.
- De Paco C, Florido J, Garrido MC, Prados S, Navarrete L. Umbilical cord blood acid-base and gas analysis after early versus delayed cord clamping in neonates at term. Arch Gynecol Obstet. 2011;283(5):1011–1014.
- Valero J, Desantes D, Perales-Puchalt A, Rubio J, Diago Almela VJ, Perales A. Effect of delayed umbilical cord clamping on blood gas analysis. Eur J Obstet Gynecol Reprod Biol. 2012;162(1): 21–23.
- Andersson O, Hellström-Westas L, Andersson D, Clausen J, Domellöf M. Effects of delayed compared with early umbilical cord clamping on maternal postpartum hemorrhage and cord blood gas sampling: a randomized trial. Acta Obstet Gynecol Scand. 2013;92(5):567–574.
- Wiberg N, Källén K, Olofsson P. Delayed umbilical cord clamping at birth has effects on arterial and venous blood gases and lactate concentrations. BJOG. 2008;115(6):697–703.
- Mokarami P, Wiberg N, Olofsson P. Hidden acidosis: an explanation of acid-base and lactate changes occurring in umbilical cord blood after delayed sampling. BJOG. 2013;120(8):996–1002.
- Ross MG, Gala R. Use of umbilical artery base excess: algorithm for the timing of hypoxic injury. Am J Obstet Gynecol. 2002;187(1):1–9.
- Uccella S, Cromi A, Colombo G, et al. Prediction of fetal base excess values at birth using an algorithm to interpret fetal heart rate tracings: a retrospective validation. BJOG. 2012;119(13):1657–1664.
- Uccella S, Cromi A, Colombo GF, et al. Interobserver reliability to interpret intrapartum electronic fetal heart rate monitoring: does a standardized algorithm improve agreement among clinicians? J Obstet Gynaecol. 2015;35(3):241–245.
- White CR, Doherty DA, Cannon JW, Kohan R, Newnham JP, Pennell CE. Cost effectiveness of universal umbilical cord blood gas and lactate analysis in a tertiary level maternity unit. J Perinat Med. 2016;44(5):573–584.
- White CR, Doherty DA, Henderson JJ, Kohan R, Newnham JP, Pennell CE. Benefits of introducing universal umbilical cord blood gas and lactate analysis into an obstetric unit. Aust N Z J Obstet Gynaecol. 2010;50(4):318–328.
- Yeomans ER, Hauth JC, Gilstrap LC III, Strickland DM. Umbilical cord pH, Pco2, and bicarbonate following uncomplicated term vaginal deliveries. Am J Obstet Gynecol. 1985;151(6):798–800.
- Wiberg N, Källén K, Olofsson P. Base deficit estimation in umbilical cord blood is influenced by gestational age, choice of fetal fluid compartment, and algorithm for calculation. Am J Obstet Gynecol. 2006;195(6):1651–1656.
- Ross MG, Gala R. Use of umbilical artery base excess: algorithm for the timing of hypoxic injury. Am J Obstet Gynecol. 2002;187(1):1–9.
- Executive summary: Neonatal encephalopathy and neurologic outcome, second edition. Report of the American College of Obstetricians and Gynecologists’ Task Force on Neonatal Encephalopathy. Obstet Gynecol. 2014;123(4):896-901.
- Hamel MS, Anderson BL, Rouse DJ. Oxygen for intrauterine resuscitation: of unproved benefit and potentially harmful. Am J Obstet Gynecol. 2014;211(2):124–127.
- Owen P, Farrell TA, Steyn W. Umbilical cord blood gas analysis; a comparison of two simple methods of sample storage. Early Hum Dev. 1995;42(1):67–71.
- Armstrong L, Stenson B. Effect of delayed sampling on umbilical cord arterial and venous lactate and blood gases in clamped and unclamped vessels. Arch Dis Child Fetal Neonatal Ed. 2006;91(5):F342–F345.
- White CR, Mok T, Doherty DA, Henderson JJ, Newnham JP, Pennell CE. The effect of time, temperature and storage device on umbilical cord blood gas and lactate measurement: a randomized controlled trial. J Matern Fetal Neonatal Med. 2012;25(6):587–594.
- Knowles TP, Mullin RA, Hunter JA, Douce FH. Effects of syringe material, sample storage time, and temperature on blood gases and oxygen saturation in arterialized human blood samples. Respir Care. 2006;51(7):732–736.
- Nodwell A, Carmichael L, Ross M, Richardson B. Placental compared with umbilical cord blood to assess fetal blood gas and acid-base status. Obstet Gynecol. 2005;105(1):129–138.
- American College of Obstetricians and Gynecologists. ACOG Committee Opinion No. 684. Delayed umbilical cord clamping after birth. Obstet Gynecol. 2017;129(1):e5–e10.
- De Paco C, Florido J, Garrido MC, Prados S, Navarrete L. Umbilical cord blood acid-base and gas analysis after early versus delayed cord clamping in neonates at term. Arch Gynecol Obstet. 2011;283(5):1011–1014.
- Valero J, Desantes D, Perales-Puchalt A, Rubio J, Diago Almela VJ, Perales A. Effect of delayed umbilical cord clamping on blood gas analysis. Eur J Obstet Gynecol Reprod Biol. 2012;162(1): 21–23.
- Andersson O, Hellström-Westas L, Andersson D, Clausen J, Domellöf M. Effects of delayed compared with early umbilical cord clamping on maternal postpartum hemorrhage and cord blood gas sampling: a randomized trial. Acta Obstet Gynecol Scand. 2013;92(5):567–574.
- Wiberg N, Källén K, Olofsson P. Delayed umbilical cord clamping at birth has effects on arterial and venous blood gases and lactate concentrations. BJOG. 2008;115(6):697–703.
- Mokarami P, Wiberg N, Olofsson P. Hidden acidosis: an explanation of acid-base and lactate changes occurring in umbilical cord blood after delayed sampling. BJOG. 2013;120(8):996–1002.
Examining the fetal origins of obesity
The figures and trends behind the obesity epidemic are alarming: More than one-third of all adults in the United States are obese, as are 34% of women aged 20-39, and 17% of youth aged 2-19, according to data for 2011-2014 from the National Health and Nutrition Examination Survey.
In our ob.gyn. practices, many of us have witnessed the significant climb in national obesity rates over the past several decades. We’ve seen a continued increase in the prevalence of obesity among childbearing women, and a steady increase in the incidence of high-birth-weight babies. The percentage of women weighing 200 pounds has more than doubled since 1980, and up to 3-4 times as many children and teens in various age subsets are obese today as in the 1970s.

The obesity epidemic is often attributed to a high-fat and/or calorie-dense diet and decreased activity levels. However, this is only part of the picture. There has been growing recognition in recent years that obesity may be programmed by the in utero and newborn environment, particularly as it relates to nutritional permutations. We now have evidence, in fact, that developmental programming is likely a primary cause of the obesity epidemic.
Exposure to maternal obesity and being born with a low birth weight – especially a low birth weight paired with rapid catch-up growth – are both associated with a significantly increased risk of childhood and adult obesity.
Research has demonstrated that newborns may be programmed, in both of these scenarios, with an increased appetite and a predisposition to storing calories as fat. In addition, data are accumulating that exposure to bisphenol A and other endocrine-disruptive chemicals, other environmental toxins, and corticosteroids may exert similar programming effects.
This window into the origins of obesity has significant implications for the practice of ob.gyn., where we have the opportunity to address the programming effects of the in utero and early life environment. Most importantly, we must counsel women before pregnancy about the importance of losing weight, guide them during pregnancy to achieve optimal pregnancy nutrition and weight gain, and prepare them to adopt optimal newborn feeding strategies that will guard against overconsumption.
Programming of obesity
The current obesity epidemic is only minimally due to genetics. Although select genetic mutations may be associated with obesity, these mutations account for an exceedingly small proportion of the obese population. Instead, much of the obesity epidemic involves epigenetic change – in this case, largely epigenetic deregulation of gene expression – and more broadly what we call gestational, or developmental, programming.
Developmental programming is a process by which a stress or stimulus at a critical or sensitive period of development has long-term effects. The major part of the developmental process pertaining to cell division occurs during intrauterine life; more than 90% of the cell divisions necessary to make an adult human occur before birth. Although there are important effects of the early newborn period, developmental programming is therefore largely gestational programming. Depending on when an in utero stress or perturbation occurs, it may permanently change cell number and/or cell differentiation, organ structure, metabolic set points, and gene expression.

The late physician Dr. David Barker got us thinking about in utero programming when he demonstrated an association between low birth weight, rapid weight gain in early life, and adult cardiovascular mortality. His theory about how nutrition and growth before birth may affect cardiovascular health later on, as well as other adult chronic diseases and conditions, became known as the Barker Hypothesis.
Many studies, both animal research and human epidemiological studies, have since confirmed and expanded our understanding of this phenomena. Research has demonstrated associations, for instance, between low birth weight and later risks of insulin resistance, diabetes, fatty liver, and the often-underlying metabolic syndrome.
Obesity is also central to the development of the metabolic syndrome, and we now have irrefutable evidence to show that low birth weight infants have a higher risk of obesity than do normal weight infants. We also know, as Dr. Barker and his colleagues had surmised, that the greatest risks occur when there is rapid catch-up growth of low-birth-weight infants in the early years of life.
Moreover, we now understand that maternal obesity has programming effects that are similar to those of an in utero environment of undernutrition and growth restriction. In the past several decades, the marked increase in maternal obesity has resulted in this programming process having an ever-increasing impact.
Both animal and human studies have shown that infants born to obese mothers have the same increased risks for adult chronic disease – including the risk of becoming obese – as those of low birth weight infants. This increased risk is often, but not always, associated with high birth weight, and it is independent of whether the mother has gestational diabetes mellitus (GDM). Having a high birth weight is more likely in the setting of maternal obesity and itself raises the risk of eventual obesity (as does GDM), but an infant’s exposure to maternal obesity in and of itself is a risk factor.
The mechanisms
The programming mechanisms that predispose offspring to obesity are similar in infants of obese mothers and intrauterine growth restricted newborns, though they involve different epigenetic signals. Both involve dysregulation of appetite/satiety and of adipogenesis.
Appetite is primarily controlled by a complex circuit of neurons in the hypothalamus of the brain called the hypothalamic arcuate nucleus. Some neurons are orexigenic and stimulate or increase appetite, while others are anorexigenic and suppress appetite by promoting satiety.
During fetal development, hypothalamic neural stem cells proliferate and differentiate into various cell types. Neurons destined for the arcuate nucleus then differentiate into these so-called appetite neurons and satiety neurons. Though there is continued neural development and maturation during newborn life, hypothalamic control of appetite and satiety is largely set during this period.
Differentiation to appetite or satiety neurons is regulated by a complex interplay of pathways that may be significantly altered by the nutrient environment. Research in our laboratory and others has shown that both limited and excess nutrition can program the structure and function of the arcuate nucleus – changing its wiring, in essence – such that there is an increased ratio of appetite to satiety neurons (Clin Obstet Gynecol. 2013 Sep;56[3]:529-36).
There also appears to be a programmed down-regulation in the reward pathway of the brain, and some studies have shown that children of obese mothers and children who were born with low birth weights have a higher preference for sweet and high-calorie foods. This all begins at the neural stem cell level.

With more appetite neurons and fewer satiety neurons, as well as a down-regulation of reward – and an abundance of available food – a newborn is at high risk of becoming obese. Eating for this child will not only be pleasurable; it will be driven by an enhanced appetite, an inability to feel full after reasonable amounts of food, and a down-regulation of reward (potentially requiring greater amounts of food or a shift in preference for high fat/sweet food to achieve the pleasure from eating).
In addition to alterations in appetite/satiety, the nutrition environment in utero can alter adipose tissue development and function.
Like neural development, adipogenesis – the process by which preadipocytes proliferate and differentiate into mature adipocytes – is tightly regulated by a cascade of transcription factors that are expressed in response to stimuli, including nutrients. In animal studies we have found an up-regulation of adipogenic and lipogenic transcription factors in intrauterine growth restricted offspring as well as in offspring of obese mothers (Reprod Sci. 2008 Oct;15[8]:785-96 and Curr Diab Rep. 2013 Feb;13[1]:27-33).
This up-regulation leads to greater proliferation of preadipocytes and greater lipid synthesis and storage in mature adipocytes. Not only will the newborn have an increased number of adipocytes, but he or she will have an increased number of hypertrophic lipid-filled fat cells. The enhanced adipogenesis will contribute to the newborn’s programmed propensity for obesity, and the directive to “just eat less” will likely be ineffective throughout childhood and beyond.
Programmed offspring are resistant to both central and peripheral effects of leptin and insulin, resulting in impaired satiety (i.e., overeating) and manifestations of GDM. Responses to an array of additional energy regulatory factors (e.g., ghrelin) demonstrate a similar programmed dysfunction.
In practice
There are several approaches that ob.gyns. can take to prevent childhood and lifelong obesity. Most importantly, we must counsel our obese patients to lose weight before pregnancy. In doing so, it may be meaningful and effective to ask the patient to think about her baby’s future as an obese adult.
Patients who have experienced the challenges of trying to lose weight, and who are told about the developmental origins of obesity and how obesity can be programmed, may be more motivated to lose weight to avoid passing on to their children the burden and challenges that they’ve experienced. We can tell obese patients that their children may well be predisposed through the current in utero environment to have an increased appetite and a propensity to store body fat, and that they subsequently will face higher risks of diabetes and other serious chronic conditions.
We should also appropriately counsel women on healthy weight gain during pregnancy, and urge them not to gain excessive weight.
Newborn feeding strategies are also important for babies exposed to gestational programming of obesity, but especially small babies given the high risk of obesity when there is rapid catch-up growth. We must encourage good growth of both the low-birth-weight and macrosomic infant during the newborn period, but not overgrowth.
The importance of breastfeeding cannot be overestimated, as it has been demonstrated to reduce the occurrence of excessive newborn weight gain and improve long term infant health. We should encourage breastfeeding for the natural opportunity it provides to avoid excessive feeding, in addition to its other benefits. And for newborns who are bottle fed, we should counsel the new mother on optimal feeding and strategies for comforting a crying baby, which will protect against overfeeding.
Regarding environmental exposures, this area of developmental programming is continuing to evolve at a rapid rate. Both animal research and epidemiological studies support the association of developmental exposure to BPA and other chemicals with obesity.
For the present, we should educate our patients regarding optimal nutrition prior to and during pregnancy, and the avoidance of potentially toxic or metabolically-active chemicals or drugs. We look forward to continued research into the mechanisms and preventive/therapeutic strategies for optimization of childhood and adult health.
Dr. Ross is professor of obstetrics and gynecology at the University of California, Los Angeles. Dr. Desai is assistant professor of ob.gyn. at the university. They reported having no relevant financial disclosures.
The figures and trends behind the obesity epidemic are alarming: More than one-third of all adults in the United States are obese, as are 34% of women aged 20-39, and 17% of youth aged 2-19, according to data for 2011-2014 from the National Health and Nutrition Examination Survey.
In our ob.gyn. practices, many of us have witnessed the significant climb in national obesity rates over the past several decades. We’ve seen a continued increase in the prevalence of obesity among childbearing women, and a steady increase in the incidence of high-birth-weight babies. The percentage of women weighing 200 pounds has more than doubled since 1980, and up to 3-4 times as many children and teens in various age subsets are obese today as in the 1970s.
The obesity epidemic is often attributed to a high-fat and/or calorie-dense diet and decreased activity levels. However, this is only part of the picture. There has been growing recognition in recent years that obesity may be programmed by the in utero and newborn environment, particularly as it relates to nutritional permutations. We now have evidence, in fact, that developmental programming is likely a primary cause of the obesity epidemic.
Exposure to maternal obesity and being born with a low birth weight – especially a low birth weight paired with rapid catch-up growth – are both associated with a significantly increased risk of childhood and adult obesity.
Research has demonstrated that newborns may be programmed, in both of these scenarios, with an increased appetite and a predisposition to storing calories as fat. In addition, data are accumulating that exposure to bisphenol A and other endocrine-disruptive chemicals, other environmental toxins, and corticosteroids may exert similar programming effects.
This window into the origins of obesity has significant implications for the practice of ob.gyn., where we have the opportunity to address the programming effects of the in utero and early life environment. Most importantly, we must counsel women before pregnancy about the importance of losing weight, guide them during pregnancy to achieve optimal pregnancy nutrition and weight gain, and prepare them to adopt optimal newborn feeding strategies that will guard against overconsumption.
Programming of obesity
The current obesity epidemic is only minimally due to genetics. Although select genetic mutations may be associated with obesity, these mutations account for an exceedingly small proportion of the obese population. Instead, much of the obesity epidemic involves epigenetic change – in this case, largely epigenetic deregulation of gene expression – and more broadly what we call gestational, or developmental, programming.
Developmental programming is a process by which a stress or stimulus at a critical or sensitive period of development has long-term effects. The major part of the developmental process pertaining to cell division occurs during intrauterine life; more than 90% of the cell divisions necessary to make an adult human occur before birth. Although there are important effects of the early newborn period, developmental programming is therefore largely gestational programming. Depending on when an in utero stress or perturbation occurs, it may permanently change cell number and/or cell differentiation, organ structure, metabolic set points, and gene expression.
The late physician Dr. David Barker got us thinking about in utero programming when he demonstrated an association between low birth weight, rapid weight gain in early life, and adult cardiovascular mortality. His theory about how nutrition and growth before birth may affect cardiovascular health later on, as well as other adult chronic diseases and conditions, became known as the Barker Hypothesis.
Many studies, both animal research and human epidemiological studies, have since confirmed and expanded our understanding of this phenomena. Research has demonstrated associations, for instance, between low birth weight and later risks of insulin resistance, diabetes, fatty liver, and the often-underlying metabolic syndrome.
Obesity is also central to the development of the metabolic syndrome, and we now have irrefutable evidence to show that low birth weight infants have a higher risk of obesity than do normal weight infants. We also know, as Dr. Barker and his colleagues had surmised, that the greatest risks occur when there is rapid catch-up growth of low-birth-weight infants in the early years of life.
Moreover, we now understand that maternal obesity has programming effects that are similar to those of an in utero environment of undernutrition and growth restriction. In the past several decades, the marked increase in maternal obesity has resulted in this programming process having an ever-increasing impact.
Both animal and human studies have shown that infants born to obese mothers have the same increased risks for adult chronic disease – including the risk of becoming obese – as those of low birth weight infants. This increased risk is often, but not always, associated with high birth weight, and it is independent of whether the mother has gestational diabetes mellitus (GDM). Having a high birth weight is more likely in the setting of maternal obesity and itself raises the risk of eventual obesity (as does GDM), but an infant’s exposure to maternal obesity in and of itself is a risk factor.
The mechanisms
The programming mechanisms that predispose offspring to obesity are similar in infants of obese mothers and intrauterine growth restricted newborns, though they involve different epigenetic signals. Both involve dysregulation of appetite/satiety and of adipogenesis.
Appetite is primarily controlled by a complex circuit of neurons in the hypothalamus of the brain called the hypothalamic arcuate nucleus. Some neurons are orexigenic and stimulate or increase appetite, while others are anorexigenic and suppress appetite by promoting satiety.
During fetal development, hypothalamic neural stem cells proliferate and differentiate into various cell types. Neurons destined for the arcuate nucleus then differentiate into these so-called appetite neurons and satiety neurons. Though there is continued neural development and maturation during newborn life, hypothalamic control of appetite and satiety is largely set during this period.
Differentiation to appetite or satiety neurons is regulated by a complex interplay of pathways that may be significantly altered by the nutrient environment. Research in our laboratory and others has shown that both limited and excess nutrition can program the structure and function of the arcuate nucleus – changing its wiring, in essence – such that there is an increased ratio of appetite to satiety neurons (Clin Obstet Gynecol. 2013 Sep;56[3]:529-36).
There also appears to be a programmed down-regulation in the reward pathway of the brain, and some studies have shown that children of obese mothers and children who were born with low birth weights have a higher preference for sweet and high-calorie foods. This all begins at the neural stem cell level.
With more appetite neurons and fewer satiety neurons, as well as a down-regulation of reward – and an abundance of available food – a newborn is at high risk of becoming obese. Eating for this child will not only be pleasurable; it will be driven by an enhanced appetite, an inability to feel full after reasonable amounts of food, and a down-regulation of reward (potentially requiring greater amounts of food or a shift in preference for high fat/sweet food to achieve the pleasure from eating).
In addition to alterations in appetite/satiety, the nutrition environment in utero can alter adipose tissue development and function.
Like neural development, adipogenesis – the process by which preadipocytes proliferate and differentiate into mature adipocytes – is tightly regulated by a cascade of transcription factors that are expressed in response to stimuli, including nutrients. In animal studies we have found an up-regulation of adipogenic and lipogenic transcription factors in intrauterine growth restricted offspring as well as in offspring of obese mothers (Reprod Sci. 2008 Oct;15[8]:785-96 and Curr Diab Rep. 2013 Feb;13[1]:27-33).
This up-regulation leads to greater proliferation of preadipocytes and greater lipid synthesis and storage in mature adipocytes. Not only will the newborn have an increased number of adipocytes, but he or she will have an increased number of hypertrophic lipid-filled fat cells. The enhanced adipogenesis will contribute to the newborn’s programmed propensity for obesity, and the directive to “just eat less” will likely be ineffective throughout childhood and beyond.
Programmed offspring are resistant to both central and peripheral effects of leptin and insulin, resulting in impaired satiety (i.e., overeating) and manifestations of GDM. Responses to an array of additional energy regulatory factors (e.g., ghrelin) demonstrate a similar programmed dysfunction.
In practice
There are several approaches that ob.gyns. can take to prevent childhood and lifelong obesity. Most importantly, we must counsel our obese patients to lose weight before pregnancy. In doing so, it may be meaningful and effective to ask the patient to think about her baby’s future as an obese adult.
Patients who have experienced the challenges of trying to lose weight, and who are told about the developmental origins of obesity and how obesity can be programmed, may be more motivated to lose weight to avoid passing on to their children the burden and challenges that they’ve experienced. We can tell obese patients that their children may well be predisposed through the current in utero environment to have an increased appetite and a propensity to store body fat, and that they subsequently will face higher risks of diabetes and other serious chronic conditions.
We should also appropriately counsel women on healthy weight gain during pregnancy, and urge them not to gain excessive weight.
Newborn feeding strategies are also important for babies exposed to gestational programming of obesity, but especially small babies given the high risk of obesity when there is rapid catch-up growth. We must encourage good growth of both the low-birth-weight and macrosomic infant during the newborn period, but not overgrowth.
The importance of breastfeeding cannot be overestimated, as it has been demonstrated to reduce the occurrence of excessive newborn weight gain and improve long term infant health. We should encourage breastfeeding for the natural opportunity it provides to avoid excessive feeding, in addition to its other benefits. And for newborns who are bottle fed, we should counsel the new mother on optimal feeding and strategies for comforting a crying baby, which will protect against overfeeding.
Regarding environmental exposures, this area of developmental programming is continuing to evolve at a rapid rate. Both animal research and epidemiological studies support the association of developmental exposure to BPA and other chemicals with obesity.
For the present, we should educate our patients regarding optimal nutrition prior to and during pregnancy, and the avoidance of potentially toxic or metabolically-active chemicals or drugs. We look forward to continued research into the mechanisms and preventive/therapeutic strategies for optimization of childhood and adult health.
Dr. Ross is professor of obstetrics and gynecology at the University of California, Los Angeles. Dr. Desai is assistant professor of ob.gyn. at the university. They reported having no relevant financial disclosures.