User login
Relationships Between Residence Characteristics and Nursing Home Compare Database Quality Measures
From the University of Nebraska, Lincoln (Mr. Puckett and Dr. Ryherd), University of Nebraska Medical Center, Omaha (Dr. Manley), and the University of Nebraska, Omaha (Dr. Ryan).
ABSTRACT
Objective: This study evaluated relationships between physical characteristics of nursing home residences and quality-of-care measures.
Design: This was a cross-sectional ecologic study. The dependent variables were 5 Centers for Medicare & Medicaid Services (CMS) Nursing Home Compare database long-stay quality measures (QMs) during 2019: percentage of residents who displayed depressive symptoms, percentage of residents who were physically restrained, percentage of residents who experienced 1 or more falls resulting in injury, percentage of residents who received antipsychotic medication, and percentage of residents who received anti-anxiety medication. The independent variables were 4 residence characteristics: ownership type, size, occupancy, and region within the United States. We explored how different types of each residence characteristic compare for each QM.
Setting, participants, and measurements: Quality measure values from 15,420 CMS-supported nursing homes across the United States averaged over the 4 quarters of 2019 reporting were used. Welch’s analysis of variance was performed to examine whether the mean QM values for groups within each residential characteristic were statistically different.
Results: Publicly owned and low-occupancy residences had the highest mean QM values, indicating the poorest performance. Nonprofit and high-occupancy residences generally had the lowest (ie, best) mean QM values. There were significant differences in mean QM values among nursing home sizes and regions.
Conclusion: This study suggests that residence characteristics are related to 5 nursing home QMs. Results suggest that physical characteristics may be related to overall quality of life in nursing homes.
Keywords: quality of care, quality measures, residence characteristics, Alzheimer’s disease and related dementias.
More than 55 million people worldwide are living with Alzheimer’s disease and related dementias (ADRD).1 With the aging of the Baby Boomer population, this number is expected to rise to more than 78 million worldwide by 2030.1 Given the growing number of cognitively impaired older adults, there is an increased need for residences designed for the specialized care of this population. Although there are dozens of living options for the elderly, and although most specialized establishments have the resources to meet the immediate needs of their residents, many facilities lack universal design features that support a high quality of life for someone with ADRD or mild cognitive impairment. Previous research has shown relationships between behavioral and psychological symptoms of dementia (BPSD) and environmental characteristics such as acoustics, lighting, and indoor air temperature.2,3 Physical behaviors of BPSD, including aggression and wandering, and psychological symptoms, such as depression, anxiety, and delusions, put residents at risk of injury.4 Additionally, BPSD is correlated with caregiver burden and stress.5-8 Patients with dementia may also experience a lower stress threshold, changes in perception of space, and decreased short-term memory, creating environmental difficulties for those with ADRD9 that lead them to exhibit BPSD due to poor environmental design. Thus, there is a need to learn more about design features that minimize BPSD and promote a high quality of life for those with ADRD.10
Although research has shown relationships between physical environmental characteristics and BPSD, in this work we study relationships between possible BPSD indicators and 4 residence-level characteristics: ownership type, size, occupancy, and region in the United States (determined by location of the Centers for Medicare & Medicaid Services [CMS] regional offices). We analyzed data from the CMS Nursing Home Compare database for the year 2019.11 This database publishes quarterly data and star ratings for quality-of-care measures (QMs), staffing levels, and health inspections for every nursing home supported by CMS. Previous research has investigated the accuracy of QM reporting for resident falls, the impact of residential characteristics on administration of antipsychotic medication, the influence of profit status on resident outcomes and quality of care, and the effect of nursing home size on quality of life.12-16 Additionally, research suggests that residential characteristics such as size and location could be associated with infection control in nursing homes.17
Certain QMs, such as psychotropic drug administration, resident falls, and physical restraint, provide indicators of agitation, disorientation, or aggression, which are often signals of BPSD episodes. We hypothesized that residence types are associated with different QM scores, which could indicate different occurrences of BPSD. We selected 5 QMs for long-stay residents that could potentially be used as indicators of BPSD. Short-stay resident data were not included in this work to control for BPSD that could be a result of sheer unfamiliarity with the environment and confusion from being in a new home.
Methods
Design and Data Collection
This was a cross-sectional ecologic study aimed at exploring relationships between aggregate residential characteristics and QMs. Data were retrieved from the 2019 annual archives found in the CMS provider data catalog on nursing homes, including rehabilitation services.11 The dataset provides general residence information, such as ownership, number of beds, number of residents, and location, as well as residence quality metrics, such as QMs, staffing data, and inspection data. Residence characteristics and 4-quarter averages of QMs were retrieved and used as cross-sectional data. The data used are from 15,420 residences across the United States. Nursing homes located in Guam, the US Pacific Territories, Puerto Rico, and the US Virgin Islands, while supported by CMS and included in the dataset, were excluded from the study due to a severe absence of QM data.
Dependent Variables
We investigated 5 QMs that were averaged across the 4 quarters of 2019. The QMs used as dependent variables were percentage of residents who displayed depressive symptoms (depression), percentage of residents who were physically restrained (restraint), percentage of residents who experienced 1 or more falls resulting in a major injury (falls), percentage of residents who received antipsychotic medication (antipsychotic medication), and percentage of residents who received anti-anxiety or hypnotic medication (anti-anxiety medication).
A total of 2471 QM values were unreported across the 5 QM analyzed: 501 residences did not report depression data; 479 did not report restraint data; 477 did not report falls data; 508 did not report antipsychotic medication data; and 506 did not report anti-anxiety medication data. A residence with a missing QM value was excluded from that respective analysis.
To assess the relationships among the different QMs, a Pearson correlation coefficient r was computed for each unique pair of QMs (Figure). All QMs studied were found to be very weakly or weakly correlated with one another using the Evans classification for very weak and weak correlations (r < 0.20 and 0.20 < r < 0.39, respectively).18

Independent Variables
A total of 15,420 residences were included in the study. Seventy-nine residences did not report occupancy data, however, so those residences were excluded from the occupancy analyses. We categorized the ownership of each nursing home as for-profit, nonprofit, or public. We categorized nursing home size, based on quartiles of the size distribution, as large (> 127 beds), medium (64 to 126 beds), and small (< 64 beds). This method for categorizing the residential characteristics was similar to that used in previous work.19 Similarly, we categorized nursing home occupancy as high (> 92% occupancy), medium (73% to 91% occupancy), and low (< 73% occupancy) based on quartiles of the occupancy distribution. For the regional analysis, we grouped states together based on the CMS regional offices: Atlanta, Georgia; Boston, Massachusetts; Chicago, Illinois; Dallas, Texas; Denver, Colorado; Kansas City, Missouri; New York, New York; Philadelphia, Pennsylvania; San Francisco, California; and Seattle, Washington.20
Analyses
We used Levene’s test to determine whether variances among the residential groups were equal for each QM, using an a priori α = 0.05. For all 20 tests conducted (4 residential characteristics for all 5 QMs), the resulting F-statistics were significant, indicating that the assumption of homogeneity of variance was not met.
We therefore used Welch’s analysis of variance (ANOVA) to evaluate whether the groups within each residential characteristic were the same on their QM means. For example, we tested whether for-profit, nonprofit, and public residences had significantly different mean depression rates. For statistically significant differences, a Games-Howell post-hoc test was conducted to test the difference between all unique pairwise comparisons. An a priori α = 0.05 was used for both Welch’s ANOVA and post-hoc testing. All analyses were conducted in RStudio Version 1.2.5033 (Posit Software, PBC).
Results
Mean Differences
Mean QM scores for the 5 QMs investigated, grouped by residential characteristic for the 2019 year of reporting, are shown in Table 1. It should be noted that the number of residences that reported occupancy data (n = 15,341) does not equal the total number of residences included in the study (N = 15,420) because 79 residences did not report occupancy data. For all QMs reported in Table 1, lower scores are better. Table 2 and Table 3 show results from pairwise comparisons of mean differences for the different residential characteristic and QM groupings. Mean differences and 95% CI are presented along with an indication of statistical significance (when applicable).

Ownership
Nonprofit residences had significantly lower (ie, better) mean scores than for-profit and public residences for 3 QMs: resident depression, antipsychotic medication use, and anti-anxiety medication use. For-profit and public residences did not significantly differ in their mean values for these QMs. For-profit residences had a significantly lower mean score for resident falls than both nonprofit and public residences, but no significant difference existed between scores for nonprofit and public residence falls. There were no statistically significant differences between mean restraint scores among the ownership types.

Size
Large (ie, high-capacity) residences had a significantly higher mean depression score than both medium and small residences, but there was not a significant difference between medium and small residences. Large residences had the significantly lowest mean score for resident falls, and medium residences scored significantly lower than small residences. Medium residences had a significantly higher mean score for anti-anxiety medication use than both small and large residences, but there was no significant difference between small and large residences. There were no statistically significant differences between mean scores for restraint and antipsychotic medication use among the nursing home sizes.

Occupancy
The mean scores for 4 out of the 5 QMs exhibited similar relationships with occupancy rates: resident depression, falls, and antipsychotic and anti-anxiety medication use. Low-occupancy residences consistently scored significantly higher than both medium- and high-occupancy residences, and medium-occupancy residences consistently scored significantly higher than high-occupancy residences. On average, high-occupancy (≥ 92%) residences reported better QM scores than low-occupancy (< 73%) and medium-occupancy (73% to 91%) residences for all the QMs studied except physical restraint, which yielded no significant results. These findings indicate a possible inverse relationship between building occupancy rate and these 4 QMs.
Region
Pairwise comparisons of mean QM scores by region are shown in Table 3. The Chicago region had a significantly higher mean depression score than all other regions, while the San Francisco region’s score was significantly lower than all other regions, except Atlanta and Boston. The Kansas City region had a significantly higher mean score for resident falls than all other regions, with the exception of Denver, and the San Francisco region scored significantly lower than all other regions in falls. The Boston region had a significantly higher mean score for administering antipsychotic medication than all other regions, except for Kansas City and Seattle, and the New York and San Francisco regions both had significantly lower scores than all other regions except for each other. The Atlanta region reported a significantly higher mean score for administering antianxiety medication than all other regions, and the Seattle region’s score for anti-anxiety medication use was significantly lower than all other regions except for San Francisco.
Discussion
This study presented mean percentages for 5 QMs reported in the Nursing Home Compare database for the year 2019: depression, restraint, falls, antipsychotic medication use, and anti-anxiety medication use. We investigated these scores by 4 residential characteristics: ownership type, size, occupancy, and region. In general, publicly owned and low-occupancy residences had the highest scores, and thus the poorest performances, for the 5 chosen QMs during 2019. Nonprofit and high-occupancy residences generally had the lowest (ie, better) scores, and this result agrees with previous findings on long-stay nursing home residents.21 One possible explanation for better performance by high-occupancy buildings could be that increased social interaction is beneficial to nursing home residents as compared with low-occupancy buildings, where less social interaction is probable. It is difficult to draw conclusions regarding nursing home size and region; however, there are significant differences among sizes for 3 out of the 5 QMs and significant differences among regions for all 5 QMs. The analyses suggest that residence-level characteristics are related to QM scores. Although reported QMs are not a direct representation of resident quality of life, this work agrees with previous research that residential characteristics have some impact on the lives of nursing home residents.13-17 Improvements in QM reporting and changes in quality improvement goals since the formation of Nursing Home Compare exist, suggesting that nursing homes’ awareness of their reporting duties may impact quality of care or reporting tendencies.21,22 Future research should consider investigating the impacts of the COVID-19 pandemic on quality-reporting trends and QM scores.
Other physical characteristics of nursing homes, such as noise, lighting levels, and air quality, may also have an impact on QMs and possibly nursing home residents themselves. This type of data exploration could be included in future research. Additionally, future research could include a similar analysis over a longer period, rather than the 1-year period examined here, to investigate which types of residences consistently have high or low scores or how different types of residences have evolved over the years, particularly considering the impact of the COVID-19 pandemic. Information such as staffing levels, building renovations, and inspection data could be accounted for in future studies. Different QMs could also be investigated to better understand the influence of residential characteristics on quality of care.
Conclusion
This study suggests that residence-level characteristics are related to 5 reported nursing home QMs. Overall, nonprofit and high-occupancy residences had the lowest QM scores, indicating the highest performance. Although the results do not necessarily suggest that residence-level characteristics impact individual nursing home residents’ quality of life, they suggest that physical characteristics affect overall quality of life in nursing homes. Future research is needed to determine the specific physical characteristics of these residences that affect QM scores.
Corresponding author: Brian J. Puckett, puckett.brian@huskers.unl.edu.
Disclosures: None reported.
1. Gauthier S, Rosa-Neto P, Morais JA, et al. World Alzheimer report 2021: journey through the diagnosis of dementia. Alzheimer’s Disease International; 2021.
2. Garre-Olmo J, López-Pousa S, Turon-Estrada A, et al. Environmental determinants of quality of life in nursing home residents with severe dementia. J Am Geriatr Soc. 2012;60(7):1230-1236. doi:10.1111/j.1532-5415.2012.04040.x
3. Zeisel J, Silverstein N, Hyde J, et al. Environmental correlates to behavioral health outcomes in Alzheimer’s special care units. Gerontologist. 2003;43(5):697-711. doi:10.1093/geront/43.5.697
4. Brawley E. Environmental design for Alzheimer’s disease: a quality of life issue. Aging Ment Health. 2001;5(1):S79-S83. doi:10.1080/13607860120044846
5. Joosse L. Do sound levels and space contribute to agitation in nursing home residents with dementia? Research Gerontol Nurs. 2012;5(3):174-184. doi:10.3928/19404921-20120605-02
6. Dowling G, Graf C, Hubbard E, et al. Light treatment for neuropsychiatric behaviors in Alzheimer’s disease. Western J Nurs Res. 2007;29(8):961-975. doi:10.1177/0193945907303083
7. Tartarini F, Cooper P, Fleming R, et al. Indoor air temperature and agitation of nursing home residents with dementia. Am J Alzheimers Dis Other Demen. 2017;32(5):272-281. doi:10.1177/1533317517704898
8. Miyamoto Y, Tachimori H, Ito H. Formal caregiver burden in dementia: impact of behavioral and psychological symptoms of dementia and activities of daily living. Geriatr Nurs. 2010;31(4):246-253. doi:10.1016/j.gerinurse.2010.01.002
9. Dementia care and the built environment: position paper 3. Alzheimer’s Australia; 2004.
10. Cloak N, Al Khalili Y. Behavioral and psychological symptoms in dementia. Updated July 21, 2022. In: StatPearls [Internet]. StatPearls Publishing; 2022.
11. Centers for Medicare & Medicaid Services. Nursing homes including rehab services data archive. 2019 annual files. Accessed January 30, 2023. https://data.cms.gov/provider-data/archived-data/nursing-homes
12. Sanghavi P, Pan S, Caudry D. Assessment of nursing home reporting of major injury falls for quality measurement on Nursing Home Compare. Health Serv Res. 2020;55(2):201-210. doi:10.1111/1475-6773.13247
13. Hughes C, Lapane K, Mor V. Influence of facility characteristics on use of antipsychotic medications in nursing homes. Med Care. 2000;38(12):1164-1173. doi:10.1097/00005650-200012000-00003
14. Aaronson W, Zinn J, Rosko M. Do for-profit and not-for-profit nursing homes behave differently? Gerontologist. 1994;34(6):775-786. doi:10.1093/geront/34.6.775
15. O’Neill C, Harrington C, Kitchener M, et al. Quality of care in nursing homes: an analysis of relationships among profit, quality, and ownership. Med Care. 2003;41(12):1318-1330. doi:10.1097/01.MLR.0000100586.33970.58
16. Allen PD, Klein WC, Gruman C. Correlates of complaints made to the Connecticut Long-Term Care Ombudsman program: the role of organizational and structural factors. Res Aging. 2003;25(6):631-654. doi:10.1177/0164027503256691
17. Abrams H, Loomer L, Gandhi A, et al. Characteristics of U.S. nursing homes with COVID-19 cases. J Am Geriatr Soc. 2020;68(8):1653-1656. doi:10.1111/jgs.16661
18. Evans JD. Straightforward Statistics for the Behavioral Sciences. Thomson Brooks/Cole Publishing Co; 1996.
19. Zinn J, Spector W, Hsieh L, et al. Do trends in the reporting of quality measures on the Nursing Home Compare web site differ by nursing home characteristics? Gerontologist. 2005;45(6):720-730.
20. Centers for Medicare & Medicaid Services. CMS Regional Offices. Accessed January 30, 2023. https://www.cms.gov/Medicare/Coding/ICD10/CMS-Regional-Offices
21. Mukamel DB, Weimer DL, Spector WD, et al. Publication of quality report cards and trends in reported quality measures in nursing homes. Health Serv Res. 2008;43(4):1244-1262. doi:10.1093/geront/45.6.720
22. Harris Y, Clauser SB. Achieving improvement through nursing home quality measurement. Health Care Financ Rev. 2002;23(4):5-18.
From the University of Nebraska, Lincoln (Mr. Puckett and Dr. Ryherd), University of Nebraska Medical Center, Omaha (Dr. Manley), and the University of Nebraska, Omaha (Dr. Ryan).
ABSTRACT
Objective: This study evaluated relationships between physical characteristics of nursing home residences and quality-of-care measures.
Design: This was a cross-sectional ecologic study. The dependent variables were 5 Centers for Medicare & Medicaid Services (CMS) Nursing Home Compare database long-stay quality measures (QMs) during 2019: percentage of residents who displayed depressive symptoms, percentage of residents who were physically restrained, percentage of residents who experienced 1 or more falls resulting in injury, percentage of residents who received antipsychotic medication, and percentage of residents who received anti-anxiety medication. The independent variables were 4 residence characteristics: ownership type, size, occupancy, and region within the United States. We explored how different types of each residence characteristic compare for each QM.
Setting, participants, and measurements: Quality measure values from 15,420 CMS-supported nursing homes across the United States averaged over the 4 quarters of 2019 reporting were used. Welch’s analysis of variance was performed to examine whether the mean QM values for groups within each residential characteristic were statistically different.
Results: Publicly owned and low-occupancy residences had the highest mean QM values, indicating the poorest performance. Nonprofit and high-occupancy residences generally had the lowest (ie, best) mean QM values. There were significant differences in mean QM values among nursing home sizes and regions.
Conclusion: This study suggests that residence characteristics are related to 5 nursing home QMs. Results suggest that physical characteristics may be related to overall quality of life in nursing homes.
Keywords: quality of care, quality measures, residence characteristics, Alzheimer’s disease and related dementias.
More than 55 million people worldwide are living with Alzheimer’s disease and related dementias (ADRD).1 With the aging of the Baby Boomer population, this number is expected to rise to more than 78 million worldwide by 2030.1 Given the growing number of cognitively impaired older adults, there is an increased need for residences designed for the specialized care of this population. Although there are dozens of living options for the elderly, and although most specialized establishments have the resources to meet the immediate needs of their residents, many facilities lack universal design features that support a high quality of life for someone with ADRD or mild cognitive impairment. Previous research has shown relationships between behavioral and psychological symptoms of dementia (BPSD) and environmental characteristics such as acoustics, lighting, and indoor air temperature.2,3 Physical behaviors of BPSD, including aggression and wandering, and psychological symptoms, such as depression, anxiety, and delusions, put residents at risk of injury.4 Additionally, BPSD is correlated with caregiver burden and stress.5-8 Patients with dementia may also experience a lower stress threshold, changes in perception of space, and decreased short-term memory, creating environmental difficulties for those with ADRD9 that lead them to exhibit BPSD due to poor environmental design. Thus, there is a need to learn more about design features that minimize BPSD and promote a high quality of life for those with ADRD.10
Although research has shown relationships between physical environmental characteristics and BPSD, in this work we study relationships between possible BPSD indicators and 4 residence-level characteristics: ownership type, size, occupancy, and region in the United States (determined by location of the Centers for Medicare & Medicaid Services [CMS] regional offices). We analyzed data from the CMS Nursing Home Compare database for the year 2019.11 This database publishes quarterly data and star ratings for quality-of-care measures (QMs), staffing levels, and health inspections for every nursing home supported by CMS. Previous research has investigated the accuracy of QM reporting for resident falls, the impact of residential characteristics on administration of antipsychotic medication, the influence of profit status on resident outcomes and quality of care, and the effect of nursing home size on quality of life.12-16 Additionally, research suggests that residential characteristics such as size and location could be associated with infection control in nursing homes.17
Certain QMs, such as psychotropic drug administration, resident falls, and physical restraint, provide indicators of agitation, disorientation, or aggression, which are often signals of BPSD episodes. We hypothesized that residence types are associated with different QM scores, which could indicate different occurrences of BPSD. We selected 5 QMs for long-stay residents that could potentially be used as indicators of BPSD. Short-stay resident data were not included in this work to control for BPSD that could be a result of sheer unfamiliarity with the environment and confusion from being in a new home.
Methods
Design and Data Collection
This was a cross-sectional ecologic study aimed at exploring relationships between aggregate residential characteristics and QMs. Data were retrieved from the 2019 annual archives found in the CMS provider data catalog on nursing homes, including rehabilitation services.11 The dataset provides general residence information, such as ownership, number of beds, number of residents, and location, as well as residence quality metrics, such as QMs, staffing data, and inspection data. Residence characteristics and 4-quarter averages of QMs were retrieved and used as cross-sectional data. The data used are from 15,420 residences across the United States. Nursing homes located in Guam, the US Pacific Territories, Puerto Rico, and the US Virgin Islands, while supported by CMS and included in the dataset, were excluded from the study due to a severe absence of QM data.
Dependent Variables
We investigated 5 QMs that were averaged across the 4 quarters of 2019. The QMs used as dependent variables were percentage of residents who displayed depressive symptoms (depression), percentage of residents who were physically restrained (restraint), percentage of residents who experienced 1 or more falls resulting in a major injury (falls), percentage of residents who received antipsychotic medication (antipsychotic medication), and percentage of residents who received anti-anxiety or hypnotic medication (anti-anxiety medication).
A total of 2471 QM values were unreported across the 5 QM analyzed: 501 residences did not report depression data; 479 did not report restraint data; 477 did not report falls data; 508 did not report antipsychotic medication data; and 506 did not report anti-anxiety medication data. A residence with a missing QM value was excluded from that respective analysis.
To assess the relationships among the different QMs, a Pearson correlation coefficient r was computed for each unique pair of QMs (Figure). All QMs studied were found to be very weakly or weakly correlated with one another using the Evans classification for very weak and weak correlations (r < 0.20 and 0.20 < r < 0.39, respectively).18
Independent Variables
A total of 15,420 residences were included in the study. Seventy-nine residences did not report occupancy data, however, so those residences were excluded from the occupancy analyses. We categorized the ownership of each nursing home as for-profit, nonprofit, or public. We categorized nursing home size, based on quartiles of the size distribution, as large (> 127 beds), medium (64 to 126 beds), and small (< 64 beds). This method for categorizing the residential characteristics was similar to that used in previous work.19 Similarly, we categorized nursing home occupancy as high (> 92% occupancy), medium (73% to 91% occupancy), and low (< 73% occupancy) based on quartiles of the occupancy distribution. For the regional analysis, we grouped states together based on the CMS regional offices: Atlanta, Georgia; Boston, Massachusetts; Chicago, Illinois; Dallas, Texas; Denver, Colorado; Kansas City, Missouri; New York, New York; Philadelphia, Pennsylvania; San Francisco, California; and Seattle, Washington.20
Analyses
We used Levene’s test to determine whether variances among the residential groups were equal for each QM, using an a priori α = 0.05. For all 20 tests conducted (4 residential characteristics for all 5 QMs), the resulting F-statistics were significant, indicating that the assumption of homogeneity of variance was not met.
We therefore used Welch’s analysis of variance (ANOVA) to evaluate whether the groups within each residential characteristic were the same on their QM means. For example, we tested whether for-profit, nonprofit, and public residences had significantly different mean depression rates. For statistically significant differences, a Games-Howell post-hoc test was conducted to test the difference between all unique pairwise comparisons. An a priori α = 0.05 was used for both Welch’s ANOVA and post-hoc testing. All analyses were conducted in RStudio Version 1.2.5033 (Posit Software, PBC).
Results
Mean Differences
Mean QM scores for the 5 QMs investigated, grouped by residential characteristic for the 2019 year of reporting, are shown in Table 1. It should be noted that the number of residences that reported occupancy data (n = 15,341) does not equal the total number of residences included in the study (N = 15,420) because 79 residences did not report occupancy data. For all QMs reported in Table 1, lower scores are better. Table 2 and Table 3 show results from pairwise comparisons of mean differences for the different residential characteristic and QM groupings. Mean differences and 95% CI are presented along with an indication of statistical significance (when applicable).
Ownership
Nonprofit residences had significantly lower (ie, better) mean scores than for-profit and public residences for 3 QMs: resident depression, antipsychotic medication use, and anti-anxiety medication use. For-profit and public residences did not significantly differ in their mean values for these QMs. For-profit residences had a significantly lower mean score for resident falls than both nonprofit and public residences, but no significant difference existed between scores for nonprofit and public residence falls. There were no statistically significant differences between mean restraint scores among the ownership types.
Size
Large (ie, high-capacity) residences had a significantly higher mean depression score than both medium and small residences, but there was not a significant difference between medium and small residences. Large residences had the significantly lowest mean score for resident falls, and medium residences scored significantly lower than small residences. Medium residences had a significantly higher mean score for anti-anxiety medication use than both small and large residences, but there was no significant difference between small and large residences. There were no statistically significant differences between mean scores for restraint and antipsychotic medication use among the nursing home sizes.
Occupancy
The mean scores for 4 out of the 5 QMs exhibited similar relationships with occupancy rates: resident depression, falls, and antipsychotic and anti-anxiety medication use. Low-occupancy residences consistently scored significantly higher than both medium- and high-occupancy residences, and medium-occupancy residences consistently scored significantly higher than high-occupancy residences. On average, high-occupancy (≥ 92%) residences reported better QM scores than low-occupancy (< 73%) and medium-occupancy (73% to 91%) residences for all the QMs studied except physical restraint, which yielded no significant results. These findings indicate a possible inverse relationship between building occupancy rate and these 4 QMs.
Region
Pairwise comparisons of mean QM scores by region are shown in Table 3. The Chicago region had a significantly higher mean depression score than all other regions, while the San Francisco region’s score was significantly lower than all other regions, except Atlanta and Boston. The Kansas City region had a significantly higher mean score for resident falls than all other regions, with the exception of Denver, and the San Francisco region scored significantly lower than all other regions in falls. The Boston region had a significantly higher mean score for administering antipsychotic medication than all other regions, except for Kansas City and Seattle, and the New York and San Francisco regions both had significantly lower scores than all other regions except for each other. The Atlanta region reported a significantly higher mean score for administering antianxiety medication than all other regions, and the Seattle region’s score for anti-anxiety medication use was significantly lower than all other regions except for San Francisco.
Discussion
This study presented mean percentages for 5 QMs reported in the Nursing Home Compare database for the year 2019: depression, restraint, falls, antipsychotic medication use, and anti-anxiety medication use. We investigated these scores by 4 residential characteristics: ownership type, size, occupancy, and region. In general, publicly owned and low-occupancy residences had the highest scores, and thus the poorest performances, for the 5 chosen QMs during 2019. Nonprofit and high-occupancy residences generally had the lowest (ie, better) scores, and this result agrees with previous findings on long-stay nursing home residents.21 One possible explanation for better performance by high-occupancy buildings could be that increased social interaction is beneficial to nursing home residents as compared with low-occupancy buildings, where less social interaction is probable. It is difficult to draw conclusions regarding nursing home size and region; however, there are significant differences among sizes for 3 out of the 5 QMs and significant differences among regions for all 5 QMs. The analyses suggest that residence-level characteristics are related to QM scores. Although reported QMs are not a direct representation of resident quality of life, this work agrees with previous research that residential characteristics have some impact on the lives of nursing home residents.13-17 Improvements in QM reporting and changes in quality improvement goals since the formation of Nursing Home Compare exist, suggesting that nursing homes’ awareness of their reporting duties may impact quality of care or reporting tendencies.21,22 Future research should consider investigating the impacts of the COVID-19 pandemic on quality-reporting trends and QM scores.
Other physical characteristics of nursing homes, such as noise, lighting levels, and air quality, may also have an impact on QMs and possibly nursing home residents themselves. This type of data exploration could be included in future research. Additionally, future research could include a similar analysis over a longer period, rather than the 1-year period examined here, to investigate which types of residences consistently have high or low scores or how different types of residences have evolved over the years, particularly considering the impact of the COVID-19 pandemic. Information such as staffing levels, building renovations, and inspection data could be accounted for in future studies. Different QMs could also be investigated to better understand the influence of residential characteristics on quality of care.
Conclusion
This study suggests that residence-level characteristics are related to 5 reported nursing home QMs. Overall, nonprofit and high-occupancy residences had the lowest QM scores, indicating the highest performance. Although the results do not necessarily suggest that residence-level characteristics impact individual nursing home residents’ quality of life, they suggest that physical characteristics affect overall quality of life in nursing homes. Future research is needed to determine the specific physical characteristics of these residences that affect QM scores.
Corresponding author: Brian J. Puckett, puckett.brian@huskers.unl.edu.
Disclosures: None reported.
1. Gauthier S, Rosa-Neto P, Morais JA, et al. World Alzheimer report 2021: journey through the diagnosis of dementia. Alzheimer’s Disease International; 2021.
2. Garre-Olmo J, López-Pousa S, Turon-Estrada A, et al. Environmental determinants of quality of life in nursing home residents with severe dementia. J Am Geriatr Soc. 2012;60(7):1230-1236. doi:10.1111/j.1532-5415.2012.04040.x
3. Zeisel J, Silverstein N, Hyde J, et al. Environmental correlates to behavioral health outcomes in Alzheimer’s special care units. Gerontologist. 2003;43(5):697-711. doi:10.1093/geront/43.5.697
4. Brawley E. Environmental design for Alzheimer’s disease: a quality of life issue. Aging Ment Health. 2001;5(1):S79-S83. doi:10.1080/13607860120044846
5. Joosse L. Do sound levels and space contribute to agitation in nursing home residents with dementia? Research Gerontol Nurs. 2012;5(3):174-184. doi:10.3928/19404921-20120605-02
6. Dowling G, Graf C, Hubbard E, et al. Light treatment for neuropsychiatric behaviors in Alzheimer’s disease. Western J Nurs Res. 2007;29(8):961-975. doi:10.1177/0193945907303083
7. Tartarini F, Cooper P, Fleming R, et al. Indoor air temperature and agitation of nursing home residents with dementia. Am J Alzheimers Dis Other Demen. 2017;32(5):272-281. doi:10.1177/1533317517704898
8. Miyamoto Y, Tachimori H, Ito H. Formal caregiver burden in dementia: impact of behavioral and psychological symptoms of dementia and activities of daily living. Geriatr Nurs. 2010;31(4):246-253. doi:10.1016/j.gerinurse.2010.01.002
9. Dementia care and the built environment: position paper 3. Alzheimer’s Australia; 2004.
10. Cloak N, Al Khalili Y. Behavioral and psychological symptoms in dementia. Updated July 21, 2022. In: StatPearls [Internet]. StatPearls Publishing; 2022.
11. Centers for Medicare & Medicaid Services. Nursing homes including rehab services data archive. 2019 annual files. Accessed January 30, 2023. https://data.cms.gov/provider-data/archived-data/nursing-homes
12. Sanghavi P, Pan S, Caudry D. Assessment of nursing home reporting of major injury falls for quality measurement on Nursing Home Compare. Health Serv Res. 2020;55(2):201-210. doi:10.1111/1475-6773.13247
13. Hughes C, Lapane K, Mor V. Influence of facility characteristics on use of antipsychotic medications in nursing homes. Med Care. 2000;38(12):1164-1173. doi:10.1097/00005650-200012000-00003
14. Aaronson W, Zinn J, Rosko M. Do for-profit and not-for-profit nursing homes behave differently? Gerontologist. 1994;34(6):775-786. doi:10.1093/geront/34.6.775
15. O’Neill C, Harrington C, Kitchener M, et al. Quality of care in nursing homes: an analysis of relationships among profit, quality, and ownership. Med Care. 2003;41(12):1318-1330. doi:10.1097/01.MLR.0000100586.33970.58
16. Allen PD, Klein WC, Gruman C. Correlates of complaints made to the Connecticut Long-Term Care Ombudsman program: the role of organizational and structural factors. Res Aging. 2003;25(6):631-654. doi:10.1177/0164027503256691
17. Abrams H, Loomer L, Gandhi A, et al. Characteristics of U.S. nursing homes with COVID-19 cases. J Am Geriatr Soc. 2020;68(8):1653-1656. doi:10.1111/jgs.16661
18. Evans JD. Straightforward Statistics for the Behavioral Sciences. Thomson Brooks/Cole Publishing Co; 1996.
19. Zinn J, Spector W, Hsieh L, et al. Do trends in the reporting of quality measures on the Nursing Home Compare web site differ by nursing home characteristics? Gerontologist. 2005;45(6):720-730.
20. Centers for Medicare & Medicaid Services. CMS Regional Offices. Accessed January 30, 2023. https://www.cms.gov/Medicare/Coding/ICD10/CMS-Regional-Offices
21. Mukamel DB, Weimer DL, Spector WD, et al. Publication of quality report cards and trends in reported quality measures in nursing homes. Health Serv Res. 2008;43(4):1244-1262. doi:10.1093/geront/45.6.720
22. Harris Y, Clauser SB. Achieving improvement through nursing home quality measurement. Health Care Financ Rev. 2002;23(4):5-18.
Veterans as Caregivers:Those Who Continue to Serve
More than 20% of the U.S. population will be aged ≥ 65 years by 2030, an increase from 13% in 2012.1 The likelihood of needing assistance with activities of daily living (ADLs) increases with age.2 People who need such assistance often depend on informal and unpaid assistance from friends and family. In 2009, about 65.7 million Americans (28.5%) provided informal care for people with an illness or disability, and that number only is expected to rise.3 These informal caregivers provide up to 80% of the total care hours needed by community-dwelling older adults—an estimated economic value of $450 billion in unpaid contributions in 2009.4,5
Caregiving can lead to significant physical, psychological, social, and financial burdens.6 The caregiving burden is associated with a host of adverse health behaviors and outcomes such as poor diet, lack of exercise and sleep, smoking, decreased participation in preventive health care, anxiety, depression, relationship difficulties, employment disruption, financial hardship, suicide, and higher mortality compared with that of noncaregivers.6-10 Additionally, care recipients are at increased risk for abuse or neglect when the caregiver is experiencing a significant burden.11 Therefore, efforts to improve caregiver support are important for both partners in the caregiver/care recipient dyad.
Caregiver support is beneficial to the health of caregivers and care recipients.10,12 For example, the Resources for Enhancing Alzheimer’s Caregiver Health (REACH) program has been shown to reduce the stress of informal caregiving and the risk of depression in caregivers.13,14 This program showed similar effects when implemented within the VHA.14 In the Partners in Dementia Care project, the VHA and Alzheimer’s Association coordinated care and support for veterans with dementia and their family and friends. This intervention resulted in lower caregiver strain and depression scores among participants.15
With a growing medical literature that shows the benefits of caregiver support interventions, the VHA developed a robust support program for informal caregivers of veterans. The VA caregiver support website (www.caregiver.va.gov) provides information and resources targeted to caregivers for veterans, including psychosocial and functional support for caregivers. The psychosocial support provided by the VA includes caregiver education, counseling, access to caregiver support coordinators, a caregiver support line, support groups, and referral to community support organizations.16 Functional support on the site includes financial assistance toward skilled home care, home hospice care, adult day care, home-based primary care, homemaker and home health aide services, telehealth, and respite care.16 Veterans who are caregiving for nonveterans have access to VHA psychosocial support but not to functional support services. For these veterans, functional caregiver support must come from family or referral to community organizations.
Background
In the U.S., about 11% of caregivers are veterans, but the availability of data about these caregivers is limited to veteran subgroups.3 For example, a 2011 study reported that 20% of veterans aged ≥ 60 years are caregivers.17 However, this estimate included child care for unimpaired children, which is not commonly included in other caregiving estimates. In another study, 30% of middle-aged active-duty officers reported helping their parents with instrumental ADLs (IADLs).18 These data suggest a significant proportion of veterans may be caregivers; however, the estimates do not identify prevalence of caregiving among a population of VHA enrolled veterans.
Likewise, few studies discuss the burden veterans experience from caregiving. A study of the 2009/2010 CDC Behavioral Risk Factor Surveillance System data found that female caregivers were more likely to report problems with sleep and mental health if they were veterans vs nonveterans.19 In a second study, caregiving veterans frequently reported physical (39%) and emotional (53%) strain, with emotional strain relating to depressive symptoms. The study of active-duty officers noted that worry was prevalent among military officers caregiving for parents from a distance.18 In contrast to the negative outcomes of caregiving, Monin and colleagues found that many veterans perceived caregiving as rewarding. Since caregiving may be a positive experience, veterans may benefit and be a potential resource for care to elderly and disabled citizens.17
Project Rationale and Goals
Social workers are the cornerstone of caregiver support at the George E. Wahlen VA Salt Lake City Health Care System (VASLCHCS) in Utah. They educate veterans and caregivers about VA resources to support caregivers of veterans. For those veterans who are caregiving for a nonveteran, the VASLCHCS social workers provide psychosocial support and help veterans connect to a local area agency on aging (AAA) for access to functional support. In practice, primary care clinic (PCC) providers have observed that directing a veteran to call the AAA does not usually result in a phone call. Therefore, an aim of this quality improvement (QI) project was to determine the most effective means of completing a successful AAA referral.
The VASLCHCS Geriatric Research Education and Clinical Center collaborates with the Utah Aging and Disability Resource Connection (ADRC) to improve awareness of available resources for veterans. Building on this collaborative project, the authors created a formal referral process for veterans needing local AAA services. This QI project had 3 aims: (1) estimate the prevalence of caregiving among veterans in the VASLCHCS primary care clinic; (2) identify perceived caregiving difficulties and resource use difficulty in caregiving tasks; and (3) test different strategies to connect veterans with a referral to community resources through the AAA.
The authors hypothesized that a veteran would be more likely to connect with the AAA if contact was initiated by the AAA rather than the standard practice of asking the veteran to make the call. However, the authors also hypothesized that a veteran who took the time to make the call would be more likely to use AAA resources compared with veterans who were called by the AAA.
Methods
The VASLCHCS Research and Development Office reviewed this project and determined that it met the definition of QI. Therefore, it did not require IRB approval.
The study drew from a convenience sample of veterans who were waiting for appointments in the PCC and who were referred by their health care provider (HCP). To identify caregivers, veterans were asked: “People may provide regular care or assistance to a friend or family member who has a health problem, long-term illness, or disability. During the past month, did you provide any such care or assistance to a friend or family member?” Referrals from HCPs were included in all calculations except the prevalence estimate.
The authors interviewed veterans over a 3-month period in 2015. As of November 2014, the clinic was serving about 11,000 veterans, of which 6,589 lived in Salt Lake County. The clinic also serves veterans who live in other counties in Utah, Nevada, Wyoming, Idaho, and Colorado. 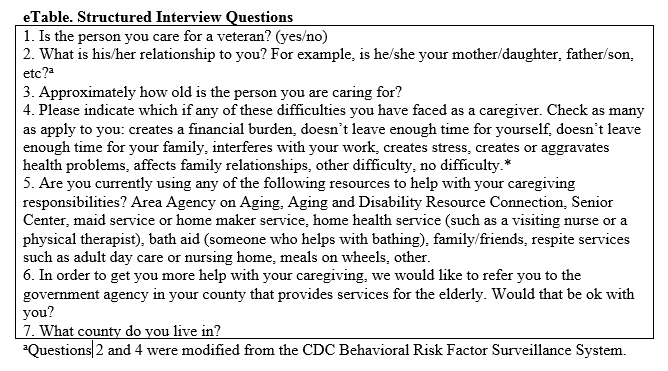
Intervention and Partnering With Community Resources
All willing caregivers were provided a referral to a local AAA (Figure). Salt Lake County veterans interested in referral to the AAA were randomized to 1 of 2 referral methods: veteran-initiated referral (VIR), in which the veteran was given a handout with the phone number of the Salt Lake County caregiver support program (CSP), or provider-initiated referral (PIR), in which the veteran’s phone number was given to the CSP. Caregiving veterans living outside Salt Lake County were provided the AAA phone number in their area and instructed to call for information.
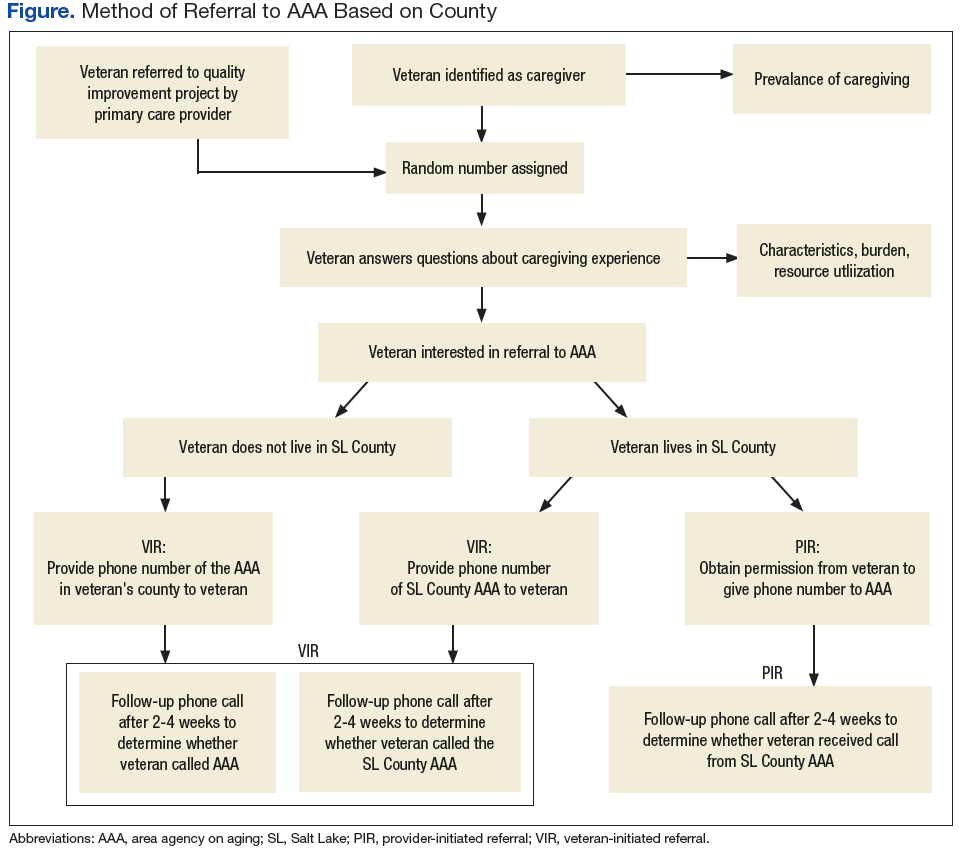
The interview form was randomized using an even or odd number before the interview. Some veterans who were randomized to a PIR needed to be moved into the VIR intervention arm because of the following reasons: the veteran’s care recipient was aged < 18 years (3); the veteran lived outside of Salt Lake County (20); the veteran did not want his/her name given to an outside agency (5); or the interviewer mistakenly gave the veteran the AAA contact information (4).
The primary author called caregivers in the PIR and VIR groups 2 to 4 weeks after the referral to determine whether they had contacted or were contacted by the AAA. Ten call attempts were made before participants were considered lost to follow-up. Caregivers that had been in contact with the AAA reported in open-ended fashion the resources to which they had been referred and whether those resources had been helpful.
Analysis
In this evaluation, the primary outcome of interest was whether contact between the veteran and AAA occurred. For the VIR group, contact was defined as the veteran having called the AAA, regardless of whether he or she actually spoke to someone. For the PIR group, contact occurred if the veteran reported receiving a phone call from AAA regardless of whether he or she had actually spoken with someone (eg, if the veteran reported that the AAA had left a voice mail, this was considered contact). Veterans also were asked whether connecting with the AAA led to resource referrals and whether these referrals were useful.
To achieve a power of 80% with a 95% confidence interval, 20 people were needed in each intervention group to detect a 40% difference in the rate of contact between the 2 groups. STATA12 (College Station, TX) was used to calculate Fisher exact and chi-square values to evaluate differences between groups.
Results
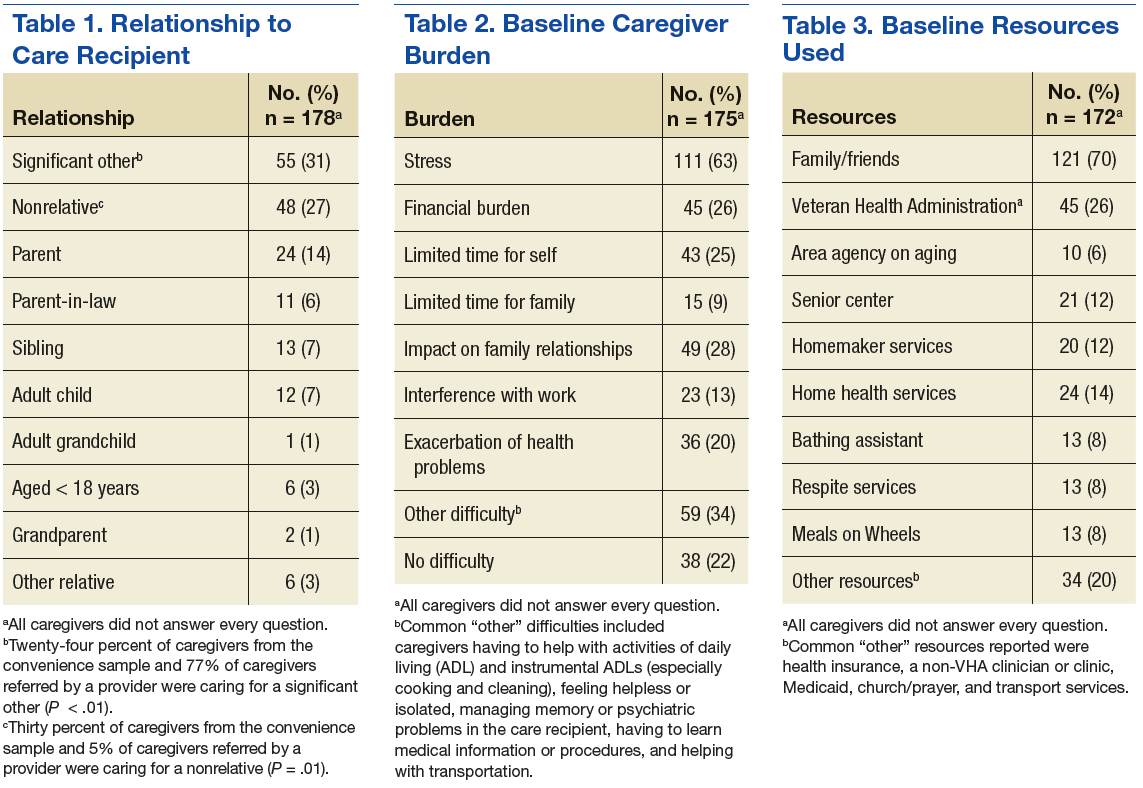
For the study, 433 PCC veterans were interviewed, and 157 (36%) self-identified as a caregiver. An additional 22 referrals were included for a total of 179 caregivers. Caregiver and care recipient characteristics, caregiver burden, and resource utilization were calculated for all 179 caregivers; however, all caregivers did not answer every question. Ninety-eight percent (176) of caregivers were men; 64% (109/170) were from Salt Lake County, and 5% were from outside Utah (8). Twelve percent (21) of the 179 caregivers were providing care for > 1 person. Of 177 caregivers, 3% (5) were caring for both a veteran and a nonveteran, 69% (122) were caring for a nonveteran only, and 28% (49) were caring for another veteran only (Table 1).
The most common burden reported by caregivers was stress (63%); 70% endorsed family/friends as a resource (Table 2). Just 6% (10) of caregivers used the AAA, whereas 26% (45) received VHA support. Of the 54 veterans who were caring for a veteran, 40 reported using the VHA as a resource. Five people caring for nonveterans reported using the VHA as a resource; however, data about which resources those caregivers were accessing were not collected (Table 3).
AAA Referral and Randomization
Sixty-five percent of caregivers accepted AAA referrals. Of 109 Salt Lake County caregivers, 70% accepted referral to the AAA. There was no statistically significant difference in referral acceptance rates when comparing Salt Lake County residents with nonresidents (P = .09).The authors were unable to obtain the phone number for 1 caregiver who had accepted a referral, and 1 caregiver who accepted referral did not want a follow-up. This left 111 caregivers available for follow-up, 75 in Salt Lake County. Fifty Salt Lake County veterans were randomly assigned to the VIR group and 25 to the PIR group. The 36 caregivers who accepted referrals outside Salt Lake County also were placed in the VIR group, for a total of 86 caregivers.
Follow-up
Ninety-eight percent of caregivers were reached for follow-up. Both people lost to follow-up were in Salt Lake County (1 in each group).
In Salt Lake County, 12% (6) of the VIR group and 64% (16) of the PIR group had connected with the AAA (P < .01). Although 64% of those in the PIR group reported having been called by the AAA, the AAA representative reported all 25 had been called. The AAA records showed 9 of those called were reached by voice mail, 6 were provided information about caregiving resources, 2 formally joined the support program, 5 declined help, 1 was no longer caregiving, 1 was too busy to talk, and 1 was the wrong phone number (and was lost to follow-up as well).
Outside of Salt Lake County 19% (7) reported calling the local AAA. There was no difference in referral completion between the Salt Lake County/non-Salt Lake County VIR groups (P = .4).
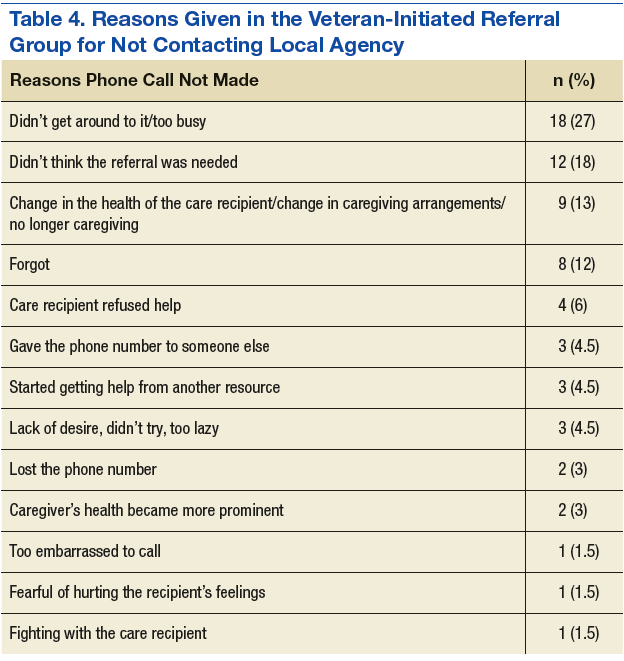
Fifteen percent of all VIR caregivers reported calling the AAA. There were no statistical differences between Salt Lake County VIR and non-Salt Lake County VIR for reasons why the veteran had not called the AAA (Table 4).
Of 28 people who connected with the AAA, 16 (57%) said they had received access to a needed resource as a result of the phone call. Seven caregivers (25%) said they had not been referred to other resources as a result of the call. The VIR group was more likely to be referred to other resources after contacting the AAA than was the PIR group, although this difference did not reach significance (69% vs 47%, P = .28).
Discussion
More than one-third (36%) of veterans seen in the VASLCHCS PCC are caregivers. This prevalence is higher than that reported for the general U.S. population and higher than that reported in other veteran groups.5,17,18 Most caregivers in this project were caring for nonveterans and only had access to VHA psychosocial caregiver support programs because VHA functional caregiver support (eg, respite, homemaker services) is not available to veterans who care for nonveterans. A majority (78%) of caregiving veterans reported some caregiver burden. Despite the burden, most are not using community resources. However when offered, more than half the caregivers were interested in an AAA referral.
Although the VHA does not provide functional caregiver support resources to veterans caring for nonveterans, there are other agencies that can assist veterans: AAAs for care recipients aged ≥ 60 years and the ADRCs for younger veterans. Through AAAs, caregivers can access a variety of support services, including transportation, adult day care, caregiver support, and health promotion programs. Partnership between agencies such as the VHA and the AAAs could benefit caregiving veterans. This QI project suggests ways to strengthen interagency cooperation.
This study also suggests that a provider or clinic-initiated referral is more likely to connect veterans with information and resources than the current practice of recommending that the veteran initiate the referral. Once in contact with the AAA, most caregivers were referred to needed resources. The next step will be to establish an efficient way for clinic staff to identify caregiving veterans and make referrals to community programs. Referrals could be made by any member of the patient aligned care team (PACT) to further standardize and streamline the process.
Thirty-one percent of veterans in this project were eligible for the VHA caregiver support program because they cared for a veteran. However, 25% of these caregiving veterans were not accessing this resource. Increasing awareness of the VHA caregiver support program among veterans caring for other veterans would improve caregiver support to both caregiving and care recipient veterans.
Limitations
One limitation of this project was the intentional exclusion of the women’s clinic from the sampling process. For consistency, the authors wanted to limit the intervention to 1 PCC and so they chose the clinic that serves the majority of the veterans who receive primary care at VASLCHCS. Additionally, the literature showed that male caregivers compared with women caregivers20,21 have different characteristics in regards to caregiver burden, and a well-designed study of women caregivers already has been published.19
Also, this study did not obtain data on age, health problems, or socioeconomic status of the caregivers to avoid identifying information. Last, the authors did not ask about time spent caregiving or type of care provided. These questions may be important for future studies. Future investigations should evaluate health care use and health of caregivers vs noncaregivers in the veteran population. It also could be important to determine methods for building bridges between the VHA, AAAs, and other community services.
Conclusion
To minimize the disruption that a research study might have caused to normal clinical workflow, the primary author played the role that a medical social worker or other PACT member might play in the future. This project sheds light on how to improve outcomes for community referrals and an important future step in this research would be to develop and test a process that would integrate the PACT into the referral process.
More than one-third of veterans seen in the VASLCHCS PCC are caregivers. To the authors’ knowledge, this is the first estimate of prevalence of caregiving in veterans who receive primary care from the VHA. About 63% of caregiving veterans perceived some burden due to caregiving, and 66% accepted referral to community resources. However, only 12% who were asked to self-refer made contact with the AAA compared with 64% when a provider made the referral for them. Provider referral is more effective in connecting caregiving veterans with resources. Development of interagency partnerships should be fostered to help veterans decrease caregiving burden.
This project is one of the few studies looking at this special group of caregivers: veterans who serve as caregivers. It highlights the need for the VHA to establish policies and partnerships to improve caregiver support to this valuable group of veterans.
1. Ortman JM, Velkoff VA, Hogan H. An aging nation: the older population in the United States: population estimates and projections. http://www.census .gov/prod/2014pubs/p25-1140.pdf. Published May 2014. Accessed March 9, 2017.
2. Smith AK, Walter LC, Miao Y, Boscardin WJ, Covinsky KE. Disability during the last two years of life. JAMA Intern Med. 2013;173(16):1506-1513.
3. National Alliance for Caregiving, American Association of Retired Persons. Caregiving in the U.S. 2009 executive summary. http://assets.aarp.org/rgcenter/il/caregiving_09_es.pdf. Published November 2009. Accessed March 9, 2017.
4. Spillman BC, Wolff J, Freedman VA, Kasper JD; Office of the Assistant Secretary for Planning and Evaluation, U.S. Department of Health and Human Services. Informal caregiving for older Americans: an analysis of the 2011 national study of caregiving. https://aspe.hhs.gov/report/informal-caregiving-older-americans-analysis-2011-national-study-caregiving. Published April 1, 2014. Accessed March 9, 2017.
5. Feinberg L, Reinhard SC, Houser A, Choula R; AARP Public Policy Institute. Valuing the invaluable: 2011 update. The growing contributions and costs of family caregiving. https://assets.aarp .org/rgcenter/ppi/ltc/i51-caregiving.pdf. Published June 2011. Accessed March 9, 2017.
6. Adelman RD, Tmanova LL, Delgado D, Dion S, Lachs MS. Caregiver burden: a clinical review. JAMA. 2014;311(10):1052-1059.
7. Burton LC, Newsom JT, Schulz R, Hirsch CH, German PS. Preventive health behaviors among spousal caregivers. Prev Med. 1997;26(2):162-169.
8. Talley RC, Crews JE. Framing the public health of caregiving. Am J Public Health. 2007;97(2):224-228.
9. Hoffman GJ, Lee J, Mendez-Luck CA. Health behaviors among baby boomer informal caregivers. Gerontologist. 2012;52(2):219-230.
10. National Alliance for Caregiving. Caregivers of veterans—serving on the homefront: report of study findings. http://www.caregiving.org/data/2010 _Caregivers_of_Veterans_FULLREPORT_WEB_FINAL.pdf. Published November 2010. Accessed March 9, 2017.
11. Johannesen M, LoGuidice D. Elder abuse: a systematic review of risk factors in community dwelling elders. Age Ageing. 2013;42(3):292-298.
12. Goy E, Kansagara D, Freeman M;Department of Veterans Affairs, Health Services Research & Development Service. A systematic evidence review of interventions for non-professional caregivers of individuals with dementia. http://www.hsrd.research .va.gov/publications/esp/DementiaCaregivers-EXEC .pdf. Published October 2010. Accessed March 9, 2017.
13. Belle SH, Burgio L, Burns R, et al; Resources for Enhancing Alzheimer’s Caregiver Health (REACH) II Investigators. Enhancing the quality of life of dementia caregivers from different ethnic or racial groups: a randomized controlled trial. Ann Intern Med. 2006;145(10):727-738.
14. Nichols LO, Martindale-Adams J, Burns R, Graney MJ, Zuber J. Translation of a dementia caregiver support program in a health care system—REACH VA. Arch Intern Med. 2011;171(4):353-359.
15. Bass DM, Judge KS, Snow AL, et al. Caregiver outcomes of partners in dementia care: effect of a care coordination program for veterans with dementia and their family members and friends. J Am Geriatr Soc. 2013;61(8):1377-1386.
16. U.S. Department of Veteran Affairs. VA caregiver support: caregiver services. http://www.caregiver .va.gov/support/support_services.asp. Updated June 3, 2015. Accessed March 9, 2017.
17. Monin JK, Levy BR, Pietrzak RH. From serving in the military to serving loved ones: unique experiences of older veteran caregivers. Am J Geriatr Psychiatry. 2014;22(6):570-579.
18. Parker MW, Call VR, Dunkle R, Vaitkus M. “Out of sight” but not “out of mind”: parent contact and worry among senior ranking male officers in the military who live long distances from parents. Milit Psychol. 2002;14(4):257-277.
19. Lavela SL, Etingen B, Louise-Bender Pape T. Caregiving experiences and health conditions of women veteran and non-veteran caregivers. Womens Health Issues. 2013;23(4):e225-e232.
20. Yee JL, Schultz RS. Gender differences in psychiatric morbidity among family caregivers: a review and analysis. Gerontologist. 2000;40(2):147-164.
21. Collins CR. Men as caregivers of the elderly: support for the contributions of sons. J Multidiscip Healthc. 2014;7:525-531.
More than 20% of the U.S. population will be aged ≥ 65 years by 2030, an increase from 13% in 2012.1 The likelihood of needing assistance with activities of daily living (ADLs) increases with age.2 People who need such assistance often depend on informal and unpaid assistance from friends and family. In 2009, about 65.7 million Americans (28.5%) provided informal care for people with an illness or disability, and that number only is expected to rise.3 These informal caregivers provide up to 80% of the total care hours needed by community-dwelling older adults—an estimated economic value of $450 billion in unpaid contributions in 2009.4,5
Caregiving can lead to significant physical, psychological, social, and financial burdens.6 The caregiving burden is associated with a host of adverse health behaviors and outcomes such as poor diet, lack of exercise and sleep, smoking, decreased participation in preventive health care, anxiety, depression, relationship difficulties, employment disruption, financial hardship, suicide, and higher mortality compared with that of noncaregivers.6-10 Additionally, care recipients are at increased risk for abuse or neglect when the caregiver is experiencing a significant burden.11 Therefore, efforts to improve caregiver support are important for both partners in the caregiver/care recipient dyad.
Caregiver support is beneficial to the health of caregivers and care recipients.10,12 For example, the Resources for Enhancing Alzheimer’s Caregiver Health (REACH) program has been shown to reduce the stress of informal caregiving and the risk of depression in caregivers.13,14 This program showed similar effects when implemented within the VHA.14 In the Partners in Dementia Care project, the VHA and Alzheimer’s Association coordinated care and support for veterans with dementia and their family and friends. This intervention resulted in lower caregiver strain and depression scores among participants.15
With a growing medical literature that shows the benefits of caregiver support interventions, the VHA developed a robust support program for informal caregivers of veterans. The VA caregiver support website (www.caregiver.va.gov) provides information and resources targeted to caregivers for veterans, including psychosocial and functional support for caregivers. The psychosocial support provided by the VA includes caregiver education, counseling, access to caregiver support coordinators, a caregiver support line, support groups, and referral to community support organizations.16 Functional support on the site includes financial assistance toward skilled home care, home hospice care, adult day care, home-based primary care, homemaker and home health aide services, telehealth, and respite care.16 Veterans who are caregiving for nonveterans have access to VHA psychosocial support but not to functional support services. For these veterans, functional caregiver support must come from family or referral to community organizations.
Background
In the U.S., about 11% of caregivers are veterans, but the availability of data about these caregivers is limited to veteran subgroups.3 For example, a 2011 study reported that 20% of veterans aged ≥ 60 years are caregivers.17 However, this estimate included child care for unimpaired children, which is not commonly included in other caregiving estimates. In another study, 30% of middle-aged active-duty officers reported helping their parents with instrumental ADLs (IADLs).18 These data suggest a significant proportion of veterans may be caregivers; however, the estimates do not identify prevalence of caregiving among a population of VHA enrolled veterans.
Likewise, few studies discuss the burden veterans experience from caregiving. A study of the 2009/2010 CDC Behavioral Risk Factor Surveillance System data found that female caregivers were more likely to report problems with sleep and mental health if they were veterans vs nonveterans.19 In a second study, caregiving veterans frequently reported physical (39%) and emotional (53%) strain, with emotional strain relating to depressive symptoms. The study of active-duty officers noted that worry was prevalent among military officers caregiving for parents from a distance.18 In contrast to the negative outcomes of caregiving, Monin and colleagues found that many veterans perceived caregiving as rewarding. Since caregiving may be a positive experience, veterans may benefit and be a potential resource for care to elderly and disabled citizens.17
Project Rationale and Goals
Social workers are the cornerstone of caregiver support at the George E. Wahlen VA Salt Lake City Health Care System (VASLCHCS) in Utah. They educate veterans and caregivers about VA resources to support caregivers of veterans. For those veterans who are caregiving for a nonveteran, the VASLCHCS social workers provide psychosocial support and help veterans connect to a local area agency on aging (AAA) for access to functional support. In practice, primary care clinic (PCC) providers have observed that directing a veteran to call the AAA does not usually result in a phone call. Therefore, an aim of this quality improvement (QI) project was to determine the most effective means of completing a successful AAA referral.
The VASLCHCS Geriatric Research Education and Clinical Center collaborates with the Utah Aging and Disability Resource Connection (ADRC) to improve awareness of available resources for veterans. Building on this collaborative project, the authors created a formal referral process for veterans needing local AAA services. This QI project had 3 aims: (1) estimate the prevalence of caregiving among veterans in the VASLCHCS primary care clinic; (2) identify perceived caregiving difficulties and resource use difficulty in caregiving tasks; and (3) test different strategies to connect veterans with a referral to community resources through the AAA.
The authors hypothesized that a veteran would be more likely to connect with the AAA if contact was initiated by the AAA rather than the standard practice of asking the veteran to make the call. However, the authors also hypothesized that a veteran who took the time to make the call would be more likely to use AAA resources compared with veterans who were called by the AAA.
Methods
The VASLCHCS Research and Development Office reviewed this project and determined that it met the definition of QI. Therefore, it did not require IRB approval.
The study drew from a convenience sample of veterans who were waiting for appointments in the PCC and who were referred by their health care provider (HCP). To identify caregivers, veterans were asked: “People may provide regular care or assistance to a friend or family member who has a health problem, long-term illness, or disability. During the past month, did you provide any such care or assistance to a friend or family member?” Referrals from HCPs were included in all calculations except the prevalence estimate.
The authors interviewed veterans over a 3-month period in 2015. As of November 2014, the clinic was serving about 11,000 veterans, of which 6,589 lived in Salt Lake County. The clinic also serves veterans who live in other counties in Utah, Nevada, Wyoming, Idaho, and Colorado.
Intervention and Partnering With Community Resources
All willing caregivers were provided a referral to a local AAA (Figure). Salt Lake County veterans interested in referral to the AAA were randomized to 1 of 2 referral methods: veteran-initiated referral (VIR), in which the veteran was given a handout with the phone number of the Salt Lake County caregiver support program (CSP), or provider-initiated referral (PIR), in which the veteran’s phone number was given to the CSP. Caregiving veterans living outside Salt Lake County were provided the AAA phone number in their area and instructed to call for information.
The interview form was randomized using an even or odd number before the interview. Some veterans who were randomized to a PIR needed to be moved into the VIR intervention arm because of the following reasons: the veteran’s care recipient was aged < 18 years (3); the veteran lived outside of Salt Lake County (20); the veteran did not want his/her name given to an outside agency (5); or the interviewer mistakenly gave the veteran the AAA contact information (4).
The primary author called caregivers in the PIR and VIR groups 2 to 4 weeks after the referral to determine whether they had contacted or were contacted by the AAA. Ten call attempts were made before participants were considered lost to follow-up. Caregivers that had been in contact with the AAA reported in open-ended fashion the resources to which they had been referred and whether those resources had been helpful.
Analysis
In this evaluation, the primary outcome of interest was whether contact between the veteran and AAA occurred. For the VIR group, contact was defined as the veteran having called the AAA, regardless of whether he or she actually spoke to someone. For the PIR group, contact occurred if the veteran reported receiving a phone call from AAA regardless of whether he or she had actually spoken with someone (eg, if the veteran reported that the AAA had left a voice mail, this was considered contact). Veterans also were asked whether connecting with the AAA led to resource referrals and whether these referrals were useful.
To achieve a power of 80% with a 95% confidence interval, 20 people were needed in each intervention group to detect a 40% difference in the rate of contact between the 2 groups. STATA12 (College Station, TX) was used to calculate Fisher exact and chi-square values to evaluate differences between groups.
Results
For the study, 433 PCC veterans were interviewed, and 157 (36%) self-identified as a caregiver. An additional 22 referrals were included for a total of 179 caregivers. Caregiver and care recipient characteristics, caregiver burden, and resource utilization were calculated for all 179 caregivers; however, all caregivers did not answer every question. Ninety-eight percent (176) of caregivers were men; 64% (109/170) were from Salt Lake County, and 5% were from outside Utah (8). Twelve percent (21) of the 179 caregivers were providing care for > 1 person. Of 177 caregivers, 3% (5) were caring for both a veteran and a nonveteran, 69% (122) were caring for a nonveteran only, and 28% (49) were caring for another veteran only (Table 1).
The most common burden reported by caregivers was stress (63%); 70% endorsed family/friends as a resource (Table 2). Just 6% (10) of caregivers used the AAA, whereas 26% (45) received VHA support. Of the 54 veterans who were caring for a veteran, 40 reported using the VHA as a resource. Five people caring for nonveterans reported using the VHA as a resource; however, data about which resources those caregivers were accessing were not collected (Table 3).
AAA Referral and Randomization
Sixty-five percent of caregivers accepted AAA referrals. Of 109 Salt Lake County caregivers, 70% accepted referral to the AAA. There was no statistically significant difference in referral acceptance rates when comparing Salt Lake County residents with nonresidents (P = .09).The authors were unable to obtain the phone number for 1 caregiver who had accepted a referral, and 1 caregiver who accepted referral did not want a follow-up. This left 111 caregivers available for follow-up, 75 in Salt Lake County. Fifty Salt Lake County veterans were randomly assigned to the VIR group and 25 to the PIR group. The 36 caregivers who accepted referrals outside Salt Lake County also were placed in the VIR group, for a total of 86 caregivers.
Follow-up
Ninety-eight percent of caregivers were reached for follow-up. Both people lost to follow-up were in Salt Lake County (1 in each group).
In Salt Lake County, 12% (6) of the VIR group and 64% (16) of the PIR group had connected with the AAA (P < .01). Although 64% of those in the PIR group reported having been called by the AAA, the AAA representative reported all 25 had been called. The AAA records showed 9 of those called were reached by voice mail, 6 were provided information about caregiving resources, 2 formally joined the support program, 5 declined help, 1 was no longer caregiving, 1 was too busy to talk, and 1 was the wrong phone number (and was lost to follow-up as well).
Outside of Salt Lake County 19% (7) reported calling the local AAA. There was no difference in referral completion between the Salt Lake County/non-Salt Lake County VIR groups (P = .4).
Fifteen percent of all VIR caregivers reported calling the AAA. There were no statistical differences between Salt Lake County VIR and non-Salt Lake County VIR for reasons why the veteran had not called the AAA (Table 4).
Of 28 people who connected with the AAA, 16 (57%) said they had received access to a needed resource as a result of the phone call. Seven caregivers (25%) said they had not been referred to other resources as a result of the call. The VIR group was more likely to be referred to other resources after contacting the AAA than was the PIR group, although this difference did not reach significance (69% vs 47%, P = .28).
Discussion
More than one-third (36%) of veterans seen in the VASLCHCS PCC are caregivers. This prevalence is higher than that reported for the general U.S. population and higher than that reported in other veteran groups.5,17,18 Most caregivers in this project were caring for nonveterans and only had access to VHA psychosocial caregiver support programs because VHA functional caregiver support (eg, respite, homemaker services) is not available to veterans who care for nonveterans. A majority (78%) of caregiving veterans reported some caregiver burden. Despite the burden, most are not using community resources. However when offered, more than half the caregivers were interested in an AAA referral.
Although the VHA does not provide functional caregiver support resources to veterans caring for nonveterans, there are other agencies that can assist veterans: AAAs for care recipients aged ≥ 60 years and the ADRCs for younger veterans. Through AAAs, caregivers can access a variety of support services, including transportation, adult day care, caregiver support, and health promotion programs. Partnership between agencies such as the VHA and the AAAs could benefit caregiving veterans. This QI project suggests ways to strengthen interagency cooperation.
This study also suggests that a provider or clinic-initiated referral is more likely to connect veterans with information and resources than the current practice of recommending that the veteran initiate the referral. Once in contact with the AAA, most caregivers were referred to needed resources. The next step will be to establish an efficient way for clinic staff to identify caregiving veterans and make referrals to community programs. Referrals could be made by any member of the patient aligned care team (PACT) to further standardize and streamline the process.
Thirty-one percent of veterans in this project were eligible for the VHA caregiver support program because they cared for a veteran. However, 25% of these caregiving veterans were not accessing this resource. Increasing awareness of the VHA caregiver support program among veterans caring for other veterans would improve caregiver support to both caregiving and care recipient veterans.
Limitations
One limitation of this project was the intentional exclusion of the women’s clinic from the sampling process. For consistency, the authors wanted to limit the intervention to 1 PCC and so they chose the clinic that serves the majority of the veterans who receive primary care at VASLCHCS. Additionally, the literature showed that male caregivers compared with women caregivers20,21 have different characteristics in regards to caregiver burden, and a well-designed study of women caregivers already has been published.19
Also, this study did not obtain data on age, health problems, or socioeconomic status of the caregivers to avoid identifying information. Last, the authors did not ask about time spent caregiving or type of care provided. These questions may be important for future studies. Future investigations should evaluate health care use and health of caregivers vs noncaregivers in the veteran population. It also could be important to determine methods for building bridges between the VHA, AAAs, and other community services.
Conclusion
To minimize the disruption that a research study might have caused to normal clinical workflow, the primary author played the role that a medical social worker or other PACT member might play in the future. This project sheds light on how to improve outcomes for community referrals and an important future step in this research would be to develop and test a process that would integrate the PACT into the referral process.
More than one-third of veterans seen in the VASLCHCS PCC are caregivers. To the authors’ knowledge, this is the first estimate of prevalence of caregiving in veterans who receive primary care from the VHA. About 63% of caregiving veterans perceived some burden due to caregiving, and 66% accepted referral to community resources. However, only 12% who were asked to self-refer made contact with the AAA compared with 64% when a provider made the referral for them. Provider referral is more effective in connecting caregiving veterans with resources. Development of interagency partnerships should be fostered to help veterans decrease caregiving burden.
This project is one of the few studies looking at this special group of caregivers: veterans who serve as caregivers. It highlights the need for the VHA to establish policies and partnerships to improve caregiver support to this valuable group of veterans.
1. Ortman JM, Velkoff VA, Hogan H. An aging nation: the older population in the United States: population estimates and projections. http://www.census .gov/prod/2014pubs/p25-1140.pdf. Published May 2014. Accessed March 9, 2017.
2. Smith AK, Walter LC, Miao Y, Boscardin WJ, Covinsky KE. Disability during the last two years of life. JAMA Intern Med. 2013;173(16):1506-1513.
3. National Alliance for Caregiving, American Association of Retired Persons. Caregiving in the U.S. 2009 executive summary. http://assets.aarp.org/rgcenter/il/caregiving_09_es.pdf. Published November 2009. Accessed March 9, 2017.
4. Spillman BC, Wolff J, Freedman VA, Kasper JD; Office of the Assistant Secretary for Planning and Evaluation, U.S. Department of Health and Human Services. Informal caregiving for older Americans: an analysis of the 2011 national study of caregiving. https://aspe.hhs.gov/report/informal-caregiving-older-americans-analysis-2011-national-study-caregiving. Published April 1, 2014. Accessed March 9, 2017.
5. Feinberg L, Reinhard SC, Houser A, Choula R; AARP Public Policy Institute. Valuing the invaluable: 2011 update. The growing contributions and costs of family caregiving. https://assets.aarp .org/rgcenter/ppi/ltc/i51-caregiving.pdf. Published June 2011. Accessed March 9, 2017.
6. Adelman RD, Tmanova LL, Delgado D, Dion S, Lachs MS. Caregiver burden: a clinical review. JAMA. 2014;311(10):1052-1059.
7. Burton LC, Newsom JT, Schulz R, Hirsch CH, German PS. Preventive health behaviors among spousal caregivers. Prev Med. 1997;26(2):162-169.
8. Talley RC, Crews JE. Framing the public health of caregiving. Am J Public Health. 2007;97(2):224-228.
9. Hoffman GJ, Lee J, Mendez-Luck CA. Health behaviors among baby boomer informal caregivers. Gerontologist. 2012;52(2):219-230.
10. National Alliance for Caregiving. Caregivers of veterans—serving on the homefront: report of study findings. http://www.caregiving.org/data/2010 _Caregivers_of_Veterans_FULLREPORT_WEB_FINAL.pdf. Published November 2010. Accessed March 9, 2017.
11. Johannesen M, LoGuidice D. Elder abuse: a systematic review of risk factors in community dwelling elders. Age Ageing. 2013;42(3):292-298.
12. Goy E, Kansagara D, Freeman M;Department of Veterans Affairs, Health Services Research & Development Service. A systematic evidence review of interventions for non-professional caregivers of individuals with dementia. http://www.hsrd.research .va.gov/publications/esp/DementiaCaregivers-EXEC .pdf. Published October 2010. Accessed March 9, 2017.
13. Belle SH, Burgio L, Burns R, et al; Resources for Enhancing Alzheimer’s Caregiver Health (REACH) II Investigators. Enhancing the quality of life of dementia caregivers from different ethnic or racial groups: a randomized controlled trial. Ann Intern Med. 2006;145(10):727-738.
14. Nichols LO, Martindale-Adams J, Burns R, Graney MJ, Zuber J. Translation of a dementia caregiver support program in a health care system—REACH VA. Arch Intern Med. 2011;171(4):353-359.
15. Bass DM, Judge KS, Snow AL, et al. Caregiver outcomes of partners in dementia care: effect of a care coordination program for veterans with dementia and their family members and friends. J Am Geriatr Soc. 2013;61(8):1377-1386.
16. U.S. Department of Veteran Affairs. VA caregiver support: caregiver services. http://www.caregiver .va.gov/support/support_services.asp. Updated June 3, 2015. Accessed March 9, 2017.
17. Monin JK, Levy BR, Pietrzak RH. From serving in the military to serving loved ones: unique experiences of older veteran caregivers. Am J Geriatr Psychiatry. 2014;22(6):570-579.
18. Parker MW, Call VR, Dunkle R, Vaitkus M. “Out of sight” but not “out of mind”: parent contact and worry among senior ranking male officers in the military who live long distances from parents. Milit Psychol. 2002;14(4):257-277.
19. Lavela SL, Etingen B, Louise-Bender Pape T. Caregiving experiences and health conditions of women veteran and non-veteran caregivers. Womens Health Issues. 2013;23(4):e225-e232.
20. Yee JL, Schultz RS. Gender differences in psychiatric morbidity among family caregivers: a review and analysis. Gerontologist. 2000;40(2):147-164.
21. Collins CR. Men as caregivers of the elderly: support for the contributions of sons. J Multidiscip Healthc. 2014;7:525-531.