User login
Increased DVT Prophylaxis Resulting in Decreased Hospital‐Acquired DVT
Hospital‐acquired venous thromboembolic events (VTEs) in medically ill patients account for a significant percentage of in‐hospital mortality.1 There have been reports that 50%75% of symptomatic VTEs related to hospitalization occur in medical patients.2, 3 The incidence of hospital‐acquired pulmonary embolism (PE) and deep vein thrombosis (DVT) has been reported nationally as 0.4% and 1.3% of all hospital admissions, respectively.4 The incidence of hospital‐acquired VTEs in patients not on prophylaxis reported in the MEDENOX trial was approximately 15%, although these were predominantly asymptomatic cases.5
Several studies including the MEDENOX and PREVENT trials have supported the use of low‐molecular‐weight heparin (LMWH) and unfractionated heparin (UFH) in the prevention of VTEs.57 Based on this evidence, the American College of Chest Physicians (ACCP) developed guidelines for the use of LMWH and UFH in the prevention of VTEs in patients with acute medical illnesses.8 Despite the promulgation of these guidelines, several studies have indicated that the use of these medications remains suboptimal. Two recent studies showed that the rate of thromboprophylaxis in hospitalized medically ill patients at risk for VTEs was 15%16%.9, 10
A review by Kakkar et al. stated that the underutilization of thromboprophylaxis may be a result of lack of awareness by physicians, disagreement with the guidelines, and lack of outcome data.11 Studies have demonstrated improvement in the use of thromboprophylaxis in hospitalized patients using several strategies. One of these strategies was the use of a hospitalwide clinical pharmacy education program, resulting in the thromboprophylaxis rate improving from 11% to 44% (P < .001).12 Another strategy studied was the use of a combination of physician education, a decision support tool, and regular audit and feedback, which resulted in the rate of thromboprophylaxis increasing from 43% to 85% after 18 months.13 The use of computer alert programs was also studied and was shown to increase the use of thromboprophylaxis among hospitalized patients from 13% to 23.6% (P < 0.001).14
The objective of this article is to report the impact of a continuous quality improvement (CQI) project on adherence to the DVT prophylaxis guidelines as well as the subsequent incidence of hospital‐acquired DVT in medical patients at a large urban teaching hospital between 2002 and 2005.
METHODS
In November 2002, the Kings County Hospital Center Department of Medicine embarked on a CQI project to increase adherence to thromboprophylaxis guidelines. A 3‐tiered approach of provider education, provider reminders with decision support, and audit and feedback was taken. This cycle was repeated each month with the start of a new group of house staff and faculty attendings. This 3‐tiered approach was developed, implemented, and maintained over a 4‐year period from 2002 to 2005. The measured outcomes were rate of DVT prophylaxis and incidence of hospital‐acquired DVT.
Provider Education and Reminders with Decision Support
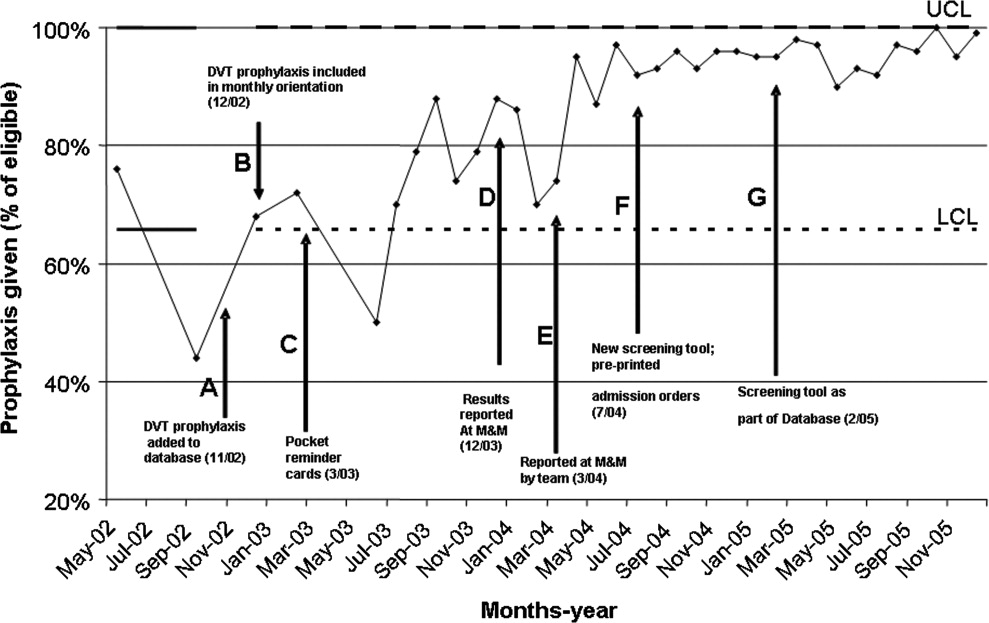
The first approach was the inclusion of DVT prophylaxis in the Assessment and Plan section of the preprinted admission database. This section on DVT prophylaxis, which required a physician to indicate if a patient required prophylaxis and the type of prophylaxis chosen, was initiated in November 2002 (Fig. 1, arrow A).

In December 2002, DVT prophylaxis was included in the learning goals and objectives handout given to house staff at the start of each inpatient rotation (Fig. 1, arrow B).
Pocket DVT prophylaxis guideline cards that outlined the indications and suggested regimens for DVT prophylaxis in the medically ill patient were issued to members of the house staff and their supervising faculty attendings at the start of each month beginning in March 2003 (Fig. 1, arrow C).
Preprinted admission orders were developed in July 2004 (Fig. 1, arrow F) that included DVT prophylaxis options. The admitting physician was required to indicate the need for DVT prophylaxis and type of prophylaxis chosen for every patient admitted.
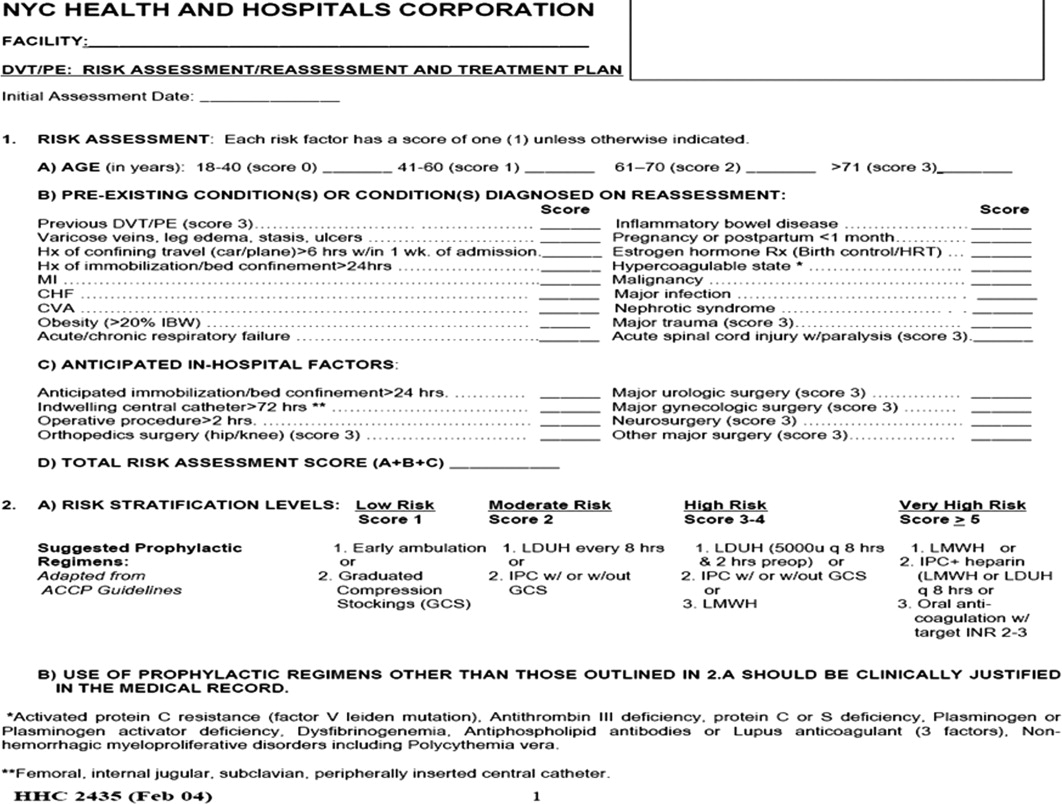
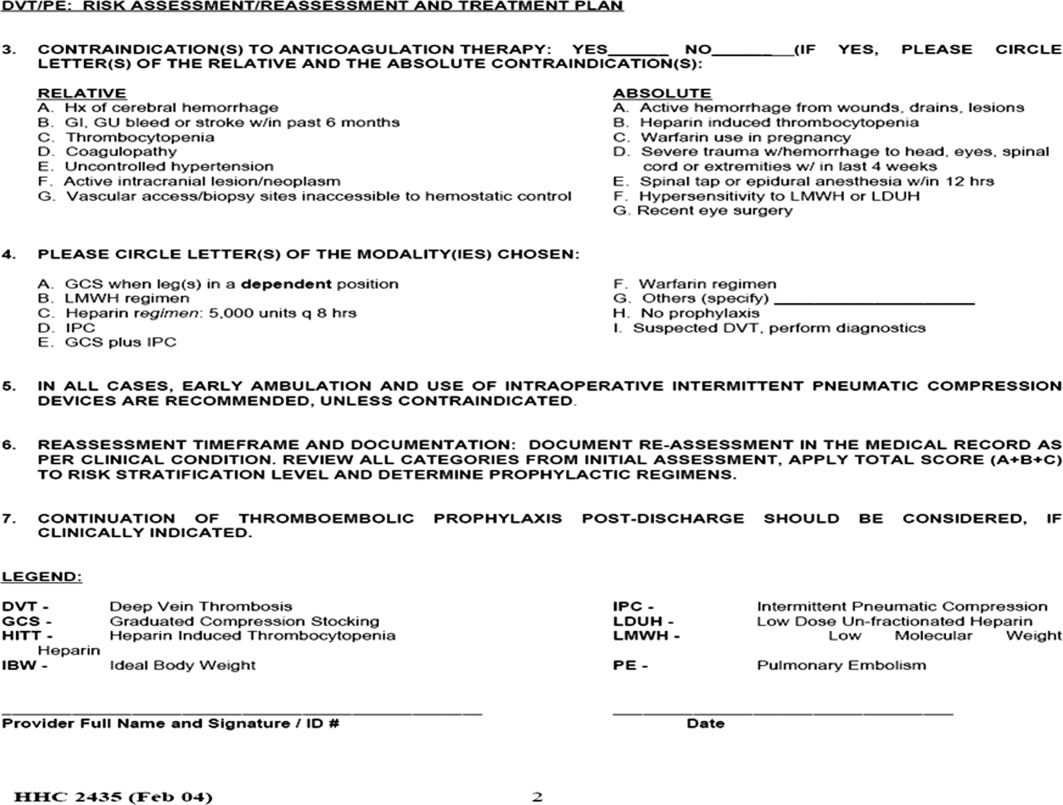
In February 2005, a standardized DVT algorithm was included in the preprinted admission database (Figs. 13). The admitting physician was required to follow this algorithm to assess for indications for DVT prophylaxis and, if needed, type of prophylaxis chosen. The signatures of the house officer who completed the form and the supervising attending were required.
Auditing
Starting in December 2003, each house‐staff medicine service team was assessed for its rate of DVT prophylaxis on a monthly basis. Two chief residents would review 7 randomly selected charts from each of the 10 general medicine house‐staff teams. The data collected included number of patients at increased risk of developing DVT who were receiving DVT prophylaxis defined as UFH, LMWH, and/or intermittent pneumatic compression. Patients were considered at increased risk of developing DVT if they had heart failure, myocardial infarction, cancer, systemic infection, a hypercoagulable state, respiratory failure, chronic obstructive pulmonary disease, pulmonary hypertension, hip or other lower extremity fracture, stroke, catatonia, or a history of previous DVT or PE. In addition, patients for whom bed rest was ordered or who were expected or observed to be immobile (ie, not get out of bed) were considered at increased risk of DVT. The DVT prophylaxis rate was the percentage of patients identified as at increased risk of developing DVT who were receiving DVT prophylaxis. The reviewers used standardized review sheets to collect the data. Each month they reviewed a total of 70 charts, which represented approximately 14% of all medicine house‐staff discharges and approximately 60% of the average daily census of the house‐staff service.
Hospital‐acquired DVT cases were actively identified and reviewed independently by the Department of Risk Management. This activity resulted from the requirement to report all hospital‐acquired DVTs to the New York State Department of Health Patient Outcome Reporting Tracking System. The risk management staff systematically reviewed all discharge International Classification of Diseases Ninth Edition (ICD‐9) codes, as well as the reports of all duplex scans of the upper and lower extremities. A review of the medical record was triggered by report of a DVT on an imaging study or the finding of either ICD‐9 code 453.8 (embolism and thrombosis of the vein) or ICD‐9 code 453.9 (embolism and thrombosis of unspecified site). The purpose of the chart review was to confirm the diagnosis of DVT and to determine if the DVT was indeed hospital acquired. Hospital‐acquired DVTs were defined as those that developed while admitted or within 30 days of discharge from Kings County Hospital Center. Developed during admission was defined as a diagnosis of DVT not being suspected at original presentation at the hospital. If DVT was suspected on admission and the patient had not been hospitalized at Kings County Hospital Center in the preceding 30 days, the case was excluded.
Feedback
Reporting of the DVT prophylaxis rate was initiated in December 2003 (Fig. 1, arrow D). During the last week of each month, the rate of DVT prophylaxis on the general medicine house‐staff service was reported at the morbidity and mortality (M&M) conference. Attendance at the M&M conference was expected of all members of the house staff and faculty attendings assigned to the general medicine service for that particular month. The conference was chaired by the chief medical residents and was attended by the chief of the department of medicine and the director of inpatient services, who actively supported the project and acknowledged the importance of DVT prophylaxis.
Starting in March 2004, team‐specific DVT prophylaxis rates were reported at the monthly M&M conference rather than a single rate for the entire house‐staff service (Fig. 1, arrow E). This feedback enabled assessment of individual team performance and created a sense of competition. Each team was composed of an attending physician, a postgraduate year 3 resident, and a postgraduate year 1 resident. The feedback was presented as a focal point of the conference each month, one of the department's continuous quality improvement measures. The annual hospital‐acquired DVT rates observed from 2002 onward were also reported at this conference. Opportunity was given for discussion, comments, and feedback at the end of each conference, and occasionally new ideas for improvement were generated.
Statistical Analysis
A generalized linear model was used to estimate 95% confidence intervals for annual DVT incidence rates and to compare rates for 20032005 with that of 2002. Bonferroni corrections were applied to P values in order to control the overall type I error rate. Calendar year was the only independent variable in the analysis.
RESULTS
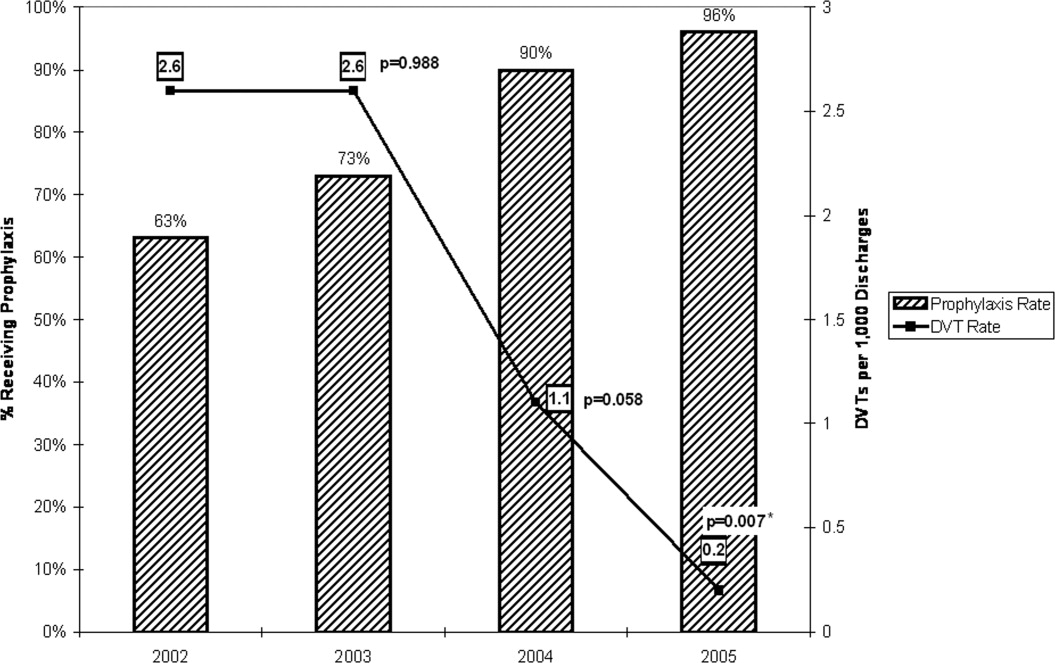
Table 1 provides cumulative yearly data for DVT prophylaxis rate, number of hospital‐acquired DVTs, and number of discharges from the general medicine house‐staff service for the 4 years of the observational period, 20022005. The baseline DVT prophylaxis rate from May 2002 to December 2002 was 63% (Fig. 4 and Table 1) and increased to 73%, 90%, and 96% over the succeeding years. In 2002, the number of hospital‐acquired DVTs on the general medicine house‐staff service was 14, followed by 16, 7, and 1 for 2003 through 2005 (Table 1). Twenty‐four of these 38 cases had not received DVT prophylaxis.
| Year | DVT prophylaxis rate | Hospital‐acquired DVTs (n) | Discharges (n) | Hospital‐acquired DVT rate (DVTs per 1000 discharges) | 95% Confidence interval | P value |
|---|---|---|---|---|---|---|
| ||||||
| 2002 (Year 1) | 63% | 14 | 5366 | 2.6 | 1.54.4 | |
| 2003 (Year 2) | 73% | 16 | 6098 | 2.6 | 1.64.3 | .988 |
| 2004 (Year 3) | 90% | 7 | 6460 | 1.1 | 0.52.3 | .058 |
| 2005 (Year 4) | 96% | 1 | 6296 | 0.2 | 0.01.1 | .007* |
When adjusted for each 1000 discharges (Fig. 4 and Table 1), the rates of hospital‐acquired DVT significantly decreased, from 2.6 per 1000 discharges (95% CI 1.54.4) in 2002 to 1.1 per 1000 discharges (95% CI 0.52.3, P = .058) in 2004 and to 0.2 per 1000 discharges (95% CI 0.01.1, P = .007) in 2005. During these years, particularly 20042005, the monthly DVT prophylaxis rate in the sample reviewed was consistently 90% or better (Fig. 1).
DISCUSSION
Our study involved active multifaceted interventions with a layered combination of provider education, provider reminders with decision support, and audit and feedback. This layered approach increased the DVT prophylaxis rate in our department, resulting in a significant decline in clinically evident hospital‐acquired DVTs from a baseline rate of 2.6 per 1000 discharges (0.26%) in 2002 to a rate of 0.2 per 1000 discharges (0.02%) in 2005 (95% CI 0.01.1, P = .007). Our baseline rate was low compared to the nationally reported incidence of 1.3%.4 Had the study not been extended over 4 years, it is likely that the statistical significance of this decline would have been missed. The rate of decrease in hospital0acquired DVTs accelerated with each year, showing no decline between 2002 and 2003, a 58% decline from 2003 to 2004, and an 82% decline from 2004 to 2005.
The acceleration in this decline coincided with the use of pocket DVT prophylaxis guideline cards and monthly audits with feedback starting in 2003 and the implementation of preprinted admission orders in 2004. This acceleration peaked in 2005 with the addition of the DVT algorithm to the admission database.
Despite the ACCP guidelines on thromboprophylaxis,8 several studies have suggested that only approximately 15%16% of medically ill patients at increased risk of VTE receive adequate thromboprophylaxis.9, 10 The 3 barriers identified by Kakkar et al. were lack of physician awareness, disagreement with the guidelines, and lack of outcome data.11 Our interventions addressed these barriers. Lack of physician awareness was addressed by provider education and reminder systems with decision support. Audit with team‐specific feedback provided the outcome data needed to demonstrate and reinforce effective change.
A critical analysis by Shojania et al. analyzed the effectiveness of each of these strategies when implemented alone. Provider education was effective in increasing provider knowledge but was generally ineffective when judged on the basis of improving patient outcomes. When provider reminders were well integrated with work flow, they were more likely to be effective. The effectiveness of decision support was variable, as it sometimes brought about change but was less likely to do so in complex situations. Various forms of audit and feedback produced small to modest effective changes.15 A systematic review by Oxman et al. suggested that there were some benefits when these strategies were implemented in a layered manner compared with single‐faceted strategies and that effective interventions were more likely to involve active rather than passive strategies.16
The major strengths of this study were the large number of patients reviewed, the sustained interventions over a 4‐year period, and the consistency of our results. The Department of Risk Management systematically reviewed all discharge ICD‐9 codes and all relevant imaging studies of 32,293 patients for the presence of hospital‐acquired DVTs. The data provided was all‐inclusive regardless of outcome and was acquired continuously over a 4‐year period rather than at a single point.
Our department continues to seek methods to increase the rate of thromboprophylaxis, and so, noting that computer alert programs have been shown to increase the appropriate use of thromboprophylaxis,14 our institution has designed an admission computer order entry program specific for DVT prophylaxis. This program prompts physicians to perform a DVT risk assessment of each admitted patient and to order the appropriate thromboprophylaxis regimen if indicated. This program was implemented in May 2006.
Limitations
Several weaknesses are inherent in a before‐and‐after study such as ours. These include the presence of background factors that can produce significant changes in processes or outcomes of interest regardless of quality improvement interventions. Another weakness is that for any given period studied, multiple unaccounted changes typically occur in a health care system and in its socioeconomic environment that might also produce the desired improvements.17 An attempt was made to mitigate the presence of background factors by including a large number of patients in our analysis, by conducting the study over 4 years rather than over a shorter period, and by analyzing data continuously throughout each year rather than at a single point. These weaknesses could be further ameliorated by a controlled before‐and‐after study design in which there would be analysis of data from 2 hospitals, one that implemented the quality improvement interventions and one that did not.
Several authority gradients were used in this initiative, including the supervising faculty attending assigned to each medical team, who was required to cosign each of the DVT risk assessment sheets in the admitting database, providing a powerful tool in the promotion of provider reminder and decision support in this initiative. The other authority gradients included the chief of medicine and the director of inpatient services, who both presided over the monthly morbidity and mortality conferences where performance feedback of the initiative was presented. The authority gradients at these performance feedback sessions were useful in promoting discussion and gaining valuable feedback, as well as in garnering ideas for improvement from the house staff. However, although these authority gradients were important in carrying out this initiative, having them may not be possible at other institutions, particularly nonacademic hospitals, and as such could potentially limit reproducibility.
Another limitation of our study is that we included only patients with DVT. Patients with PE without an identified DVT were not included. In addition, there was no specific, systematic review of complications such as heparin‐induced thrombocytopenia (HIT) and bleeding. However, our departmental and hospitalwide quality improvement programs do attempt to identify complications of treatment and adverse drug reactions. There was no observed increase in bleeding complications and only 2 cases of HIT were identified in our department during the 4‐year period studied. Reported rates of HIT and bleeding in medical patients receiving LMWH or UFH for DVT prophylaxis have been low.57, 18
The DVT cases identified from 2002 to 2005 were those that were clinically relevant. Asymptomatic, clinically silent cases were not included in this report because routine screening for subclinical DVT is not presently a part of routine general medicine inpatient care.
CONCLUSIONS
The multifaceted layered combination of provider education, provider reminders with decision support, and audit and feedback implemented at our institution could be reproduced and utilized at other institutions, particularly teaching hospitals, to address the underutilization of DVT prophylaxis in medically ill patients and to bring about a decrease in hospital‐acquired DVTs.
- ,,,.Fatal pulmonary embolism in hospitalised patients: a necropsy review.J Clin Pathol.2004;57:1254–1257.
- ,,.New onset of venous thromboembolism among hospitalized patients at Brigham and Women's Hospital is caused more often by prophylaxis failure than by withholding treatment.Chest.2000;118:1680–1684.
- ,.Preventing venous thromboembolism in medical patients.Circulation.2004;110(24 Suppl 1):IV13–IV19.
- ,,.Trends in the incidence of pulmonary embolism and deep venous thrombosis in hospitalized patients.Am J Cardiol.2005;95:1525–1526.
- ,,, et al.A comparison of enoxaparin with placebo for the prevention of venous thromboembolism in acutely ill medical patients.N Engl J Med.1999;341:793–800.
- ,,, et al.Prevention of venous thromboembolism in internal medicine with unfractionated or low‐molecular‐weight heparins: a meta‐analysis of randomised clinical trials.Thromb Haemost.2000;83(1):14–19.
- ,,, et al.Randomized, placebo‐controlled trial of dalteparin for the prevention of venous thromboembolism in acutely ill medical patients.Circulation.2004;110:874–879.
- ,,, et al.Prevention of venous thromboembolism: the Seventh ACCP Conference on Antithrombotic and Thrombolytic Therapy.Chest.2004;126(3 Suppl):338S–400S.
- ,,,.Hospitals' compliance with prophylaxis guidelines for venous thromboembolism.Am J Health Syst Pharm.2007;64(1):69–76.
- ,,, et al.Multicenter evaluation of the use of venous thromboembolism prophylaxis in acutely ill medical patients in Canada.Thromb Res.2007;119(2):145–155.
- ,,.Compliance with recommended prophylaxis for venous thromboembolism: improving the use and rate of uptake of clinical practice guidelines.J Thromb Haemost.2004;2:221–227.
- ,.Effect of a clinical pharmacy education program on improvement in the quantity and quality of venous thromboembolism prophylaxis for medically ill patients.J Manag Care Pharm.2005;11:755–762.
- ,,.Improved use of thromboprophylaxis for deep vein thrombosis following an educational intervention.J Hosp Med.2006;1:331–338.
- ,,, et al.Electronic alerts to prevent venous thromboembolism among hospitalized patients.N Engl J Med.2005;352:969–977.
- ,,,.Closing the Quality Gap: A Critical Analysis of Quality Improvement Strategies.Rockville, MD:Agency for Healthcare Research and Quality;2004.
- ,,,.No magic bullets: a systematic review of 102 trials of interventions to improve professional practice.CMAJ.1995;153:1423–1431.
- ,.Evidence‐based quality improvement: the state of the science.Health Aff (Millwood).2005;24(1):138–150.
- ,,,.Incidence and economic implications of heparin‐induced thrombocytopenia in medical patients receiving prophylaxis for venous thromboembolism.Pharmacotherapy.2006;26:1438–1445.
Hospital‐acquired venous thromboembolic events (VTEs) in medically ill patients account for a significant percentage of in‐hospital mortality.1 There have been reports that 50%75% of symptomatic VTEs related to hospitalization occur in medical patients.2, 3 The incidence of hospital‐acquired pulmonary embolism (PE) and deep vein thrombosis (DVT) has been reported nationally as 0.4% and 1.3% of all hospital admissions, respectively.4 The incidence of hospital‐acquired VTEs in patients not on prophylaxis reported in the MEDENOX trial was approximately 15%, although these were predominantly asymptomatic cases.5
Several studies including the MEDENOX and PREVENT trials have supported the use of low‐molecular‐weight heparin (LMWH) and unfractionated heparin (UFH) in the prevention of VTEs.57 Based on this evidence, the American College of Chest Physicians (ACCP) developed guidelines for the use of LMWH and UFH in the prevention of VTEs in patients with acute medical illnesses.8 Despite the promulgation of these guidelines, several studies have indicated that the use of these medications remains suboptimal. Two recent studies showed that the rate of thromboprophylaxis in hospitalized medically ill patients at risk for VTEs was 15%16%.9, 10
A review by Kakkar et al. stated that the underutilization of thromboprophylaxis may be a result of lack of awareness by physicians, disagreement with the guidelines, and lack of outcome data.11 Studies have demonstrated improvement in the use of thromboprophylaxis in hospitalized patients using several strategies. One of these strategies was the use of a hospitalwide clinical pharmacy education program, resulting in the thromboprophylaxis rate improving from 11% to 44% (P < .001).12 Another strategy studied was the use of a combination of physician education, a decision support tool, and regular audit and feedback, which resulted in the rate of thromboprophylaxis increasing from 43% to 85% after 18 months.13 The use of computer alert programs was also studied and was shown to increase the use of thromboprophylaxis among hospitalized patients from 13% to 23.6% (P < 0.001).14
The objective of this article is to report the impact of a continuous quality improvement (CQI) project on adherence to the DVT prophylaxis guidelines as well as the subsequent incidence of hospital‐acquired DVT in medical patients at a large urban teaching hospital between 2002 and 2005.
METHODS
In November 2002, the Kings County Hospital Center Department of Medicine embarked on a CQI project to increase adherence to thromboprophylaxis guidelines. A 3‐tiered approach of provider education, provider reminders with decision support, and audit and feedback was taken. This cycle was repeated each month with the start of a new group of house staff and faculty attendings. This 3‐tiered approach was developed, implemented, and maintained over a 4‐year period from 2002 to 2005. The measured outcomes were rate of DVT prophylaxis and incidence of hospital‐acquired DVT.
Provider Education and Reminders with Decision Support
The first approach was the inclusion of DVT prophylaxis in the Assessment and Plan section of the preprinted admission database. This section on DVT prophylaxis, which required a physician to indicate if a patient required prophylaxis and the type of prophylaxis chosen, was initiated in November 2002 (Fig. 1, arrow A).
In December 2002, DVT prophylaxis was included in the learning goals and objectives handout given to house staff at the start of each inpatient rotation (Fig. 1, arrow B).
Pocket DVT prophylaxis guideline cards that outlined the indications and suggested regimens for DVT prophylaxis in the medically ill patient were issued to members of the house staff and their supervising faculty attendings at the start of each month beginning in March 2003 (Fig. 1, arrow C).
Preprinted admission orders were developed in July 2004 (Fig. 1, arrow F) that included DVT prophylaxis options. The admitting physician was required to indicate the need for DVT prophylaxis and type of prophylaxis chosen for every patient admitted.
In February 2005, a standardized DVT algorithm was included in the preprinted admission database (Figs. 13). The admitting physician was required to follow this algorithm to assess for indications for DVT prophylaxis and, if needed, type of prophylaxis chosen. The signatures of the house officer who completed the form and the supervising attending were required.
Auditing
Starting in December 2003, each house‐staff medicine service team was assessed for its rate of DVT prophylaxis on a monthly basis. Two chief residents would review 7 randomly selected charts from each of the 10 general medicine house‐staff teams. The data collected included number of patients at increased risk of developing DVT who were receiving DVT prophylaxis defined as UFH, LMWH, and/or intermittent pneumatic compression. Patients were considered at increased risk of developing DVT if they had heart failure, myocardial infarction, cancer, systemic infection, a hypercoagulable state, respiratory failure, chronic obstructive pulmonary disease, pulmonary hypertension, hip or other lower extremity fracture, stroke, catatonia, or a history of previous DVT or PE. In addition, patients for whom bed rest was ordered or who were expected or observed to be immobile (ie, not get out of bed) were considered at increased risk of DVT. The DVT prophylaxis rate was the percentage of patients identified as at increased risk of developing DVT who were receiving DVT prophylaxis. The reviewers used standardized review sheets to collect the data. Each month they reviewed a total of 70 charts, which represented approximately 14% of all medicine house‐staff discharges and approximately 60% of the average daily census of the house‐staff service.
Hospital‐acquired DVT cases were actively identified and reviewed independently by the Department of Risk Management. This activity resulted from the requirement to report all hospital‐acquired DVTs to the New York State Department of Health Patient Outcome Reporting Tracking System. The risk management staff systematically reviewed all discharge International Classification of Diseases Ninth Edition (ICD‐9) codes, as well as the reports of all duplex scans of the upper and lower extremities. A review of the medical record was triggered by report of a DVT on an imaging study or the finding of either ICD‐9 code 453.8 (embolism and thrombosis of the vein) or ICD‐9 code 453.9 (embolism and thrombosis of unspecified site). The purpose of the chart review was to confirm the diagnosis of DVT and to determine if the DVT was indeed hospital acquired. Hospital‐acquired DVTs were defined as those that developed while admitted or within 30 days of discharge from Kings County Hospital Center. Developed during admission was defined as a diagnosis of DVT not being suspected at original presentation at the hospital. If DVT was suspected on admission and the patient had not been hospitalized at Kings County Hospital Center in the preceding 30 days, the case was excluded.
Feedback
Reporting of the DVT prophylaxis rate was initiated in December 2003 (Fig. 1, arrow D). During the last week of each month, the rate of DVT prophylaxis on the general medicine house‐staff service was reported at the morbidity and mortality (M&M) conference. Attendance at the M&M conference was expected of all members of the house staff and faculty attendings assigned to the general medicine service for that particular month. The conference was chaired by the chief medical residents and was attended by the chief of the department of medicine and the director of inpatient services, who actively supported the project and acknowledged the importance of DVT prophylaxis.
Starting in March 2004, team‐specific DVT prophylaxis rates were reported at the monthly M&M conference rather than a single rate for the entire house‐staff service (Fig. 1, arrow E). This feedback enabled assessment of individual team performance and created a sense of competition. Each team was composed of an attending physician, a postgraduate year 3 resident, and a postgraduate year 1 resident. The feedback was presented as a focal point of the conference each month, one of the department's continuous quality improvement measures. The annual hospital‐acquired DVT rates observed from 2002 onward were also reported at this conference. Opportunity was given for discussion, comments, and feedback at the end of each conference, and occasionally new ideas for improvement were generated.
Statistical Analysis
A generalized linear model was used to estimate 95% confidence intervals for annual DVT incidence rates and to compare rates for 20032005 with that of 2002. Bonferroni corrections were applied to P values in order to control the overall type I error rate. Calendar year was the only independent variable in the analysis.
RESULTS
Table 1 provides cumulative yearly data for DVT prophylaxis rate, number of hospital‐acquired DVTs, and number of discharges from the general medicine house‐staff service for the 4 years of the observational period, 20022005. The baseline DVT prophylaxis rate from May 2002 to December 2002 was 63% (Fig. 4 and Table 1) and increased to 73%, 90%, and 96% over the succeeding years. In 2002, the number of hospital‐acquired DVTs on the general medicine house‐staff service was 14, followed by 16, 7, and 1 for 2003 through 2005 (Table 1). Twenty‐four of these 38 cases had not received DVT prophylaxis.
| Year | DVT prophylaxis rate | Hospital‐acquired DVTs (n) | Discharges (n) | Hospital‐acquired DVT rate (DVTs per 1000 discharges) | 95% Confidence interval | P value |
|---|---|---|---|---|---|---|
| ||||||
| 2002 (Year 1) | 63% | 14 | 5366 | 2.6 | 1.54.4 | |
| 2003 (Year 2) | 73% | 16 | 6098 | 2.6 | 1.64.3 | .988 |
| 2004 (Year 3) | 90% | 7 | 6460 | 1.1 | 0.52.3 | .058 |
| 2005 (Year 4) | 96% | 1 | 6296 | 0.2 | 0.01.1 | .007* |
When adjusted for each 1000 discharges (Fig. 4 and Table 1), the rates of hospital‐acquired DVT significantly decreased, from 2.6 per 1000 discharges (95% CI 1.54.4) in 2002 to 1.1 per 1000 discharges (95% CI 0.52.3, P = .058) in 2004 and to 0.2 per 1000 discharges (95% CI 0.01.1, P = .007) in 2005. During these years, particularly 20042005, the monthly DVT prophylaxis rate in the sample reviewed was consistently 90% or better (Fig. 1).
DISCUSSION
Our study involved active multifaceted interventions with a layered combination of provider education, provider reminders with decision support, and audit and feedback. This layered approach increased the DVT prophylaxis rate in our department, resulting in a significant decline in clinically evident hospital‐acquired DVTs from a baseline rate of 2.6 per 1000 discharges (0.26%) in 2002 to a rate of 0.2 per 1000 discharges (0.02%) in 2005 (95% CI 0.01.1, P = .007). Our baseline rate was low compared to the nationally reported incidence of 1.3%.4 Had the study not been extended over 4 years, it is likely that the statistical significance of this decline would have been missed. The rate of decrease in hospital0acquired DVTs accelerated with each year, showing no decline between 2002 and 2003, a 58% decline from 2003 to 2004, and an 82% decline from 2004 to 2005.
The acceleration in this decline coincided with the use of pocket DVT prophylaxis guideline cards and monthly audits with feedback starting in 2003 and the implementation of preprinted admission orders in 2004. This acceleration peaked in 2005 with the addition of the DVT algorithm to the admission database.
Despite the ACCP guidelines on thromboprophylaxis,8 several studies have suggested that only approximately 15%16% of medically ill patients at increased risk of VTE receive adequate thromboprophylaxis.9, 10 The 3 barriers identified by Kakkar et al. were lack of physician awareness, disagreement with the guidelines, and lack of outcome data.11 Our interventions addressed these barriers. Lack of physician awareness was addressed by provider education and reminder systems with decision support. Audit with team‐specific feedback provided the outcome data needed to demonstrate and reinforce effective change.
A critical analysis by Shojania et al. analyzed the effectiveness of each of these strategies when implemented alone. Provider education was effective in increasing provider knowledge but was generally ineffective when judged on the basis of improving patient outcomes. When provider reminders were well integrated with work flow, they were more likely to be effective. The effectiveness of decision support was variable, as it sometimes brought about change but was less likely to do so in complex situations. Various forms of audit and feedback produced small to modest effective changes.15 A systematic review by Oxman et al. suggested that there were some benefits when these strategies were implemented in a layered manner compared with single‐faceted strategies and that effective interventions were more likely to involve active rather than passive strategies.16
The major strengths of this study were the large number of patients reviewed, the sustained interventions over a 4‐year period, and the consistency of our results. The Department of Risk Management systematically reviewed all discharge ICD‐9 codes and all relevant imaging studies of 32,293 patients for the presence of hospital‐acquired DVTs. The data provided was all‐inclusive regardless of outcome and was acquired continuously over a 4‐year period rather than at a single point.
Our department continues to seek methods to increase the rate of thromboprophylaxis, and so, noting that computer alert programs have been shown to increase the appropriate use of thromboprophylaxis,14 our institution has designed an admission computer order entry program specific for DVT prophylaxis. This program prompts physicians to perform a DVT risk assessment of each admitted patient and to order the appropriate thromboprophylaxis regimen if indicated. This program was implemented in May 2006.
Limitations
Several weaknesses are inherent in a before‐and‐after study such as ours. These include the presence of background factors that can produce significant changes in processes or outcomes of interest regardless of quality improvement interventions. Another weakness is that for any given period studied, multiple unaccounted changes typically occur in a health care system and in its socioeconomic environment that might also produce the desired improvements.17 An attempt was made to mitigate the presence of background factors by including a large number of patients in our analysis, by conducting the study over 4 years rather than over a shorter period, and by analyzing data continuously throughout each year rather than at a single point. These weaknesses could be further ameliorated by a controlled before‐and‐after study design in which there would be analysis of data from 2 hospitals, one that implemented the quality improvement interventions and one that did not.
Several authority gradients were used in this initiative, including the supervising faculty attending assigned to each medical team, who was required to cosign each of the DVT risk assessment sheets in the admitting database, providing a powerful tool in the promotion of provider reminder and decision support in this initiative. The other authority gradients included the chief of medicine and the director of inpatient services, who both presided over the monthly morbidity and mortality conferences where performance feedback of the initiative was presented. The authority gradients at these performance feedback sessions were useful in promoting discussion and gaining valuable feedback, as well as in garnering ideas for improvement from the house staff. However, although these authority gradients were important in carrying out this initiative, having them may not be possible at other institutions, particularly nonacademic hospitals, and as such could potentially limit reproducibility.
Another limitation of our study is that we included only patients with DVT. Patients with PE without an identified DVT were not included. In addition, there was no specific, systematic review of complications such as heparin‐induced thrombocytopenia (HIT) and bleeding. However, our departmental and hospitalwide quality improvement programs do attempt to identify complications of treatment and adverse drug reactions. There was no observed increase in bleeding complications and only 2 cases of HIT were identified in our department during the 4‐year period studied. Reported rates of HIT and bleeding in medical patients receiving LMWH or UFH for DVT prophylaxis have been low.57, 18
The DVT cases identified from 2002 to 2005 were those that were clinically relevant. Asymptomatic, clinically silent cases were not included in this report because routine screening for subclinical DVT is not presently a part of routine general medicine inpatient care.
CONCLUSIONS
The multifaceted layered combination of provider education, provider reminders with decision support, and audit and feedback implemented at our institution could be reproduced and utilized at other institutions, particularly teaching hospitals, to address the underutilization of DVT prophylaxis in medically ill patients and to bring about a decrease in hospital‐acquired DVTs.
- ,,,.Fatal pulmonary embolism in hospitalised patients: a necropsy review.J Clin Pathol.2004;57:1254–1257.
- ,,.New onset of venous thromboembolism among hospitalized patients at Brigham and Women's Hospital is caused more often by prophylaxis failure than by withholding treatment.Chest.2000;118:1680–1684.
- ,.Preventing venous thromboembolism in medical patients.Circulation.2004;110(24 Suppl 1):IV13–IV19.
- ,,.Trends in the incidence of pulmonary embolism and deep venous thrombosis in hospitalized patients.Am J Cardiol.2005;95:1525–1526.
- ,,, et al.A comparison of enoxaparin with placebo for the prevention of venous thromboembolism in acutely ill medical patients.N Engl J Med.1999;341:793–800.
- ,,, et al.Prevention of venous thromboembolism in internal medicine with unfractionated or low‐molecular‐weight heparins: a meta‐analysis of randomised clinical trials.Thromb Haemost.2000;83(1):14–19.
- ,,, et al.Randomized, placebo‐controlled trial of dalteparin for the prevention of venous thromboembolism in acutely ill medical patients.Circulation.2004;110:874–879.
- ,,, et al.Prevention of venous thromboembolism: the Seventh ACCP Conference on Antithrombotic and Thrombolytic Therapy.Chest.2004;126(3 Suppl):338S–400S.
- ,,,.Hospitals' compliance with prophylaxis guidelines for venous thromboembolism.Am J Health Syst Pharm.2007;64(1):69–76.
- ,,, et al.Multicenter evaluation of the use of venous thromboembolism prophylaxis in acutely ill medical patients in Canada.Thromb Res.2007;119(2):145–155.
- ,,.Compliance with recommended prophylaxis for venous thromboembolism: improving the use and rate of uptake of clinical practice guidelines.J Thromb Haemost.2004;2:221–227.
- ,.Effect of a clinical pharmacy education program on improvement in the quantity and quality of venous thromboembolism prophylaxis for medically ill patients.J Manag Care Pharm.2005;11:755–762.
- ,,.Improved use of thromboprophylaxis for deep vein thrombosis following an educational intervention.J Hosp Med.2006;1:331–338.
- ,,, et al.Electronic alerts to prevent venous thromboembolism among hospitalized patients.N Engl J Med.2005;352:969–977.
- ,,,.Closing the Quality Gap: A Critical Analysis of Quality Improvement Strategies.Rockville, MD:Agency for Healthcare Research and Quality;2004.
- ,,,.No magic bullets: a systematic review of 102 trials of interventions to improve professional practice.CMAJ.1995;153:1423–1431.
- ,.Evidence‐based quality improvement: the state of the science.Health Aff (Millwood).2005;24(1):138–150.
- ,,,.Incidence and economic implications of heparin‐induced thrombocytopenia in medical patients receiving prophylaxis for venous thromboembolism.Pharmacotherapy.2006;26:1438–1445.
Copyright © 2008 Society of Hospital Medicine