User login
Using the likelihood ratio
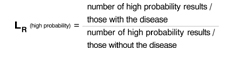
Like sensitivity and specificity, a likelihood ratio (LR) can be used to express the usefulness of diagnostic tests. A likelihood ratio is a ratio of 2 proportions: the subset of people with a particular test result among all those who have a specific disease, divided by the subset of people with the same test result among all those without the disease. The mathematical expression of this is:
![]()
What ratio results mean
Consider a study to assess the usefulness of a new blood test for colon cancer. Results of the blood test are reported as high probability of cancer, intermediate probability, or low probability.
All patients in the study undergo the blood test and colonoscopy, the gold standard for identifying colon cancer. The likelihood ratio of a “high probability” result is calculated thus:
LRs greater than 1 tell us a test result is more likely to occur among patients with the disease than among those without the disease; LRs less than 1 tell us a result is less likely to occur among patients with the disease than among patients without the disease. LRs of 10 or more usually “rule in” disease; LRs of 0.1 or less usually “rule out” disease. An LR of 1 is completely useless in ruling disease in or out.
In the example above, if LR(high probability) is 10, this means that a high probability result is 10 times more likely to occur among people with the disease than among people without it.
Advantages of the likelihood ratio. Sensitivity and specificity can be used only with test results reported as positive or negative (dichotomous results). Likelihood ratios can be used with tests that have any number of outcomes. They can also be used in one form of Bayes’ theorem, as illustrated below, which has application to the Applied Evidence article on open-angle glaucoma in this issue.
Applying the likelihood ratio in this issue
On page 119 of this issue, Aref and Schmidt discuss the risk factors and diagnosis of open-angle glaucoma (OAG). Consider a 70-year-old African American woman who has difficulty seeing in the dark and has lost some peripheral vision in both eyes. Her sister has recently received a diagnosis of OAG. The patient’s risk factors and family history make a diagnosis of OAG likely.
How can a likelihood ratio help here? Direct ophthalmoscopy is warranted to determine if the patient has an elevated cup-disc ratio (>0.6). How useful would such an examination be in this case? In general, Bayes’ theorem tells us that new information should be interpreted in light of what is already known. The form of Bayes’ theorem applicable to diagnostic tests is the following:
Posttest odds of disease = Pretest odds of disease × likelihood ratio
First, calculate pretest odds. The relationship of odds to probability is fairly simple. Let’s assume, based on the patient’s history alone, we believe there is a 33% chance she has OAG. In other words, her pretest probability of OAG is 33%. We convert this probability to odds: Odds = probability/ 1 − probability = 0.33/ 1 − 0.33 = 1/2
Her odds of disease is therefore “1 in favor to 2 against.”
Next, find posttest odds. Now let’s assume that ophthalmoscopy reveals a cup-disc ratio of 0.8. According to Aref and Schmidt’s article, a cup-disc ratio of >0.6 (ie, a “positive” ophthalmoscopic examination) has an LR+ of 16; a cup-disc ratio of <0.6 has an LR− of 0.375 (or 3/8). Since the patient has a “positive” test result, we obtain:
Posttest odds of OAG = 1/2 × 16 = 16/2 = 8/1
Translating back to probability. To make things easier, we can convert this posttest odds of 8/1 to a probability:
Probability = odds in favor/odds in favor + odds against = 8/8+1 = 0.89 (or 89%).
After combining our ophthalmoscopic examination with the history, we can conclude that the patient has an 89% chance of having OAG.
If the result of the ophthalmoscopic examination was negative,
Posttest odds of OAG = 1/2 × 3/8 = 3/16.
The corresponding probability is roughly 0.16 (or 16%).
When likelihood ratios are most useful
In general, diagnostic tests of any kind are most useful for patients like the one described— those who have an intermediate pre-test probability of disease (usually 20%–60%). Very high or very low pretest probabilities of disease are less likely to influence post-test probability of disease.
You may be concerned that the value of pretest probability we chose is subjective. Bear in mind that much of our thinking in medicine is subjective, but based upon clinical experience and knowledge. Evidence-based medicine is a complement to, not a substitute for, clinical experience. Combining the objectivity of likelihood ratios with subjective pretest probabilities using Bayes’ theorem is consistent with the principles of evidence-based medicine.
Corresponding author
Goutham Rao, MD. E-mail: raog@upmc.edu.