User login
Hospitalist-Specific Data Shows Rise in Use of Some CPT Codes

Before 2011, hospitalists had only Centers for Medicare & Medicaid Services’ (CMS) specialty-specific CPT distribution data, and no hospitalist-specific data, available when looking for benchmarks against which to compare their billing practices. Thanks to recent State of Hospital Medicine surveys, however, we now have hospitalist-specific data for the distribution of commonly used CPT codes. It’s interesting to analyze how 2011 data compares to 2012, and how the use of high-level codes varies by geographic region, employment model, compensation structure, and practice size.
In 2012, the use of the higher-level inpatient (IP) discharge code (99239) increased to 52% from 48% in 2011 among HM groups serving adults only, and the use of the highest-level IP subsequent code (99233) increased to 33% from 28% in the same comparison. This increase is in keeping with national trends. According to a May 2012 report by the Department of Health and Human Services’ Office of Inspector General, from 2001 to 2010, physicians’ billing shifted from lower-level to higher-level codes. For example, the billing of the lowest-level code (99231) decreased 16%, while the billing of the two higher-level codes (99232 and 99233) increased 6% and 9%, respectively.
Possible drivers of this change include:
- Expanded use of electronic health records (EHRs);
- Increased physician education about documentation requirements; and
- A sicker hospitalized patient population due to expanded outpatient care capabilities.
Although the proportion of high-level subsequent and discharge codes reported by SHM increased in 2012, the percent of highest-level IP admission codes (99223) actually decreased to 66% from 69%. There are many possible reasons for this. First, the elimination of consult codes by CMS in 2010 increased the overall use of admission codes but might have decreased the proportion of highest-level admission codes. Additionally, there may be an increased use of higher RVU-generating critical-care codes preferentially over billing of the highest-level admission codes. Third, there is the possibility that the extra documentation required for high-level admissions is a billing deterrent. Similarly, higher-level codes may be downcoded if documentation is lacking or incomplete.
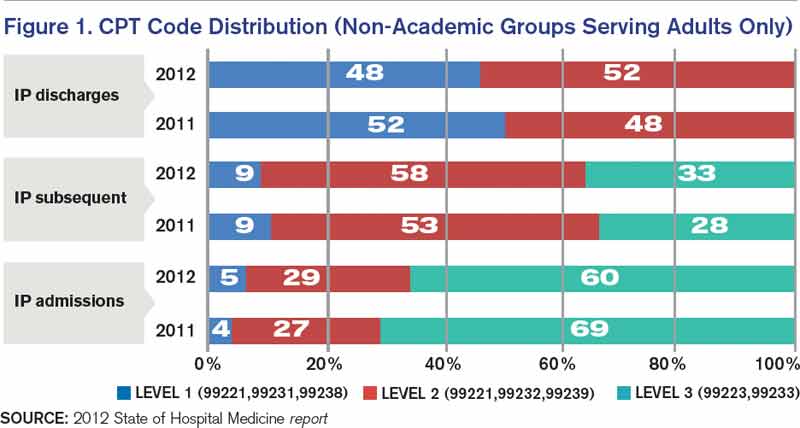
Source: 2012 State of Hospital Medicine report
Comparatively, my health system, Allina Health, showed an increase in the use of highest-level codes for all three CPT codes analyzed.
With the increasing sophistication of EHRs and coding technology tools, it will be interesting to see the future impact on coding distribution as providers adapt to new documentation processes that support health information exchange across systems.
Comparing geographic regions, the West uses the highest proportion of high-level codes for admission, follow-up, and discharge, followed by the Midwest.
Interestingly, variation in billing by group size is only correlated directly to admission codes, but not to follow-up or discharge codes—with larger services tending to bill more of the highest-level admission codes.
Admission code use correlates directly with compensation structure; groups providing 100% of total compensation in the form of salary bill the lowest percentage of high-level admission codes. As compensation trends away from straight salaries, the percentage of high-level admission codes increases. The picture is less clear for high-level follow-up and discharge codes.
Comparing academic and nonacademic HM groups shows greater use of the highest- level admission, follow-up, and discharge codes for nonacademic HM groups. This is likely because academic hospitalists can only bill for their own time and not for time spent by medical residents.
Employment model (e.g. hospital system, private hospitalist-only groups, management companies, etc.) showed no categorical effect on CPT distribution.
Dr. Stephan is regional hospitalist medical director for Allina Health in Minneapolis and the incoming chair of SHM’s Practice Analysis Committee.
Before 2011, hospitalists had only Centers for Medicare & Medicaid Services’ (CMS) specialty-specific CPT distribution data, and no hospitalist-specific data, available when looking for benchmarks against which to compare their billing practices. Thanks to recent State of Hospital Medicine surveys, however, we now have hospitalist-specific data for the distribution of commonly used CPT codes. It’s interesting to analyze how 2011 data compares to 2012, and how the use of high-level codes varies by geographic region, employment model, compensation structure, and practice size.
In 2012, the use of the higher-level inpatient (IP) discharge code (99239) increased to 52% from 48% in 2011 among HM groups serving adults only, and the use of the highest-level IP subsequent code (99233) increased to 33% from 28% in the same comparison. This increase is in keeping with national trends. According to a May 2012 report by the Department of Health and Human Services’ Office of Inspector General, from 2001 to 2010, physicians’ billing shifted from lower-level to higher-level codes. For example, the billing of the lowest-level code (99231) decreased 16%, while the billing of the two higher-level codes (99232 and 99233) increased 6% and 9%, respectively.
Possible drivers of this change include:
- Expanded use of electronic health records (EHRs);
- Increased physician education about documentation requirements; and
- A sicker hospitalized patient population due to expanded outpatient care capabilities.
Although the proportion of high-level subsequent and discharge codes reported by SHM increased in 2012, the percent of highest-level IP admission codes (99223) actually decreased to 66% from 69%. There are many possible reasons for this. First, the elimination of consult codes by CMS in 2010 increased the overall use of admission codes but might have decreased the proportion of highest-level admission codes. Additionally, there may be an increased use of higher RVU-generating critical-care codes preferentially over billing of the highest-level admission codes. Third, there is the possibility that the extra documentation required for high-level admissions is a billing deterrent. Similarly, higher-level codes may be downcoded if documentation is lacking or incomplete.
Source: 2012 State of Hospital Medicine report
Comparatively, my health system, Allina Health, showed an increase in the use of highest-level codes for all three CPT codes analyzed.
With the increasing sophistication of EHRs and coding technology tools, it will be interesting to see the future impact on coding distribution as providers adapt to new documentation processes that support health information exchange across systems.
Comparing geographic regions, the West uses the highest proportion of high-level codes for admission, follow-up, and discharge, followed by the Midwest.
Interestingly, variation in billing by group size is only correlated directly to admission codes, but not to follow-up or discharge codes—with larger services tending to bill more of the highest-level admission codes.
Admission code use correlates directly with compensation structure; groups providing 100% of total compensation in the form of salary bill the lowest percentage of high-level admission codes. As compensation trends away from straight salaries, the percentage of high-level admission codes increases. The picture is less clear for high-level follow-up and discharge codes.
Comparing academic and nonacademic HM groups shows greater use of the highest- level admission, follow-up, and discharge codes for nonacademic HM groups. This is likely because academic hospitalists can only bill for their own time and not for time spent by medical residents.
Employment model (e.g. hospital system, private hospitalist-only groups, management companies, etc.) showed no categorical effect on CPT distribution.
Dr. Stephan is regional hospitalist medical director for Allina Health in Minneapolis and the incoming chair of SHM’s Practice Analysis Committee.