User login
Trends in Industry Payments to Dermatologists: A 5-Year Analysis of Open Payments Data (2017-2021)
Financial relationships between physicians and industry are prevalent and complex and may have implications for patient care. A 2007 study reported that 94% of 3167 physicians surveyed had established some form of paid relationship with companies in the pharmaceutical industry.1 To facilitate increased transparency around these relationships, lawmakers passed the Physician Payments Sunshine Act in 2010, which requires pharmaceutical companies and device manufacturers to report all payments made to physicians.2 Mandatory disclosures include meals, honoraria, travel expenses, grants, and ownership or investment interests greater than $10. The information is displayed publicly in the Open Payments database (OPD)(https://openpayments-data.cms.gov/), a platform run by the Centers for Medicare and Medicaid Services.
The OPD allows for in-depth analyses of industry payments made to physicians. Many medical specialties—including orthopedics,3-5 plastic surgery,6,7 ophthalmology,8 and gastroenterology9—have published extensive literature characterizing the nature of these payments and disparities in the distribution of payments based on sex, geographic distribution, and other factors. After the first full year of OPD data collection for dermatology in 2014, Feng et al10 examined the number, amount, and nature of industry payments to dermatologists, as well as their geographic distribution for that year. As a follow-up to this initial research, Schlager et al11 characterized payments made to dermatologists for the year 2016 and found an increase in the total payments, mean payments, and number of dermatologists receiving payments compared with the 2014 data.
Our study aimed to characterize the last 5 years of available OPD data—from January 1, 2017, to December 31, 2021—to further explore trends in industry payments made to dermatologists. In particular, we examined the effects of the COVID-19 pandemic on payments as well as sex disparities and the distribution of industry payments.
Methods
We performed a retrospective analysis of the OPD for the general payment datasets from January 1, 2017, to December 31, 2021. The results were filtered to include only payments made to dermatologists, excluding physicians from other specialties, physician assistants, and other types of practitioners. Data for each physician were grouped by National Provider Identifier (NPI) for providers included in the set, allowing for analysis at the individual level. Data on sex were extracted from the National Plan & Provider Enumeration System’s monthly data dissemination for NPIs for July 2023 (when the study was conducted) and were joined to the OPD data using the NPI number reported for each physician. All data were extracted, transformed, and analyzed using R software (version 4.2.1). Figures and visualizations were produced using Microsoft Excel 2016.
Results
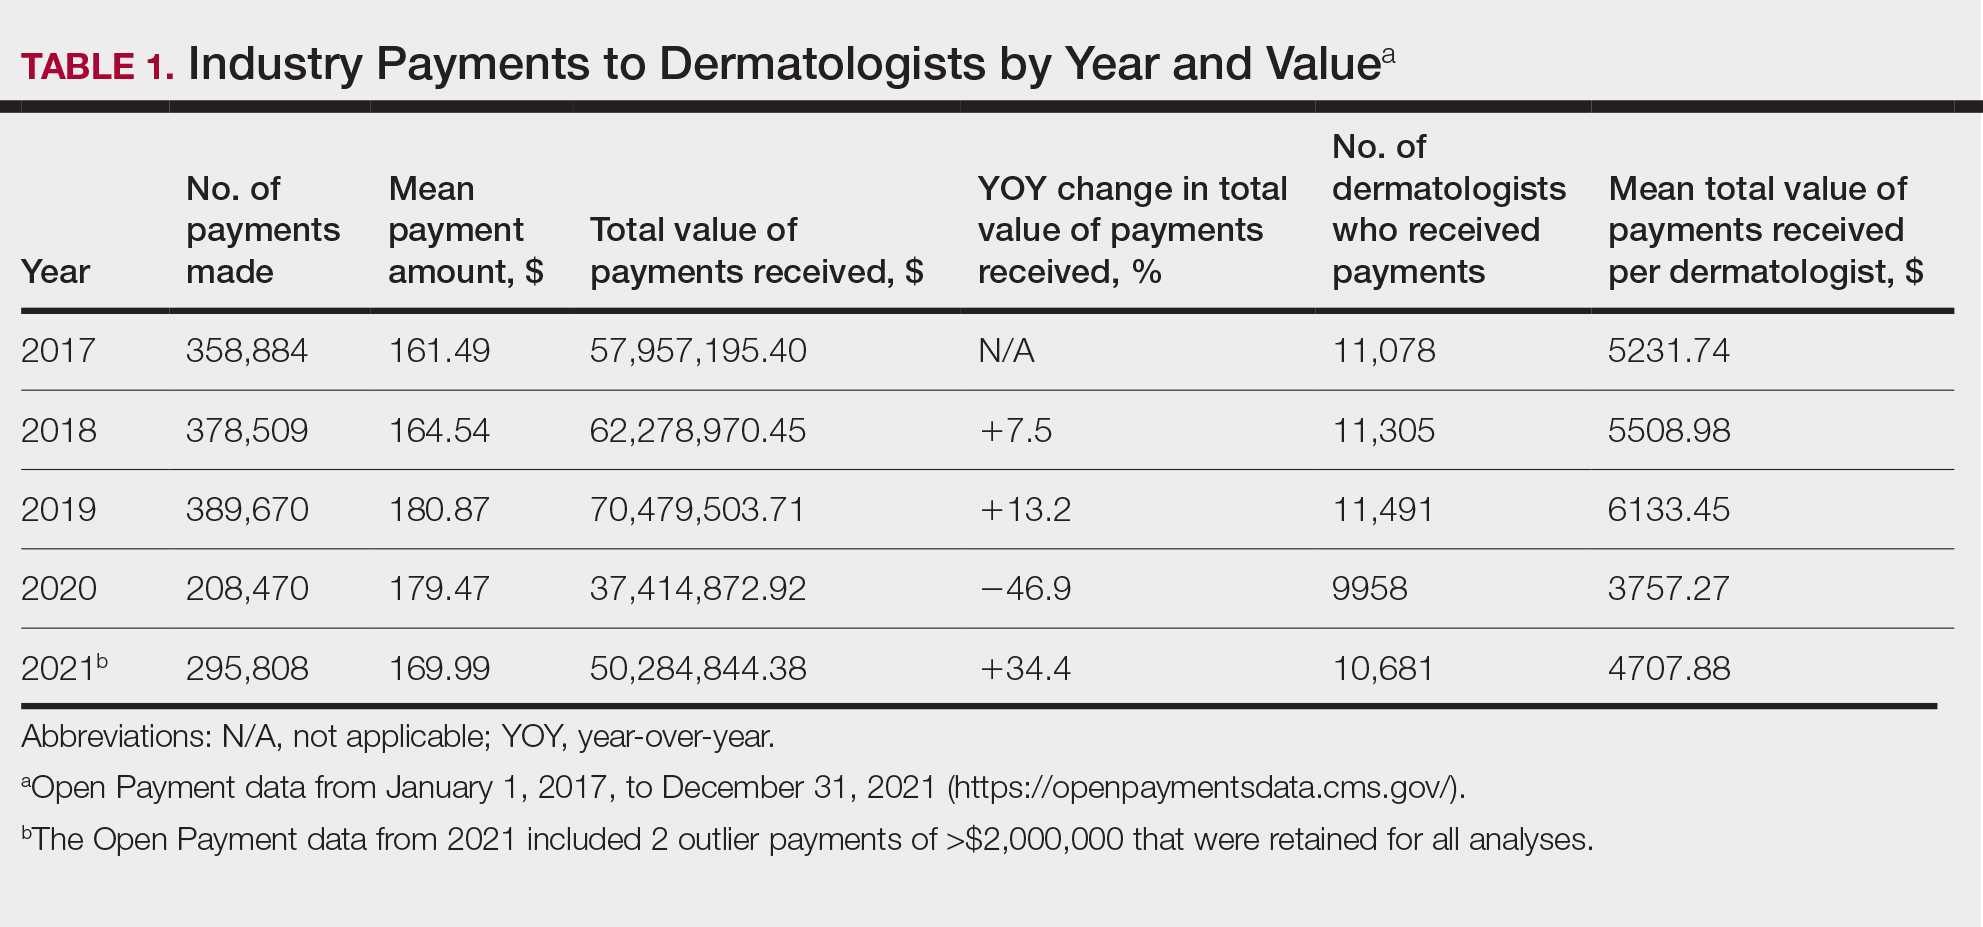
In 2017, a total of 358,884 payments were made by industry to dermatologists, accounting for nearly $58.0 million. The mean total value of payments received per dermatologist was $5231.74, and the mean payment amount was $161.49. In 2018, the total number of payments increased year-over-year by 5.5% (378,509 payments), the total value of payments received increased by 7.5% (approximately $62.3 million), and the mean total value of payments received per dermatologist increased by 5.3% ($5508.98). In 2019, the total number of payments increased by 3.0% (389,670 total payments), the total value of payments recieved increased by 13.2% (approximately $70.5 million), and the mean total value of payments received per dermatologist increased by 11.3% ($6133.45). All of these values decreased in 2020, likely due to COVID-19–related restrictions on travel and meetings (total number of payments, 208,470 [−46.5%]; total value of payments received, approximately $37.5 million [−46.9%], mean total value of payments received per dermatologist, $3757.27 [−38.7%]), but the mean payment amount remained stable at $179.47. In 2021, the total number of payments (295,808 [+41.9%]), total value of payments received (approximately $50.3 million [+34.4%]), and mean total value of payments received per dermatologist ($4707.88 [+25.3%]) all rebounded, but not to pre-2020 levels (Table 1). When looking at the geographic distribution of payments, the top 5 states receiving the highest total value of payments during the study period included California ($41.51 million), New York ($32.26 million), Florida ($21.38 million), Texas ($19.93 million), and Pennsylvania ($11.69 million).
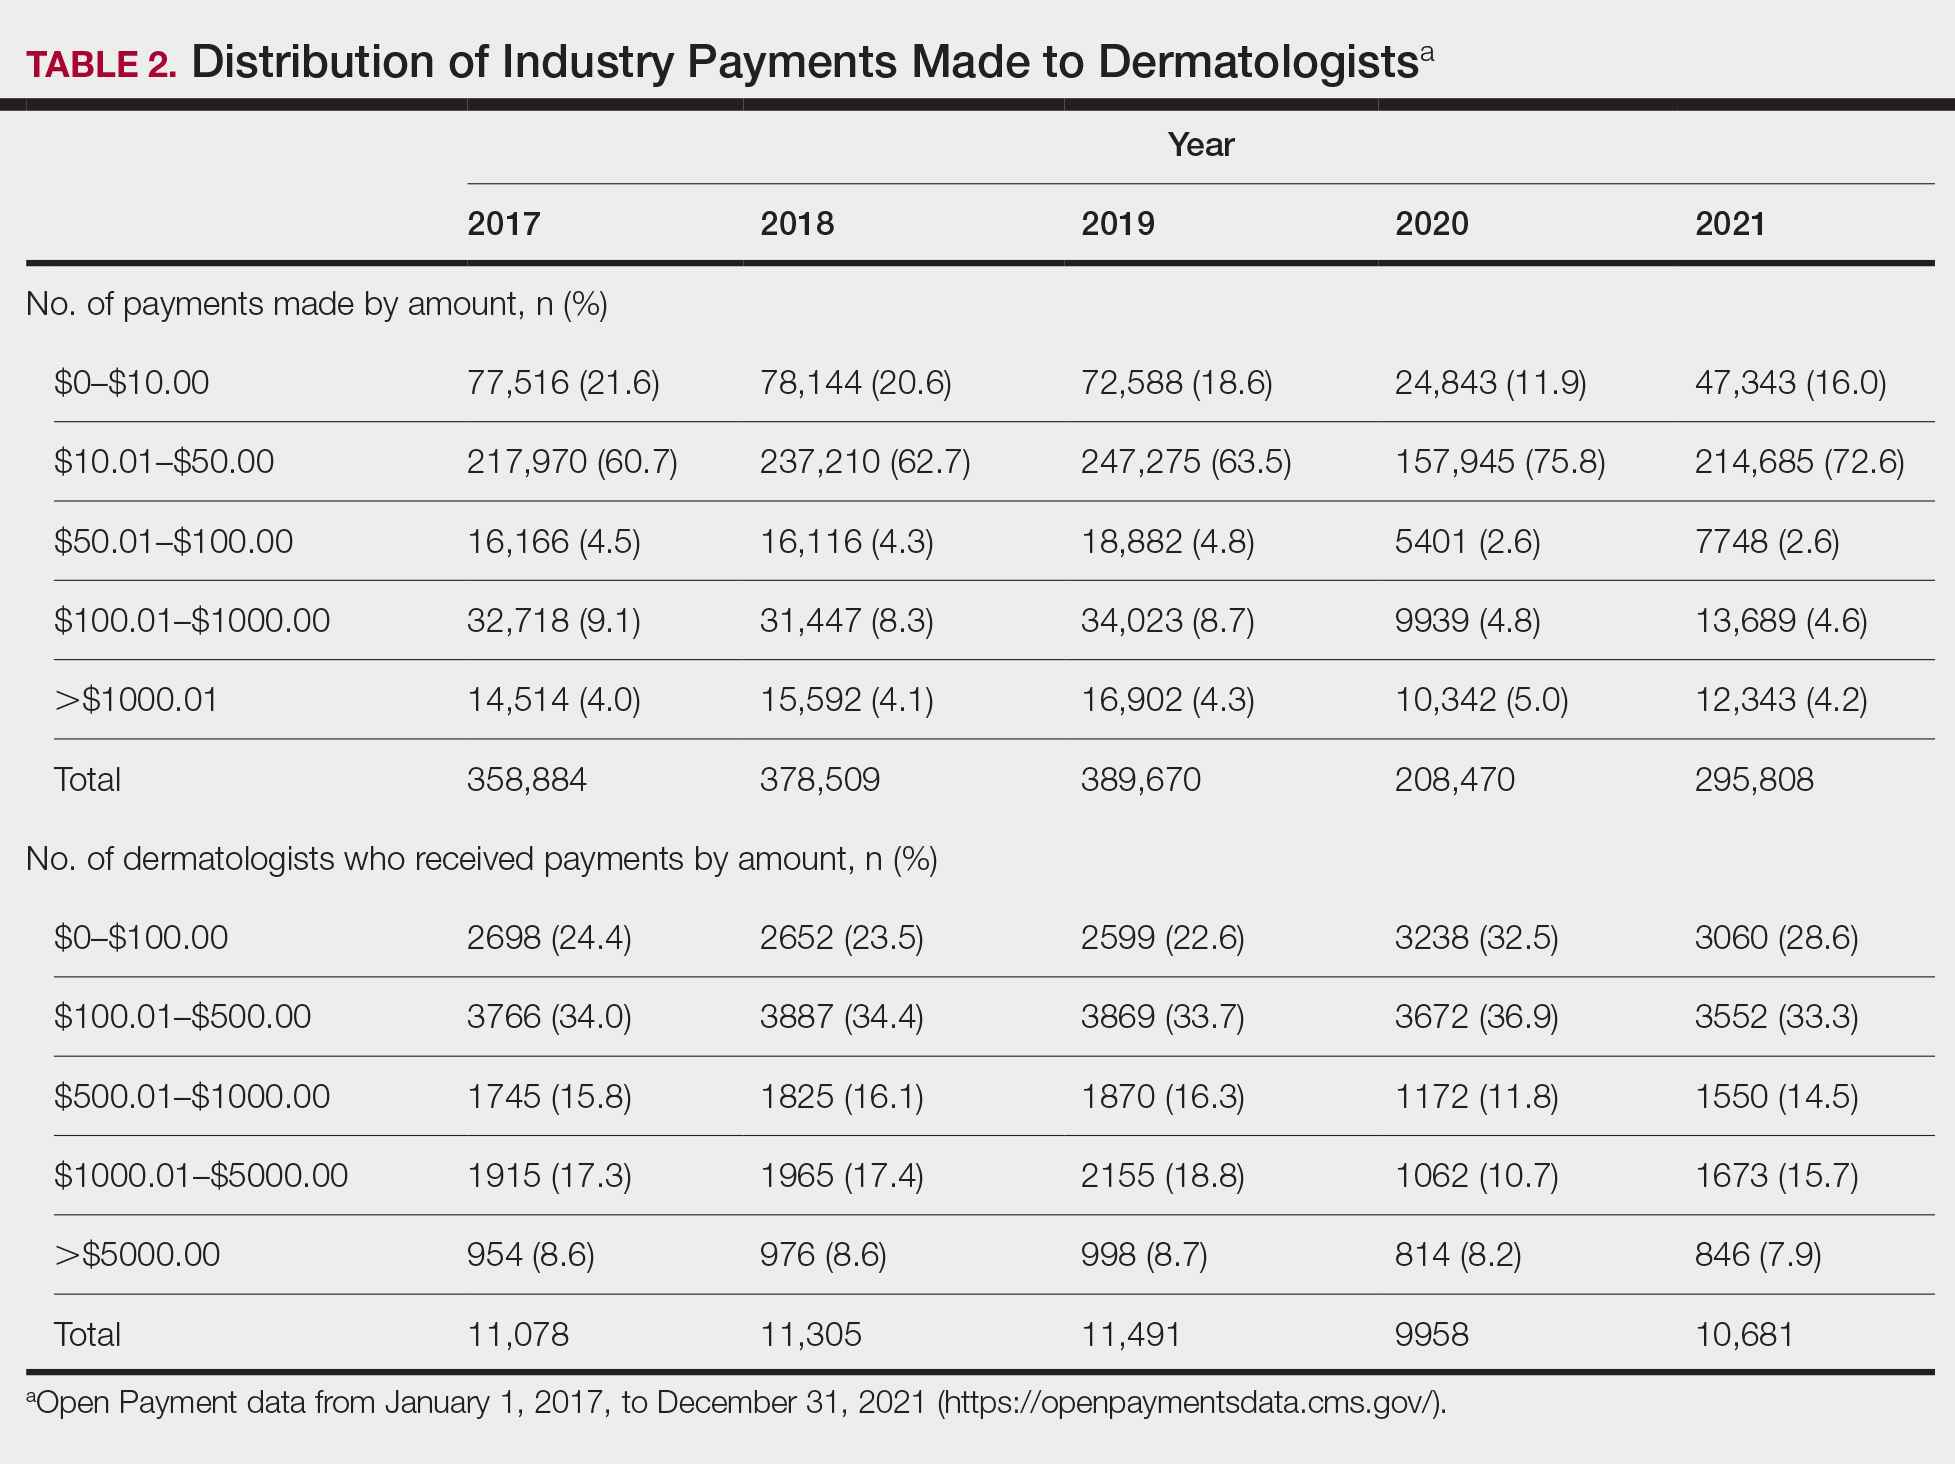
For each year from 2017 to 2021, more than 80% of payments made to dermatologists were less than $50. The majority (60.7%–75.8%) were in the $10 to $50 range. Between 4% and 5% of payments were more than $1000 for each year. Fewer than 10% of dermatologists received more than $5000 in total payments per year. Most dermatologists (33.3%–36.9%) received $100 to $500 per year. The distribution of payments stratified by number of payments made by amount and payment amount per dermatologist is further delineated in Table 2.
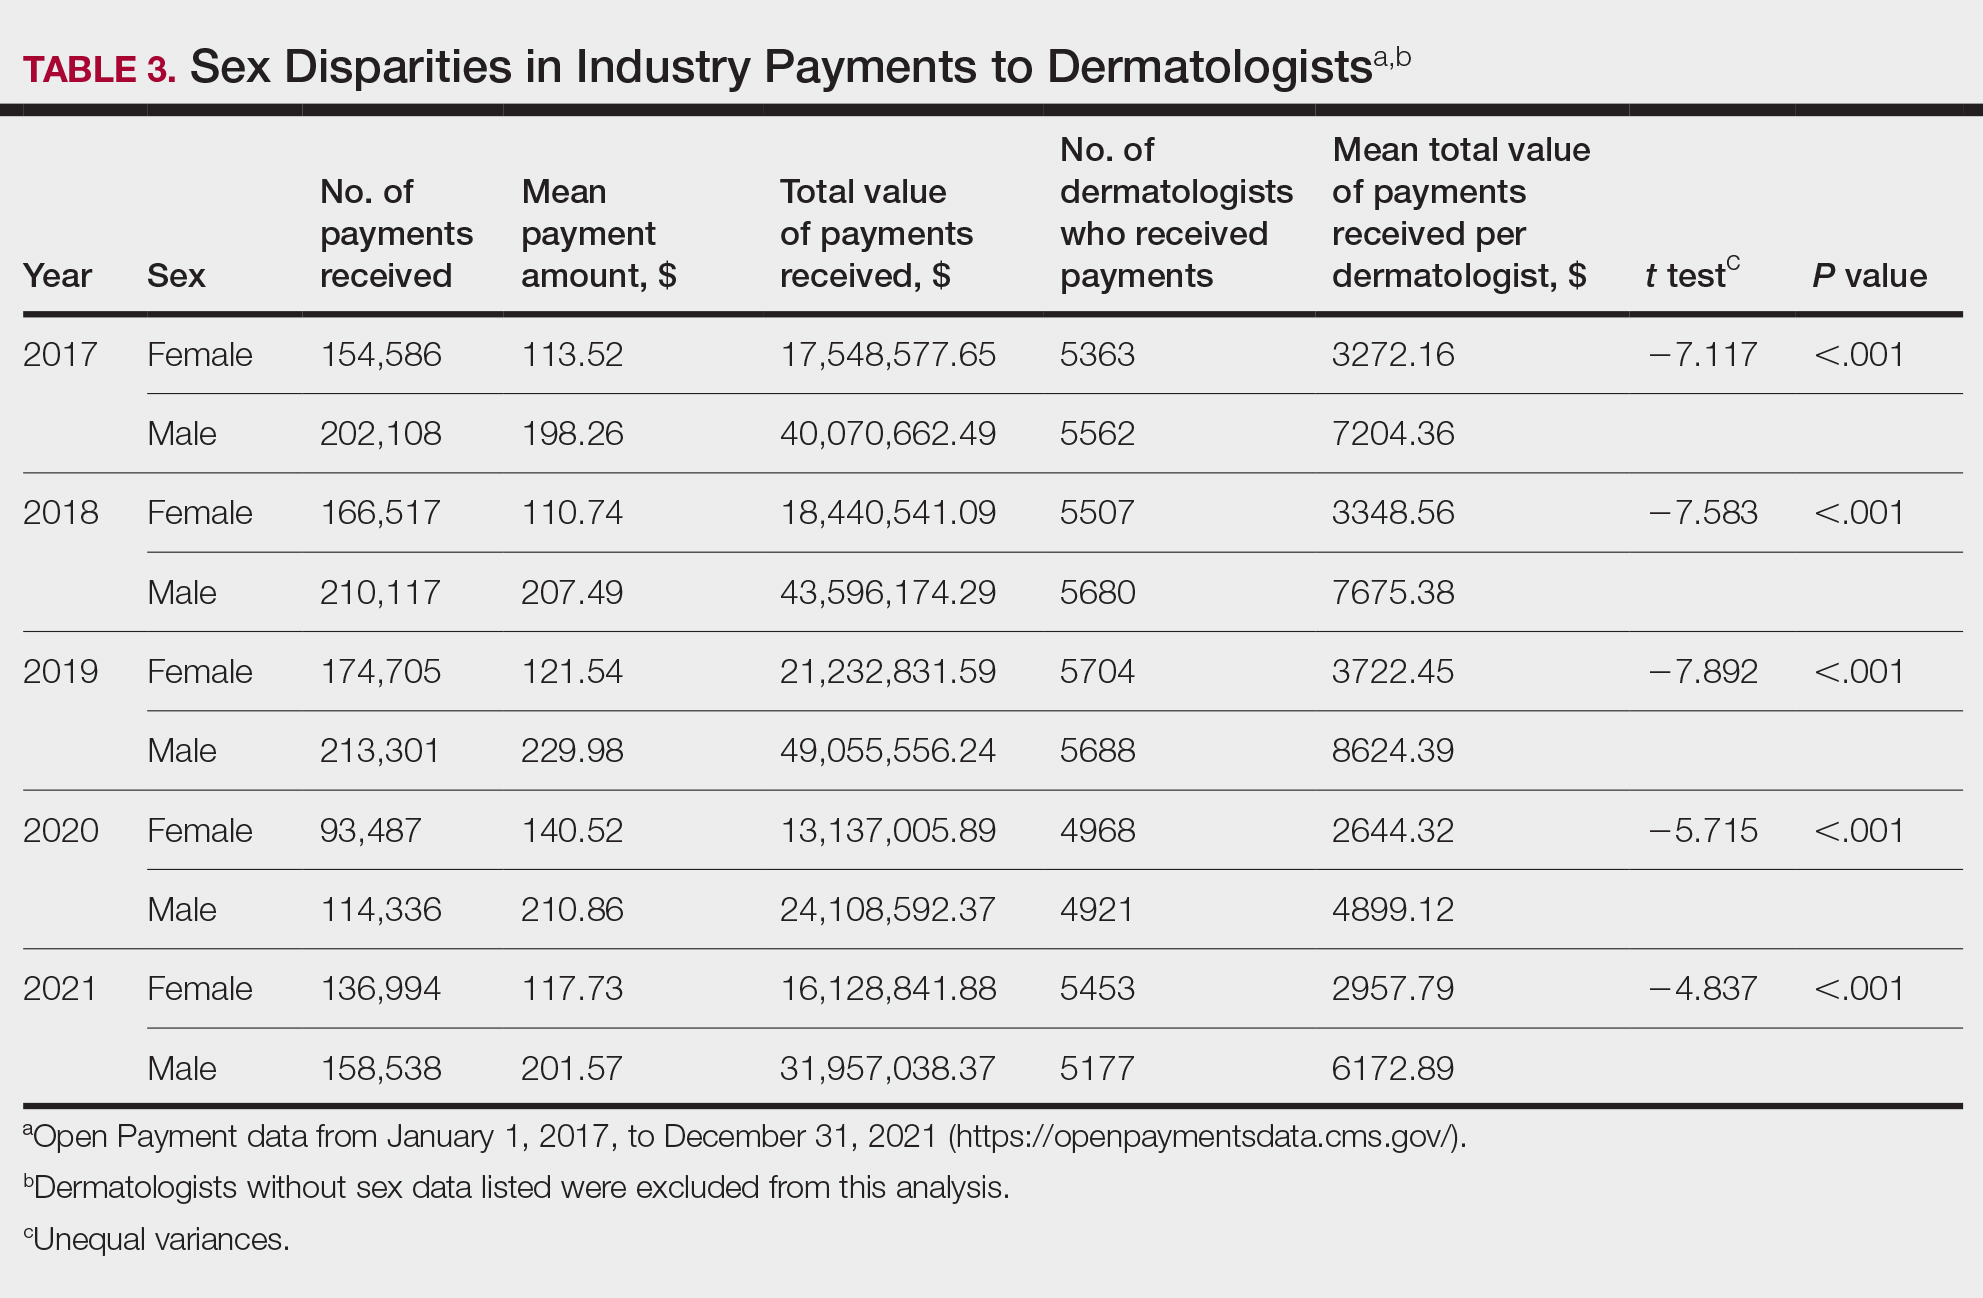
Among dermatologists who received industry payments in 2017, slightly more than half (50.9%) were male; however, male dermatologists accounted for more than $40.1 million of the more than $57.6 million total payments made to dermatologists (69.6%) that year. Male dermatologists received a mean payment amount of $198.26, while female dermatologists received a significantly smaller amount of $113.52 (P<.001). The mean total value of payments received per male dermatologist was $7204.36, while the mean total value for female dermatologists was $3272.16 (P<.001). The same statistically significant disparities in mean payment amount and mean total value of payments received by male vs female dermatologists were observed for every year from 2017 through 2021 (Table 3).
Comment
Benefits of Physician Relationships With Industry—The Physician Payments Sunshine Act increased transparency of industry payments to physicians by creating the OPD through which these relationships can be reported.12 The effects of these relationships on treatment practices have been the subject of many studies in recent years. Some have suggested that industry ties may impact prescription patterns of endorsed medications.13 It also has been reported that the chance of a research study identifying a positive outcome for a particular treatment is higher when the study is funded by a pharmaceutical company compared to other sponsors.14 On the other hand, some researchers have argued that, when established and maintained in an ethical manner, industry-physician relationships may help practitioners stay updated on the newest treatment paradigms and benefit patient care.15 Industry relationships may help drive innovation of new products with direct input from frontline physicians who take care of the patients these products aim to help.
Limitations of the OPD—Critics of the OPD have argued that the reported data lack sufficient context and are not easily interpretable by most patients.16 In addition, many patients might not know about the existence of the database. Indeed, one national survey-based study showed that only 12% of 3542 respondents knew that this information was publicly available, and only 5% knew whether their own physician had received industry payments.17
Increased Payments From Industry—Our analysis builds on previously reported data in dermatology from 2014 to 2016.10,11 We found that the trends of increasing numbers and dollar amounts of payments made by industry to dermatologists continued from 2017 to 2019, which may reflect the intended effects of the Physician Payments Sunshine Act, as more payments are being reported in a transparent manner. It also shows that relationships between industry and dermatologists have become more commonplace over time.
It is important to consider these trends in the context of overall Medicare expenditures and prescription volumes. Between 2008 and 2021, prescription volumes have been increasing at a rate of 1% to 4% per year, with 2020 being an exception as the volume decreased slightly from the year prior due to COVID-19 (−3%). Similarly, total Medicare and Medicaid expenditures have been growing at a rate of almost 5% per year.18 Based on our study results, it appears the total value of payments made between 2017 and 2021 increased at a rate that outpaced prescription volume and expenditures; however, it is difficult to draw conclusions about the relationship between payments made to dermatologists and spending without examining prescriptions specific to dermatologists in the OPD dataset. This relationship could be further explored in future studies.
COVID-19 Restrictions Impacted Payments in 2021—We hypothesize that COVID-19–related restrictions on traveling and in-person meetings led to a decrease in the number of payments, total payment amount, and mean total value of payments received per dermatologist. Notably, compensation for services other than consulting, including speaking fees, had the most precipitous decrease in total payment amount. On the other hand, honoraria and consulting fees were least impacted, as many dermatologists were still able to maintain relationships with industry on an advisory basis without traveling. From 2020 to 2021, the number of total payments and dollar amounts increased with easing of COVID-19 restrictions; however, they had not yet rebounded to 2019 levels during the study period. It will be interesting to continue monitoring these trends once data from future years become available.
Top-Compensated Dermatologists—Our study results also show that for all years from 2017 through 2021, the majority of industry payments were made to a small concentrated percentage of top-compensated dermatologists, which may reflect larger and more frequent payments to those identified by pharmaceutical companies as thought leaders and key opinion leaders in the field or those who are more willing to establish extensive ties with industry. Similarly skewed distributions in payments have been shown in other medical subspecialties including neurosurgery, plastic surgery, otolaryngology, and orthopedics.4,6,19,20 It also is apparent that the majority of compensated dermatologists in the OPD maintain relatively small ties with industry. For every year from 2017 to 2021, more than half of compensated dermatologists received total payments of less than $500 per year, most of which stemmed from the food and beverage category. Interestingly, a prior study showed that patient perceptions of industry-physician ties may be more strongly impacted by the payment category than the amount.21 For example, respondents viewed payments for meals and lodging more negatively, as they were seen more as personal gifts without direct benefit to patients. Conversely, respondents held more positive views of physicians who received free drug samples, which were perceived as benefiting patients, as well as those receiving consulting fees, which were perceived as a signal of physician expertise. Notably, in the same study, physicians who received no payments from industry were seen as honest but also were viewed by some respondents as being inexperienced or uninformed about new treatments.21
The contribution and public perception of dermatologists who conduct investigator-initiated research utilizing other types of funding (eg, government grants) also are important to consider but were not directly assessed within the scope of the current study.
Sex Disparities in Compensation—Multiple studies in the literature have demonstrated that sex inequities exist across medical specialties.22,23 In dermatology, although women make up slightly more than 50% of board-certified dermatologists, they continue to be underrepresented compared with men in leadership positions, academic rank, research funding, and lectureships at national meetings.24-27 In survey-based studies specifically examining gender-based physician compensation, male dermatologists were found to earn higher salaries than their female counterparts in both private practice and academic settings, even after adjusting for work hours, practice characteristics, and academic rank.28,29
Our study contributes to the growing body of evidence suggesting that sex inequities also may exist with regard to financial payments from industry. Our results showed that, although the number of male and female dermatologists with industry relationships was similar each year, the number of payments made and total payment amount were both significantly (P<.001) higher for male dermatologists from 2017 through 2021. In 2021, the mean payment amount ($201.57 for male dermatologists; $117.73 for female dermatologists) and mean total amount of payments received ($6172.89 and $2957.79, respectively) also were significantly higher for male compared with female dermatologists (P<.001). The cause of this disparity likely is multifactorial and warrants additional studies in the future. One hypothesis in the existing literature is that male physicians may be more inclined to seek out relationships with industry; it also is possible that disparities in research funding, academic rank, and speaking opportunities at national conferences detailed previously may contribute to inequities in industry payments as companies seek out perceived leaders in the field.30
Limitations and Future Directions—Several important limitations of our study warrant further consideration. As with any database study, the accuracy of the results presented and the conclusions drawn are highly dependent on the precision of the available data, which is reliant on transparent documentation by pharmaceutical companies and physicians. There are no independent methods of verifying the information reported. There have been reports in the literature questioning the utility of the OPD data and risk for misinterpretation.16,31 Furthermore, the OPD only includes companies whose products are covered by government-sponsored programs, such as Medicare and Medicaid, and therefore does not encompass the totality of industry-dermatologist relationships. We also focused specifically on board-certified dermatologists and did not analyze the extent of industry relationships involving residents, nurses, physician assistants, and other critical members of health care teams that may impact patient care. Differences between academic and private practice payments also could not be examined using the OPD but could present an interesting area for future studies.
Despite these limitations, our study was extensive, using the publicly available OPD to analyze trends and disparities in financial relationships between dermatologists and industry partners from 2017 through 2021. Notably, these findings are not intended to provide judgment or seek to tease out financial relationships that are beneficial for patient care from those that are not; rather, they are intended only to lend additional transparency, provoke thought, and encourage future studies and discussion surrounding this important topic.
Conclusion
Financial relationships between dermatologists and industry are complex and are becoming more prevalent, as shown in our study. These relationships may be critical to facilitate novel patient-centered research and growth in the field of dermatology; however, they also have the potential to be seen as bias in patient care. Transparent reporting of these relationships is an important step in future research regarding the effects of different payment types and serves as the basis for further understanding industry-dermatologist relationships as well as any inequities that exist in the distribution of payments. We encourage all dermatologists to review their public profiles in the OPD. Physicians have the opportunity to review all payment data reported by companies and challenge the accuracy of the data if necessary.
- Campbell EG, Gruen RL, Mountford J, et al. A national survey of physician-industry relationships. N Engl J Med. 2007;356:1742-1750.
- Kirschner NM, Sulmasy LS, Kesselheim AS. Health policy basics: the Physician Payment Sunshine Act and the Open Payments program. Ann Intern Med. 2014;161:519-521.
- Braithwaite J, Frane N, Partan MJ, et al. Review of industry payments to general orthopaedic surgeons reported by the open payments database: 2014 to 2019. J Am Acad Orthop Surg Glob Res Rev. 2021;5:E21.00060.
- Pathak N, Mercier MR, Galivanche AR, et al. Industry payments to orthopedic spine surgeons reported by the open payments database: 2014-2017. Clin Spine Surg. 2020;33:E572-E578.
- Almaguer AM, Wills BW, Robin JX, et al. Open payments reporting of industry compensation for orthopedic residents. J Surg Educ. 2020;77:1632-1637.
- Chao AH, Gangopadhyay N. Industry financial relationships in plastic surgery: analysis of the sunshine act open payments database. Plast Reconstr Surg. 2016;138:341E-348E.
- Khetpal S, Mets EJ, Ahmad M, et al. The open payments sunshine act database revisited: a 5-year analysis of industry payments to plastic surgeons. Plast Reconstr Surg. 2021;148:877E-878E.
- Slentz DH, Nelson CC, Lichter PR. Characteristics of industry payments to ophthalmologists in the open payments database. JAMA Ophthalmol. 2019;137:1038-1044.
- Gangireddy VGR, Amin R, Yu K, et al. Analysis of payments to GI physicians in the United States: open payments data study. JGH Open. 2020;4:1031-1036.
- Feng H, Wu P, Leger M. Exploring the industry-dermatologist financial relationship: insight from the open payment data. JAMA Dermatol. 2016;152:1307-1313.
- Schlager E, Flaten H, St Claire C, et al. Industry payments to dermatologists: updates from the 2016 open payment data. Dermatol Online J. 2018;24:13030/qt8r74w3c4.
- Agrawal S, Brennan N, Budetti P. The Sunshine Act—effects on physicians. N Engl J Med. 2013;368:2054-2057.
- DeJong C, Aguilar T, Tseng CW, et al. Pharmaceutical industry-sponsored meals and physician prescribing patterns for Medicare beneficiaries. JAMA Intern Med. 2016;176:1114-1122.
- Lexchin J, Bero LA, Djulbegovic B, et al. Pharmaceutical industry sponsorship and research outcome and quality: systematic review. BMJ. 2003;326:1167-1170.
- Nakayama DK. In defense of industry-physician relationships. Am Surg. 2010;76:987-994.
- Chimonas S, DeVito NJ, Rothman DJ. Bringing transparency to medicine: exploring physicians’ views and experiences of the sunshine act. Am J Bioeth. 2017;17:4-18.
- Pham-Kanter G, Mello MM, Lehmann LS, et la. Public awareness of and contact with physicians who receive industry payments: a national survey. J Gen Intern Med. 2017;32:767-774.
- National Health Expenditure Fact Sheet. Updated December 13, 2023 Accessed August 9, 2024. https://www.cms.gov/data-research/statistics-trends-and-reports/national-health-expenditure-data/nhe-fact-sheet
- de Lotbiniere-Bassett MP, McDonald PJ. Industry financial relationships in neurosurgery in 2015: analysis of the Sunshine Act Open Payments database. World Neurosurg. 2018;114:E920-E925.
- Pathak N, Fujiwara RJT, Mehra S. Assessment of nonresearch industry payments to otolaryngologists in 2014 and 2015. Otolaryngol Head Neck Surg. 2018;158:1028-1034.
- Perry JE, Cox D, Cox AD. Trust and transparency: patient perceptions of physicians’ financial relationships with pharmaceutical companies. J Law Med Ethics. 2014;42:475-491.
- Freund KM, Raj A, Kaplan SE, et al. Inequities in academic compensation by gender: a follow-up to the national faculty survey cohort study. Acad Med. 2016;91:1068-1073.
- Seabury SA, Chandra A, Jena AB. Trends in the earnings of male and female health care professionals in the United States, 1987 to 2010. JAMA Intern Med. 2013;173:1748-1750.
- Flaten HK, Goodman L, Wong E, et al. Analysis of speaking opportunities by gender at national dermatologic surgery conferences. Dermatol Surg. 2020;46:1195-1201.
- Lobl M, Grinnell M, Higgins S, et al. Representation of women as editors in dermatology journals: a comprehensive review. Int J Womens Dermatol. 2020;6:20-24.
- Stratman H, Stratman EJ. Assessment of percentage of women in the dermatology workforce presenting at American Academy of Dermatology annual meetings, 1992-2017. JAMA Dermatol. 2019;155:384-386.
- Wu AG, Lipner SR. Sex trends in leadership of the American Academy of Dermatology: a cross-sectional study. J Am Acad Dermatol. 2020;83:592-594.
- Weeks WB, Wallace AE. Gender differences in dermatologists’ annual incomes. Cutis. 2007;80:325-332.
- Sachdeva M, Price KN, Hsiao JL, et al. Gender and rank salary trends among academic dermatologists. Int J Womens Dermatol. 2020;6:324-326.
- Rose SL, Sanghani RM, Schmidt C, et al. Gender differences in physicians’ financial ties to industry: a study of national disclosure data. PLoS One. 2015;10:E0129197.
- Santhakumar S, Adashi EY. The physician payment sunshine act: testing the value of transparency. JAMA. 2015;313:23-24.
Financial relationships between physicians and industry are prevalent and complex and may have implications for patient care. A 2007 study reported that 94% of 3167 physicians surveyed had established some form of paid relationship with companies in the pharmaceutical industry.1 To facilitate increased transparency around these relationships, lawmakers passed the Physician Payments Sunshine Act in 2010, which requires pharmaceutical companies and device manufacturers to report all payments made to physicians.2 Mandatory disclosures include meals, honoraria, travel expenses, grants, and ownership or investment interests greater than $10. The information is displayed publicly in the Open Payments database (OPD)(https://openpayments-data.cms.gov/), a platform run by the Centers for Medicare and Medicaid Services.
The OPD allows for in-depth analyses of industry payments made to physicians. Many medical specialties—including orthopedics,3-5 plastic surgery,6,7 ophthalmology,8 and gastroenterology9—have published extensive literature characterizing the nature of these payments and disparities in the distribution of payments based on sex, geographic distribution, and other factors. After the first full year of OPD data collection for dermatology in 2014, Feng et al10 examined the number, amount, and nature of industry payments to dermatologists, as well as their geographic distribution for that year. As a follow-up to this initial research, Schlager et al11 characterized payments made to dermatologists for the year 2016 and found an increase in the total payments, mean payments, and number of dermatologists receiving payments compared with the 2014 data.
Our study aimed to characterize the last 5 years of available OPD data—from January 1, 2017, to December 31, 2021—to further explore trends in industry payments made to dermatologists. In particular, we examined the effects of the COVID-19 pandemic on payments as well as sex disparities and the distribution of industry payments.
Methods
We performed a retrospective analysis of the OPD for the general payment datasets from January 1, 2017, to December 31, 2021. The results were filtered to include only payments made to dermatologists, excluding physicians from other specialties, physician assistants, and other types of practitioners. Data for each physician were grouped by National Provider Identifier (NPI) for providers included in the set, allowing for analysis at the individual level. Data on sex were extracted from the National Plan & Provider Enumeration System’s monthly data dissemination for NPIs for July 2023 (when the study was conducted) and were joined to the OPD data using the NPI number reported for each physician. All data were extracted, transformed, and analyzed using R software (version 4.2.1). Figures and visualizations were produced using Microsoft Excel 2016.
Results
In 2017, a total of 358,884 payments were made by industry to dermatologists, accounting for nearly $58.0 million. The mean total value of payments received per dermatologist was $5231.74, and the mean payment amount was $161.49. In 2018, the total number of payments increased year-over-year by 5.5% (378,509 payments), the total value of payments received increased by 7.5% (approximately $62.3 million), and the mean total value of payments received per dermatologist increased by 5.3% ($5508.98). In 2019, the total number of payments increased by 3.0% (389,670 total payments), the total value of payments recieved increased by 13.2% (approximately $70.5 million), and the mean total value of payments received per dermatologist increased by 11.3% ($6133.45). All of these values decreased in 2020, likely due to COVID-19–related restrictions on travel and meetings (total number of payments, 208,470 [−46.5%]; total value of payments received, approximately $37.5 million [−46.9%], mean total value of payments received per dermatologist, $3757.27 [−38.7%]), but the mean payment amount remained stable at $179.47. In 2021, the total number of payments (295,808 [+41.9%]), total value of payments received (approximately $50.3 million [+34.4%]), and mean total value of payments received per dermatologist ($4707.88 [+25.3%]) all rebounded, but not to pre-2020 levels (Table 1). When looking at the geographic distribution of payments, the top 5 states receiving the highest total value of payments during the study period included California ($41.51 million), New York ($32.26 million), Florida ($21.38 million), Texas ($19.93 million), and Pennsylvania ($11.69 million).
For each year from 2017 to 2021, more than 80% of payments made to dermatologists were less than $50. The majority (60.7%–75.8%) were in the $10 to $50 range. Between 4% and 5% of payments were more than $1000 for each year. Fewer than 10% of dermatologists received more than $5000 in total payments per year. Most dermatologists (33.3%–36.9%) received $100 to $500 per year. The distribution of payments stratified by number of payments made by amount and payment amount per dermatologist is further delineated in Table 2.
Among dermatologists who received industry payments in 2017, slightly more than half (50.9%) were male; however, male dermatologists accounted for more than $40.1 million of the more than $57.6 million total payments made to dermatologists (69.6%) that year. Male dermatologists received a mean payment amount of $198.26, while female dermatologists received a significantly smaller amount of $113.52 (P<.001). The mean total value of payments received per male dermatologist was $7204.36, while the mean total value for female dermatologists was $3272.16 (P<.001). The same statistically significant disparities in mean payment amount and mean total value of payments received by male vs female dermatologists were observed for every year from 2017 through 2021 (Table 3).
Comment
Benefits of Physician Relationships With Industry—The Physician Payments Sunshine Act increased transparency of industry payments to physicians by creating the OPD through which these relationships can be reported.12 The effects of these relationships on treatment practices have been the subject of many studies in recent years. Some have suggested that industry ties may impact prescription patterns of endorsed medications.13 It also has been reported that the chance of a research study identifying a positive outcome for a particular treatment is higher when the study is funded by a pharmaceutical company compared to other sponsors.14 On the other hand, some researchers have argued that, when established and maintained in an ethical manner, industry-physician relationships may help practitioners stay updated on the newest treatment paradigms and benefit patient care.15 Industry relationships may help drive innovation of new products with direct input from frontline physicians who take care of the patients these products aim to help.
Limitations of the OPD—Critics of the OPD have argued that the reported data lack sufficient context and are not easily interpretable by most patients.16 In addition, many patients might not know about the existence of the database. Indeed, one national survey-based study showed that only 12% of 3542 respondents knew that this information was publicly available, and only 5% knew whether their own physician had received industry payments.17
Increased Payments From Industry—Our analysis builds on previously reported data in dermatology from 2014 to 2016.10,11 We found that the trends of increasing numbers and dollar amounts of payments made by industry to dermatologists continued from 2017 to 2019, which may reflect the intended effects of the Physician Payments Sunshine Act, as more payments are being reported in a transparent manner. It also shows that relationships between industry and dermatologists have become more commonplace over time.
It is important to consider these trends in the context of overall Medicare expenditures and prescription volumes. Between 2008 and 2021, prescription volumes have been increasing at a rate of 1% to 4% per year, with 2020 being an exception as the volume decreased slightly from the year prior due to COVID-19 (−3%). Similarly, total Medicare and Medicaid expenditures have been growing at a rate of almost 5% per year.18 Based on our study results, it appears the total value of payments made between 2017 and 2021 increased at a rate that outpaced prescription volume and expenditures; however, it is difficult to draw conclusions about the relationship between payments made to dermatologists and spending without examining prescriptions specific to dermatologists in the OPD dataset. This relationship could be further explored in future studies.
COVID-19 Restrictions Impacted Payments in 2021—We hypothesize that COVID-19–related restrictions on traveling and in-person meetings led to a decrease in the number of payments, total payment amount, and mean total value of payments received per dermatologist. Notably, compensation for services other than consulting, including speaking fees, had the most precipitous decrease in total payment amount. On the other hand, honoraria and consulting fees were least impacted, as many dermatologists were still able to maintain relationships with industry on an advisory basis without traveling. From 2020 to 2021, the number of total payments and dollar amounts increased with easing of COVID-19 restrictions; however, they had not yet rebounded to 2019 levels during the study period. It will be interesting to continue monitoring these trends once data from future years become available.
Top-Compensated Dermatologists—Our study results also show that for all years from 2017 through 2021, the majority of industry payments were made to a small concentrated percentage of top-compensated dermatologists, which may reflect larger and more frequent payments to those identified by pharmaceutical companies as thought leaders and key opinion leaders in the field or those who are more willing to establish extensive ties with industry. Similarly skewed distributions in payments have been shown in other medical subspecialties including neurosurgery, plastic surgery, otolaryngology, and orthopedics.4,6,19,20 It also is apparent that the majority of compensated dermatologists in the OPD maintain relatively small ties with industry. For every year from 2017 to 2021, more than half of compensated dermatologists received total payments of less than $500 per year, most of which stemmed from the food and beverage category. Interestingly, a prior study showed that patient perceptions of industry-physician ties may be more strongly impacted by the payment category than the amount.21 For example, respondents viewed payments for meals and lodging more negatively, as they were seen more as personal gifts without direct benefit to patients. Conversely, respondents held more positive views of physicians who received free drug samples, which were perceived as benefiting patients, as well as those receiving consulting fees, which were perceived as a signal of physician expertise. Notably, in the same study, physicians who received no payments from industry were seen as honest but also were viewed by some respondents as being inexperienced or uninformed about new treatments.21
The contribution and public perception of dermatologists who conduct investigator-initiated research utilizing other types of funding (eg, government grants) also are important to consider but were not directly assessed within the scope of the current study.
Sex Disparities in Compensation—Multiple studies in the literature have demonstrated that sex inequities exist across medical specialties.22,23 In dermatology, although women make up slightly more than 50% of board-certified dermatologists, they continue to be underrepresented compared with men in leadership positions, academic rank, research funding, and lectureships at national meetings.24-27 In survey-based studies specifically examining gender-based physician compensation, male dermatologists were found to earn higher salaries than their female counterparts in both private practice and academic settings, even after adjusting for work hours, practice characteristics, and academic rank.28,29
Our study contributes to the growing body of evidence suggesting that sex inequities also may exist with regard to financial payments from industry. Our results showed that, although the number of male and female dermatologists with industry relationships was similar each year, the number of payments made and total payment amount were both significantly (P<.001) higher for male dermatologists from 2017 through 2021. In 2021, the mean payment amount ($201.57 for male dermatologists; $117.73 for female dermatologists) and mean total amount of payments received ($6172.89 and $2957.79, respectively) also were significantly higher for male compared with female dermatologists (P<.001). The cause of this disparity likely is multifactorial and warrants additional studies in the future. One hypothesis in the existing literature is that male physicians may be more inclined to seek out relationships with industry; it also is possible that disparities in research funding, academic rank, and speaking opportunities at national conferences detailed previously may contribute to inequities in industry payments as companies seek out perceived leaders in the field.30
Limitations and Future Directions—Several important limitations of our study warrant further consideration. As with any database study, the accuracy of the results presented and the conclusions drawn are highly dependent on the precision of the available data, which is reliant on transparent documentation by pharmaceutical companies and physicians. There are no independent methods of verifying the information reported. There have been reports in the literature questioning the utility of the OPD data and risk for misinterpretation.16,31 Furthermore, the OPD only includes companies whose products are covered by government-sponsored programs, such as Medicare and Medicaid, and therefore does not encompass the totality of industry-dermatologist relationships. We also focused specifically on board-certified dermatologists and did not analyze the extent of industry relationships involving residents, nurses, physician assistants, and other critical members of health care teams that may impact patient care. Differences between academic and private practice payments also could not be examined using the OPD but could present an interesting area for future studies.
Despite these limitations, our study was extensive, using the publicly available OPD to analyze trends and disparities in financial relationships between dermatologists and industry partners from 2017 through 2021. Notably, these findings are not intended to provide judgment or seek to tease out financial relationships that are beneficial for patient care from those that are not; rather, they are intended only to lend additional transparency, provoke thought, and encourage future studies and discussion surrounding this important topic.
Conclusion
Financial relationships between dermatologists and industry are complex and are becoming more prevalent, as shown in our study. These relationships may be critical to facilitate novel patient-centered research and growth in the field of dermatology; however, they also have the potential to be seen as bias in patient care. Transparent reporting of these relationships is an important step in future research regarding the effects of different payment types and serves as the basis for further understanding industry-dermatologist relationships as well as any inequities that exist in the distribution of payments. We encourage all dermatologists to review their public profiles in the OPD. Physicians have the opportunity to review all payment data reported by companies and challenge the accuracy of the data if necessary.
- Campbell EG, Gruen RL, Mountford J, et al. A national survey of physician-industry relationships. N Engl J Med. 2007;356:1742-1750.
- Kirschner NM, Sulmasy LS, Kesselheim AS. Health policy basics: the Physician Payment Sunshine Act and the Open Payments program. Ann Intern Med. 2014;161:519-521.
- Braithwaite J, Frane N, Partan MJ, et al. Review of industry payments to general orthopaedic surgeons reported by the open payments database: 2014 to 2019. J Am Acad Orthop Surg Glob Res Rev. 2021;5:E21.00060.
- Pathak N, Mercier MR, Galivanche AR, et al. Industry payments to orthopedic spine surgeons reported by the open payments database: 2014-2017. Clin Spine Surg. 2020;33:E572-E578.
- Almaguer AM, Wills BW, Robin JX, et al. Open payments reporting of industry compensation for orthopedic residents. J Surg Educ. 2020;77:1632-1637.
- Chao AH, Gangopadhyay N. Industry financial relationships in plastic surgery: analysis of the sunshine act open payments database. Plast Reconstr Surg. 2016;138:341E-348E.
- Khetpal S, Mets EJ, Ahmad M, et al. The open payments sunshine act database revisited: a 5-year analysis of industry payments to plastic surgeons. Plast Reconstr Surg. 2021;148:877E-878E.
- Slentz DH, Nelson CC, Lichter PR. Characteristics of industry payments to ophthalmologists in the open payments database. JAMA Ophthalmol. 2019;137:1038-1044.
- Gangireddy VGR, Amin R, Yu K, et al. Analysis of payments to GI physicians in the United States: open payments data study. JGH Open. 2020;4:1031-1036.
- Feng H, Wu P, Leger M. Exploring the industry-dermatologist financial relationship: insight from the open payment data. JAMA Dermatol. 2016;152:1307-1313.
- Schlager E, Flaten H, St Claire C, et al. Industry payments to dermatologists: updates from the 2016 open payment data. Dermatol Online J. 2018;24:13030/qt8r74w3c4.
- Agrawal S, Brennan N, Budetti P. The Sunshine Act—effects on physicians. N Engl J Med. 2013;368:2054-2057.
- DeJong C, Aguilar T, Tseng CW, et al. Pharmaceutical industry-sponsored meals and physician prescribing patterns for Medicare beneficiaries. JAMA Intern Med. 2016;176:1114-1122.
- Lexchin J, Bero LA, Djulbegovic B, et al. Pharmaceutical industry sponsorship and research outcome and quality: systematic review. BMJ. 2003;326:1167-1170.
- Nakayama DK. In defense of industry-physician relationships. Am Surg. 2010;76:987-994.
- Chimonas S, DeVito NJ, Rothman DJ. Bringing transparency to medicine: exploring physicians’ views and experiences of the sunshine act. Am J Bioeth. 2017;17:4-18.
- Pham-Kanter G, Mello MM, Lehmann LS, et la. Public awareness of and contact with physicians who receive industry payments: a national survey. J Gen Intern Med. 2017;32:767-774.
- National Health Expenditure Fact Sheet. Updated December 13, 2023 Accessed August 9, 2024. https://www.cms.gov/data-research/statistics-trends-and-reports/national-health-expenditure-data/nhe-fact-sheet
- de Lotbiniere-Bassett MP, McDonald PJ. Industry financial relationships in neurosurgery in 2015: analysis of the Sunshine Act Open Payments database. World Neurosurg. 2018;114:E920-E925.
- Pathak N, Fujiwara RJT, Mehra S. Assessment of nonresearch industry payments to otolaryngologists in 2014 and 2015. Otolaryngol Head Neck Surg. 2018;158:1028-1034.
- Perry JE, Cox D, Cox AD. Trust and transparency: patient perceptions of physicians’ financial relationships with pharmaceutical companies. J Law Med Ethics. 2014;42:475-491.
- Freund KM, Raj A, Kaplan SE, et al. Inequities in academic compensation by gender: a follow-up to the national faculty survey cohort study. Acad Med. 2016;91:1068-1073.
- Seabury SA, Chandra A, Jena AB. Trends in the earnings of male and female health care professionals in the United States, 1987 to 2010. JAMA Intern Med. 2013;173:1748-1750.
- Flaten HK, Goodman L, Wong E, et al. Analysis of speaking opportunities by gender at national dermatologic surgery conferences. Dermatol Surg. 2020;46:1195-1201.
- Lobl M, Grinnell M, Higgins S, et al. Representation of women as editors in dermatology journals: a comprehensive review. Int J Womens Dermatol. 2020;6:20-24.
- Stratman H, Stratman EJ. Assessment of percentage of women in the dermatology workforce presenting at American Academy of Dermatology annual meetings, 1992-2017. JAMA Dermatol. 2019;155:384-386.
- Wu AG, Lipner SR. Sex trends in leadership of the American Academy of Dermatology: a cross-sectional study. J Am Acad Dermatol. 2020;83:592-594.
- Weeks WB, Wallace AE. Gender differences in dermatologists’ annual incomes. Cutis. 2007;80:325-332.
- Sachdeva M, Price KN, Hsiao JL, et al. Gender and rank salary trends among academic dermatologists. Int J Womens Dermatol. 2020;6:324-326.
- Rose SL, Sanghani RM, Schmidt C, et al. Gender differences in physicians’ financial ties to industry: a study of national disclosure data. PLoS One. 2015;10:E0129197.
- Santhakumar S, Adashi EY. The physician payment sunshine act: testing the value of transparency. JAMA. 2015;313:23-24.
Practice Points
- Industry payments to dermatologists are prevalent and complex and may have implications for patient care.
- To facilitate increased transparency around industry-physician relationships, lawmakers passed the Physician Payments Sunshine Act requiring pharmaceutical companies and device manufacturers to report all payments made to physicians.
- We encourage dermatologists to review their public profiles on the Open Payments database, as physicians have the opportunity to challenge the accuracy of the reported data, if applicable.