User login
The field of hospital medicine, now the fastest growing specialty in medical history,[1] was born out of pressure to improve the efficiency and quality of clinical care in US hospitals.[2] Delivering safe and high‐value clinical care is a central goal of the field and has been an essential component of its growth and success.
The clinical demands on academic hospitalists have grown recently, fueled by the need to staff services previously covered by housestaff, whose hours are now restricted. Despite these new demands, expectations have grown in other arenas as well. Academic hospitalist groups (AHGs) are often expected to make significant contributions in quality improvement, patient safety, education, research, and administration. With broad expectations beyond clinical care, AHGs face unique challenges. Groups that focus mainly on providing coverage and improving clinical performance may find that they are unable to fully contribute in these other domains. To be successful, AHGs must develop strategies that balance their energies, resources, and performance.
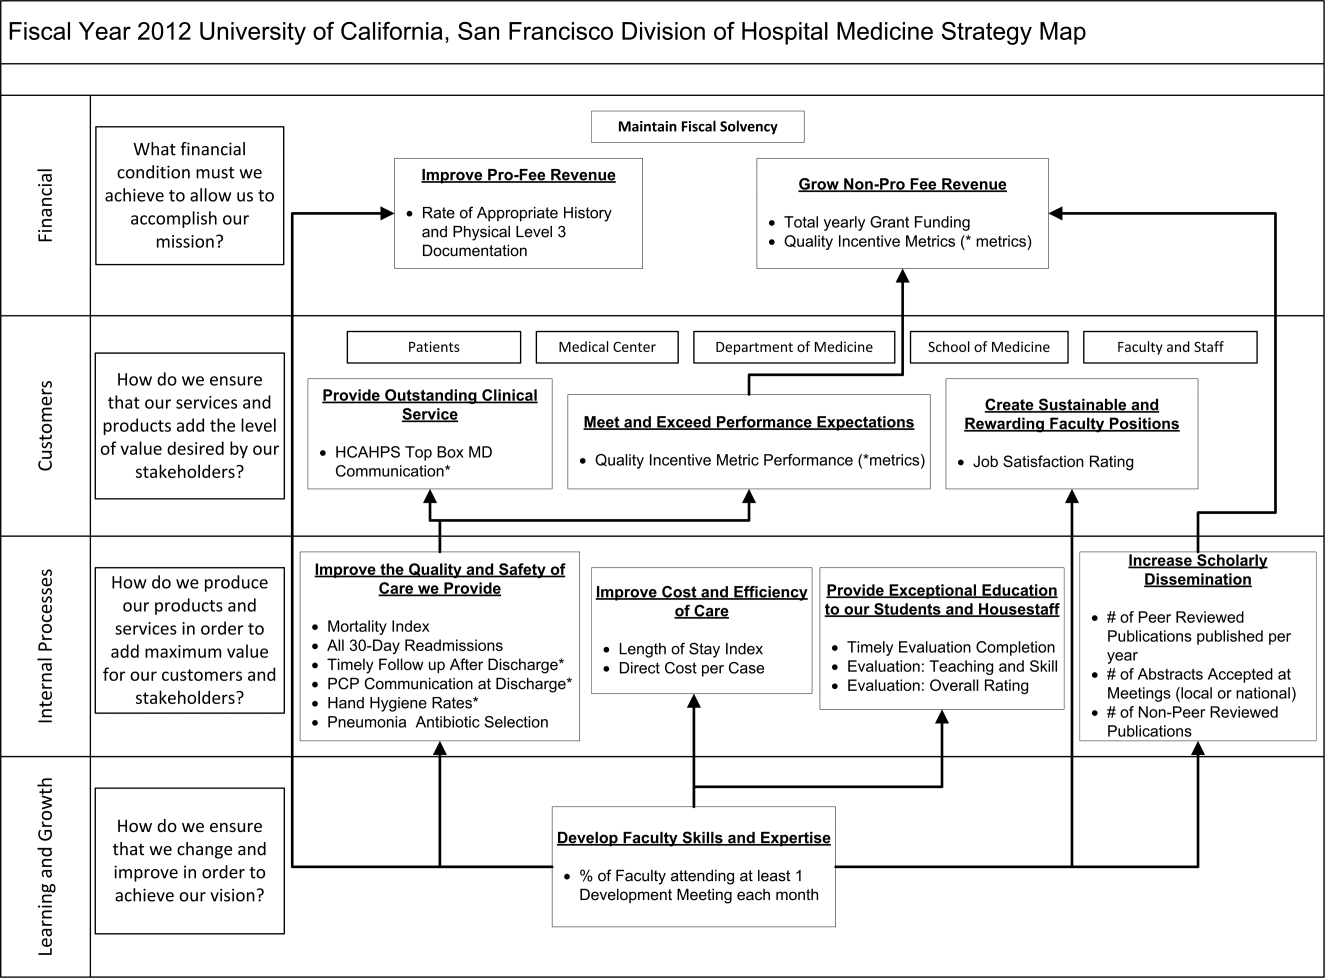
The balanced scorecard (BSC) was introduced by Kaplan and Norton in 1992 to allow corporations to view their performance broadly, rather than narrowly focusing on financial measures. The BSC requires organizations to develop a balanced portfolio of performance metrics across 4 key perspectives: financial, customers, internal processes, and learning and growth. Metrics within these perspectives should help answer fundamental questions about the organization (Table 1).[3] Over time, the BSC evolved from a performance measurement tool to a strategic management system.[4] Successful organizations translate their mission and vision to specific strategic objectives in each of the 4 perspectives, delineate how these objectives will help the organization reach its vision with a strategy map,[5] and then utilize the BSC to track and monitor performance to ensure that the vision is achieved.[6]
| BSC Perspective | Traditional Questions[3] | Questions Revised for AHCs |
|---|---|---|
| ||
| Financial | How do we look to our shareholders? | What financial condition must we be in to allow us to accomplish our mission? |
| Customers | How do customers see us? | How do we ensure that our services and products add the level of value desired by our stakeholders? |
| Internal processes | What must we excel at? | How do we produce our products and services to add maximum value for our customers and stakeholders? |
| Learning and growth | How can we continue to improve and create value? | How do we ensure that we change and improve in order to achieve our vision? |
Although originally conceived for businesses, the BSC has found its way into the healthcare industry, with reports of successful implementation in organizations ranging from individual departments to research collaboratives[7] to national healthcare systems.[8] However, there are few reports of BSC implementation in academic health centers.[9, 10] Because most academic centers are not‐for‐profit, Zelman suggests that the 4 BSC perspectives be modified to better fit their unique characteristics (Table 1).[11] To the best of our knowledge, there is no literature describing the development of a BSC in an academic hospitalist group. In this article, we describe the development of, and early experiences with, an academic hospital medicine BSC developed as part of a strategic planning initiative.
METHODS
The University of California, San Francisco (UCSF) Division of Hospital Medicine (DHM) was established in 2005. Currently, there are more than 50 faculty members, having doubled in the last 4 years. In addition to staffing several housestaff and nonhousestaff clinical services, faculty are involved in a wide variety of nonclinical endeavors at local and national levels. They participate and lead initiatives in education, faculty development, patient safety, care efficiency, quality improvement, information technology, and global health. There is an active research enterprise that generates nearly $5 million in grant funding annually.
Needs Assessment
During a division retreat in 2009, faculty identified several areas in need of improvement, including: clinical care processes, educational promotion, faculty development, and work‐life balance. Based on these needs, divisional mission and vision statements were created (Table 2).
|
| Our mission: to provide the highest quality clinical care, education, research, and innovation in academic hospital medicine. |
| Our vision: to be the best division of hospital medicine by promoting excellence, integrity, innovation, and professional satisfaction among our faculty, trainees, and staff. |
Division leadership made it a priority to create a strategic plan to address these wide‐ranging issues. To accomplish this, we recognized the need to develop a formal way of translating our vision into specific and measurable objectives, establish systems of performance measurement, improve accountability, and effectively communicate these strategic goals to the group. Based on these needs, we set out to develop a divisional BSC.
Development
At the time of BSC development, the DHM was organized into 4 functional areas: quality and safety, education, faculty development, and academics and research. A task force was formed, comprised of 8 senior faculty representing these key areas. The mission and vision statements were used as the foundation for the development of division goals and objectives. The group was careful to choose objectives within each of the 4 BSC perspectives for academic centers, as defined by Zelman (Table 1). The taskforce then brainstormed specific metrics that would track performance within the 4 functional areas. The only stipulation during this process was that the metrics had to meet the following criteria:
- Important to the division and to the individual faculty members
- Measurable through either current or developed processes
- Data are valid and their validity trusted by the faculty members
- Amenable to improvement by faculty (ie, through their individual action they could impact the metric)
From the subsequent list of metrics, we used a modified Delphi method to rank‐order them by importance to arrive at our final set of metrics. Kaplan and Norton noted that focusing on a manageable number of metrics (ie, a handful in each BSC perspective) is important for an achievable strategic vision.[6] With the metrics chosen, we identified data sources or developed new systems to collect data for which there was no current source. We assigned individuals responsible for collecting and analyzing the data, identified local or national benchmarks, if available, and established performance targets for the coming year, when possible.
The BSC is updated quarterly, and results are presented to the division during a noon meeting and posted on the division website. Metrics are re‐evaluated on a yearly basis. They are continued, modified, or discarded depending on performance and/or changes in strategic priorities.
The initial BSC focused on division‐wide metrics and performance. Early efforts to develop the scorecard were framed as experimental, with no clear decision taken regarding how metrics might ultimately be used to improve performance (ie, how public to make both individual and group results, whether to tie bonus payments to performance).
RESULTS
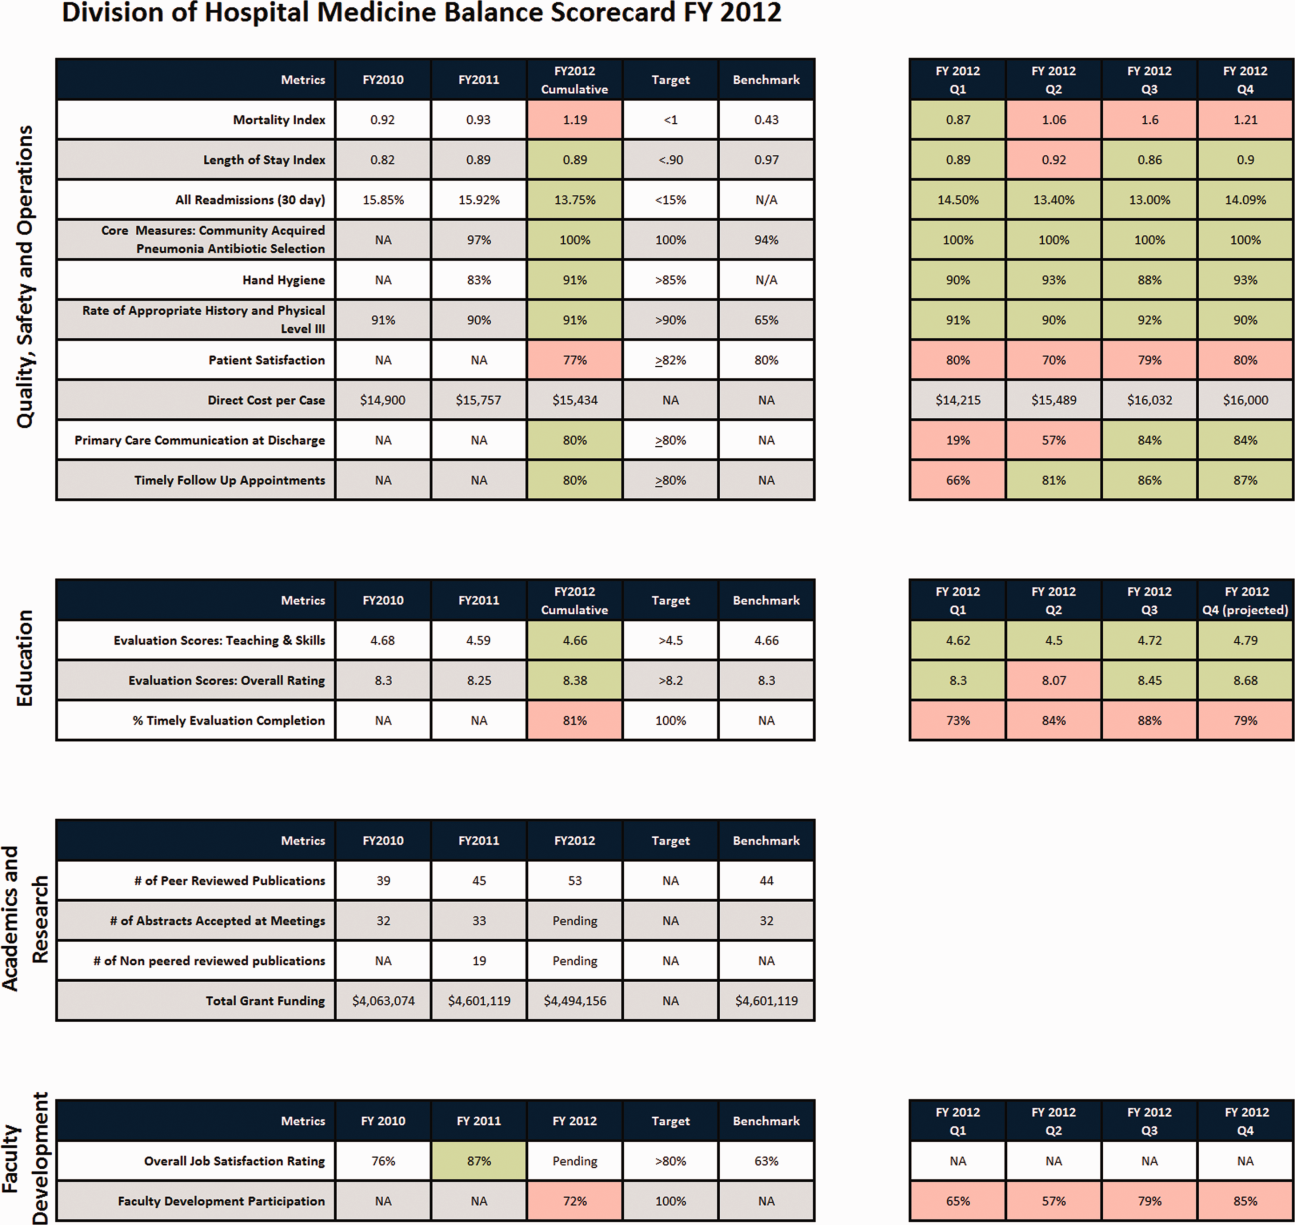
There were 41 initial metrics considered by the division BSC task force (Table 3). Of these, 16 were chosen for the initial BSC through the modified Delphi method. Over the past 2 years, these initial metrics have been modified to reflect current strategic goals and objectives. Figure 1 illustrates the BSC for fiscal year (FY) 2012. An online version of this, complete with graphical representations of the data and metric definitions, can be found at
| Quality, Safety, and Operations | Education | Academics and Research | Faculty Development |
|---|---|---|---|
| |||
| Appropriate level of care | CME courses taught | Abstracts accepted | Attendance and participation |
| Billing and documentation | Curriculum development | Academic reputation | Being an agent of change |
| Clinical efficiency | Student/housestaff feedback | Grant funding | Division citizenship |
| Clinical professionalism | Mentoring | Mentorship | Job satisfaction |
| Communication | Quality of teaching rounds | Papers published | Mentorship |
| Core measures performance | Participation in national organizations | Committees and task forces | |
| Practice evidence‐based medicine | |||
| Fund of knowledge | |||
| Guideline adherence | |||
| Unplanned transfers to ICU | |||
| Implementation and initiation of projects | |||
| Length of stay | |||
| Medical errors | |||
| Mortality | |||
| Multidisciplinary approach to patient care | |||
| Multisource feedback evaluations | |||
| Never events | |||
| Patient‐centered care | |||
| Patient satisfaction | |||
| Practice‐based learning | |||
| Procedures | |||
| Readmissions | |||
| Reputation and expertise | |||
| Seeing patient on the day of admission | |||
| Quality of transfers of care | |||
DISCUSSION
Like many hospitalist groups, our division has experienced tremendous growth, both in our numbers and the breadth of roles that we fill. With this growth has come increasing expectations in multiple domains, competing priorities, and limited resources. We successfully developed a BSC as a tool to help our division reach its vision: balancing high quality clinical care, education, academics, and faculty development while maintaining a strong sense of community. We have found that the BSC has helped us meet several key goals.
The first goal was to allow for a broad view of our performance. This is the BSC's most basic function, and we saw immediate and tangible benefits. The scorecard provided a broad snapshot of our performance in a single place. For example, in the clinical domain, we saw that our direct cost per case was increasing despite our adjusted average length of stay remaining stable from FY2010‐FY2011. In academics and research, we saw that the number of abstracts accepted at national meetings increased by almost 30% in FY2011 (Figure 1).
The second goal was to create transparency and accountability. By measuring performance and displaying it on the division Web site, the BSC has promoted transparency. If performance does not meet our targets, the division as a whole becomes accountable. Leadership must understand why performance fell short and initiate changes to improve it. For instance, the rising direct cost per case has spurred the development of a high‐value care committee tasked with finding ways of reducing cost while providing high‐quality care.[12]
The third goal was to communicate goals and engage our faculty. As our division has grown, ensuring a shared vision among our entire faculty became an increasing challenge. The BSC functions as a communication platform between leadership and faculty, and yielded multiple benefits. As the metrics were born out of our mission and vision, the BSC has become a tangible representation of our core values. Moreover, individual faculty can see that they are part of a greater, high‐performing organization and realize they can impact the group's performance through their individual effort. For example, this has helped promote receptivity to carefully disseminated individual performance measures for billing and documentation, and patient satisfaction, in conjunction with faculty development in these areas.
The fourth goal was to ensure that we use data to guide strategic decisions. We felt that strategic decisions needed to be based on objective, rather than perceived or anecdotal, information. This meant translating our vision into measurable objectives that would drive performance improvement. For example, before the BSC, we were committed to the dissemination of our research and innovations. Yet, we quickly realized that we did not have a system to collect even basic data on academic performancea deficit we filled by leveraging information gathered from online databases and faculty curricula vitae. These data allowed us, for the first time, to objectively reflect on this as a strategic goal and to have an ongoing mechanism to monitor academic productivity.
Lessons Learned/Keys to Success
With our initial experience, we have gained insight that may be helpful to other AHGs considering implementing a BSC. First, and most importantly, AHGs should take the necessary time to build consensus and buy‐in. Particularly in areas where data are analyzed for the first time, faculty are often wary about the validity of the data or the purpose and utility of performance measurement. Faculty may be concerned about how collection of performance data could affect promotion or create a hostile and competitive work environment.
This concern grows when one moves from division‐wide to individual data. It is inevitable that the collection and dissemination of performance data will create some level of discomfort among faculty members, which can be a force for improvement or for angst. These issues should be anticipated, discussed, and actively managed. It is critical to be transparent with how data will be used. We have made clear that the transition from group to individual performance data, and from simple transparency to incentives, will be done thoughtfully and with tremendous input from our faculty. This tension can also be mitigated by choosing metrics that are internally driven, rather than determined by external groups (ie, following the principle that the measures should be important to the division and individual faculty members).
Next, the process of developing a mature BSC takes time. Much of our first year was spent developing systems for measurement, collecting data, and determining appropriate comparators and targets. The data in the first BSC functioned mainly as a baseline marker of performance. Some metrics, particularly in education and academics, had no national or local benchmarks. In these cases we identified comparable groups (such as other medical teaching services or other well‐established AHGs) or merely used our prior year's performance as a benchmark. Also, some of our metrics did not initially have performance targets. In most instances, this was because this was the first time that we looked at these data, and it was unclear what an appropriate target would be until more data became available.
Moving into our third year, we are seeing a natural evolution in the BSC's use. Some metrics that were initially chosen have been replaced or modified to reflect changing goals and priorities. Functional directors participate in choosing and developing performance metrics in their area. Previously, there was no formal structure for these groups to develop and measure strategic objectives and be accountable for performance improvement. They are now expected to define goals with measurable outcomes, to report progress to division leadership, and to develop their own scorecard to track performance. Each group chooses 2 to 4 metrics within their domain that are the most important for the division to improve on, which are then included in the division BSC.
We have also made efforts to build synergy between our BSC and performance goals set by external groups. Although continuing to favor metrics that are internally driven and meaningful to our faculty, we recognize that our goals must also reflect the needs and interests of broader stakeholders. For example, hand hygiene rates and patient satisfaction scores are UCSF medical center and divisional priorities (the former includes them in a financial incentive system for managers, staff, and many physicians) and are incorporated into the BSC as division‐wide incentive metrics.
Limitations
Our project has several limitations. It was conducted at a single institution, and our metrics may not be generalizable to other groups. However, the main goal of this article was not to focus on specific metrics but the process that we undertook to choose and develop them. Other institutions will likely identify different metrics based on their specific strategic objectives. We are also early in our experience with the BSC, and it is still not clear what effect it will have on the desired outcomes for our objectives. However, Henriksen recently reported that implementing a BSC at a large academic health center, in parallel with other performance improvement initiatives, resulted in substantial improvement in their chosen performance metrics.[13]
Despite the several years of development, we still view this as an early version of a BSC. To fully realize its benefits, an organization must choose metrics that will not simply measure performance but drive it. Our current BSC relies primarily on lagging measures, which show what our performance has been, and includes few leading metrics, which can predict trends in performance. As explained by Kaplan and Norton, this type of BSC risks skewing toward controlling rather than driving performance.[14] A mature BSC will include a mix of leading and lagging indicators, the combination illustrating a logical progression from measurement to performance. For instance, we measure total grant funding per year, which is a lagging indicator. However, to be most effective we could measure the percent of faculty who have attended grant‐writing workshops, the number of new grant sources identified, or the number of grant proposals submitted each quarter. These leading indicators would allow us to see performance trends that could be improved before the final outcome, total grant funding, is realized.
Finally, the issues surrounding the acceptability of this overall strategy will likely hinge on how we implement the more complex steps that relate to transparency, individual attribution, and perhaps ultimately incentives. Success in this area depends as much on culture as on strategy.
Next Steps
The next major step in the evolution of the BSC, and part of a broader faculty development program, will be the development of individual BSCs. They will be created using a similar methodology and allow faculty to reflect on their performance compared to peers and recognized benchmarks. Ideally, this will allow hospitalists in our group to establish personal strategic plans and monitor their performance over time. Individualizing these BSCs will be critical; although a research‐oriented faculty member might be striving for more than 5 publications and a large grant in a year, a clinician‐educator may seek outstanding teaching reviews and completion of a key quality improvement project. Both efforts need to be highly valued, and the divisional BSC should roll up these varied individual goals into a balanced whole.
In conclusion, we successfully developed and implemented a BSC to aid in strategic planning. The BSC ensures that we make strategic decisions using data, identify internally driven objectives, develop systems of performance measurement, and increase transparency and accountability. Our hope is that this description of the development of our BSC will be useful to other groups considering a similar endeavor.
Acknowledgments
The authors thank Noori Dhillon, Sadaf Akbaryar, Katie Quinn, Gerri Berg, and Maria Novelero for data collection and analysis. The authors also thank the faculty and staff who participated in the development process of the BSC.
Disclosure
Nothing to report.
- . The hospitalist field turns 15: new opportunities and challenges. J Hosp Med. 2011;6(4):E1–E4.
- , . The emerging role of “hospitalists” in the American health care system. N Engl J Med. 1996;335(7):514–517.
- , . The balanced scorecard—measures that drive performance. Harv Bus Rev. 1992;70(1):71–79.
- , . Using the balanced scorecard as a strategic management system. Harv Bus Rev. 1996;74(1):75–85.
- , . Having trouble with your strategy? Then map it. Harv Bus Rev. 2000;78:167–176, 202.
- , . Putting the balanced scorecard to work. Harv Bus Rev. 1993;71:134–147.
- , , , et al. Development and implementation of a performance measure tool in an academic pediatric research network. Contemp Clin Trials. 2010;31(5):429–437.
- , . Lives in the balance: an analysis of the balanced scorecard (BSC) in healthcare organizations. Int J Prod Perform Manag. 2007;57(1):6–21.
- , . The “Balanced Scorecard”: development and implementation in an academic clinical department. Acad Med. 1999;74(2):114–122.
- . Introducing a balanced scorecard management system in a university anesthesiology department. Anesth Analg. 2002;95(6):1731–1738, table of contents.
- , , , , . Issues for academic health centers to consider before implementing a balanced‐scorecard effort. Acad Med. 1999;74(12):1269–1277.
- , . Cents and sensitivity—teaching physicians to think about costs. N Engl J Med. 2012;367(2):99–101.
- , , , et al. 10‐year experience integrating strategic performance improvement initiatives: can the balanced scorecard, Six Sigma, and team training all thrive in a single hospital? In: Henriksen K, Battles JB, Keyes MA, Grady ML, eds. Advances in Patient Safety: New Directions and Alternative Approaches. Vol 3. Performance and Tools. Rockville, MD: Agency for Healthcare Research and Quality; 2008. Available at: http://www.ncbi.nlm.nih.gov/books/NBK43660. Accessed 15 June 2011.
- , . Linking the balanced scorecard to strategy. Calif Manage Rev. 1996;39(1):53–79.
The field of hospital medicine, now the fastest growing specialty in medical history,[1] was born out of pressure to improve the efficiency and quality of clinical care in US hospitals.[2] Delivering safe and high‐value clinical care is a central goal of the field and has been an essential component of its growth and success.
The clinical demands on academic hospitalists have grown recently, fueled by the need to staff services previously covered by housestaff, whose hours are now restricted. Despite these new demands, expectations have grown in other arenas as well. Academic hospitalist groups (AHGs) are often expected to make significant contributions in quality improvement, patient safety, education, research, and administration. With broad expectations beyond clinical care, AHGs face unique challenges. Groups that focus mainly on providing coverage and improving clinical performance may find that they are unable to fully contribute in these other domains. To be successful, AHGs must develop strategies that balance their energies, resources, and performance.
The balanced scorecard (BSC) was introduced by Kaplan and Norton in 1992 to allow corporations to view their performance broadly, rather than narrowly focusing on financial measures. The BSC requires organizations to develop a balanced portfolio of performance metrics across 4 key perspectives: financial, customers, internal processes, and learning and growth. Metrics within these perspectives should help answer fundamental questions about the organization (Table 1).[3] Over time, the BSC evolved from a performance measurement tool to a strategic management system.[4] Successful organizations translate their mission and vision to specific strategic objectives in each of the 4 perspectives, delineate how these objectives will help the organization reach its vision with a strategy map,[5] and then utilize the BSC to track and monitor performance to ensure that the vision is achieved.[6]
| BSC Perspective | Traditional Questions[3] | Questions Revised for AHCs |
|---|---|---|
| ||
| Financial | How do we look to our shareholders? | What financial condition must we be in to allow us to accomplish our mission? |
| Customers | How do customers see us? | How do we ensure that our services and products add the level of value desired by our stakeholders? |
| Internal processes | What must we excel at? | How do we produce our products and services to add maximum value for our customers and stakeholders? |
| Learning and growth | How can we continue to improve and create value? | How do we ensure that we change and improve in order to achieve our vision? |
Although originally conceived for businesses, the BSC has found its way into the healthcare industry, with reports of successful implementation in organizations ranging from individual departments to research collaboratives[7] to national healthcare systems.[8] However, there are few reports of BSC implementation in academic health centers.[9, 10] Because most academic centers are not‐for‐profit, Zelman suggests that the 4 BSC perspectives be modified to better fit their unique characteristics (Table 1).[11] To the best of our knowledge, there is no literature describing the development of a BSC in an academic hospitalist group. In this article, we describe the development of, and early experiences with, an academic hospital medicine BSC developed as part of a strategic planning initiative.
METHODS
The University of California, San Francisco (UCSF) Division of Hospital Medicine (DHM) was established in 2005. Currently, there are more than 50 faculty members, having doubled in the last 4 years. In addition to staffing several housestaff and nonhousestaff clinical services, faculty are involved in a wide variety of nonclinical endeavors at local and national levels. They participate and lead initiatives in education, faculty development, patient safety, care efficiency, quality improvement, information technology, and global health. There is an active research enterprise that generates nearly $5 million in grant funding annually.
Needs Assessment
During a division retreat in 2009, faculty identified several areas in need of improvement, including: clinical care processes, educational promotion, faculty development, and work‐life balance. Based on these needs, divisional mission and vision statements were created (Table 2).
|
| Our mission: to provide the highest quality clinical care, education, research, and innovation in academic hospital medicine. |
| Our vision: to be the best division of hospital medicine by promoting excellence, integrity, innovation, and professional satisfaction among our faculty, trainees, and staff. |
Division leadership made it a priority to create a strategic plan to address these wide‐ranging issues. To accomplish this, we recognized the need to develop a formal way of translating our vision into specific and measurable objectives, establish systems of performance measurement, improve accountability, and effectively communicate these strategic goals to the group. Based on these needs, we set out to develop a divisional BSC.
Development
At the time of BSC development, the DHM was organized into 4 functional areas: quality and safety, education, faculty development, and academics and research. A task force was formed, comprised of 8 senior faculty representing these key areas. The mission and vision statements were used as the foundation for the development of division goals and objectives. The group was careful to choose objectives within each of the 4 BSC perspectives for academic centers, as defined by Zelman (Table 1). The taskforce then brainstormed specific metrics that would track performance within the 4 functional areas. The only stipulation during this process was that the metrics had to meet the following criteria:
- Important to the division and to the individual faculty members
- Measurable through either current or developed processes
- Data are valid and their validity trusted by the faculty members
- Amenable to improvement by faculty (ie, through their individual action they could impact the metric)
From the subsequent list of metrics, we used a modified Delphi method to rank‐order them by importance to arrive at our final set of metrics. Kaplan and Norton noted that focusing on a manageable number of metrics (ie, a handful in each BSC perspective) is important for an achievable strategic vision.[6] With the metrics chosen, we identified data sources or developed new systems to collect data for which there was no current source. We assigned individuals responsible for collecting and analyzing the data, identified local or national benchmarks, if available, and established performance targets for the coming year, when possible.
The BSC is updated quarterly, and results are presented to the division during a noon meeting and posted on the division website. Metrics are re‐evaluated on a yearly basis. They are continued, modified, or discarded depending on performance and/or changes in strategic priorities.
The initial BSC focused on division‐wide metrics and performance. Early efforts to develop the scorecard were framed as experimental, with no clear decision taken regarding how metrics might ultimately be used to improve performance (ie, how public to make both individual and group results, whether to tie bonus payments to performance).
RESULTS
There were 41 initial metrics considered by the division BSC task force (Table 3). Of these, 16 were chosen for the initial BSC through the modified Delphi method. Over the past 2 years, these initial metrics have been modified to reflect current strategic goals and objectives. Figure 1 illustrates the BSC for fiscal year (FY) 2012. An online version of this, complete with graphical representations of the data and metric definitions, can be found at
| Quality, Safety, and Operations | Education | Academics and Research | Faculty Development |
|---|---|---|---|
| |||
| Appropriate level of care | CME courses taught | Abstracts accepted | Attendance and participation |
| Billing and documentation | Curriculum development | Academic reputation | Being an agent of change |
| Clinical efficiency | Student/housestaff feedback | Grant funding | Division citizenship |
| Clinical professionalism | Mentoring | Mentorship | Job satisfaction |
| Communication | Quality of teaching rounds | Papers published | Mentorship |
| Core measures performance | Participation in national organizations | Committees and task forces | |
| Practice evidence‐based medicine | |||
| Fund of knowledge | |||
| Guideline adherence | |||
| Unplanned transfers to ICU | |||
| Implementation and initiation of projects | |||
| Length of stay | |||
| Medical errors | |||
| Mortality | |||
| Multidisciplinary approach to patient care | |||
| Multisource feedback evaluations | |||
| Never events | |||
| Patient‐centered care | |||
| Patient satisfaction | |||
| Practice‐based learning | |||
| Procedures | |||
| Readmissions | |||
| Reputation and expertise | |||
| Seeing patient on the day of admission | |||
| Quality of transfers of care | |||
DISCUSSION
Like many hospitalist groups, our division has experienced tremendous growth, both in our numbers and the breadth of roles that we fill. With this growth has come increasing expectations in multiple domains, competing priorities, and limited resources. We successfully developed a BSC as a tool to help our division reach its vision: balancing high quality clinical care, education, academics, and faculty development while maintaining a strong sense of community. We have found that the BSC has helped us meet several key goals.
The first goal was to allow for a broad view of our performance. This is the BSC's most basic function, and we saw immediate and tangible benefits. The scorecard provided a broad snapshot of our performance in a single place. For example, in the clinical domain, we saw that our direct cost per case was increasing despite our adjusted average length of stay remaining stable from FY2010‐FY2011. In academics and research, we saw that the number of abstracts accepted at national meetings increased by almost 30% in FY2011 (Figure 1).
The second goal was to create transparency and accountability. By measuring performance and displaying it on the division Web site, the BSC has promoted transparency. If performance does not meet our targets, the division as a whole becomes accountable. Leadership must understand why performance fell short and initiate changes to improve it. For instance, the rising direct cost per case has spurred the development of a high‐value care committee tasked with finding ways of reducing cost while providing high‐quality care.[12]
The third goal was to communicate goals and engage our faculty. As our division has grown, ensuring a shared vision among our entire faculty became an increasing challenge. The BSC functions as a communication platform between leadership and faculty, and yielded multiple benefits. As the metrics were born out of our mission and vision, the BSC has become a tangible representation of our core values. Moreover, individual faculty can see that they are part of a greater, high‐performing organization and realize they can impact the group's performance through their individual effort. For example, this has helped promote receptivity to carefully disseminated individual performance measures for billing and documentation, and patient satisfaction, in conjunction with faculty development in these areas.
The fourth goal was to ensure that we use data to guide strategic decisions. We felt that strategic decisions needed to be based on objective, rather than perceived or anecdotal, information. This meant translating our vision into measurable objectives that would drive performance improvement. For example, before the BSC, we were committed to the dissemination of our research and innovations. Yet, we quickly realized that we did not have a system to collect even basic data on academic performancea deficit we filled by leveraging information gathered from online databases and faculty curricula vitae. These data allowed us, for the first time, to objectively reflect on this as a strategic goal and to have an ongoing mechanism to monitor academic productivity.
Lessons Learned/Keys to Success
With our initial experience, we have gained insight that may be helpful to other AHGs considering implementing a BSC. First, and most importantly, AHGs should take the necessary time to build consensus and buy‐in. Particularly in areas where data are analyzed for the first time, faculty are often wary about the validity of the data or the purpose and utility of performance measurement. Faculty may be concerned about how collection of performance data could affect promotion or create a hostile and competitive work environment.
This concern grows when one moves from division‐wide to individual data. It is inevitable that the collection and dissemination of performance data will create some level of discomfort among faculty members, which can be a force for improvement or for angst. These issues should be anticipated, discussed, and actively managed. It is critical to be transparent with how data will be used. We have made clear that the transition from group to individual performance data, and from simple transparency to incentives, will be done thoughtfully and with tremendous input from our faculty. This tension can also be mitigated by choosing metrics that are internally driven, rather than determined by external groups (ie, following the principle that the measures should be important to the division and individual faculty members).
Next, the process of developing a mature BSC takes time. Much of our first year was spent developing systems for measurement, collecting data, and determining appropriate comparators and targets. The data in the first BSC functioned mainly as a baseline marker of performance. Some metrics, particularly in education and academics, had no national or local benchmarks. In these cases we identified comparable groups (such as other medical teaching services or other well‐established AHGs) or merely used our prior year's performance as a benchmark. Also, some of our metrics did not initially have performance targets. In most instances, this was because this was the first time that we looked at these data, and it was unclear what an appropriate target would be until more data became available.
Moving into our third year, we are seeing a natural evolution in the BSC's use. Some metrics that were initially chosen have been replaced or modified to reflect changing goals and priorities. Functional directors participate in choosing and developing performance metrics in their area. Previously, there was no formal structure for these groups to develop and measure strategic objectives and be accountable for performance improvement. They are now expected to define goals with measurable outcomes, to report progress to division leadership, and to develop their own scorecard to track performance. Each group chooses 2 to 4 metrics within their domain that are the most important for the division to improve on, which are then included in the division BSC.
We have also made efforts to build synergy between our BSC and performance goals set by external groups. Although continuing to favor metrics that are internally driven and meaningful to our faculty, we recognize that our goals must also reflect the needs and interests of broader stakeholders. For example, hand hygiene rates and patient satisfaction scores are UCSF medical center and divisional priorities (the former includes them in a financial incentive system for managers, staff, and many physicians) and are incorporated into the BSC as division‐wide incentive metrics.
Limitations
Our project has several limitations. It was conducted at a single institution, and our metrics may not be generalizable to other groups. However, the main goal of this article was not to focus on specific metrics but the process that we undertook to choose and develop them. Other institutions will likely identify different metrics based on their specific strategic objectives. We are also early in our experience with the BSC, and it is still not clear what effect it will have on the desired outcomes for our objectives. However, Henriksen recently reported that implementing a BSC at a large academic health center, in parallel with other performance improvement initiatives, resulted in substantial improvement in their chosen performance metrics.[13]
Despite the several years of development, we still view this as an early version of a BSC. To fully realize its benefits, an organization must choose metrics that will not simply measure performance but drive it. Our current BSC relies primarily on lagging measures, which show what our performance has been, and includes few leading metrics, which can predict trends in performance. As explained by Kaplan and Norton, this type of BSC risks skewing toward controlling rather than driving performance.[14] A mature BSC will include a mix of leading and lagging indicators, the combination illustrating a logical progression from measurement to performance. For instance, we measure total grant funding per year, which is a lagging indicator. However, to be most effective we could measure the percent of faculty who have attended grant‐writing workshops, the number of new grant sources identified, or the number of grant proposals submitted each quarter. These leading indicators would allow us to see performance trends that could be improved before the final outcome, total grant funding, is realized.
Finally, the issues surrounding the acceptability of this overall strategy will likely hinge on how we implement the more complex steps that relate to transparency, individual attribution, and perhaps ultimately incentives. Success in this area depends as much on culture as on strategy.
Next Steps
The next major step in the evolution of the BSC, and part of a broader faculty development program, will be the development of individual BSCs. They will be created using a similar methodology and allow faculty to reflect on their performance compared to peers and recognized benchmarks. Ideally, this will allow hospitalists in our group to establish personal strategic plans and monitor their performance over time. Individualizing these BSCs will be critical; although a research‐oriented faculty member might be striving for more than 5 publications and a large grant in a year, a clinician‐educator may seek outstanding teaching reviews and completion of a key quality improvement project. Both efforts need to be highly valued, and the divisional BSC should roll up these varied individual goals into a balanced whole.
In conclusion, we successfully developed and implemented a BSC to aid in strategic planning. The BSC ensures that we make strategic decisions using data, identify internally driven objectives, develop systems of performance measurement, and increase transparency and accountability. Our hope is that this description of the development of our BSC will be useful to other groups considering a similar endeavor.
Acknowledgments
The authors thank Noori Dhillon, Sadaf Akbaryar, Katie Quinn, Gerri Berg, and Maria Novelero for data collection and analysis. The authors also thank the faculty and staff who participated in the development process of the BSC.
Disclosure
Nothing to report.
- . The hospitalist field turns 15: new opportunities and challenges. J Hosp Med. 2011;6(4):E1–E4.
- , . The emerging role of “hospitalists” in the American health care system. N Engl J Med. 1996;335(7):514–517.
- , . The balanced scorecard—measures that drive performance. Harv Bus Rev. 1992;70(1):71–79.
- , . Using the balanced scorecard as a strategic management system. Harv Bus Rev. 1996;74(1):75–85.
- , . Having trouble with your strategy? Then map it. Harv Bus Rev. 2000;78:167–176, 202.
- , . Putting the balanced scorecard to work. Harv Bus Rev. 1993;71:134–147.
- , , , et al. Development and implementation of a performance measure tool in an academic pediatric research network. Contemp Clin Trials. 2010;31(5):429–437.
- , . Lives in the balance: an analysis of the balanced scorecard (BSC) in healthcare organizations. Int J Prod Perform Manag. 2007;57(1):6–21.
- , . The “Balanced Scorecard”: development and implementation in an academic clinical department. Acad Med. 1999;74(2):114–122.
- . Introducing a balanced scorecard management system in a university anesthesiology department. Anesth Analg. 2002;95(6):1731–1738, table of contents.
- , , , , . Issues for academic health centers to consider before implementing a balanced‐scorecard effort. Acad Med. 1999;74(12):1269–1277.
- , . Cents and sensitivity—teaching physicians to think about costs. N Engl J Med. 2012;367(2):99–101.
- , , , et al. 10‐year experience integrating strategic performance improvement initiatives: can the balanced scorecard, Six Sigma, and team training all thrive in a single hospital? In: Henriksen K, Battles JB, Keyes MA, Grady ML, eds. Advances in Patient Safety: New Directions and Alternative Approaches. Vol 3. Performance and Tools. Rockville, MD: Agency for Healthcare Research and Quality; 2008. Available at: http://www.ncbi.nlm.nih.gov/books/NBK43660. Accessed 15 June 2011.
- , . Linking the balanced scorecard to strategy. Calif Manage Rev. 1996;39(1):53–79.
