User login
Hospitalist and Internal Medicine Leaders’ Perspectives of Early Discharge Challenges at Academic Medical Centers
The discharge process is a critical bottleneck for efficient patient flow through the hospital. Delayed discharges translate into delays in admissions and other patient transitions, often leading to excess costs, patient dissatisfaction, and even patient harm.1-3 The emergency department is particularly impacted by these delays; bottlenecks there lead to overcrowding, increased overall hospital length of stay, and increased risks for bad outcomes during hospitalization.2
Academic medical centers in particular may struggle with delayed discharges. In a typical teaching hospital, a team composed of an attending physician and housestaff share responsibility for determining the discharge plan. Additionally, clinical teaching activities may affect the process and quality of discharge.4-6
The prevalence and causes of delayed discharges vary greatly.7-9 To improve efficiency around discharge, many hospitals have launched initiatives designed to discharge patients earlier in the day, including goal setting (“discharge by noon”), scheduling discharge appointments, and using quality-improvement methods, such as Lean Methodology (LEAN), to remove inefficiencies within discharge processes.10-12 However, there are few data on the prevalence and effectiveness of different strategies.
The aim of this study was to survey academic hospitalist and general internal medicine physician leaders to elicit their perspectives on the factors contributing to discharge timing and the relative importance and effectiveness of early-discharge initiatives.
METHODS
Study Design, Participants, and Oversight
We obtained a list of 115 university-affiliated hospitals associated with a residency program and, in most cases, a medical school from Vizient Inc. (formerly University HealthSystem Consortium), an alliance of academic medical centers and affiliated hospitals. Each member institution submits clinical data to allow for the benchmarking of outcomes to drive transparency and quality improvement.13 More than 95% of the nation’s academic medical centers and affiliated hospitals participate in this collaborative. Vizient works with members but does not set nor promote quality metrics, such as discharge timeliness. E-mail addresses for hospital medicine physician leaders (eg, division chief) of major academic medical centers were obtained from each institution via publicly available data (eg, the institution’s website). When an institution did not have a hospital medicine section, we identified the division chief of general internal medicine. The University of California, San Francisco Institutional Review Board approved this study.
Survey Development and Domains
We developed a 30-item survey to evaluate 5 main domains of interest: current discharge practices, degree of prioritization of early discharge on the inpatient service, barriers to timely discharge, prevalence and perceived effectiveness of implemented early-discharge initiatives, and barriers to implementation of early-discharge initiatives.
Respondents were first asked to identify their institutions’ goals for discharge time. They were then asked to compare the priority of early-discharge initiatives to other departmental quality-improvement initiatives, such as reducing 30-day readmissions, improving interpreter use, and improving patient satisfaction. Next, respondents were asked to estimate the degree to which clinical or patient factors contributed to delays in discharge. Respondents were then asked whether specific early-discharge initiatives, such as changes to rounding practices or communication interventions, were implemented at their institutions and, if so, the perceived effectiveness of these initiatives at meeting discharge targets. We piloted the questions locally with physicians and researchers prior to finalizing the survey.
Data Collection
We sent surveys via an online platform (Research Electronic Data Capture).14 Nonresponders were sent 2 e-mail reminders and then a follow-up telephone call asking them to complete the survey. Only 1 survey per academic medical center was collected. Any respondent who completed the survey within 2 weeks of receiving it was entered to win a Kindle Fire.
Data Analysis
We summarized survey responses using descriptive statistics. Analysis was completed in IBM SPSS version 22 (Armonk, NY).
RESULTS
Survey Respondent and Institutional Characteristics
Of the 115 institutions surveyed, we received 61 responses (response rate of 53%), with 39 (64%) respondents from divisions of hospital medicine and 22 (36%) from divisions of general internal medicine. A majority (n = 53; 87%) stated their medicine services have a combination of teaching (with residents) and nonteaching (without residents) teams. Thirty-nine (64%) reported having daily multidisciplinary rounds.
Early Discharge as a Priority
Forty-seven (77%) institutional representatives strongly agreed or agreed that early discharge was a priority, with discharge by noon being the most common target time (n = 23; 38%). Thirty (50%) respondents rated early discharge as more important than improving interpreter use for non-English-speaking patients and equally important as reducing 30-day readmissions (n = 29; 48%) and improving patient satisfaction (n = 27; 44%).
Factors Delaying Discharge
The most common factors perceived as delaying discharge were considered external to the hospital, such as postacute care bed availability or scheduled (eg, ambulance) transport delays (n = 48; 79%), followed by patient factors such as patient transport issues (n = 44; 72%). Less commonly reported were workflow issues, such as competing primary team priorities or case manager bandwidth (n = 38; 62%; Table 1).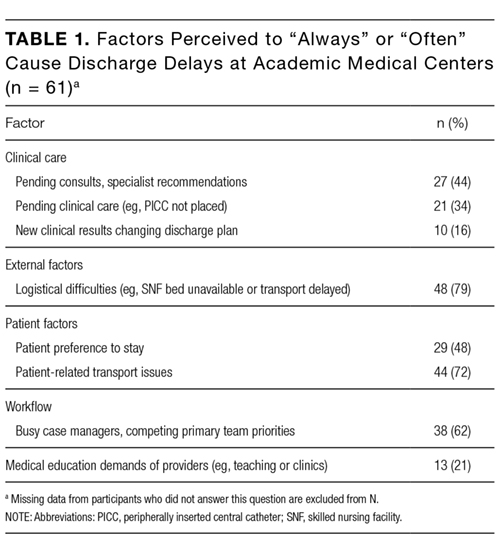
Initiatives to Improve Discharge
The most commonly implemented initiatives perceived as effective at improving discharge times were the preemptive identification of early discharges to plan discharge paperwork (n = 34; 56%), communication with patients about anticipated discharge time on the day prior to discharge (n = 29; 48%), and the implementation of additional rounds between physician teams and case managers specifically around discharge planning (n = 28; 46%). Initiatives not commonly implemented included regular audit of and feedback on discharge times to providers and teams (n = 21; 34%), the use of a discharge readiness checklist (n = 26; 43%), incentives such as bonuses or penalties (n = 37; 61%), the use of a whiteboard to indicate discharge times (n = 23; 38%), and dedicated quality-improvement approaches such as LEAN (n = 37; 61%; Table 2).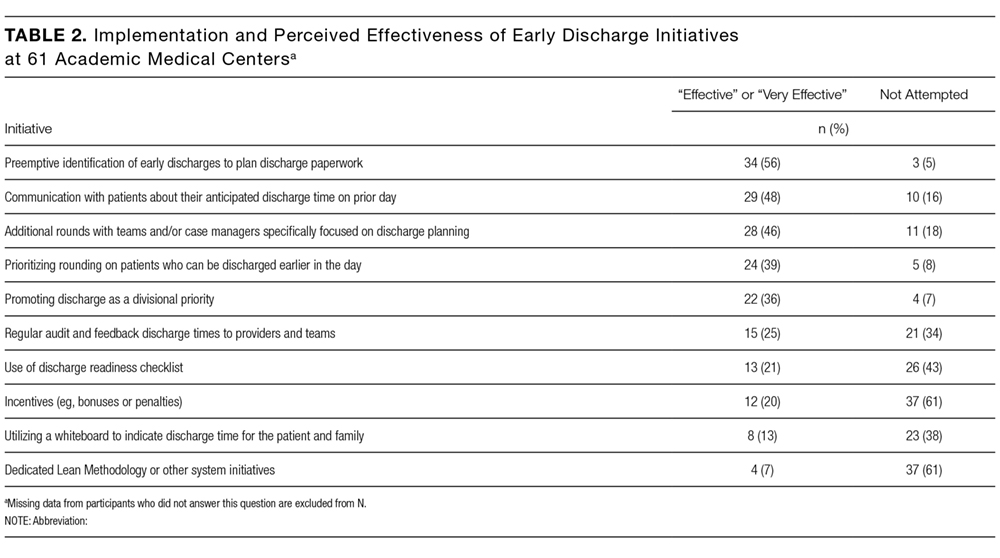
DISCUSSION
Our study suggests early discharge for medicine patients is a priority among academic institutions. Hospitalist and general internal medicine physician leaders in our study generally attributed delayed discharges to external factors, particularly unavailability of postacute care facilities and transportation delays. Having issues with finding postacute care placements is consistent with previous findings by Selker et al.15 and Carey et al.8 This is despite the 20-year difference between Selker et al.’s study and the current study, reflecting a continued opportunity for improvement, including stronger partnerships with local and regional postacute care facilities to expedite care transition and stronger discharge-planning efforts early in the admission process. Efforts in postacute care placement may be particularly important for Medicaid-insured and uninsured patients.
Our responders, hospitalist and internal medicine physician leaders, did not perceive the additional responsibilities of teaching and supervising trainees to be factors that significantly delayed patient discharge. This is in contrast to previous studies, which attributed delays in discharge to prolonged clinical decision-making related to teaching and supervision.4-6,8 This discrepancy may be due to the fact that we only surveyed single physician leaders at each institution and not residents. Our finding warrants further investigation to understand the degree to which resident skills may impact discharge planning and processes.
Institutions represented in our study have attempted a variety of initiatives promoting earlier discharge, with varying levels of perceived success. Initiatives perceived to be the most effective by hospital leaders centered on 2 main areas: (1) changing individual provider practice and (2) anticipatory discharge preparation. Interestingly, this is in discordance with the main factors labeled as causing delays in discharges, such as obtaining postacute care beds, busy case managers, and competing demands on primary teams. We hypothesize this may be because such changes require organization- or system-level changes and are perceived as more arduous than changes at the individual level. In addition, changes to individual provider behavior may be more cost- and time-effective than more systemic initiatives.
Our findings are consistent with the work published by Wertheimer and colleagues,11 who show that additional afternoon interdisciplinary rounds can help identify patients who may be discharged before noon the next day. In their study, identifying such patients in advance improved the overall early-discharge rate the following day.
Our findings should be interpreted in light of several limitations. Our survey only considers the perspectives of hospitalist and general internal medicine physician leaders at academic medical centers that are part of the Vizient Inc. collaborative. They do not represent all academic or community-based medical centers. Although the perceived effectiveness of some initiatives was high, we did not collect empirical data to support these claims or to determine which initiative had the greatest relative impact on discharge timeliness. Lastly, we did not obtain resident, nursing, or case manager perspectives on discharge practices. Given their roles as frontline providers, we may have missed these alternative perspectives.
Our study shows there is a strong interest in increasing early discharges in an effort to improve hospital throughput and patient flow.
Acknowledgments
The authors thank all participants who completed the survey and Danielle Carrier at Vizient Inc. (formally University HealthSystem Consortium) for her assistance in obtaining data.
Disclosures
Hemali Patel, Margaret Fang, Michelle Mourad, Adrienne Green, Ryan Murphy, and James Harrison report no conflicts of interest. At the time the research was conducted, Robert Wachter reported that he is a member of the Lucian Leape Institute at the National Patient Safety Foundation (no compensation except travel expenses); recently chaired an advisory board to England’s National Health Service (NHS) reviewing the NHS’s digital health strategy (no compensation except travel expenses); has a contract with UCSF from the Agency for Healthcare Research and Quality to edit a patient-safety website; receives compensation from John Wiley & Sons for writing a blog; receives royalties from Lippincott Williams & Wilkins and McGraw-Hill Education for writing and/or editing several books; receives stock options for serving on the board of Acuity Medical Management Systems; receives a yearly stipend for serving on the board of The Doctors Company; serves on the scientific advisory boards for amino.com, PatientSafe Solutions Inc., Twine, and EarlySense (for which he receives stock options); has a small royalty stake in CareWeb, a hospital communication tool developed at UCSF; and holds the Marc and Lynne Benioff Endowed Chair in Hospital Medicine and the Holly Smith Distinguished Professorship in Science and Medicine at UCSF.
1. Khanna S, Boyle J, Good N, Lind J. Impact of admission and discharge peak times on hospital overcrowding. Stud Health Technol Inform. 2011;168:82-88. PubMed
2. White BA, Biddinger PD, Chang Y, Grabowski B, Carignan S, Brown DFM. Boarding Inpatients in the Emergency Department Increases Discharged Patient Length of Stay. J Emerg Med. 2013;44(1):230-235. doi:10.1016/j.jemermed.2012.05.007. PubMed
3. Derlet RW, Richards JR. Overcrowding in the nation’s emergency departments: complex causes and disturbing effects. Ann Emerg Med. 2000;35(1):63-68. PubMed
4. da Silva SA, Valácio RA, Botelho FC, Amaral CFS. Reasons for discharge delays in teaching hospitals. Rev Saúde Pública. 2014;48(2):314-321. doi:10.1590/S0034-8910.2014048004971. PubMed
5. Greysen SR, Schiliro D, Horwitz LI, Curry L, Bradley EH. “Out of Sight, Out of Mind”: Housestaff Perceptions of Quality-Limiting Factors in Discharge Care at Teaching Hospitals. J Hosp Med Off Publ Soc Hosp Med. 2012;7(5):376-381. doi:10.1002/jhm.1928. PubMed
6. Goldman J, Reeves S, Wu R, Silver I, MacMillan K, Kitto S. Medical Residents and Interprofessional Interactions in Discharge: An Ethnographic Exploration of Factors That Affect Negotiation. J Gen Intern Med. 2015;30(10):1454-1460. doi:10.1007/s11606-015-3306-6. PubMed
7. Okoniewska B, Santana MJ, Groshaus H, et al. Barriers to discharge in an acute care medical teaching unit: a qualitative analysis of health providers’ perceptions. J Multidiscip Healthc. 2015;8:83-89. doi:10.2147/JMDH.S72633. PubMed
8. Carey MR, Sheth H, Scott Braithwaite R. A Prospective Study of Reasons for Prolonged Hospitalizations on a General Medicine Teaching Service. J Gen Intern Med. 2005;20(2):108-115. doi:10.1111/j.1525-1497.2005.40269.x. PubMed
9. Kim CS, Hart AL, Paretti RF, et al. Excess Hospitalization Days in an Academic Medical Center: Perceptions of Hospitalists and Discharge Planners. Am J Manag Care. 2011;17(2):e34-e42. http://www.ajmc.com/journals/issue/2011/2011-2-vol17-n2/AJMC_11feb_Kim_WebX_e34to42/. Accessed on October 26, 2016.
10. Gershengorn HB, Kocher R, Factor P. Management Strategies to Effect Change in Intensive Care Units: Lessons from the World of Business. Part II. Quality-Improvement Strategies. Ann Am Thorac Soc. 2014;11(3):444-453. doi:10.1513/AnnalsATS.201311-392AS. PubMed
11. Wertheimer B, Jacobs REA, Bailey M, et al. Discharge before noon: An achievable hospital goal. J Hosp Med. 2014;9(4):210-214. doi:10.1002/jhm.2154. PubMed
12. Manning DM, Tammel KJ, Blegen RN, et al. In-room display of day and time patient is anticipated to leave hospital: a “discharge appointment.” J Hosp Med. 2007;2(1):13-16. doi:10.1002/jhm.146. PubMed
13. Networks for academic medical centers. https://www.vizientinc.com/Our-networks/Networks-for-academic-medical-centers. Accessed on July 13, 2017.
14. Harris PA, Taylor R, Thielke R, Payne J, Gonzalez N, Conde JG. Research Electronic Data Capture (REDCap) - A metadata-driven methodology and workflow process for providing translational research informatics support. J Biomed Inform. 2009;42(2):377-381. doi:10.1016/j.jbi.2008.08.010. PubMed
15. Selker HP, Beshansky JR, Pauker SG, Kassirer JP. The epidemiology of delays in a teaching hospital. The development and use of a tool that detects unnecessary hospital days. Med Care. 1989;27(2):112-129. PubMed
The discharge process is a critical bottleneck for efficient patient flow through the hospital. Delayed discharges translate into delays in admissions and other patient transitions, often leading to excess costs, patient dissatisfaction, and even patient harm.1-3 The emergency department is particularly impacted by these delays; bottlenecks there lead to overcrowding, increased overall hospital length of stay, and increased risks for bad outcomes during hospitalization.2
Academic medical centers in particular may struggle with delayed discharges. In a typical teaching hospital, a team composed of an attending physician and housestaff share responsibility for determining the discharge plan. Additionally, clinical teaching activities may affect the process and quality of discharge.4-6
The prevalence and causes of delayed discharges vary greatly.7-9 To improve efficiency around discharge, many hospitals have launched initiatives designed to discharge patients earlier in the day, including goal setting (“discharge by noon”), scheduling discharge appointments, and using quality-improvement methods, such as Lean Methodology (LEAN), to remove inefficiencies within discharge processes.10-12 However, there are few data on the prevalence and effectiveness of different strategies.
The aim of this study was to survey academic hospitalist and general internal medicine physician leaders to elicit their perspectives on the factors contributing to discharge timing and the relative importance and effectiveness of early-discharge initiatives.
METHODS
Study Design, Participants, and Oversight
We obtained a list of 115 university-affiliated hospitals associated with a residency program and, in most cases, a medical school from Vizient Inc. (formerly University HealthSystem Consortium), an alliance of academic medical centers and affiliated hospitals. Each member institution submits clinical data to allow for the benchmarking of outcomes to drive transparency and quality improvement.13 More than 95% of the nation’s academic medical centers and affiliated hospitals participate in this collaborative. Vizient works with members but does not set nor promote quality metrics, such as discharge timeliness. E-mail addresses for hospital medicine physician leaders (eg, division chief) of major academic medical centers were obtained from each institution via publicly available data (eg, the institution’s website). When an institution did not have a hospital medicine section, we identified the division chief of general internal medicine. The University of California, San Francisco Institutional Review Board approved this study.
Survey Development and Domains
We developed a 30-item survey to evaluate 5 main domains of interest: current discharge practices, degree of prioritization of early discharge on the inpatient service, barriers to timely discharge, prevalence and perceived effectiveness of implemented early-discharge initiatives, and barriers to implementation of early-discharge initiatives.
Respondents were first asked to identify their institutions’ goals for discharge time. They were then asked to compare the priority of early-discharge initiatives to other departmental quality-improvement initiatives, such as reducing 30-day readmissions, improving interpreter use, and improving patient satisfaction. Next, respondents were asked to estimate the degree to which clinical or patient factors contributed to delays in discharge. Respondents were then asked whether specific early-discharge initiatives, such as changes to rounding practices or communication interventions, were implemented at their institutions and, if so, the perceived effectiveness of these initiatives at meeting discharge targets. We piloted the questions locally with physicians and researchers prior to finalizing the survey.
Data Collection
We sent surveys via an online platform (Research Electronic Data Capture).14 Nonresponders were sent 2 e-mail reminders and then a follow-up telephone call asking them to complete the survey. Only 1 survey per academic medical center was collected. Any respondent who completed the survey within 2 weeks of receiving it was entered to win a Kindle Fire.
Data Analysis
We summarized survey responses using descriptive statistics. Analysis was completed in IBM SPSS version 22 (Armonk, NY).
RESULTS
Survey Respondent and Institutional Characteristics
Of the 115 institutions surveyed, we received 61 responses (response rate of 53%), with 39 (64%) respondents from divisions of hospital medicine and 22 (36%) from divisions of general internal medicine. A majority (n = 53; 87%) stated their medicine services have a combination of teaching (with residents) and nonteaching (without residents) teams. Thirty-nine (64%) reported having daily multidisciplinary rounds.
Early Discharge as a Priority
Forty-seven (77%) institutional representatives strongly agreed or agreed that early discharge was a priority, with discharge by noon being the most common target time (n = 23; 38%). Thirty (50%) respondents rated early discharge as more important than improving interpreter use for non-English-speaking patients and equally important as reducing 30-day readmissions (n = 29; 48%) and improving patient satisfaction (n = 27; 44%).
Factors Delaying Discharge
The most common factors perceived as delaying discharge were considered external to the hospital, such as postacute care bed availability or scheduled (eg, ambulance) transport delays (n = 48; 79%), followed by patient factors such as patient transport issues (n = 44; 72%). Less commonly reported were workflow issues, such as competing primary team priorities or case manager bandwidth (n = 38; 62%; Table 1).
Initiatives to Improve Discharge
The most commonly implemented initiatives perceived as effective at improving discharge times were the preemptive identification of early discharges to plan discharge paperwork (n = 34; 56%), communication with patients about anticipated discharge time on the day prior to discharge (n = 29; 48%), and the implementation of additional rounds between physician teams and case managers specifically around discharge planning (n = 28; 46%). Initiatives not commonly implemented included regular audit of and feedback on discharge times to providers and teams (n = 21; 34%), the use of a discharge readiness checklist (n = 26; 43%), incentives such as bonuses or penalties (n = 37; 61%), the use of a whiteboard to indicate discharge times (n = 23; 38%), and dedicated quality-improvement approaches such as LEAN (n = 37; 61%; Table 2).
DISCUSSION
Our study suggests early discharge for medicine patients is a priority among academic institutions. Hospitalist and general internal medicine physician leaders in our study generally attributed delayed discharges to external factors, particularly unavailability of postacute care facilities and transportation delays. Having issues with finding postacute care placements is consistent with previous findings by Selker et al.15 and Carey et al.8 This is despite the 20-year difference between Selker et al.’s study and the current study, reflecting a continued opportunity for improvement, including stronger partnerships with local and regional postacute care facilities to expedite care transition and stronger discharge-planning efforts early in the admission process. Efforts in postacute care placement may be particularly important for Medicaid-insured and uninsured patients.
Our responders, hospitalist and internal medicine physician leaders, did not perceive the additional responsibilities of teaching and supervising trainees to be factors that significantly delayed patient discharge. This is in contrast to previous studies, which attributed delays in discharge to prolonged clinical decision-making related to teaching and supervision.4-6,8 This discrepancy may be due to the fact that we only surveyed single physician leaders at each institution and not residents. Our finding warrants further investigation to understand the degree to which resident skills may impact discharge planning and processes.
Institutions represented in our study have attempted a variety of initiatives promoting earlier discharge, with varying levels of perceived success. Initiatives perceived to be the most effective by hospital leaders centered on 2 main areas: (1) changing individual provider practice and (2) anticipatory discharge preparation. Interestingly, this is in discordance with the main factors labeled as causing delays in discharges, such as obtaining postacute care beds, busy case managers, and competing demands on primary teams. We hypothesize this may be because such changes require organization- or system-level changes and are perceived as more arduous than changes at the individual level. In addition, changes to individual provider behavior may be more cost- and time-effective than more systemic initiatives.
Our findings are consistent with the work published by Wertheimer and colleagues,11 who show that additional afternoon interdisciplinary rounds can help identify patients who may be discharged before noon the next day. In their study, identifying such patients in advance improved the overall early-discharge rate the following day.
Our findings should be interpreted in light of several limitations. Our survey only considers the perspectives of hospitalist and general internal medicine physician leaders at academic medical centers that are part of the Vizient Inc. collaborative. They do not represent all academic or community-based medical centers. Although the perceived effectiveness of some initiatives was high, we did not collect empirical data to support these claims or to determine which initiative had the greatest relative impact on discharge timeliness. Lastly, we did not obtain resident, nursing, or case manager perspectives on discharge practices. Given their roles as frontline providers, we may have missed these alternative perspectives.
Our study shows there is a strong interest in increasing early discharges in an effort to improve hospital throughput and patient flow.
Acknowledgments
The authors thank all participants who completed the survey and Danielle Carrier at Vizient Inc. (formally University HealthSystem Consortium) for her assistance in obtaining data.
Disclosures
Hemali Patel, Margaret Fang, Michelle Mourad, Adrienne Green, Ryan Murphy, and James Harrison report no conflicts of interest. At the time the research was conducted, Robert Wachter reported that he is a member of the Lucian Leape Institute at the National Patient Safety Foundation (no compensation except travel expenses); recently chaired an advisory board to England’s National Health Service (NHS) reviewing the NHS’s digital health strategy (no compensation except travel expenses); has a contract with UCSF from the Agency for Healthcare Research and Quality to edit a patient-safety website; receives compensation from John Wiley & Sons for writing a blog; receives royalties from Lippincott Williams & Wilkins and McGraw-Hill Education for writing and/or editing several books; receives stock options for serving on the board of Acuity Medical Management Systems; receives a yearly stipend for serving on the board of The Doctors Company; serves on the scientific advisory boards for amino.com, PatientSafe Solutions Inc., Twine, and EarlySense (for which he receives stock options); has a small royalty stake in CareWeb, a hospital communication tool developed at UCSF; and holds the Marc and Lynne Benioff Endowed Chair in Hospital Medicine and the Holly Smith Distinguished Professorship in Science and Medicine at UCSF.
1. Khanna S, Boyle J, Good N, Lind J. Impact of admission and discharge peak times on hospital overcrowding. Stud Health Technol Inform. 2011;168:82-88. PubMed
2. White BA, Biddinger PD, Chang Y, Grabowski B, Carignan S, Brown DFM. Boarding Inpatients in the Emergency Department Increases Discharged Patient Length of Stay. J Emerg Med. 2013;44(1):230-235. doi:10.1016/j.jemermed.2012.05.007. PubMed
3. Derlet RW, Richards JR. Overcrowding in the nation’s emergency departments: complex causes and disturbing effects. Ann Emerg Med. 2000;35(1):63-68. PubMed
4. da Silva SA, Valácio RA, Botelho FC, Amaral CFS. Reasons for discharge delays in teaching hospitals. Rev Saúde Pública. 2014;48(2):314-321. doi:10.1590/S0034-8910.2014048004971. PubMed
5. Greysen SR, Schiliro D, Horwitz LI, Curry L, Bradley EH. “Out of Sight, Out of Mind”: Housestaff Perceptions of Quality-Limiting Factors in Discharge Care at Teaching Hospitals. J Hosp Med Off Publ Soc Hosp Med. 2012;7(5):376-381. doi:10.1002/jhm.1928. PubMed
6. Goldman J, Reeves S, Wu R, Silver I, MacMillan K, Kitto S. Medical Residents and Interprofessional Interactions in Discharge: An Ethnographic Exploration of Factors That Affect Negotiation. J Gen Intern Med. 2015;30(10):1454-1460. doi:10.1007/s11606-015-3306-6. PubMed
7. Okoniewska B, Santana MJ, Groshaus H, et al. Barriers to discharge in an acute care medical teaching unit: a qualitative analysis of health providers’ perceptions. J Multidiscip Healthc. 2015;8:83-89. doi:10.2147/JMDH.S72633. PubMed
8. Carey MR, Sheth H, Scott Braithwaite R. A Prospective Study of Reasons for Prolonged Hospitalizations on a General Medicine Teaching Service. J Gen Intern Med. 2005;20(2):108-115. doi:10.1111/j.1525-1497.2005.40269.x. PubMed
9. Kim CS, Hart AL, Paretti RF, et al. Excess Hospitalization Days in an Academic Medical Center: Perceptions of Hospitalists and Discharge Planners. Am J Manag Care. 2011;17(2):e34-e42. http://www.ajmc.com/journals/issue/2011/2011-2-vol17-n2/AJMC_11feb_Kim_WebX_e34to42/. Accessed on October 26, 2016.
10. Gershengorn HB, Kocher R, Factor P. Management Strategies to Effect Change in Intensive Care Units: Lessons from the World of Business. Part II. Quality-Improvement Strategies. Ann Am Thorac Soc. 2014;11(3):444-453. doi:10.1513/AnnalsATS.201311-392AS. PubMed
11. Wertheimer B, Jacobs REA, Bailey M, et al. Discharge before noon: An achievable hospital goal. J Hosp Med. 2014;9(4):210-214. doi:10.1002/jhm.2154. PubMed
12. Manning DM, Tammel KJ, Blegen RN, et al. In-room display of day and time patient is anticipated to leave hospital: a “discharge appointment.” J Hosp Med. 2007;2(1):13-16. doi:10.1002/jhm.146. PubMed
13. Networks for academic medical centers. https://www.vizientinc.com/Our-networks/Networks-for-academic-medical-centers. Accessed on July 13, 2017.
14. Harris PA, Taylor R, Thielke R, Payne J, Gonzalez N, Conde JG. Research Electronic Data Capture (REDCap) - A metadata-driven methodology and workflow process for providing translational research informatics support. J Biomed Inform. 2009;42(2):377-381. doi:10.1016/j.jbi.2008.08.010. PubMed
15. Selker HP, Beshansky JR, Pauker SG, Kassirer JP. The epidemiology of delays in a teaching hospital. The development and use of a tool that detects unnecessary hospital days. Med Care. 1989;27(2):112-129. PubMed
© 2017 Society of Hospital Medicine
Hospital Medicine in 2015
This year, we celebrate the 10th anniversary of this esteemed publication, and it is indeed an occasion for celebration. For those of us who were there at the creation of the hospitalist field, the establishment of a vibrant academic journal was a dream, one whose fulfillment was central to the legitimization of our field as a full‐fledged specialty. After a decade and 83 issues, the Journal of Hospital Medicine is a formidable source of information, cohesion, and pride.
The anniversary comes at a particularly interesting time for hospitals and hospitalists. Our field's lifeblood has been in trailblazing and continuous reinvention. We were the first physician specialty that embraced the mantra of systems thinking, as captured in our famous metaphor that we care for two sick patients: the person and the system. We were the first field that proudly, and without a hint of shame, allied ourselves with hospital leaders, believing that we were mutually dependent on one another, and that our ability to make change happen and stick was better if we were working with our institutions' leaders. In creating our professional society (and this journal), we took unusual pains to be inclusiveof academic and community‐based hospitalists, or hospitalists entering the field from a variety of backgrounds, of hospitalists caring for adults and kids, and of nonphysician providers.
Our efforts have paid off. Leaders as prominent as Don Berwick have observed that hospitalists have become the essential army of improvers in hospitals and healthcare systems. Hospitalists have made immense contributions at their own institutions, and are increasingly assuming leadership roles both locally and nationally. It is not a coincidence that Medicare's top physician (Patrick Conway) and the Surgeon General (Vivek Murthy) are both hospitalists. Although there have been a few bumps along the way, hospitalists are generally satisfied with their careers, respected by their colleagues, accepted by their patients, and pleased to be members of the fastest growing specialty in the history of modern medicine.
All of this should leave us all feeling warm, proud and more than a little nervous. We are now a mature medical specialty, no longer upstarts, and the natural inclination, in a changing world, will be to hunker down and protect what we have. Of course, some of that is reasonable and appropriate (for example, to fight for our fair share of a bundled payment pie),[1] but some of it will be wrong, even self‐defeating. The world of healthcare is changing fast, and our ability to stay relevant and indispensable will depend on our ability to evolve to meet new conditions and needs.
Let us consider some of the major trends playing out in healthcare. The biggest is the brisk and unmistakable shift from volume to value.[2] This is a trend we have been on top of, because this really has been our field's raison d'tre: improving value in the hospital by cutting costs and length of stay while improving (or at least keeping neutral) quality and safety.[3] However, a world under intense value pressure will work hard to move patients from hospital to less expensive postacute settings, and will insist on seamless handoffs between the hospital and such settings. Thoughtful hospital medicine groups are thinking hard about this trend, and many are placing colleagues in skilled nursing facilities, or at the very least tightening their connections to the postacute facilities in their healthcare ecosystem. We no longer have the luxury of confining our talents and energies to those things that take place within the 4 walls of the hospital.
Another trend is the digitization of healthcare, a trend turbocharged by $30 billion in federal incentive payments distributed between 2009 and 2014.[4] Here too, hospitalists have emerged as leaders in information technology (IT) implementations, and a disproportionate number of chief medical information officers and other IT leaders seem to be hospitalists. Splendid. But it is also up to us to help figure out how to use IT tools effectively. The notes have morphed into bloated, copy‐and‐pasteridden monstrosities: let us figure out what a good note should look like in the digital era, and then implement educational and system changes to create a new standard. We no longer go to radiology because we do not need to to see our films; let us think about what the loss of the collegial exchange with our radiology colleagues has cost, and then set out to develop new systems to reimagine it. Right now, big data are mostly hype and unrequited promise. Who better than hospitalists to dive in and start making sense of the data to predict risks or help point to better treatments?
Another trend is population health. Although I do not foresee a return to the Marcus Welby model of a kindly physician following the patient everywhere, I can imagine certain patients (mostly those with several social and clinical comorbidities and at least 3 admissions per year) who might be well served by a back‐to‐the‐future system in which a primary care provider follows them into the hospital, perhaps comanaging the patients with the on‐service hospitalist. David Meltzer, at the University of Chicago, is currently studying such a model, and I look forward to seeing his results.[5] Rather than rejecting such experiments as violating the usual hospitalist structure, we must embrace them, at least until the evidence is in.
In the end, the field of hospital medicine emerged and thrived because of the promise, and later the evidence, that our presence led to better quality, safety, patient experience, education, and efficiency. This mandate must remain our mantra, even if it means that we have to evolve our model in keeping with a changing healthcare landscape. The minute we stop evolving is the minute our field starts planting the seeds of its own destruction.
Disclosure
Dr. Wachter reports that he is a member of the board of directors of IPC Healthcare.
- . Bundled payment. Hospitals see the advantages but face big challenges, too. Hospitals 367:292–295.
- , . The emerging role of “hospitalists” in the American health care system. N Engl J Med. 1995;335:514–517.
- . The Digital Doctor: Hope, Hype, and Harm at the Dawn of Medicine's Computer Age. New York, NY: McGraw‐Hill; 2015.
- . Comprehensive care physicians: an emerging specialty for chronic care. Fierce Healthcare website. Available at: http://www.fiercehealthcare.com/story/comprehensivists‐close‐chronic‐care‐communication‐gaps/2011‐05‐02. Published May 2, 2011. Last accessed May 29, 2015.
This year, we celebrate the 10th anniversary of this esteemed publication, and it is indeed an occasion for celebration. For those of us who were there at the creation of the hospitalist field, the establishment of a vibrant academic journal was a dream, one whose fulfillment was central to the legitimization of our field as a full‐fledged specialty. After a decade and 83 issues, the Journal of Hospital Medicine is a formidable source of information, cohesion, and pride.
The anniversary comes at a particularly interesting time for hospitals and hospitalists. Our field's lifeblood has been in trailblazing and continuous reinvention. We were the first physician specialty that embraced the mantra of systems thinking, as captured in our famous metaphor that we care for two sick patients: the person and the system. We were the first field that proudly, and without a hint of shame, allied ourselves with hospital leaders, believing that we were mutually dependent on one another, and that our ability to make change happen and stick was better if we were working with our institutions' leaders. In creating our professional society (and this journal), we took unusual pains to be inclusiveof academic and community‐based hospitalists, or hospitalists entering the field from a variety of backgrounds, of hospitalists caring for adults and kids, and of nonphysician providers.
Our efforts have paid off. Leaders as prominent as Don Berwick have observed that hospitalists have become the essential army of improvers in hospitals and healthcare systems. Hospitalists have made immense contributions at their own institutions, and are increasingly assuming leadership roles both locally and nationally. It is not a coincidence that Medicare's top physician (Patrick Conway) and the Surgeon General (Vivek Murthy) are both hospitalists. Although there have been a few bumps along the way, hospitalists are generally satisfied with their careers, respected by their colleagues, accepted by their patients, and pleased to be members of the fastest growing specialty in the history of modern medicine.
All of this should leave us all feeling warm, proud and more than a little nervous. We are now a mature medical specialty, no longer upstarts, and the natural inclination, in a changing world, will be to hunker down and protect what we have. Of course, some of that is reasonable and appropriate (for example, to fight for our fair share of a bundled payment pie),[1] but some of it will be wrong, even self‐defeating. The world of healthcare is changing fast, and our ability to stay relevant and indispensable will depend on our ability to evolve to meet new conditions and needs.
Let us consider some of the major trends playing out in healthcare. The biggest is the brisk and unmistakable shift from volume to value.[2] This is a trend we have been on top of, because this really has been our field's raison d'tre: improving value in the hospital by cutting costs and length of stay while improving (or at least keeping neutral) quality and safety.[3] However, a world under intense value pressure will work hard to move patients from hospital to less expensive postacute settings, and will insist on seamless handoffs between the hospital and such settings. Thoughtful hospital medicine groups are thinking hard about this trend, and many are placing colleagues in skilled nursing facilities, or at the very least tightening their connections to the postacute facilities in their healthcare ecosystem. We no longer have the luxury of confining our talents and energies to those things that take place within the 4 walls of the hospital.
Another trend is the digitization of healthcare, a trend turbocharged by $30 billion in federal incentive payments distributed between 2009 and 2014.[4] Here too, hospitalists have emerged as leaders in information technology (IT) implementations, and a disproportionate number of chief medical information officers and other IT leaders seem to be hospitalists. Splendid. But it is also up to us to help figure out how to use IT tools effectively. The notes have morphed into bloated, copy‐and‐pasteridden monstrosities: let us figure out what a good note should look like in the digital era, and then implement educational and system changes to create a new standard. We no longer go to radiology because we do not need to to see our films; let us think about what the loss of the collegial exchange with our radiology colleagues has cost, and then set out to develop new systems to reimagine it. Right now, big data are mostly hype and unrequited promise. Who better than hospitalists to dive in and start making sense of the data to predict risks or help point to better treatments?
Another trend is population health. Although I do not foresee a return to the Marcus Welby model of a kindly physician following the patient everywhere, I can imagine certain patients (mostly those with several social and clinical comorbidities and at least 3 admissions per year) who might be well served by a back‐to‐the‐future system in which a primary care provider follows them into the hospital, perhaps comanaging the patients with the on‐service hospitalist. David Meltzer, at the University of Chicago, is currently studying such a model, and I look forward to seeing his results.[5] Rather than rejecting such experiments as violating the usual hospitalist structure, we must embrace them, at least until the evidence is in.
In the end, the field of hospital medicine emerged and thrived because of the promise, and later the evidence, that our presence led to better quality, safety, patient experience, education, and efficiency. This mandate must remain our mantra, even if it means that we have to evolve our model in keeping with a changing healthcare landscape. The minute we stop evolving is the minute our field starts planting the seeds of its own destruction.
Disclosure
Dr. Wachter reports that he is a member of the board of directors of IPC Healthcare.
- . Bundled payment. Hospitals see the advantages but face big challenges, too. Hospitals 367:292–295.
- , . The emerging role of “hospitalists” in the American health care system. N Engl J Med. 1995;335:514–517.
- . The Digital Doctor: Hope, Hype, and Harm at the Dawn of Medicine's Computer Age. New York, NY: McGraw‐Hill; 2015.
- . Comprehensive care physicians: an emerging specialty for chronic care. Fierce Healthcare website. Available at: http://www.fiercehealthcare.com/story/comprehensivists‐close‐chronic‐care‐communication‐gaps/2011‐05‐02. Published May 2, 2011. Last accessed May 29, 2015.
Hospital High‐Value Care Program
With a United States medical system that spends as much as $750 billion each year on care that does not result in improved health outcomes,[1] many policy initiatives, including the Centers for Medicare and Medicaid Services' Value‐Based Purchasing program, seek to realign hospitals' financial incentives from a focus on production to one on value (quality divided by cost).[2, 3] Professional organizations have now deemed resource stewardship an ethical responsibility for professionalism,[4, 5] and campaigns such as the American Board of Internal Medicine (ABIM) Foundation's Choosing Wisely effort and the American College of Physicians' High‐Value Care platform are calling on frontline clinicians to address unnecessary and wasteful services.[6, 7]
Despite these pressures and initiatives, most physicians lack the knowledge and tools necessary to prioritize the delivery of their own healthcare services according to value.[8, 9, 10] Hospital medicine physicians are unaware of the costs associated with the interventions they order,[10] and the majority of medical training programs lack curricula focused on healthcare costs,[11] creating a large gap between physicians' perceived, desired, and actual knowledge related to costs.[12] Novel frameworks and frontline physician engagement are required if clinicians are to improve the value of the care they deliver.
We describe 1 of our first steps at the University of California, San Francisco (UCSF) to promote high‐value care (HVC) delivery: the creation of a HVC program led by clinicians and administrators focused on identifying and addressing wasteful practices within our hospitalist group. The program aims to (1) use financial and clinical data to identify areas with clear evidence of waste in the hospital, (2) promote evidence‐based interventions that improve both quality of care and value, and (3) pair interventions with evidence‐based cost awareness education to drive culture change. Our experience and inaugural projects provide a model of the key features, inherent challenges, and lessons learned, which may help inform similar efforts.
METHODS
In March 2012, we launched an HVC program within our Division of Hospital Medicine at UCSF Medical Center, a 600‐bed academic medical center in an urban setting. During the 2013 academic year, our division included 45 physicians. The medicine service, comprised of 8 teaching medical ward teams (1 attending, 1 resident, 2 interns, and variable number of medical students), and 1 nonteaching medical ward team (1 attending), admitted 4700 patients that year.
Organizational Framework
The HVC program is co‐led by a UCSF hospitalist (C.M.) and the administrator of the Division of Hospital Medicine (M.N.). Team members include hospitalists, hospital medicine fellows, resident physicians, pharmacists, project coordinators, and other administrators. The team meets in person for 1 hour every month. Project teams and ad hoc subcommittee groups often convene between meetings.
Our HVC program was placed within the infrastructure, and under the leadership, of our already established quality improvement (QI) program at UCSF. Our Division of Hospital Medicine Director of Quality and Safety (M.M.) thus oversees the QI, patient safety, patient experience, and high‐value care efforts.
The HVC program funding is largely in personnel costs. The physician leader (15% effort) is funded by the Division of Hospital Medicine, whereas the administrator is cofunded by both the division and by the medical center (largely through her roles as both division administrator and service line director). An administrative assistant within the division is also assigned to help with administrative tasks. Some additional data gathering and project support comes from existing medical center QI infrastructure, the decision support services unit, and through UCSF's new Center for Healthcare Value. Other ancillary costs for our projects have included publicity, data analytics, and information technology infrastructure. We estimate that the costs of this program are approximately $50,000 to $75,000 annually.
Framework for Identifying Target Projects
Robust Analysis of Costs
We created a framework for identifying, designing, and promoting projects specifically aimed at improving healthcare value (Figure 1). Financial data were used to identify areas with clear evidence of waste in the hospital, areas of high cost with no benefit in health outcomes. We focused particularly on obtaining cost and billing data for our medical service, which provided important insight into potential targets for improvements in value. For example, in 2011, the Division of Hospital Medicine spent more than $1 million annually in direct costs for the administration of nebulized bronchodilator therapies (nebs) to nonintensive care unit patients on the medical service.[13] These high costs, exposed by billing data, were believed to represent potential unnecessary testing and/or procedures. Not every area of high cost was deemed a target for intervention. For example, the use of recombinant factor VIII appeared a necessary expenditure (over $1 million per year) for our patients with hemophilia. Although our efforts focused on reducing waste, it is worth noting that healthcare value can also be increased by improving the delivery of high‐value services.

Recognized Benefits in Quality of Care
The program also evaluated the impact of cost reduction efforts on the quality of care, based on a high standard of current evidence. Though value can be improved by interventions that decrease costs while being quality neutral, our group chose to focus first on projects that would simultaneously improve quality while decreasing costs. We felt that this win‐win strategy would help obtain buy‐in from clinicians weary of prior cost‐cutting programs. For example, we pursued interventions aimed at reducing inappropriate gastric stress ulcer prophylaxis, which had the potential to both cut costs and minimize risks of hospital‐acquired pneumonia and Clostridium difficile infections.[14, 15] All proposed HVC targets were vetted through a review of the literature and published guidelines. In general, our initial projects had to be strongly supported by evidence, with high‐quality studies, preferably meta‐analyses or systematic reviews, that displayed the safety of our recommended changes. We reviewed the literature with experts. For example, we met with faculty pulmonologists to discuss the evidence supporting the use of inhalers instead of nebulizers in adults with obstructive pulmonary disease. The goals of our projects were chosen by our HVC committee, based on an analysis of our baseline data and the perceived potential effects of our proposed interventions.
Educational Intervention
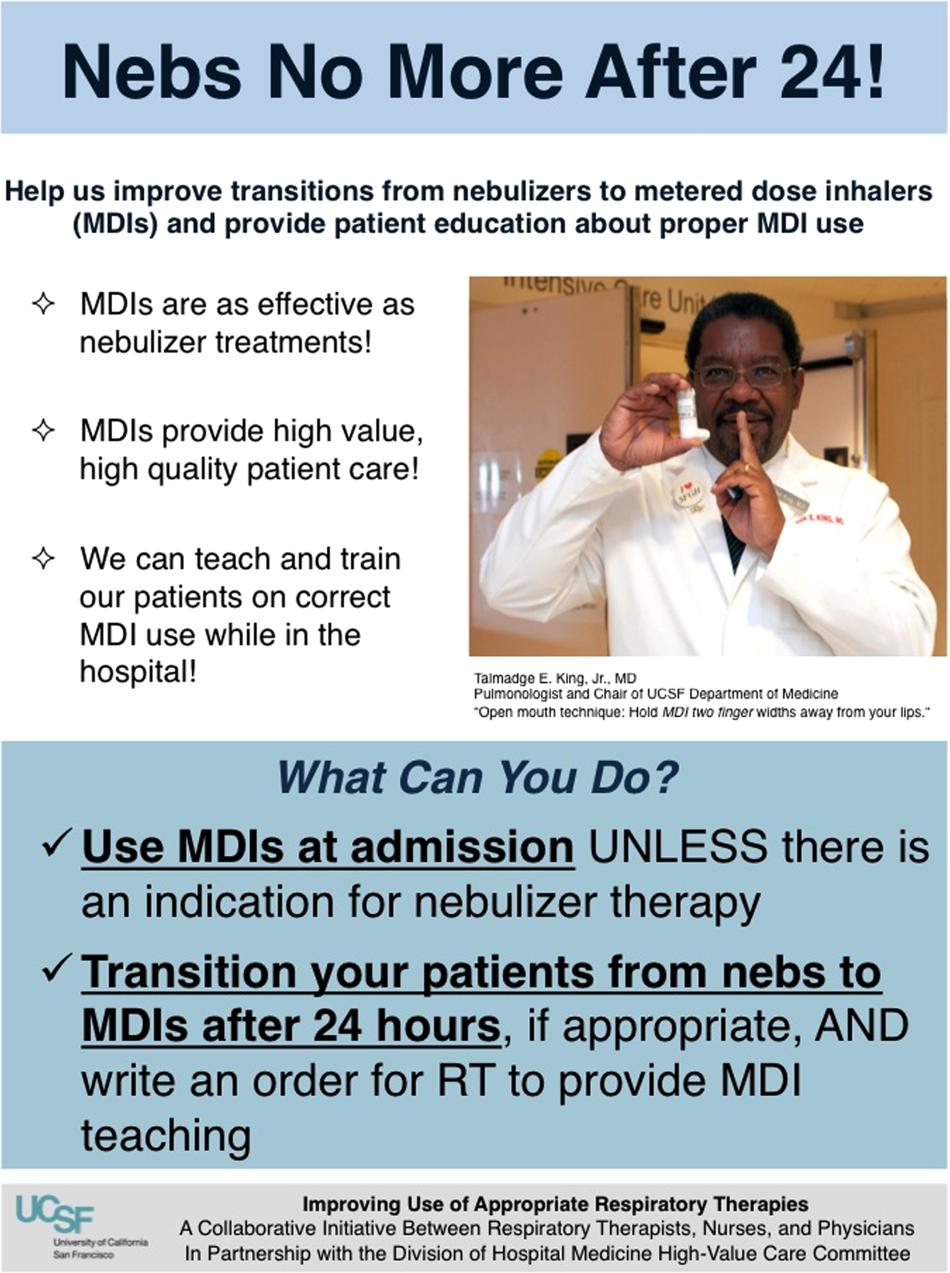
Last, we paired interventions with evidence‐based cost awareness education to drive culture change. At UCSF we have an ongoing longitudinal cost‐awareness curriculum for residents, which has previously been described.[16] We took advantage of this educational forum to address gaps in clinician knowledge related to the targeted areas. When launching the initiative to decrease unnecessary inpatient nebulizer usage and improve transitions to inhalers, we utilized the chronic obstructive pulmonary disease case in the cost‐awareness series. Doing so allowed us to both review the evidence behind the effectiveness of inhalers, and introduce our Nebs No More After 24 campaign, which sought to transition adult inpatients with obstructive pulmonary symptoms from nebs to inhalers within 24 hours of admission.[13]
Intervention Strategy
Our general approach has been to design and implement multifaceted interventions, adapted from previous QI literature (Figure 1).[17] Given the importance of frontline clinician engagement to successful project implementation,[18, 19, 20] our interventions are physician‐driven and are vetted by a large group of clinicians prior to launch. The HVC program also explicitly seeks stakeholder input, perspective, and buy‐in prior to implementation. For example, we involved respiratory therapists (RTs) in the design of the Nebs No More After 24 project, thus ensuring that the interventions fit within their workflow and align with their care‐delivery goals.
Local publicity campaigns provide education and reminders for clinicians. Posters, such as the Nebs No More After 24 poster (Figure 2), were hung in physician, nursing, and RT work areas. Pens featuring the catchphrase Nebs No More After 24 were distributed to clinicians.
In addition to presentations to residents through the UCSF cost awareness curriculum, educational presentations were also delivered to attending physicians and to other allied members of the healthcare team (eg, nurses, RTs) during regularly scheduled staff meetings.
The metrics for each of the projects were regularly monitored, and targeted feedback was provided to clinicians. For the Nebs No More After 24 campaign, data for the number of nebs delivered on the target floor were provided to resident physicians during the cost awareness conference each month, and the data were presented to attending hospitalists in the monthly QI newsletter. This academic year, transfusion and telemetry data are presented via the same strategy.
Stakeholder recruitment, education, and promotional campaigns are important to program launches, but to sustain projects over the long‐term, system changes may be necessary. We have pursued changes in the computerized provider order entry (CPOE) system, such as removing nebs from the admission order set or putting a default duration for certain telemetry orders. Systems‐level interventions, although more difficult to achieve, play an important role in creating enduring changes when paired with educational interventions.
RESULTS
During our first 2 years we have initiated ongoing projects directed at 6 major targets (Table 1). Our flagship project, Nebs No More After 24, resulted in a decrease of nebulizer rates by more than 50% on a high‐acuity medical floor, as previously published.[13] We created a financial model that primarily accounted for RT time and pharmaceutical costs, and estimated a savings of approximately $250,000 annually on this single medical ward (see Supporting Information, Table 1, in the online version of this article).[13]
| High‐Value Care Projects | Relevant Baseline Data | Goals of Project | Strategies |
|---|---|---|---|
| |||
| Nebs No More After 24: Improving appropriate use of respiratory services | The medicine service spent $1 million in direct costs on approximately 25,000 nebs for non‐ICU inpatients. | Reduce unnecessary nebs >15% over 9 months. | Removed nebs from admit order set. |
| Improve transitions from nebs to MDIs. | Enlisted RTs and RNs to help with MDI teaching for patients. | ||
| Improve patient self‐administration of MDIs. | Implemented an educational program for medicine physicians. | ||
| Created local publicity: posters, flyers, and pens. | |||
| Provided data feedback to providers. | |||
| Next step: Introduce a CPOE‐linked intervention. | |||
| Improving use of stress ulcer prophylaxis | 77% of ICU patients on acid suppressive therapy; 31% of these patients did not meet criteria for appropriate prophylaxis. | Reduce overuse and inappropriate use of SUP. | A team of pharmacists, nurses, and physicians developed targeted and evidence‐based UCSF guidelines on use of SUP. |
| Developed and implemented a pharmacist‐led intervention to reduce inappropriate SUP in the ICUs that included the following: | |||
| Reminders on admission and discharge from ICU | |||
| Education and awareness initiative for prescribers | |||
| ICU and service champions | |||
| Culture change | |||
| Next step: Incorporate indications in CPOE and work with ICU to incorporate appropriate GI prophylaxis as part of the standard ICU care bundle. | |||
| Blood utilization stewardship | 30% of transfusions on the hospital medicine service are provided to patients with a hemoglobin >8 g/dL. | Decrease units of blood transfused for a hemoglobin >8.0 g/dL by 25%. | Launched an educational campaign for attending and resident physicians. |
| Monthly feedback to residents and attending physicians. | |||
| Next step: Introduce a decision support system in the CPOE for blood transfusion orders in patients with most recent hemoglobin level >8. | |||
| Improving telemetry utilization | 44% of monitored inpatients on the medical service (with length of stay >48 hours) remain on telemetry until discharge. | Decrease by 15% the number of patients (with length of stay >48 hours) who remain on telemetry until discharge. | Implemented an educational campaign for nursing groups and the medicine and cardiology housestaff. |
| Launched a messaging campaign consisting of posters and pocket cards on appropriate telemetry use. | |||
| Designed a feedback campaign with monthly e‐mail to housestaff on their ward team's telemetry use stats. | |||
| Next step: Build a CPOE intervention that asks users to specify an approved indication for telemetry when they order monitoring. The indication then dictates how long the order is active (24, 48, 72 hours or ongoing), and the MD must renew the order after the elapsed time. | |||
| iReduce iCal: ordering ionized calcium only when needed | The medicine service spent $167,000 in direct costs on iCal labs over a year (40% of all calcium lab orders; 42% occurred in non‐ICU patients). | Reduce number of iCal labs drawn on the medicine service by >25% over the course of 6 months. | With the introduction of CPOE, iCal was removed from traditional daily lab order sets. |
| Discussed with lab, renal, and ICU stakeholders. | |||
| Implemented an educational campaign for physicians and nurses. | |||
| Created local publicity: posters and candies. | |||
| Provided data feedback to providers. | |||
| Repeat inpatient echocardiograms | 25% of TTEs are performed within 6 months of a prior; one‐third of these are for inappropriate indications. | Decrease inappropriate repeat TTEs by 25%. | Implemented an educational campaign. |
| Next step: provide the most recent TTE results in the CPOE at time of order, and provide auditing and decision support for repeat TTEs. | |||
The HVC program also provided an arena for collaborating with and supporting value‐based projects launched by other groups, such as the UCSF Medication Outcomes Center's inappropriate gastric stress ulcer prophylaxis program.[21] Our group helped support the development and implementation of evidence‐based clinical practice guidelines, and we assisted educational interventions targeting clinicians. This program resulted in a decrease in inappropriate stress ulcer prophylaxis in intensive care unit patients from 19% to 6.6% within 1 month following implementation.[21]
DISCUSSION
Physicians are increasingly being asked to embrace and lead efforts to improve healthcare value and reduce costs. Our program provides a framework to guide physician‐led initiatives to identify and address areas of healthcare waste.
Challenges and Lessons Learned
Overcoming the Hurdle of More Care as Better Care
Improving the quality of care has traditionally stressed the underuse of beneficial testing and treatments, for example the use of angiotensin‐converting enzyme inhibitors in systolic heart failure. We found that improving quality by curbing overuse was a new idea for many physicians. Traditionally, physicians have struggled with cost reduction programs, feeling that efforts to reduce costs are indifferent to quality of care, and worse, may actually lead to inferior care.[22] The historical separation of most QI and cost reduction programs has likely furthered this sentiment. Our first projects married cost reduction and QI efforts by demonstrating how reducing overuse could provide an opportunity to increase quality and reduce harms from treatments. For example, transitioning from nebs to metered‐dose inhalers offered the chance to provide inpatient inhaler teaching, whereas decreasing proton pump inhibitor use can reduce the incidence of C difficile. By framing these projects as addressing both numerator and denominator of the value equation, we were able to align our cost‐reduction efforts with physicians' traditional notions of QI.
Cost Transparency
If physicians are to play a larger role in cost‐reduction efforts, they need at least a working understanding of fixed and variable costs in healthcare and of institutional prices.[23, 24] Utilization and clear information about costs were used to guide our interventions and ensured that the efforts spent to eliminate waste would result in cost savings. As an example, we learned that decreasing nebulizer use without a corresponding decrease in daily RT staffing would lead to minimal cost savings. These analyses require the support of business, financial, and resource managers in addition to physicians, nurses, project coordinators, and administrators. At many institutions the lack of price and utilization transparency presents a major barrier to the accurate analysis of cost‐reduction efforts.
The Diplomacy of Cost‐Reduction
Because the bulk of healthcare costs go to labor, efforts to reduce cost may lead to reductions in the resources available to certain departments or even to individuals' wages. For example, initiatives aimed at reducing inappropriate diagnostic imaging will affect the radiology department, which is partially paid based on the volume of studies performed.[25] Key stakeholders must be identified early, and project leaders should seek understanding, engagement, and buy‐in from involved parties prior to implementation. There will often be times that support from senior leaders will be needed to negotiate these tricky situations.
Although we benefited from a largely supportive hospital medicine faculty and resident physicians, not all of our proposed projects made it to implementation. Sometimes stakeholder recruitment proved to be difficult. For instance, a proposed project to change the protocol from routine to clinically indicated peripheral intravenous catheter replacement for adult inpatients was met with some resistance by some members of nursing management. We reviewed the literature together and discussed in length the proposal, but ultimately decided that our institution was not ready for this change at this time.
Limitations and Next Steps
Our goal is to provide guidance on exporting the approach of our HVC program to other institutions, but there may be several limitations. First, our strategy relied on several contributing factors that may be unique to our institution. We had engaged frontline physician champions, who may not be available or have the necessary support at other academic or community organizations. Our UCSF cost awareness curriculum provided an educational foundation and framework for our projects. We also had institutional commitment in the form of our medical center division administrator.
Second, there are up‐front costs to running our committee, which are primarily related to personnel funding as described in the Methods. Over the next year we aim to calculate cost‐effectiveness ratios for our projects and overall return on investment for each of our projects, as we have done for the Nebs No More After 24 project (see Supporting Information, Table 1, in the online version of this article). Based on this analysis, the modest upfront costs appear to be easily recouped over the course of the year.
We have anecdotally noted a culture change in the way that our physicians discuss and consider testing. For example, it is common now to hear ward teams on morning rounds consider the costs of testing or discuss the need for prophylactic proton pump inhibitors. An important next step for our HVC program is the building of better data infrastructures for our own electronic health record system to allow us to more quickly, accurately, and comprehensively identify new targets and monitor the progress and sustainability of our projects. The Institute of Medicine has noted that the adoption of technology is a key strategy to creating a continuously learning healthcare system.[1] It is our hope that through consistent audit and feedback of resource utilization we can translate our early gains into sustainable changes in practice.
Furthermore, we hope to target and enact additional organizational changes, including creating CPOE‐linked interventions to help reinforce and further our objectives. We believe that creating systems that make it easier to do the right thing will help the cause of embedding HVC practices throughout our medical center. We have begun to scale some of our projects, such as the Nebs No More After 24 campaign, medical center wide, and ultimately we hope to disseminate successful projects and models beyond our medical center to contribute to the national movement to provide the best care at lower costs.
As discussed above, our interventions are targeted at simultaneous improvements in quality with decreased costs. However, the goal is not to hide our cost interventions behind the banner of quality. We believe that there is a shifting culture that is increasingly ready to accept cost alone as a meaningful patient harm, worthy of interventions on its own merits, assuming that quality and safety remain stable.[26, 27]
CONCLUSIONS
Our HVC program has been successful in promoting improved healthcare value and engaging clinicians in this effort. The program is guided by the use of financial data to identify areas with clear evidence of waste in the hospital, the creation of evidence‐based interventions that improve quality of care while cutting costs, and the pairing of interventions with evidence‐based cost awareness education to drive culture change.
Acknowledgements
The authors acknowledge the following members of the UCSF Division of Hospital Medicine High‐Value Care Committee who have led some of the initiatives mentioned in this article and have directly contributed to Table 1: Dr. Stephanie Rennke, Dr. Alvin Rajkomar, Dr. Nader Najafi, Dr. Steven Ludwin, and Dr. Elizabeth Stewart. Dr. Russ Cucina particularly contributed to the designs and implementation of electronic medical record interventions.
Disclosures: Dr. Moriates received funding from the UCSF Center for Healthcare Value, the Agency for Healthcare Research and Quality (as editor for AHRQ Patient Safety Net), and the ABIM Foundation. Mrs. Novelero received funding from the UCSF Center for Healthcare Value. Dr. Wachter reports serving as the immediate past‐chair of the American Board of Internal Medicine (for which he received a stipend) and is a current member of the ABIM Foundation board; receiving a contract to UCSF from the Agency for Healthcare Research and Quality for editing 2 patient‐safety websites; receiving compensation from John Wiley & Sons for writing a blog; receiving compensation from QuantiaMD for editing and presenting patient safety educational modules; receiving royalties from Lippincott Williams & Wilkins and McGraw‐Hill for writing/editing several books; receiving a stipend and stock/options for serving on the Board of Directors of IPC‐The Hospitalist Company; serving on the scientific advisory boards for PatientSafe Solutions, CRISI, SmartDose, and EarlySense (for which he receives stock options); and holding the Benioff endowed chair in hospital medicine from Marc and Lynne Benioff. He is also a member of the Board of Directors of Salem Hospital, Salem, Oregon, for which he receives travel reimbursement but no compensation. Mr. John Hillman, Mr. Aseem Bharti, and Ms. Claudia Hermann from UCSF Decision Support Services provided financial data support and analyses, and the UCSF Center for Healthcare Value provided resource and financial support.
- Institute of Medicine. Committee on the Learning Health Care System in America. Best Care at Lower Cost: The Path to Continuously Learning Health Care in America. Washington, DC: National Academies Press; 2012.
- , . Value‐based purchasing—national programs to move from volume to value. N Engl J Med. 2012;367(4):292–295.
- . Making good on ACOs' promise—the final rule for the Medicare Shared Savings Program. N Engl J Med. 2011;365(19):1753–1756.
- . American College of Physicians ethics manual: sixth edition. Ann Intern Med. 2012;156(1 pt 2):73–104.
- ABIM Foundation, American College of Physicians‐American Society of Internal Medicine, European Federation of Internal Medicine. Medical professionalism in the new millennium: a physician charter. Ann Intern Med. 2002;136(3):243–246.
- , . Choosing Wisely: helping physicians and patients make smart decisions about their care. JAMA. 2012;307(17):1801.
- , , , . High‐value, cost‐conscious health care: concepts for clinicians to evaluate the benefits, harms, and costs of medical interventions. Ann Intern Med. 2011;154(3):174–180.
- , . Waste not, want not: promoting efficient use of health care resources. Ann Intern Med. 2013;158(1):67–68.
- , , . General pediatric attending physicians' and residents' knowledge of inpatient hospital finances. Pediatrics. 2013;131(6):1072–1080.
- , , . Hospitalists' awareness of patient charges associated with inpatient care. J Hosp Med. 2010;5(5):295–297.
- , , , , . Teaching residents to provide cost‐conscious care: A national survey of residency program directors. JAMA Intern Med. 2014;174(3):470–472.
- , , . Perceived, actual, and desired knowledge regarding medicare billing and reimbursement. J Gen Intern Med. 2006;21(5):466–470.
- , , , , . “Nebs No More After 24”: a pilot program to improve the use of appropriate respiratory therapies. JAMA Intern Med. 2013;173(17):1647–1648.
- , , , . Acid‐suppressive medication use and the risk for hospital‐acquired pneumonia. JAMA. 2009;301(20):2120–2128.
- , , , et al. Iatrogenic gastric acid suppression and the risk of nosocomial Clostridium difficile infection. Arch Intern Med. 2010;170(9):784–790.
- , , , . The value in the evidence: teaching residents to “choose wisely.” JAMA Intern Med.2013;173(4):308–310.
- , . Evidence‐based quality improvement: the state of the science. Health Aff. 2005;24(1):138–150.
- , , , . The role of physician engagement on the impact of the hospital‐based practice improvement module (PIM). J Hosp Med. 2009;4(8):466–470.
- , . Finding common cause in quality: confronting the physician engagement challenge. Physician Exec. 2008;34(2):26–28, 30–31.
- , . Engaging physicians and leveraging professionalism: a key to success for quality measurement and improvement. JAMA. 2012;308(10):979–980.
- , , et al. The development and implementation of a bundled quality improvement initiative to reduce inappropriate stress ulcer prophylaxis. ICU Dir. 2013;4(6):322–325.
- . Lost in translation: physicians' struggle with cost‐reduction programs. Ann Intern Med. 2011;154(6):430–433.
- , . How to solve the cost crisis in health care. Harv Bus Rev. 2011;89(9):46–52, 54, 56–61 passim.
- , , , . The savings illusion—why clinical quality improvement fails to deliver bottom‐line results. N Engl J Med. 2011;365(26):e48.
- , , , , . Reducing radiology use on an inpatient medical service: choosing wisely. Arch Intern Med. 2012;172(20):1606–1608.
- , , . First, do no (financial) harm. JAMA. 2013;310(6):577–578.
- , , . Full disclosure—out‐of‐pocket costs as side effects. N Engl J Med. 2013;369(16):1484–1486.
With a United States medical system that spends as much as $750 billion each year on care that does not result in improved health outcomes,[1] many policy initiatives, including the Centers for Medicare and Medicaid Services' Value‐Based Purchasing program, seek to realign hospitals' financial incentives from a focus on production to one on value (quality divided by cost).[2, 3] Professional organizations have now deemed resource stewardship an ethical responsibility for professionalism,[4, 5] and campaigns such as the American Board of Internal Medicine (ABIM) Foundation's Choosing Wisely effort and the American College of Physicians' High‐Value Care platform are calling on frontline clinicians to address unnecessary and wasteful services.[6, 7]
Despite these pressures and initiatives, most physicians lack the knowledge and tools necessary to prioritize the delivery of their own healthcare services according to value.[8, 9, 10] Hospital medicine physicians are unaware of the costs associated with the interventions they order,[10] and the majority of medical training programs lack curricula focused on healthcare costs,[11] creating a large gap between physicians' perceived, desired, and actual knowledge related to costs.[12] Novel frameworks and frontline physician engagement are required if clinicians are to improve the value of the care they deliver.
We describe 1 of our first steps at the University of California, San Francisco (UCSF) to promote high‐value care (HVC) delivery: the creation of a HVC program led by clinicians and administrators focused on identifying and addressing wasteful practices within our hospitalist group. The program aims to (1) use financial and clinical data to identify areas with clear evidence of waste in the hospital, (2) promote evidence‐based interventions that improve both quality of care and value, and (3) pair interventions with evidence‐based cost awareness education to drive culture change. Our experience and inaugural projects provide a model of the key features, inherent challenges, and lessons learned, which may help inform similar efforts.
METHODS
In March 2012, we launched an HVC program within our Division of Hospital Medicine at UCSF Medical Center, a 600‐bed academic medical center in an urban setting. During the 2013 academic year, our division included 45 physicians. The medicine service, comprised of 8 teaching medical ward teams (1 attending, 1 resident, 2 interns, and variable number of medical students), and 1 nonteaching medical ward team (1 attending), admitted 4700 patients that year.
Organizational Framework
The HVC program is co‐led by a UCSF hospitalist (C.M.) and the administrator of the Division of Hospital Medicine (M.N.). Team members include hospitalists, hospital medicine fellows, resident physicians, pharmacists, project coordinators, and other administrators. The team meets in person for 1 hour every month. Project teams and ad hoc subcommittee groups often convene between meetings.
Our HVC program was placed within the infrastructure, and under the leadership, of our already established quality improvement (QI) program at UCSF. Our Division of Hospital Medicine Director of Quality and Safety (M.M.) thus oversees the QI, patient safety, patient experience, and high‐value care efforts.
The HVC program funding is largely in personnel costs. The physician leader (15% effort) is funded by the Division of Hospital Medicine, whereas the administrator is cofunded by both the division and by the medical center (largely through her roles as both division administrator and service line director). An administrative assistant within the division is also assigned to help with administrative tasks. Some additional data gathering and project support comes from existing medical center QI infrastructure, the decision support services unit, and through UCSF's new Center for Healthcare Value. Other ancillary costs for our projects have included publicity, data analytics, and information technology infrastructure. We estimate that the costs of this program are approximately $50,000 to $75,000 annually.
Framework for Identifying Target Projects
Robust Analysis of Costs
We created a framework for identifying, designing, and promoting projects specifically aimed at improving healthcare value (Figure 1). Financial data were used to identify areas with clear evidence of waste in the hospital, areas of high cost with no benefit in health outcomes. We focused particularly on obtaining cost and billing data for our medical service, which provided important insight into potential targets for improvements in value. For example, in 2011, the Division of Hospital Medicine spent more than $1 million annually in direct costs for the administration of nebulized bronchodilator therapies (nebs) to nonintensive care unit patients on the medical service.[13] These high costs, exposed by billing data, were believed to represent potential unnecessary testing and/or procedures. Not every area of high cost was deemed a target for intervention. For example, the use of recombinant factor VIII appeared a necessary expenditure (over $1 million per year) for our patients with hemophilia. Although our efforts focused on reducing waste, it is worth noting that healthcare value can also be increased by improving the delivery of high‐value services.
Recognized Benefits in Quality of Care
The program also evaluated the impact of cost reduction efforts on the quality of care, based on a high standard of current evidence. Though value can be improved by interventions that decrease costs while being quality neutral, our group chose to focus first on projects that would simultaneously improve quality while decreasing costs. We felt that this win‐win strategy would help obtain buy‐in from clinicians weary of prior cost‐cutting programs. For example, we pursued interventions aimed at reducing inappropriate gastric stress ulcer prophylaxis, which had the potential to both cut costs and minimize risks of hospital‐acquired pneumonia and Clostridium difficile infections.[14, 15] All proposed HVC targets were vetted through a review of the literature and published guidelines. In general, our initial projects had to be strongly supported by evidence, with high‐quality studies, preferably meta‐analyses or systematic reviews, that displayed the safety of our recommended changes. We reviewed the literature with experts. For example, we met with faculty pulmonologists to discuss the evidence supporting the use of inhalers instead of nebulizers in adults with obstructive pulmonary disease. The goals of our projects were chosen by our HVC committee, based on an analysis of our baseline data and the perceived potential effects of our proposed interventions.
Educational Intervention
Last, we paired interventions with evidence‐based cost awareness education to drive culture change. At UCSF we have an ongoing longitudinal cost‐awareness curriculum for residents, which has previously been described.[16] We took advantage of this educational forum to address gaps in clinician knowledge related to the targeted areas. When launching the initiative to decrease unnecessary inpatient nebulizer usage and improve transitions to inhalers, we utilized the chronic obstructive pulmonary disease case in the cost‐awareness series. Doing so allowed us to both review the evidence behind the effectiveness of inhalers, and introduce our Nebs No More After 24 campaign, which sought to transition adult inpatients with obstructive pulmonary symptoms from nebs to inhalers within 24 hours of admission.[13]
Intervention Strategy
Our general approach has been to design and implement multifaceted interventions, adapted from previous QI literature (Figure 1).[17] Given the importance of frontline clinician engagement to successful project implementation,[18, 19, 20] our interventions are physician‐driven and are vetted by a large group of clinicians prior to launch. The HVC program also explicitly seeks stakeholder input, perspective, and buy‐in prior to implementation. For example, we involved respiratory therapists (RTs) in the design of the Nebs No More After 24 project, thus ensuring that the interventions fit within their workflow and align with their care‐delivery goals.
Local publicity campaigns provide education and reminders for clinicians. Posters, such as the Nebs No More After 24 poster (Figure 2), were hung in physician, nursing, and RT work areas. Pens featuring the catchphrase Nebs No More After 24 were distributed to clinicians.
In addition to presentations to residents through the UCSF cost awareness curriculum, educational presentations were also delivered to attending physicians and to other allied members of the healthcare team (eg, nurses, RTs) during regularly scheduled staff meetings.
The metrics for each of the projects were regularly monitored, and targeted feedback was provided to clinicians. For the Nebs No More After 24 campaign, data for the number of nebs delivered on the target floor were provided to resident physicians during the cost awareness conference each month, and the data were presented to attending hospitalists in the monthly QI newsletter. This academic year, transfusion and telemetry data are presented via the same strategy.
Stakeholder recruitment, education, and promotional campaigns are important to program launches, but to sustain projects over the long‐term, system changes may be necessary. We have pursued changes in the computerized provider order entry (CPOE) system, such as removing nebs from the admission order set or putting a default duration for certain telemetry orders. Systems‐level interventions, although more difficult to achieve, play an important role in creating enduring changes when paired with educational interventions.
RESULTS
During our first 2 years we have initiated ongoing projects directed at 6 major targets (Table 1). Our flagship project, Nebs No More After 24, resulted in a decrease of nebulizer rates by more than 50% on a high‐acuity medical floor, as previously published.[13] We created a financial model that primarily accounted for RT time and pharmaceutical costs, and estimated a savings of approximately $250,000 annually on this single medical ward (see Supporting Information, Table 1, in the online version of this article).[13]
| High‐Value Care Projects | Relevant Baseline Data | Goals of Project | Strategies |
|---|---|---|---|
| |||
| Nebs No More After 24: Improving appropriate use of respiratory services | The medicine service spent $1 million in direct costs on approximately 25,000 nebs for non‐ICU inpatients. | Reduce unnecessary nebs >15% over 9 months. | Removed nebs from admit order set. |
| Improve transitions from nebs to MDIs. | Enlisted RTs and RNs to help with MDI teaching for patients. | ||
| Improve patient self‐administration of MDIs. | Implemented an educational program for medicine physicians. | ||
| Created local publicity: posters, flyers, and pens. | |||
| Provided data feedback to providers. | |||
| Next step: Introduce a CPOE‐linked intervention. | |||
| Improving use of stress ulcer prophylaxis | 77% of ICU patients on acid suppressive therapy; 31% of these patients did not meet criteria for appropriate prophylaxis. | Reduce overuse and inappropriate use of SUP. | A team of pharmacists, nurses, and physicians developed targeted and evidence‐based UCSF guidelines on use of SUP. |
| Developed and implemented a pharmacist‐led intervention to reduce inappropriate SUP in the ICUs that included the following: | |||
| Reminders on admission and discharge from ICU | |||
| Education and awareness initiative for prescribers | |||
| ICU and service champions | |||
| Culture change | |||
| Next step: Incorporate indications in CPOE and work with ICU to incorporate appropriate GI prophylaxis as part of the standard ICU care bundle. | |||
| Blood utilization stewardship | 30% of transfusions on the hospital medicine service are provided to patients with a hemoglobin >8 g/dL. | Decrease units of blood transfused for a hemoglobin >8.0 g/dL by 25%. | Launched an educational campaign for attending and resident physicians. |
| Monthly feedback to residents and attending physicians. | |||
| Next step: Introduce a decision support system in the CPOE for blood transfusion orders in patients with most recent hemoglobin level >8. | |||
| Improving telemetry utilization | 44% of monitored inpatients on the medical service (with length of stay >48 hours) remain on telemetry until discharge. | Decrease by 15% the number of patients (with length of stay >48 hours) who remain on telemetry until discharge. | Implemented an educational campaign for nursing groups and the medicine and cardiology housestaff. |
| Launched a messaging campaign consisting of posters and pocket cards on appropriate telemetry use. | |||
| Designed a feedback campaign with monthly e‐mail to housestaff on their ward team's telemetry use stats. | |||
| Next step: Build a CPOE intervention that asks users to specify an approved indication for telemetry when they order monitoring. The indication then dictates how long the order is active (24, 48, 72 hours or ongoing), and the MD must renew the order after the elapsed time. | |||
| iReduce iCal: ordering ionized calcium only when needed | The medicine service spent $167,000 in direct costs on iCal labs over a year (40% of all calcium lab orders; 42% occurred in non‐ICU patients). | Reduce number of iCal labs drawn on the medicine service by >25% over the course of 6 months. | With the introduction of CPOE, iCal was removed from traditional daily lab order sets. |
| Discussed with lab, renal, and ICU stakeholders. | |||
| Implemented an educational campaign for physicians and nurses. | |||
| Created local publicity: posters and candies. | |||
| Provided data feedback to providers. | |||
| Repeat inpatient echocardiograms | 25% of TTEs are performed within 6 months of a prior; one‐third of these are for inappropriate indications. | Decrease inappropriate repeat TTEs by 25%. | Implemented an educational campaign. |
| Next step: provide the most recent TTE results in the CPOE at time of order, and provide auditing and decision support for repeat TTEs. | |||
The HVC program also provided an arena for collaborating with and supporting value‐based projects launched by other groups, such as the UCSF Medication Outcomes Center's inappropriate gastric stress ulcer prophylaxis program.[21] Our group helped support the development and implementation of evidence‐based clinical practice guidelines, and we assisted educational interventions targeting clinicians. This program resulted in a decrease in inappropriate stress ulcer prophylaxis in intensive care unit patients from 19% to 6.6% within 1 month following implementation.[21]
DISCUSSION
Physicians are increasingly being asked to embrace and lead efforts to improve healthcare value and reduce costs. Our program provides a framework to guide physician‐led initiatives to identify and address areas of healthcare waste.
Challenges and Lessons Learned
Overcoming the Hurdle of More Care as Better Care
Improving the quality of care has traditionally stressed the underuse of beneficial testing and treatments, for example the use of angiotensin‐converting enzyme inhibitors in systolic heart failure. We found that improving quality by curbing overuse was a new idea for many physicians. Traditionally, physicians have struggled with cost reduction programs, feeling that efforts to reduce costs are indifferent to quality of care, and worse, may actually lead to inferior care.[22] The historical separation of most QI and cost reduction programs has likely furthered this sentiment. Our first projects married cost reduction and QI efforts by demonstrating how reducing overuse could provide an opportunity to increase quality and reduce harms from treatments. For example, transitioning from nebs to metered‐dose inhalers offered the chance to provide inpatient inhaler teaching, whereas decreasing proton pump inhibitor use can reduce the incidence of C difficile. By framing these projects as addressing both numerator and denominator of the value equation, we were able to align our cost‐reduction efforts with physicians' traditional notions of QI.
Cost Transparency
If physicians are to play a larger role in cost‐reduction efforts, they need at least a working understanding of fixed and variable costs in healthcare and of institutional prices.[23, 24] Utilization and clear information about costs were used to guide our interventions and ensured that the efforts spent to eliminate waste would result in cost savings. As an example, we learned that decreasing nebulizer use without a corresponding decrease in daily RT staffing would lead to minimal cost savings. These analyses require the support of business, financial, and resource managers in addition to physicians, nurses, project coordinators, and administrators. At many institutions the lack of price and utilization transparency presents a major barrier to the accurate analysis of cost‐reduction efforts.
The Diplomacy of Cost‐Reduction
Because the bulk of healthcare costs go to labor, efforts to reduce cost may lead to reductions in the resources available to certain departments or even to individuals' wages. For example, initiatives aimed at reducing inappropriate diagnostic imaging will affect the radiology department, which is partially paid based on the volume of studies performed.[25] Key stakeholders must be identified early, and project leaders should seek understanding, engagement, and buy‐in from involved parties prior to implementation. There will often be times that support from senior leaders will be needed to negotiate these tricky situations.
Although we benefited from a largely supportive hospital medicine faculty and resident physicians, not all of our proposed projects made it to implementation. Sometimes stakeholder recruitment proved to be difficult. For instance, a proposed project to change the protocol from routine to clinically indicated peripheral intravenous catheter replacement for adult inpatients was met with some resistance by some members of nursing management. We reviewed the literature together and discussed in length the proposal, but ultimately decided that our institution was not ready for this change at this time.
Limitations and Next Steps
Our goal is to provide guidance on exporting the approach of our HVC program to other institutions, but there may be several limitations. First, our strategy relied on several contributing factors that may be unique to our institution. We had engaged frontline physician champions, who may not be available or have the necessary support at other academic or community organizations. Our UCSF cost awareness curriculum provided an educational foundation and framework for our projects. We also had institutional commitment in the form of our medical center division administrator.
Second, there are up‐front costs to running our committee, which are primarily related to personnel funding as described in the Methods. Over the next year we aim to calculate cost‐effectiveness ratios for our projects and overall return on investment for each of our projects, as we have done for the Nebs No More After 24 project (see Supporting Information, Table 1, in the online version of this article). Based on this analysis, the modest upfront costs appear to be easily recouped over the course of the year.
We have anecdotally noted a culture change in the way that our physicians discuss and consider testing. For example, it is common now to hear ward teams on morning rounds consider the costs of testing or discuss the need for prophylactic proton pump inhibitors. An important next step for our HVC program is the building of better data infrastructures for our own electronic health record system to allow us to more quickly, accurately, and comprehensively identify new targets and monitor the progress and sustainability of our projects. The Institute of Medicine has noted that the adoption of technology is a key strategy to creating a continuously learning healthcare system.[1] It is our hope that through consistent audit and feedback of resource utilization we can translate our early gains into sustainable changes in practice.
Furthermore, we hope to target and enact additional organizational changes, including creating CPOE‐linked interventions to help reinforce and further our objectives. We believe that creating systems that make it easier to do the right thing will help the cause of embedding HVC practices throughout our medical center. We have begun to scale some of our projects, such as the Nebs No More After 24 campaign, medical center wide, and ultimately we hope to disseminate successful projects and models beyond our medical center to contribute to the national movement to provide the best care at lower costs.
As discussed above, our interventions are targeted at simultaneous improvements in quality with decreased costs. However, the goal is not to hide our cost interventions behind the banner of quality. We believe that there is a shifting culture that is increasingly ready to accept cost alone as a meaningful patient harm, worthy of interventions on its own merits, assuming that quality and safety remain stable.[26, 27]
CONCLUSIONS
Our HVC program has been successful in promoting improved healthcare value and engaging clinicians in this effort. The program is guided by the use of financial data to identify areas with clear evidence of waste in the hospital, the creation of evidence‐based interventions that improve quality of care while cutting costs, and the pairing of interventions with evidence‐based cost awareness education to drive culture change.
Acknowledgements
The authors acknowledge the following members of the UCSF Division of Hospital Medicine High‐Value Care Committee who have led some of the initiatives mentioned in this article and have directly contributed to Table 1: Dr. Stephanie Rennke, Dr. Alvin Rajkomar, Dr. Nader Najafi, Dr. Steven Ludwin, and Dr. Elizabeth Stewart. Dr. Russ Cucina particularly contributed to the designs and implementation of electronic medical record interventions.
Disclosures: Dr. Moriates received funding from the UCSF Center for Healthcare Value, the Agency for Healthcare Research and Quality (as editor for AHRQ Patient Safety Net), and the ABIM Foundation. Mrs. Novelero received funding from the UCSF Center for Healthcare Value. Dr. Wachter reports serving as the immediate past‐chair of the American Board of Internal Medicine (for which he received a stipend) and is a current member of the ABIM Foundation board; receiving a contract to UCSF from the Agency for Healthcare Research and Quality for editing 2 patient‐safety websites; receiving compensation from John Wiley & Sons for writing a blog; receiving compensation from QuantiaMD for editing and presenting patient safety educational modules; receiving royalties from Lippincott Williams & Wilkins and McGraw‐Hill for writing/editing several books; receiving a stipend and stock/options for serving on the Board of Directors of IPC‐The Hospitalist Company; serving on the scientific advisory boards for PatientSafe Solutions, CRISI, SmartDose, and EarlySense (for which he receives stock options); and holding the Benioff endowed chair in hospital medicine from Marc and Lynne Benioff. He is also a member of the Board of Directors of Salem Hospital, Salem, Oregon, for which he receives travel reimbursement but no compensation. Mr. John Hillman, Mr. Aseem Bharti, and Ms. Claudia Hermann from UCSF Decision Support Services provided financial data support and analyses, and the UCSF Center for Healthcare Value provided resource and financial support.
- Institute of Medicine. Committee on the Learning Health Care System in America. Best Care at Lower Cost: The Path to Continuously Learning Health Care in America. Washington, DC: National Academies Press; 2012.
- , . Value‐based purchasing—national programs to move from volume to value. N Engl J Med. 2012;367(4):292–295.
- . Making good on ACOs' promise—the final rule for the Medicare Shared Savings Program. N Engl J Med. 2011;365(19):1753–1756.
- . American College of Physicians ethics manual: sixth edition. Ann Intern Med. 2012;156(1 pt 2):73–104.
- ABIM Foundation, American College of Physicians‐American Society of Internal Medicine, European Federation of Internal Medicine. Medical professionalism in the new millennium: a physician charter. Ann Intern Med. 2002;136(3):243–246.
- , . Choosing Wisely: helping physicians and patients make smart decisions about their care. JAMA. 2012;307(17):1801.
- , , , . High‐value, cost‐conscious health care: concepts for clinicians to evaluate the benefits, harms, and costs of medical interventions. Ann Intern Med. 2011;154(3):174–180.
- , . Waste not, want not: promoting efficient use of health care resources. Ann Intern Med. 2013;158(1):67–68.
- , , . General pediatric attending physicians' and residents' knowledge of inpatient hospital finances. Pediatrics. 2013;131(6):1072–1080.
- , , . Hospitalists' awareness of patient charges associated with inpatient care. J Hosp Med. 2010;5(5):295–297.
- , , , , . Teaching residents to provide cost‐conscious care: A national survey of residency program directors. JAMA Intern Med. 2014;174(3):470–472.
- , , . Perceived, actual, and desired knowledge regarding medicare billing and reimbursement. J Gen Intern Med. 2006;21(5):466–470.
- , , , , . “Nebs No More After 24”: a pilot program to improve the use of appropriate respiratory therapies. JAMA Intern Med. 2013;173(17):1647–1648.
- , , , . Acid‐suppressive medication use and the risk for hospital‐acquired pneumonia. JAMA. 2009;301(20):2120–2128.
- , , , et al. Iatrogenic gastric acid suppression and the risk of nosocomial Clostridium difficile infection. Arch Intern Med. 2010;170(9):784–790.
- , , , . The value in the evidence: teaching residents to “choose wisely.” JAMA Intern Med.2013;173(4):308–310.
- , . Evidence‐based quality improvement: the state of the science. Health Aff. 2005;24(1):138–150.
- , , , . The role of physician engagement on the impact of the hospital‐based practice improvement module (PIM). J Hosp Med. 2009;4(8):466–470.
- , . Finding common cause in quality: confronting the physician engagement challenge. Physician Exec. 2008;34(2):26–28, 30–31.
- , . Engaging physicians and leveraging professionalism: a key to success for quality measurement and improvement. JAMA. 2012;308(10):979–980.
- , , et al. The development and implementation of a bundled quality improvement initiative to reduce inappropriate stress ulcer prophylaxis. ICU Dir. 2013;4(6):322–325.
- . Lost in translation: physicians' struggle with cost‐reduction programs. Ann Intern Med. 2011;154(6):430–433.
- , . How to solve the cost crisis in health care. Harv Bus Rev. 2011;89(9):46–52, 54, 56–61 passim.
- , , , . The savings illusion—why clinical quality improvement fails to deliver bottom‐line results. N Engl J Med. 2011;365(26):e48.
- , , , , . Reducing radiology use on an inpatient medical service: choosing wisely. Arch Intern Med. 2012;172(20):1606–1608.
- , , . First, do no (financial) harm. JAMA. 2013;310(6):577–578.
- , , . Full disclosure—out‐of‐pocket costs as side effects. N Engl J Med. 2013;369(16):1484–1486.
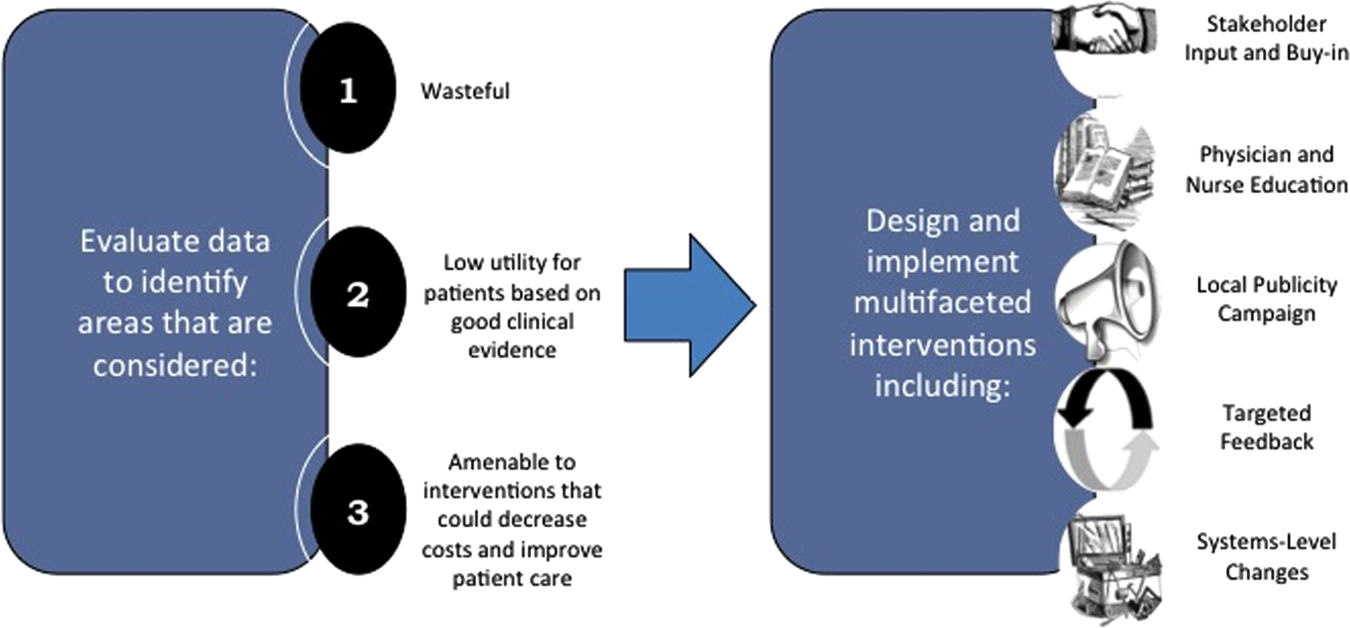
Following Patient Safety Practices
Healthcare delivery organizations are under increasing pressure to improve patient safety. The fundamental underpinning of efforts to improve safety has been the establishment of a no‐blame culture, one that focuses less on individual transgressions and more on system improvement.[1, 2] As evidence‐based practices to improve care have emerged, and the pressures to deliver tangible improvements in safety and quality have grown, providers, healthcare system leaders, and policymakers are struggling with how best to balance the need for accountability with this no‐blame paradigm.
In dealing with areas such as hand hygiene, where there is strong evidence for the value of the practice yet relatively poor adherence in many institutions, Wachter and Pronovost have argued that the scales need to tip more in the direction of accountability, including the imposition of penalties for clinicians who habitually fail to follow certain safety practices.[3] Although not obviating the critical importance of systems improvement, they argue that a failure to enforce such measures undermines trust in the system and invites external regulation. Chassin and colleagues made a similar point in arguing for the identification of certain accountability measures that could be used in public reporting and pay‐for‐performance programs.[4]
Few organizations have enacted robust systems to hold providers responsible for adhering to accountability measures.[4] Although many hospitals have policies to suspend clinical privileges for failing to sign discharge summaries or obtain a yearly purified protein derivative test, few have formal programs to identify and deal with clinicians whose behavior is persistently problematic.[3] Furthermore, existing modes of physician accountability, such as state licensing boards, only discipline physicians retroactively (and rarely) when healthcare organizations report poor performance. State boards typically do not consider prevention of injury, such as adherence to safety practices, to be part of their responsibility.[5] Similarly, credentialing boards (eg, the American Board of Internal Medicine) do not assess adherence to such practices in coming to their decisions.
It is estimated that strict adherence to infection control practices, such as hand hygiene, could prevent over 100,000 hospital deaths every year; adherence to other evidence‐based safety practices such as the use of a preoperative time‐out would likely prevent many more deaths and cases of medical injury.[3, 6] Although there are practical issues, such as how to audit individual clinician adherence in ways that are feasible and fair, that make enforcing individual provider accountability challenging, there seems little doubt that attitudes regarding the appropriateness of enacting penalties for safety transgressions will be key determinants of whether such measures are considered. Yet no study to date has assessed the opinions of different stakeholders (physicians, nurses, trainees, patients) regarding various strategies, including public reporting and penalties, to improve adherence to safety practices. We aimed to assess these attitudes across a variety of such stakeholders.
METHODS
Survey Development and Characteristics
To understand the perceptions of measures designed to improve patient safety, we designed a survey of patients, nurses, medical students, resident physicians, and attending physicians to be administered at hospitals associated with the University of California, San Francisco (UCSF). Institutional review board approval was obtained from the UCSF Committee on Human Research, and all respondents provided informed consent.
The survey was developed by the authors and pilot tested with 2 populations. First, the survey was administered to a group of 12 UCSF Division of Hospital Medicine research faculty; their feedback was used to revise the survey. Second, the survey was administered to a convenience sample of 2 UCSF medical students, and their feedback was used to further refine the survey.
The questionnaire presented 3 scenarios in which a healthcare provider committed a patient‐safety protocol lapse; participants were asked their opinions about the appropriate responses to each of the violations. The 3 scenarios were: (1) a healthcare provider not properly conducting hand hygiene before a patient encounter, (2) a healthcare provider not properly conducting a fall risk assessment on a hospitalized patient, and (3) a healthcare provider not properly conducting a preoperative timeout prior to surgery. For each scenario, a series of questions was asked about a variety of institutional responses toward a provider who did not adhere to each safety protocol. Potential responses included feedback (email feedback, verbal feedback, meeting with a supervisor, a quarterly performance review meeting, and a quarterly report card seen only by the provider), public reporting (posting the provider's infractions on a public website), and penalties (fines, suspension without pay, and firing).
We chose the 3 practices because they are backed by strong evidence, are relatively easy to perform, are inexpensive, are linked to important and common harms, and are generally supported within the patient‐safety community. Improved adherence to hand hygiene significantly reduces infection transmission in healthcare settings.[7, 8, 9, 10, 11] Performing fall risk assessments has been shown to reduce falls in hospitalized patients,[12] and using preoperative checklists, including a surgical time‐out, can reduce mortality and complication risks by approximately 40%.[13]
Respondents were asked how many cases of documented nonadherence would be necessary for the penalties to be appropriate (1 time, 25 times, 610 times, 1115 times, 16+ times, or would never be appropriate). Finally, respondents were asked to rate the potential harm to patients of each protocol lapse (nonelow, medium, or high).
Demographic information collected from the healthcare providers and medical students included age, gender, position, department, and years' experience in their current position. Demographic information collected from the patients included age, gender, insurance status, race, education level, household income level, and relationship status.
Survey Administration
Surveys were administered to convenience samples of 5 groups of individuals: attending physicians in the UCSF Department of Internal Medicine based at UCSF Medical Center and the San Francisco Veterans Affairs Medical Center, nurses at UCSF Medical Center, residents in the UCSF internal medicine residency program, medical students at UCSF, and inpatients in the internal medicine service at UCSF Medical Center's Moffitt‐Long Hospital. Attending physicians and nurses were surveyed at their respective departmental meetings. For resident physicians and medical students, surveys were distributed at the beginning of lectures and collected at the end.
Patients were eligible to participate if they spoke English and were noted to be alert and oriented to person, time, and place. A survey administrator located eligible patients in the internal medicine service via the electronic medical record system, determined if they were alert and oriented, and approached each patient in his or her room. If the patients verbally consented to consider participation, the surveys were given to them and retrieved after approximately 30 minutes.
Healthcare professionals were offered the opportunity to enter their e‐mail addresses at the end of the survey to become eligible for a drawing for a $100 gift card, but were informed that their e‐mail addresses would not be included in the analytic dataset. Inpatients were not offered any incentives to participate. All surveys were administered by a survey monitor in paper form between May 2011 and July 2012.
Data Analysis
Data analysis was conducted using the Statistical Analysis Software (SAS) package (SAS Institute Inc., Cary, NC) and Stata (StataCorp, College Station, TX). Descriptive analysis and frequency distributions were tallied for all responses. Responses to protocol lapses were grouped into 3 categories: feedback, public reporting, and penalty as described above. As all surveyed groups endorsed feedback as an appropriate response to all of the scenarios, we did not examine feedback, concentrating our analysis instead on public reporting and penalties.
Appropriateness ratings for each response to each protocol lapse were aggregated in 2 ways: ever appropriate (ie, the response would be appropriate after some number of documented lapses) versus never appropriate, and the threshold for the response. Whereas public reporting was only asked about as a single option, 3 separate responses were collapsed into the single response, penalties: fine, suspension, or firing. Individuals were classified as endorsing a penalty if they rated any 1 of these responses as ever appropriate. The threshold for penalty was the smallest number of occurrences at which 1 of the penalty responses was endorsed.
Differences among the 5 groups in the perceived harm of each protocol lapse were tested with 2 analyses. Group differences in ratings of whether public reporting and penalties were ever appropriate were tested with logistic regression analyses for each scenario separately, controlling for age, sex, and perceived harm of the protocol lapse. To determine if the 5 groups differed in their tendency to support public reporting or penalties regardless of the type of protocol lapse, we conducted logistic regression analyses across all 3 scenarios, accounting for multiple observations per individual through use of cluster‐correlated robust variance.[14] Differences among groups in the number of transgressions at which public reporting and penalties were supported were examined with log‐rank tests.
RESULTS
A total of 287 individuals were given surveys, and 183 completed them: 22 attending physicians, 33 resident physicians, 61 nurses, 47 medical students, and 20 patients (overall response rate 64%). Response rate for attending and resident physicians was 73%, for nurses 59%, and for medical students 54%. Among patients who were approached and agreed to accept a survey, 87% returned completed surveys (Table 1). The average age of attending physicians was 35.8 years (standard deviation [SD]: 5.3), residents was 28.3 years (SD: 1.7), nurses was 43.6 years (SD: 11.1), medical students was 26.6 years (SD: 2.9), and inpatients was 48.2 years (SD: 15.9). Thirty‐two percent of attending physicians were female, 67% of resident physicians were female, 88% of nurses were female, 66% of medical students were female, and 47% of inpatients were female.
| Attending Physician | Resident Physician | Nurse | Medical Student | Patient | |
|---|---|---|---|---|---|
| |||||
| No. | 22 | 33 | 61 | 47 | 20 |
| Response rate* | 73% | 73% | 59% | 54% | 87% |
| Age, y, meanSD | 365 | 282 | 4411 | 273 | 4816 |
| Sex, female, % (n) | 32% (7) | 67% (22) | 88% (53) | 66% (31) | 47% (9) |
Perceived Harm
Out of the 3 scenarios presented in in the survey, participants believed that not conducting preoperative time‐outs in surgery presented the highest risk to patient safety, with 57% (residents) to 86% (nurses) rating the potential harm as high (Figure 1). Not conducting fall risk assessments was perceived as second most potentially harmful, and not properly practicing hand hygiene was perceived as least potentially harmful to patient safety. There were significant differences among groups in perceptions of potential harm for all 3 scenarios (P<0.001 for all).

Appropriateness of Public Reporting and Penalties
Public reporting was viewed as ever appropriate by 34% of all respondents for hand‐hygiene protocol lapses, 58% for surgical time‐out lapses, and 43% for fall risk assessment lapses. There were no significant differences among groups in endorsement of public reporting for individual scenarios (Figure 2). Penalties were endorsed more frequently than public reporting for all groups and all scenarios. The proportion of attending physicians and patients who rated penalties as ever appropriate were similar for each scenario. Residents, medical students, and nurses were less likely than patients and attending physicians to support penalties (P<0.05 for all differences).
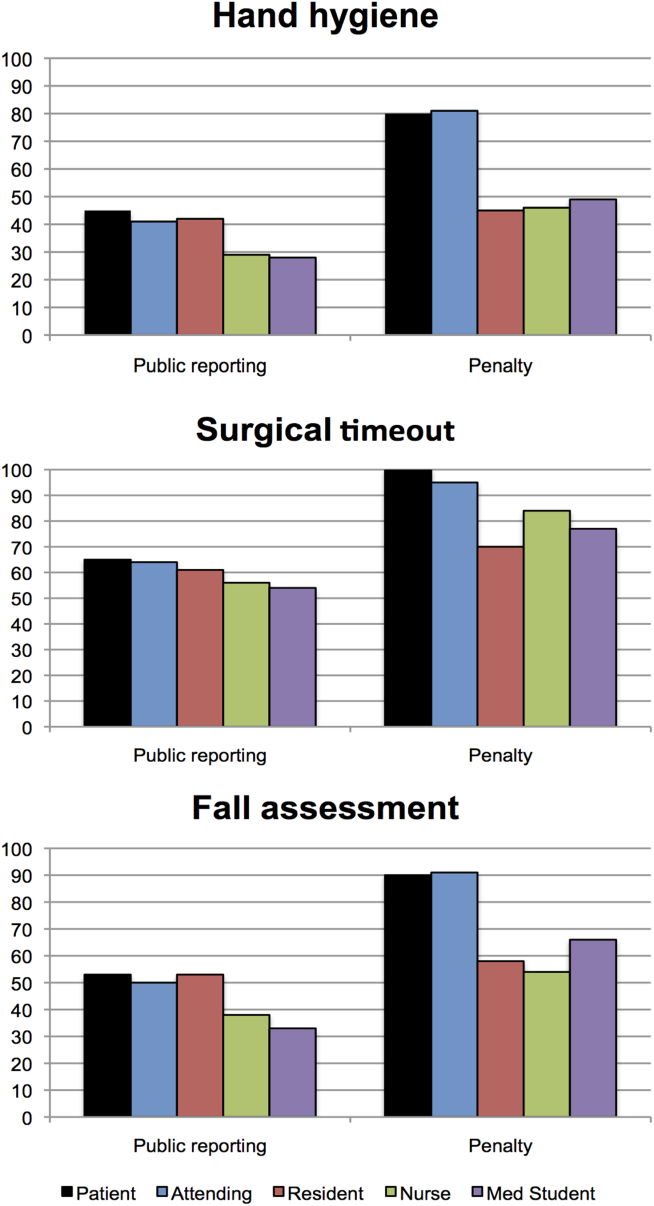
The aggregated analysis revealed that nurses and medical students were significantly less likely than patients to endorse public reporting across scenarios. In terms of endorsement of penalties, we found no significant differences between attending physicians and patients, but residents (odds ratio [OR]: 0.09, 95% confidence interval [CI]: 0.03‐0.32), students (OR: 0.12, 95% CI: 0.04‐0.34), and nurses (OR: 0.17, 95% CI: 0.03‐0.41) had significantly lower odds of favoring penalties than did patients (Table 2).
| Odds Ratio (95% CI) | ||
|---|---|---|
| Public Reporting | Penalty | |
| ||
| Group, across all scenarios | ||
| Patients | Reference | Reference |
| Attending physicians | 0.58 (0.172.01) | 0.88 (0.203.84) |
| Resident physicians | 0.42 (0.121.52) | 0.09 (0.020.32) |
| Nurses | 0.32 (0.120.88) | 0.17 (0.030.41) |
| Medical students | 0.22 (0.060.80) | 0.12 (0.040.34) |
| Scenario, across all groups | ||
| Hand hygiene | Reference | Reference |
| Surgical time‐out | 2.82 (2.033.91) | 4.29 (2.976.20) |
| Fall assessment | 1.47 (1.091.98) | 1.74 (1.272.37) |
Across all surveyed groups, public reporting was more often supported for lapses of surgical timeout (OR: 2.82, 95% CI: 2.03‐3.91) and fall risk assessment protocols (OR: 1.47, 95% CI: 1.09‐1.98) than for the referent, hand‐hygiene lapses. Across all groups, penalties were more likely to be supported for surgical timeout (OR: 4.29, 95% CI: 2.97‐6.20) and fall risk assessment protocol lapses (OR: 1.74, 95% CI: 1.27‐2.37) than for hand‐hygiene lapses.
Thresholds for Public Reporting and Penalties
The log‐rank test showed no significant differences among the surveyed groups in the number of transgressions at which public reporting was deemed appropriate in any of the 3 scenarios (P=0.37, P=0.71, and P=0.32 for hand hygiene, surgical time‐out, and fall risk assessment, respectively) (Figure 3). However, patients endorsed penalties after significantly fewer occurrences than residents, medical students, and nurses for all 3 scenarios (P<0.001 for all differences), and at a significantly lower threshold than attending physicians for surgical timeout and fall risk assessment (P<0.001 and P=0.03, respectively).
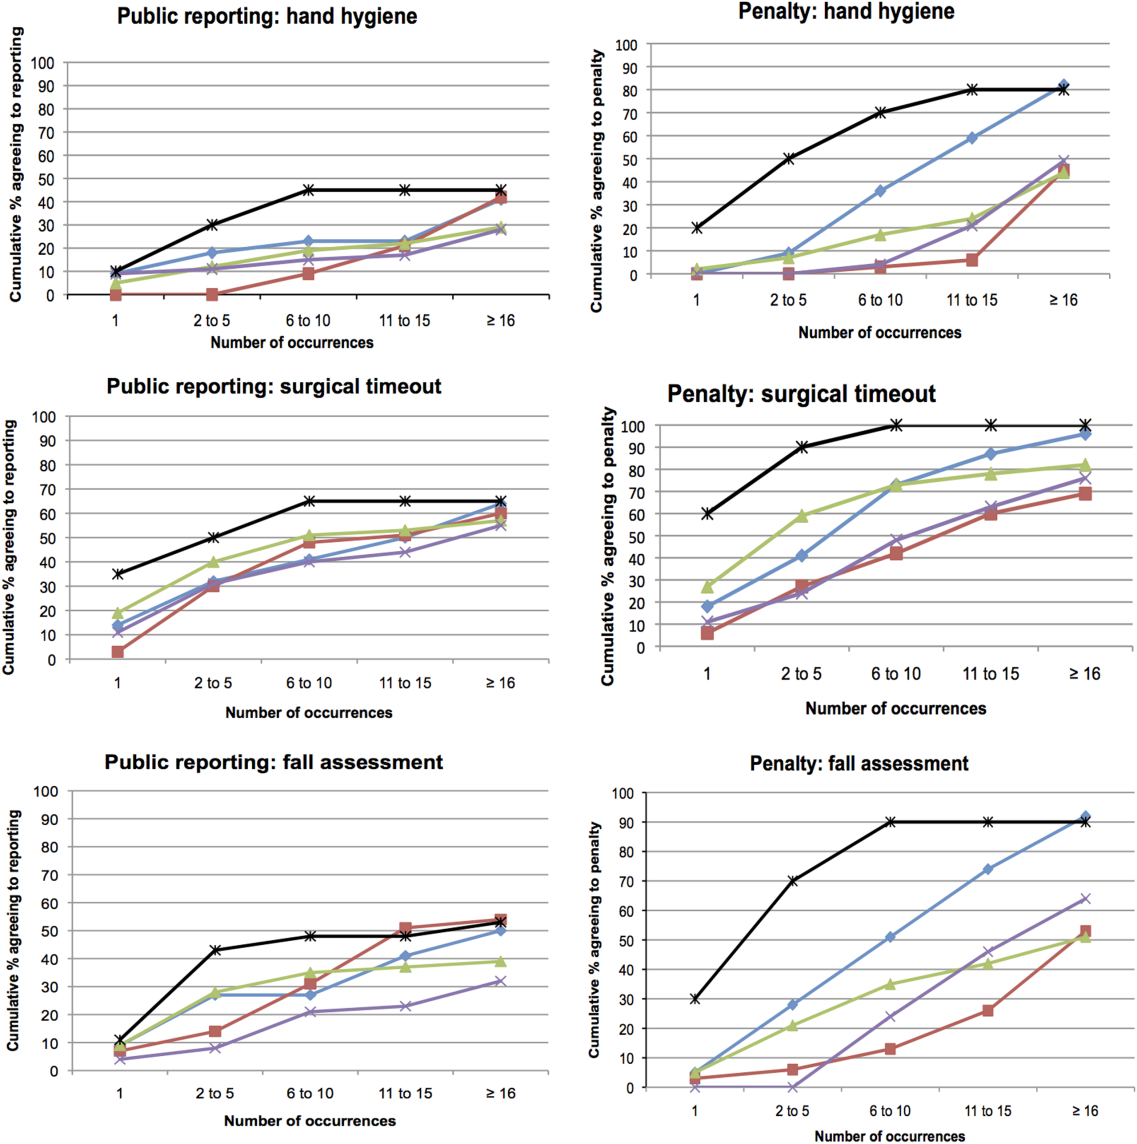
DISCUSSION
This survey assessed attitudes of healthcare professionals, trainees, and inpatients toward public reporting and penalties when clinicians do not follow basic safety protocols. Respondents tended to favor more aggressive measures when they deemed the safety risk from protocol violations to be higher. Almost all participants favored providing feedback after safety protocol lapses. Healthcare professionals tended to favor punitive measures, such as fines, suspension, and firing, more than public reporting of transgressions. Patients had a lower threshold than both providers and trainees for public reporting and punitive measures. In aggregate, our study suggests that after a decade of emphasis on a no‐blame response to patient safety hazards, both healthcare providers and patients now believe clinicians should be held accountable for following basic safety protocols, though their thresholds and triggers vary.
A surprising finding was that providers were more likely to favor penalties (such as fines, suspension, or firing) than public reporting of safety transgressions. Multiple studies have suggested that public reporting of hospital quality data has improved adherence to care processes and may improve patient outcomes.[15, 16, 17] Although our data do not tell us why clinicians appear to be more worried about public reporting than penalties, they do help explain why transparency has been a relatively powerful strategy to motivate changes in practice, even when it is unaccompanied by significant shifts in consumer choices.[18] It would be natural to consider public reporting to be a softer strategy than fines, suspension, or firing; however, our results indicate that many clinicians do not see it that way. Alternatively, the results could also suggest that clinicians prefer measures that provide more immediate feedback than public reporting generally provides. These attitudes should be considered when enacting public reporting strategies.
Another interesting finding was that patients and attending physicians tended to track together regarding their attitudes toward penalties for safety lapses. Although patients had a lower threshold for favoring penalties than attendings, similar proportions of patients and attending physicians believed that penalties should be enacted for safety transgressions, and both groups were more penal than physician trainees and nurses. We speculate that attendings and patients may have the most skin in the game, patients as the ones directly harmed by a preventable adverse event, and attending physicians as the most responsible clinicians, at least in the eyes of the malpractice system, licensing boards, and credentials committees.
Even though our study illustrates relatively high levels of endorsement for aggressive measures to deal with clinicians who fail to follow evidence‐based safety practices, a shift in this direction has risks and benefits. The no‐blame paradigm in patient safety grew out of a need to encourage open discussion about medical mistakes.[2] Whereas shifting away from a purely no‐ blame approach may lead to greater adherence with safety practices, and one hopes fewer cases of preventable harm, it also risks stifling the open discussions about medical errors that characterize learning organizations.[13, 19] Because of this, a movement in this direction should be undertaken carefully, starting first with a small number of well‐established safety practices, and ensuring that robust education and system improvements precede and accompany the imposition of penalties for nonadherence.
Our study has limitations. The survey was developed using convenience samples of UCSF faculty and medical students, so broader inclusion of physicians, nurses, trainees, and patients may have yielded a different survey instrument. As a survey, we cannot be certain that any of the groups' responses in real life (eg, in a vote of the medical staff on a given policy) would mirror their survey response. Additionally, the responses to protocol lapses did not include all possible administrative responses, such as mandatory training/remediation or rewards for positive behaviors. The responses could have also been different if participants were presented with different patient safety scenarios. The study population was limited in several ways. Attending and resident physicians were drawn from an academic department of internal medicine; it is possible that other specialties would have different attitudes. Patients were relatively young (likely due to the inclusion criteria), as were attending physicians (due to oversampling of hospitalist physicians). The relatively small number of participants could also limit statistical power to detect differences among groups. Additionally, the study population was limited to patients and healthcare professionals in academic medical centers in San Francisco. It is possible that attitudes would be different in other regions and practice settings.
The no‐blame approach to patient safety has been crucial in refocusing the lens on systems failures and in encouraging the active engagement by clinicians, particularly physicians.[2, 3] On the other hand, there are legitimate concerns that a unidimensional no‐blame approach has permitted, perhaps even promoted, nonadherence to evidence‐based safety practices that could prevent many cases of harm. Although it may not be surprising that patients favor harsher consequences for providers who do not follow basic safety protocols, our study demonstrates relatively widespread support for such consequences even among clinicians and trainees. However, all groups appear to recognize the nuances underlying this set of issues, with varying levels of enthusiasm for punitive responses based on perceived risk and number of transgressions. Future studies are needed to investigate how best to implement public reporting and penalties in ways that can maximize the patient safety benefits.
Acknowledgements
The authors are grateful to the clinicians, trainees, and patients who participated in the survey.
- . Understanding Patient Safety. 2nd ed. New York, NY: McGraw Hill Medical; 2012.
- . Error in medicine. JAMA. 1994;272(23):1851–1857.
- , . Balancing "no blame" with accountability in patient safety. N Engl J Med. 2009;361(14):1401–1406.
- , , , . Accountability measures—using measurement to promote quality improvement. N Engl J Med. 2010;363(7):683–688.
- , . Problem doctors: is there a system‐level solution? Ann Intern Med. 2006;144(2):107–115.
- , , , et al. A surgical safety checklist to reduce morbidity and mortality in a global population. N Engl J Med. 2009;360(5):491–499.
- , , , , . Effectiveness of a comprehensive hand hygiene program for reduction of infection rates in a long‐term care facility. Am J Infect Control. 2013;41(1):39–44.
- , . Impact of a hospital‐wide hand hygiene promotion strategy on healthcare‐associated infections. Antimicrob Resist Infect Control. 2012;1(1):13.
- , , , et al. Determinants of hand hygiene noncompliance in intensive care units. Am J Infect Control. 2013;41(2):131–135.
- , , , , , . Impact of a hospital‐wide hand hygiene initiative on healthcare‐associated infections: results of an interrupted time series. BMJ Qual Saf. 2012;21(12):1019–1026.
- , , , . Effectiveness of multifaceted hand hygiene interventions in long‐term care facilities in Hong Kong: a cluster‐randomized controlled trial. Infect Control Hosp Epidemiol. 2012;33(8):761–767.
- , , , , . Development, implementation, and evaluation of a comprehensive fall risk program. J Spec Pediatr Nurs 2011;16(2):130–139.
- , , , . A systematic review of the effectiveness, compliance, and critical factors for implementation of safety checklists in surgery. Ann Surg. 2012;256(6):925–933.
- . A note on robust variance estimation for cluster‐correlated data. Biometrics. 2000;56(2):645–646.
- , , , et al. Public reporting and pay for performance in hospital quality improvement. N Engl J Med. 2007;356(5):486–496.
- , , , , . Improving the outcomes of coronary artery bypass surgery in New York State. JAMA. 1994;271(10):761–766.
- , , . Declines in hospital mortality associated with a regional initiative to measure hospital performance. Am J Med Qual. 1997;12(2):103–112.
- , , , . The public release of performance data: what do we expect to gain? A review of the evidence. JAMA. 2000;283(14):1866–1874.
- . Continuing education meets the learning organization: the challenge of a systems approach to patient safety. J Contin Educ Health Prof. 2000;20(4):197–207.
Healthcare delivery organizations are under increasing pressure to improve patient safety. The fundamental underpinning of efforts to improve safety has been the establishment of a no‐blame culture, one that focuses less on individual transgressions and more on system improvement.[1, 2] As evidence‐based practices to improve care have emerged, and the pressures to deliver tangible improvements in safety and quality have grown, providers, healthcare system leaders, and policymakers are struggling with how best to balance the need for accountability with this no‐blame paradigm.
In dealing with areas such as hand hygiene, where there is strong evidence for the value of the practice yet relatively poor adherence in many institutions, Wachter and Pronovost have argued that the scales need to tip more in the direction of accountability, including the imposition of penalties for clinicians who habitually fail to follow certain safety practices.[3] Although not obviating the critical importance of systems improvement, they argue that a failure to enforce such measures undermines trust in the system and invites external regulation. Chassin and colleagues made a similar point in arguing for the identification of certain accountability measures that could be used in public reporting and pay‐for‐performance programs.[4]
Few organizations have enacted robust systems to hold providers responsible for adhering to accountability measures.[4] Although many hospitals have policies to suspend clinical privileges for failing to sign discharge summaries or obtain a yearly purified protein derivative test, few have formal programs to identify and deal with clinicians whose behavior is persistently problematic.[3] Furthermore, existing modes of physician accountability, such as state licensing boards, only discipline physicians retroactively (and rarely) when healthcare organizations report poor performance. State boards typically do not consider prevention of injury, such as adherence to safety practices, to be part of their responsibility.[5] Similarly, credentialing boards (eg, the American Board of Internal Medicine) do not assess adherence to such practices in coming to their decisions.
It is estimated that strict adherence to infection control practices, such as hand hygiene, could prevent over 100,000 hospital deaths every year; adherence to other evidence‐based safety practices such as the use of a preoperative time‐out would likely prevent many more deaths and cases of medical injury.[3, 6] Although there are practical issues, such as how to audit individual clinician adherence in ways that are feasible and fair, that make enforcing individual provider accountability challenging, there seems little doubt that attitudes regarding the appropriateness of enacting penalties for safety transgressions will be key determinants of whether such measures are considered. Yet no study to date has assessed the opinions of different stakeholders (physicians, nurses, trainees, patients) regarding various strategies, including public reporting and penalties, to improve adherence to safety practices. We aimed to assess these attitudes across a variety of such stakeholders.
METHODS
Survey Development and Characteristics
To understand the perceptions of measures designed to improve patient safety, we designed a survey of patients, nurses, medical students, resident physicians, and attending physicians to be administered at hospitals associated with the University of California, San Francisco (UCSF). Institutional review board approval was obtained from the UCSF Committee on Human Research, and all respondents provided informed consent.
The survey was developed by the authors and pilot tested with 2 populations. First, the survey was administered to a group of 12 UCSF Division of Hospital Medicine research faculty; their feedback was used to revise the survey. Second, the survey was administered to a convenience sample of 2 UCSF medical students, and their feedback was used to further refine the survey.
The questionnaire presented 3 scenarios in which a healthcare provider committed a patient‐safety protocol lapse; participants were asked their opinions about the appropriate responses to each of the violations. The 3 scenarios were: (1) a healthcare provider not properly conducting hand hygiene before a patient encounter, (2) a healthcare provider not properly conducting a fall risk assessment on a hospitalized patient, and (3) a healthcare provider not properly conducting a preoperative timeout prior to surgery. For each scenario, a series of questions was asked about a variety of institutional responses toward a provider who did not adhere to each safety protocol. Potential responses included feedback (email feedback, verbal feedback, meeting with a supervisor, a quarterly performance review meeting, and a quarterly report card seen only by the provider), public reporting (posting the provider's infractions on a public website), and penalties (fines, suspension without pay, and firing).
We chose the 3 practices because they are backed by strong evidence, are relatively easy to perform, are inexpensive, are linked to important and common harms, and are generally supported within the patient‐safety community. Improved adherence to hand hygiene significantly reduces infection transmission in healthcare settings.[7, 8, 9, 10, 11] Performing fall risk assessments has been shown to reduce falls in hospitalized patients,[12] and using preoperative checklists, including a surgical time‐out, can reduce mortality and complication risks by approximately 40%.[13]
Respondents were asked how many cases of documented nonadherence would be necessary for the penalties to be appropriate (1 time, 25 times, 610 times, 1115 times, 16+ times, or would never be appropriate). Finally, respondents were asked to rate the potential harm to patients of each protocol lapse (nonelow, medium, or high).
Demographic information collected from the healthcare providers and medical students included age, gender, position, department, and years' experience in their current position. Demographic information collected from the patients included age, gender, insurance status, race, education level, household income level, and relationship status.
Survey Administration
Surveys were administered to convenience samples of 5 groups of individuals: attending physicians in the UCSF Department of Internal Medicine based at UCSF Medical Center and the San Francisco Veterans Affairs Medical Center, nurses at UCSF Medical Center, residents in the UCSF internal medicine residency program, medical students at UCSF, and inpatients in the internal medicine service at UCSF Medical Center's Moffitt‐Long Hospital. Attending physicians and nurses were surveyed at their respective departmental meetings. For resident physicians and medical students, surveys were distributed at the beginning of lectures and collected at the end.
Patients were eligible to participate if they spoke English and were noted to be alert and oriented to person, time, and place. A survey administrator located eligible patients in the internal medicine service via the electronic medical record system, determined if they were alert and oriented, and approached each patient in his or her room. If the patients verbally consented to consider participation, the surveys were given to them and retrieved after approximately 30 minutes.
Healthcare professionals were offered the opportunity to enter their e‐mail addresses at the end of the survey to become eligible for a drawing for a $100 gift card, but were informed that their e‐mail addresses would not be included in the analytic dataset. Inpatients were not offered any incentives to participate. All surveys were administered by a survey monitor in paper form between May 2011 and July 2012.
Data Analysis
Data analysis was conducted using the Statistical Analysis Software (SAS) package (SAS Institute Inc., Cary, NC) and Stata (StataCorp, College Station, TX). Descriptive analysis and frequency distributions were tallied for all responses. Responses to protocol lapses were grouped into 3 categories: feedback, public reporting, and penalty as described above. As all surveyed groups endorsed feedback as an appropriate response to all of the scenarios, we did not examine feedback, concentrating our analysis instead on public reporting and penalties.
Appropriateness ratings for each response to each protocol lapse were aggregated in 2 ways: ever appropriate (ie, the response would be appropriate after some number of documented lapses) versus never appropriate, and the threshold for the response. Whereas public reporting was only asked about as a single option, 3 separate responses were collapsed into the single response, penalties: fine, suspension, or firing. Individuals were classified as endorsing a penalty if they rated any 1 of these responses as ever appropriate. The threshold for penalty was the smallest number of occurrences at which 1 of the penalty responses was endorsed.
Differences among the 5 groups in the perceived harm of each protocol lapse were tested with 2 analyses. Group differences in ratings of whether public reporting and penalties were ever appropriate were tested with logistic regression analyses for each scenario separately, controlling for age, sex, and perceived harm of the protocol lapse. To determine if the 5 groups differed in their tendency to support public reporting or penalties regardless of the type of protocol lapse, we conducted logistic regression analyses across all 3 scenarios, accounting for multiple observations per individual through use of cluster‐correlated robust variance.[14] Differences among groups in the number of transgressions at which public reporting and penalties were supported were examined with log‐rank tests.
RESULTS
A total of 287 individuals were given surveys, and 183 completed them: 22 attending physicians, 33 resident physicians, 61 nurses, 47 medical students, and 20 patients (overall response rate 64%). Response rate for attending and resident physicians was 73%, for nurses 59%, and for medical students 54%. Among patients who were approached and agreed to accept a survey, 87% returned completed surveys (Table 1). The average age of attending physicians was 35.8 years (standard deviation [SD]: 5.3), residents was 28.3 years (SD: 1.7), nurses was 43.6 years (SD: 11.1), medical students was 26.6 years (SD: 2.9), and inpatients was 48.2 years (SD: 15.9). Thirty‐two percent of attending physicians were female, 67% of resident physicians were female, 88% of nurses were female, 66% of medical students were female, and 47% of inpatients were female.
| Attending Physician | Resident Physician | Nurse | Medical Student | Patient | |
|---|---|---|---|---|---|
| |||||
| No. | 22 | 33 | 61 | 47 | 20 |
| Response rate* | 73% | 73% | 59% | 54% | 87% |
| Age, y, meanSD | 365 | 282 | 4411 | 273 | 4816 |
| Sex, female, % (n) | 32% (7) | 67% (22) | 88% (53) | 66% (31) | 47% (9) |
Perceived Harm
Out of the 3 scenarios presented in in the survey, participants believed that not conducting preoperative time‐outs in surgery presented the highest risk to patient safety, with 57% (residents) to 86% (nurses) rating the potential harm as high (Figure 1). Not conducting fall risk assessments was perceived as second most potentially harmful, and not properly practicing hand hygiene was perceived as least potentially harmful to patient safety. There were significant differences among groups in perceptions of potential harm for all 3 scenarios (P<0.001 for all).
Appropriateness of Public Reporting and Penalties
Public reporting was viewed as ever appropriate by 34% of all respondents for hand‐hygiene protocol lapses, 58% for surgical time‐out lapses, and 43% for fall risk assessment lapses. There were no significant differences among groups in endorsement of public reporting for individual scenarios (Figure 2). Penalties were endorsed more frequently than public reporting for all groups and all scenarios. The proportion of attending physicians and patients who rated penalties as ever appropriate were similar for each scenario. Residents, medical students, and nurses were less likely than patients and attending physicians to support penalties (P<0.05 for all differences).
The aggregated analysis revealed that nurses and medical students were significantly less likely than patients to endorse public reporting across scenarios. In terms of endorsement of penalties, we found no significant differences between attending physicians and patients, but residents (odds ratio [OR]: 0.09, 95% confidence interval [CI]: 0.03‐0.32), students (OR: 0.12, 95% CI: 0.04‐0.34), and nurses (OR: 0.17, 95% CI: 0.03‐0.41) had significantly lower odds of favoring penalties than did patients (Table 2).
| Odds Ratio (95% CI) | ||
|---|---|---|
| Public Reporting | Penalty | |
| ||
| Group, across all scenarios | ||
| Patients | Reference | Reference |
| Attending physicians | 0.58 (0.172.01) | 0.88 (0.203.84) |
| Resident physicians | 0.42 (0.121.52) | 0.09 (0.020.32) |
| Nurses | 0.32 (0.120.88) | 0.17 (0.030.41) |
| Medical students | 0.22 (0.060.80) | 0.12 (0.040.34) |
| Scenario, across all groups | ||
| Hand hygiene | Reference | Reference |
| Surgical time‐out | 2.82 (2.033.91) | 4.29 (2.976.20) |
| Fall assessment | 1.47 (1.091.98) | 1.74 (1.272.37) |
Across all surveyed groups, public reporting was more often supported for lapses of surgical timeout (OR: 2.82, 95% CI: 2.03‐3.91) and fall risk assessment protocols (OR: 1.47, 95% CI: 1.09‐1.98) than for the referent, hand‐hygiene lapses. Across all groups, penalties were more likely to be supported for surgical timeout (OR: 4.29, 95% CI: 2.97‐6.20) and fall risk assessment protocol lapses (OR: 1.74, 95% CI: 1.27‐2.37) than for hand‐hygiene lapses.
Thresholds for Public Reporting and Penalties
The log‐rank test showed no significant differences among the surveyed groups in the number of transgressions at which public reporting was deemed appropriate in any of the 3 scenarios (P=0.37, P=0.71, and P=0.32 for hand hygiene, surgical time‐out, and fall risk assessment, respectively) (Figure 3). However, patients endorsed penalties after significantly fewer occurrences than residents, medical students, and nurses for all 3 scenarios (P<0.001 for all differences), and at a significantly lower threshold than attending physicians for surgical timeout and fall risk assessment (P<0.001 and P=0.03, respectively).
DISCUSSION
This survey assessed attitudes of healthcare professionals, trainees, and inpatients toward public reporting and penalties when clinicians do not follow basic safety protocols. Respondents tended to favor more aggressive measures when they deemed the safety risk from protocol violations to be higher. Almost all participants favored providing feedback after safety protocol lapses. Healthcare professionals tended to favor punitive measures, such as fines, suspension, and firing, more than public reporting of transgressions. Patients had a lower threshold than both providers and trainees for public reporting and punitive measures. In aggregate, our study suggests that after a decade of emphasis on a no‐blame response to patient safety hazards, both healthcare providers and patients now believe clinicians should be held accountable for following basic safety protocols, though their thresholds and triggers vary.
A surprising finding was that providers were more likely to favor penalties (such as fines, suspension, or firing) than public reporting of safety transgressions. Multiple studies have suggested that public reporting of hospital quality data has improved adherence to care processes and may improve patient outcomes.[15, 16, 17] Although our data do not tell us why clinicians appear to be more worried about public reporting than penalties, they do help explain why transparency has been a relatively powerful strategy to motivate changes in practice, even when it is unaccompanied by significant shifts in consumer choices.[18] It would be natural to consider public reporting to be a softer strategy than fines, suspension, or firing; however, our results indicate that many clinicians do not see it that way. Alternatively, the results could also suggest that clinicians prefer measures that provide more immediate feedback than public reporting generally provides. These attitudes should be considered when enacting public reporting strategies.
Another interesting finding was that patients and attending physicians tended to track together regarding their attitudes toward penalties for safety lapses. Although patients had a lower threshold for favoring penalties than attendings, similar proportions of patients and attending physicians believed that penalties should be enacted for safety transgressions, and both groups were more penal than physician trainees and nurses. We speculate that attendings and patients may have the most skin in the game, patients as the ones directly harmed by a preventable adverse event, and attending physicians as the most responsible clinicians, at least in the eyes of the malpractice system, licensing boards, and credentials committees.
Even though our study illustrates relatively high levels of endorsement for aggressive measures to deal with clinicians who fail to follow evidence‐based safety practices, a shift in this direction has risks and benefits. The no‐blame paradigm in patient safety grew out of a need to encourage open discussion about medical mistakes.[2] Whereas shifting away from a purely no‐ blame approach may lead to greater adherence with safety practices, and one hopes fewer cases of preventable harm, it also risks stifling the open discussions about medical errors that characterize learning organizations.[13, 19] Because of this, a movement in this direction should be undertaken carefully, starting first with a small number of well‐established safety practices, and ensuring that robust education and system improvements precede and accompany the imposition of penalties for nonadherence.
Our study has limitations. The survey was developed using convenience samples of UCSF faculty and medical students, so broader inclusion of physicians, nurses, trainees, and patients may have yielded a different survey instrument. As a survey, we cannot be certain that any of the groups' responses in real life (eg, in a vote of the medical staff on a given policy) would mirror their survey response. Additionally, the responses to protocol lapses did not include all possible administrative responses, such as mandatory training/remediation or rewards for positive behaviors. The responses could have also been different if participants were presented with different patient safety scenarios. The study population was limited in several ways. Attending and resident physicians were drawn from an academic department of internal medicine; it is possible that other specialties would have different attitudes. Patients were relatively young (likely due to the inclusion criteria), as were attending physicians (due to oversampling of hospitalist physicians). The relatively small number of participants could also limit statistical power to detect differences among groups. Additionally, the study population was limited to patients and healthcare professionals in academic medical centers in San Francisco. It is possible that attitudes would be different in other regions and practice settings.
The no‐blame approach to patient safety has been crucial in refocusing the lens on systems failures and in encouraging the active engagement by clinicians, particularly physicians.[2, 3] On the other hand, there are legitimate concerns that a unidimensional no‐blame approach has permitted, perhaps even promoted, nonadherence to evidence‐based safety practices that could prevent many cases of harm. Although it may not be surprising that patients favor harsher consequences for providers who do not follow basic safety protocols, our study demonstrates relatively widespread support for such consequences even among clinicians and trainees. However, all groups appear to recognize the nuances underlying this set of issues, with varying levels of enthusiasm for punitive responses based on perceived risk and number of transgressions. Future studies are needed to investigate how best to implement public reporting and penalties in ways that can maximize the patient safety benefits.
Acknowledgements
The authors are grateful to the clinicians, trainees, and patients who participated in the survey.
- . Understanding Patient Safety. 2nd ed. New York, NY: McGraw Hill Medical; 2012.
- . Error in medicine. JAMA. 1994;272(23):1851–1857.
- , . Balancing "no blame" with accountability in patient safety. N Engl J Med. 2009;361(14):1401–1406.
- , , , . Accountability measures—using measurement to promote quality improvement. N Engl J Med. 2010;363(7):683–688.
- , . Problem doctors: is there a system‐level solution? Ann Intern Med. 2006;144(2):107–115.
- , , , et al. A surgical safety checklist to reduce morbidity and mortality in a global population. N Engl J Med. 2009;360(5):491–499.
- , , , , . Effectiveness of a comprehensive hand hygiene program for reduction of infection rates in a long‐term care facility. Am J Infect Control. 2013;41(1):39–44.
- , . Impact of a hospital‐wide hand hygiene promotion strategy on healthcare‐associated infections. Antimicrob Resist Infect Control. 2012;1(1):13.
- , , , et al. Determinants of hand hygiene noncompliance in intensive care units. Am J Infect Control. 2013;41(2):131–135.
- , , , , , . Impact of a hospital‐wide hand hygiene initiative on healthcare‐associated infections: results of an interrupted time series. BMJ Qual Saf. 2012;21(12):1019–1026.
- , , , . Effectiveness of multifaceted hand hygiene interventions in long‐term care facilities in Hong Kong: a cluster‐randomized controlled trial. Infect Control Hosp Epidemiol. 2012;33(8):761–767.
- , , , , . Development, implementation, and evaluation of a comprehensive fall risk program. J Spec Pediatr Nurs 2011;16(2):130–139.
- , , , . A systematic review of the effectiveness, compliance, and critical factors for implementation of safety checklists in surgery. Ann Surg. 2012;256(6):925–933.
- . A note on robust variance estimation for cluster‐correlated data. Biometrics. 2000;56(2):645–646.
- , , , et al. Public reporting and pay for performance in hospital quality improvement. N Engl J Med. 2007;356(5):486–496.
- , , , , . Improving the outcomes of coronary artery bypass surgery in New York State. JAMA. 1994;271(10):761–766.
- , , . Declines in hospital mortality associated with a regional initiative to measure hospital performance. Am J Med Qual. 1997;12(2):103–112.
- , , , . The public release of performance data: what do we expect to gain? A review of the evidence. JAMA. 2000;283(14):1866–1874.
- . Continuing education meets the learning organization: the challenge of a systems approach to patient safety. J Contin Educ Health Prof. 2000;20(4):197–207.
© 2013 Society of Hospital Medicine
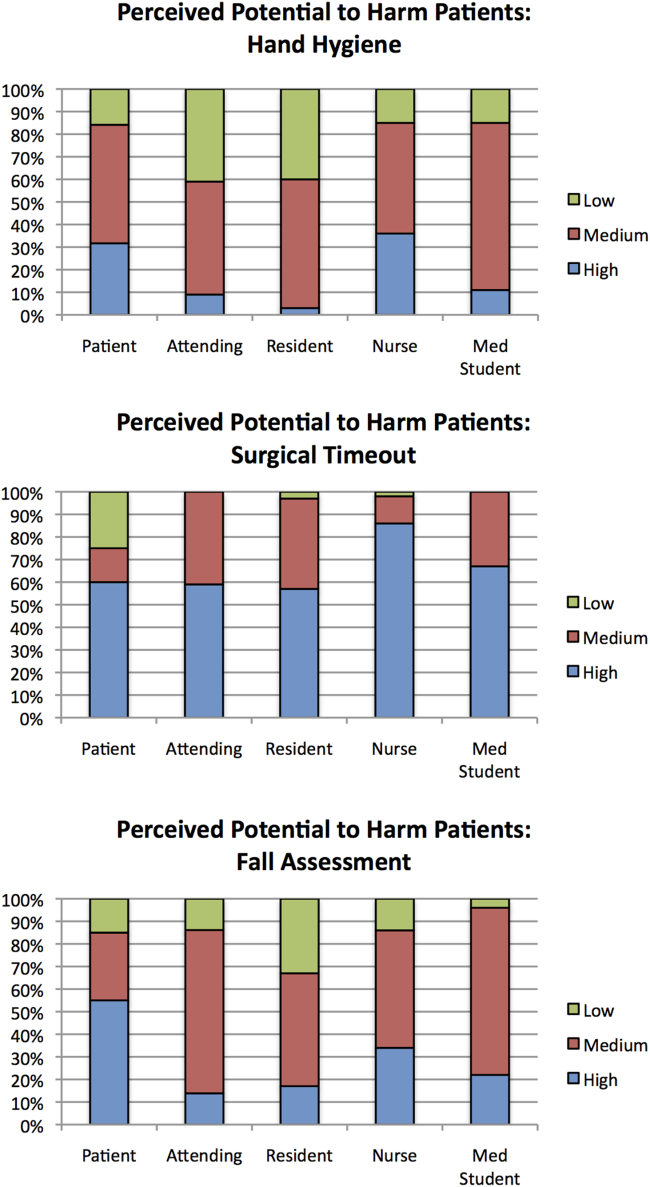
UCSF Hospitalist Mini‐College
I hear and I forget, I see and I remember, I do and I understand.
Confucius
Hospital medicine, first described in 1996,[1] is the fastest growing specialty in United States medical history, now with approximately 40,000 practitioners.[2] Although hospitalists undoubtedly learned many of their key clinical skills during residency training, there is no hospitalist‐specific residency training pathway and a limited number of largely research‐oriented fellowships.[3] Furthermore, hospitalists are often asked to care for surgical patients, those with acute neurologic disorders, and patients in intensive care units, while also contributing to quality improvement and patient safety initiatives.[4] This suggests that the vast majority of hospitalists have not had specific training in many key competencies for the field.[5]
Continuing medical education (CME) has traditionally been the mechanism to maintain, develop, or increase the knowledge, skills, and professional performance of physicians.[6] Most CME activities, including those for hospitalists, are staged as live events in hotel conference rooms or as local events in a similarly passive learning environment (eg, grand rounds and medical staff meetings). Online programs, audiotapes, and expanding electronic media provide increasing and alternate methods for hospitalists to obtain their required CME. All of these activities passively deliver content to a group of diverse and experienced learners. They fail to take advantage of adult learning principles and may have little direct impact on professional practice.[7, 8] Traditional CME is often derided as a barrier to innovative educational methods for these reasons, as adults learn best through active participation, when the information is relevant and practically applied.[9, 10]
To provide practicing hospitalists with necessary continuing education, we designed the University of California, San Francisco (UCSF) Hospitalist Mini‐College (UHMC). This 3‐day course brings adult learners to the bedside for small‐group and active learning focused on content areas relevant to today's hospitalists. We describe the development, content, outcomes, and lessons learned from UHMC's first 5 years.
METHODS
Program Development
We aimed to develop a program that focused on curricular topics that would be highly valued by practicing hospitalists delivered in an active learning small‐group environment. We first conducted an informal needs assessment of community‐based hospitalists to better understand their roles and determine their perceptions of gaps in hospitalist training compared to current requirements for practice. We then reviewed available CME events targeting hospitalists and compared these curricula to the gaps discovered from the needs assessment. We also reviewed the Society of Hospital Medicine's core competencies to further identify gaps in scope of practice.[4] Finally, we reviewed the literature to identify CME curricular innovations in the clinical setting and found no published reports.
Program Setting, Participants, and Faculty
The UHMC course was developed and offered first in 2008 as a precourse to the UCSF Management of the Hospitalized Medicine course, a traditional CME offering that occurs annually in a hotel setting.[11] The UHMC takes place on the campus of UCSF Medical Center, a 600‐bed academic medical center in San Francisco. Registered participants were required to complete limited credentialing paperwork, which allowed them to directly observe clinical care and interact with hospitalized patients. Participants were not involved in any clinical decision making for the patients they met or examined. The course was limited to a maximum of 33 participants annually to optimize active participation, small‐group bedside activities, and a personalized learning experience. UCSF faculty selected to teach in the UHMC were chosen based on exemplary clinical and teaching skills. They collaborated with course directors in the development of their session‐specific goals and curriculum.
Program Description
Figure 1 is a representative calendar view of the 3‐day UHMC course. The curricular topics were selected based on the findings from our needs assessment, our ability to deliver that curriculum using our small‐group active learning framework, and to minimize overlap with content of the larger course. Course curriculum was refined annually based on participant feedback and course director observations.
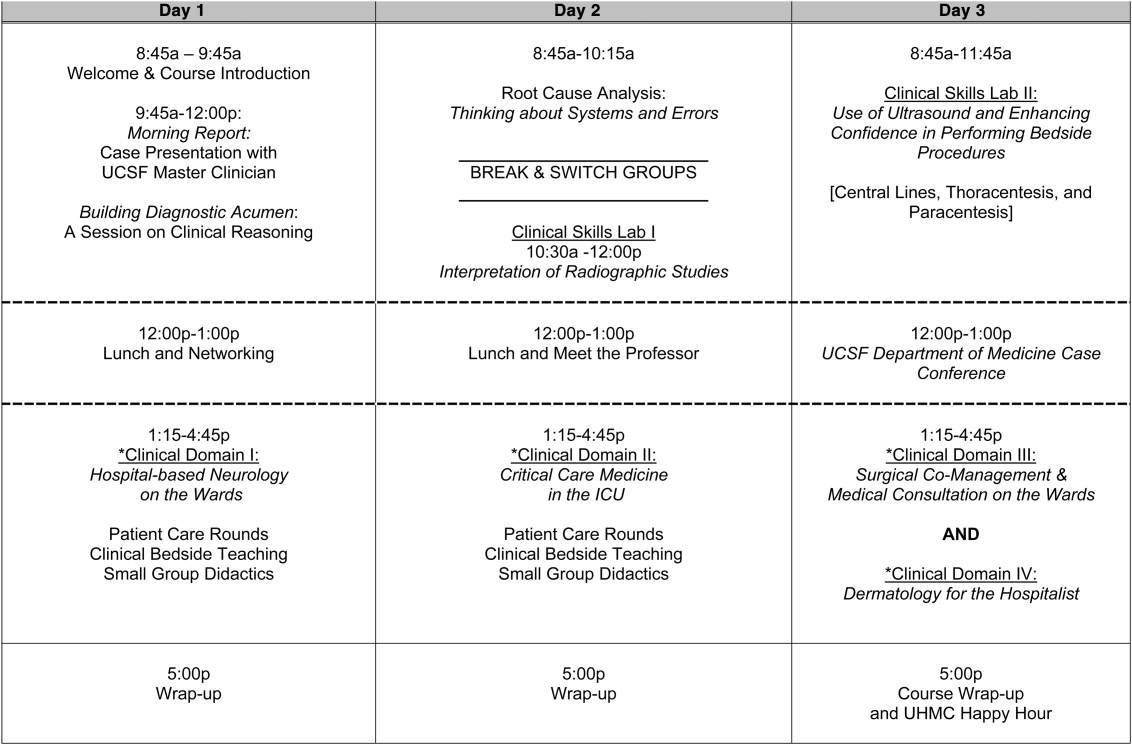
The program was built on a structure of 4 clinical domains and 2 clinical skills labs. The clinical domains included: (1) Hospital‐Based Neurology, (2) Critical Care Medicine in the Intensive Care Unit, (3) Surgical Comanagement and Medical Consultation, and (4) Hospital‐Based Dermatology. Participants were divided into 3 groups of 10 participants each and rotated through each domain in the afternoons. The clinical skills labs included: (1) Interpretation of Radiographic Studies and (2) Use of Ultrasound and Enhancing Confidence in Performing Bedside Procedures. We also developed specific sessions to teach about patient safety and to allow course attendees to participate in traditional academic learning vehicles (eg, a Morning Report and Morbidity and Mortality case conference). Below, we describe each session's format and content.
Clinical Domains
Hospital‐Based Neurology
Attendees participated in both bedside evaluation and case‐based discussions of common neurologic conditions seen in the hospital. In small groups of 5, participants were assigned patients to examine on the neurology ward. After their evaluations, they reported their findings to fellow participants and the faculty, setting the foundation for discussion of clinical management, review of neuroimaging, and exploration of current evidence to inform the patient's diagnosis and management. Participants and faculty then returned to the bedside to hone neurologic examination skills and complete the learning process. Given the unpredictability of what conditions would be represented on the ward in a given day, review of commonly seen conditions was always a focus, such as stroke, seizures, delirium, and neurologic examination pearls.
Critical Care
Attendees participated in case‐based discussions of common clinical conditions with similar review of current evidence, relevant imaging, and bedside exam pearls for the intubated patient. For this domain, attendees also participated in an advanced simulation tutorial in ventilator management, which was then applied at the bedside of intubated patients. Specific topics covered include sepsis, decompensated chronic obstructive lung disease, vasopressor selection, novel therapies in critically ill patients, and use of clinical pathways and protocols for improved quality of care.
Surgical Comanagement and Medical Consultation
Attendees participated in case‐based discussions applying current evidence to perioperative controversies and the care of the surgical patient. They also discussed the expanding role of the hospitalist in nonmedical patients.
Hospital‐Based Dermatology
Attendees participated in bedside evaluation of acute skin eruptions based on available patients admitted to the hospital. They discussed the approach to skin eruptions, key diagnoses, and when dermatologists should be consulted for their expertise. Specific topics included drug reactions, the red leg, life‐threating conditions (eg, Stevens‐Johnson syndrome), and dermatologic examination pearls. This domain was added in 2010.
Clinical Skills Labs
Radiology
In groups of 15, attendees reviewed common radiographs that hospitalists frequently order or evaluate (eg, chest x‐rays; kidney, ureter, and bladder; placement of endotracheal or feeding tube). They also reviewed the most relevant and not‐to‐miss findings on other commonly ordered studies such as abdominal or brain computerized tomography scans.
Hospital Procedures With Bedside Ultrasound
Attendees participated in a half‐day session to gain experience with the following procedures: paracentesis, lumbar puncture, thoracentesis, and central lines. They participated in an initial overview of procedural safety followed by hands‐on application sessions, in which they rotated through clinical workstations in groups of 5. At each work station, they were provided an opportunity to practice techniques, including the safe use of ultrasound on both live (standardized patients) and simulation models.
Other Sessions
Building Diagnostic Acumen and Clinical Reasoning
The opening session of the UHMC reintroduces attendees to the traditional academic morning report format, in which a case is presented and participants are asked to assess the information, develop differential diagnoses, discuss management options, and consider their own clinical reasoning skills. This provides frameworks for diagnostic reasoning, highlights common cognitive errors, and teaches attendees how to develop expertise in their own diagnostic thinking. The session also sets the stage and expectation for active learning and participation in the UHMC.
Root Cause Analysis and Systems Thinking
As the only nonclinical session in the UHMC, this session introduces participants to systems thinking and patient safety. Attendees participate in a root cause analysis role play surrounding a serious medical error and discuss the implications, their reflections, and then propose solutions through interactive table discussions. The session also emphasizes the key role hospitalists should play in improving patient safety.
Clinical Case Conference
Attendees participated in the weekly UCSF Department of Medicine Morbidity and Mortality conference. This is a traditional case conference that brings together learners, expert discussants, and an interesting or challenging case. This allows attendees to synthesize much of the course learning through active participation in the case discussion. Rather than creating a new conference for the participants, we brought the participants to the existing conference as part of their UHMC immersion experience.
Meet the Professor
Attendees participated in an informal discussion with a national leader (R.M.W.) in hospital medicine. This allowed for an interactive exchange of ideas and an understanding of the field overall.
Online Search Strategies
This interactive computer lab session allowed participants to explore the ever‐expanding number of online resources to answer clinical queries. This session was replaced in 2010 with the dermatology clinical domain based on participant feedback.
Program Evaluation
Participants completed a pre‐UHMC survey that provided demographic information and attributes about themselves, their clinical practice, and experience. Participants also completed course evaluations consistent with Accreditation Council for Continuing Medical Education standards following the program. The questions asked for each activity were rated on a 1‐to‐5 scale (1=poor, 5=excellent) and also included open‐ended questions to assess overall experiences.
RESULTS
Participant Demographics
During the first 5 years of the UHMC, 152 participants enrolled and completed the program; 91% completed the pre‐UHMC survey and 89% completed the postcourse evaluation. Table 1 describes the self‐reported participant demographics, including years in practice, number of hospitalist jobs, overall job satisfaction, and time spent doing clinical work. Overall, 68% of all participants had been self‐described hospitalists for <4 years, with 62% holding only 1 hospitalist job during that time; 77% reported being pretty or very satisfied with their jobs, and 72% reported clinical care as the attribute they love most in their job. Table 2 highlights the type of work attendees participate in within their clinical practice. More than half manage patients with neurologic disorders and care for critically ill patients, whereas virtually all perform preoperative medical evaluations and medical consultation
| Question | Response Options | 2008 (n=4) | 2009 (n=26) | 2010 (n=29) | 2011 (n=31) | 2012 (n=28) | Average (n=138) |
|---|---|---|---|---|---|---|---|
| |||||||
| How long have you been a hospitalist? | <2 years | 52% | 35% | 37% | 30% | 25% | 36% |
| 24 years | 26% | 39% | 30% | 30% | 38% | 32% | |
| 510 years | 11% | 17% | 15% | 26% | 29% | 20% | |
| >10 years | 11% | 9% | 18% | 14% | 8% | 12% | |
| How many hospitalist jobs have you had? | 1 | 63% | 61% | 62% | 62% | 58% | 62% |
| 2 to 3 | 37% | 35% | 23% | 35% | 29% | 32% | |
| >3 | 0% | 4% | 15% | 1% | 13% | 5% | |
| How satisfied are you with your current position? | Not satisfied | 1% | 4% | 4% | 4% | 0% | 4% |
| Somewhat satisfied | 11% | 13% | 39% | 17% | 17% | 19% | |
| Pretty satisfied | 59% | 52% | 35% | 57% | 38% | 48% | |
| Very satisfied | 26% | 30% | 23% | 22% | 46% | 29% | |
| What do you love most about your job? | Clinical care | 85% | 61% | 65% | 84% | 67% | 72% |
| Teaching | 1% | 17% | 12% | 1% | 4% | 7% | |
| QI or safety work | 0% | 4% | 0% | 1% | 8% | 3% | |
| Other (not specified) | 14% | 18% | 23% | 14% | 21% | 18% | |
| What percent of your time is spent doing clinical care? | 100% | 39% | 36% | 52% | 46% | 58% | 46% |
| 75%100% | 58% | 50% | 37% | 42% | 33% | 44% | |
| 5075% | 0% | 9% | 11% | 12% | 4% | 7% | |
| 25%50% | 4% | 5% | 0% | 0% | 5% | 3% | |
| <25% | 0% | 0% | 0% | 0% | 0% | 0% | |
| Question | Response Options | 2008 (n=24) | 2009 (n=26) | 2010 (n=29) | 2011 (n=31) | 2012 (n=28) | Average(n=138) |
|---|---|---|---|---|---|---|---|
| |||||||
| Do you primarily manage patients with neurologic disorders in your hospital? | Yes | 62% | 50% | 62% | 62% | 63% | 60% |
| Do you primarily manage critically ill ICU patients in your hospital? | Yes and without an intensivist | 19% | 23% | 19% | 27% | 21% | 22% |
| Yes but with an intensivist | 54% | 50% | 44% | 42% | 67% | 51% | |
| No | 27% | 27% | 37% | 31% | 13% | 27% | |
| Do you perform preoperative medical evaluations and medical consultation? | Yes | 96% | 91% | 96% | 96% | 92% | 94% |
| Which of the following describes your role in the care of surgical patients? | Traditional medical consultant | 33% | 28% | 28% | 30% | 24% | 29% |
| Comanagement (shared responsibility with surgeon) | 33% | 34% | 42% | 39% | 35% | 37% | |
| Attending of record with surgeon acting as consultant | 26% | 24% | 26% | 30% | 35% | 28% | |
| Do you have bedside ultrasound available in your daily practice? | Yes | 38% | 32% | 52% | 34% | 38% | 39% |
Participant Experience
Overall, participants rated the quality of the UHMC course highly (4.65; 15 scale). The neurology clinical domain (4.83) and clinical reasoning session (4.72) were the highest‐rated sessions. Compared to all UCSF CME course offerings between January 2010 and September 2012, the UHMC rated higher than the cumulative overall rating from those 227 courses (4.65 vs 4.44). For UCSF CME courses offered in 2011 and 2012, 78% of participants (n=11,447) reported a high or definite likelihood to change practice. For UHMC participants during the same time period (n=57), 98% reported a similar likelihood to change practice. Table 3 provides selected participant comments from their postcourse evaluations.
|
| Great pearls, broad ranging discussion of many controversial and common topics, and I loved the teaching format. |
| I thought the conception of the teaching model was really effectivehands‐on exams in small groups, each demonstrating a different part of the neurologic exam, followed by presentation and discussion, and ending in bedside rounds with the teaching faculty. |
| Excellent review of key topicswide variety of useful and practical points. Very high application value. |
| Great course. I'd take it again and again. It was a superb opportunity to review technique, equipment, and clinical decision making. |
| Overall outstanding course! Very informative and fun. Format was great. |
| Forward and clinically relevant. Like the bedside teaching and how they did it.The small size of the course and the close attention paid by the faculty teaching the course combined with the opportunity to see and examine patients in the hospital was outstanding. |
DISCUSSION
We developed an innovative CME program that brought participants to an academic health center for a participatory, hands‐on, and small‐group experience. They learned about topics relevant to today's hospitalists, rated the experience very highly, and reported a nearly unanimous likelihood to change their practice. Reflecting on our program's first 5 years, there were several lessons learned that may guide others committed to providing a similar CME experience.
First, hospital medicine is a dynamic field. Conducting a needs assessment to match clinical topics to what attendees required in their own practice was critical. Iterative changes from year to year reflected formal participant feedback as well as informal conversations with the teaching faculty. For instance, attendees were not only interested in the clinical topics but often wanted to see examples of clinical pathways, order sets, and other systems in place to improve care for patients with common conditions. Our participant presurvey also helped identify and reinforce the curricular topics that teaching faculty focused on each year. Being responsive to the changing needs of hospitalists and the environment is a crucial part of providing a relevant CME experience.
We also used an innovative approach to teaching, founded in adult and effective CME learning principles. CME activities are geared toward adult physicians, and studies of their effectiveness recommend that sessions should be interactive and utilize multiple modalities of learning.[12] When attendees actively participate and are provided an opportunity to practice skills, it may have a positive effect on patient outcomes.[13] All UHMC faculty were required to couple presentations of the latest evidence for clinical topics with small‐group and hands‐on learning modalities. This also required that we utilize a teaching faculty known for both their clinical expertise and teaching recognition. Together, the learning modalities and the teaching faculty likely accounted for the highly rated course experience and likelihood to change practice.
Finally, our course brought participants to an academic medical center and into the mix of clinical care as opposed to the more traditional hotel venue. This was necessary to deliver the curriculum as described, but also had the unexpected benefit of energizing the participants. Many had not been in a teaching setting since their residency training, and bringing them back into this milieu motivated them to learn and share their inspiration. As there are no published studies of CME experiences in the clinical environment, this observation is noteworthy and deserves to be explored and evaluated further.
What are the limitations of our approach to bringing CME to the bedside? First, the economics of an intensive 3‐day course with a maximum of 33 attendees are far different than those of a large hotel‐based offering. There are no exhibitors or outside contributions. The cost of the course to participants is $2500 (discounted if attending the larger course as well), which is 2 to 3 times higher than most traditional CME courses of the same length. Although the cost is high, the course has sold out each year with a waiting list. Part of the cost is also faculty time. The time, preparation, and need to teach on the fly to meet the differing participant educational needs is fundamentally different than delivering a single lecture in a hotel conference room. Not surprisingly, our faculty enjoy this teaching opportunity and find it equally unique and valuable; no faculty have dropped out of teaching the course, and many describe it as 1 of the teaching highlights of the year. Scalability of the UHMC is challenging for these reasons, but our model could be replicated in other teaching institutions, even as a local offering for their own providers.
In summary, we developed a hospital‐based, highly interactive, small‐group CME course that emphasizes case‐based teaching. The course has sold out each year, and evaluations suggest that it is highly valued and is meeting curricular goals better than more traditional CME courses. We hope our course description and success may motivate others to consider moving beyond the traditional CME for hospitalists and explore further innovations. With the field growing and changing at a rapid pace, innovative CME experiences will be necessary to assure that hospitalists continue to provide exemplary and safe care to their patients.
Acknowledgements
The authors thank Kapo Tam for her program management of the UHMC, and Katherine Li and Zachary Martin for their invaluable administrative support and coordination. The authors are also indebted to faculty colleagues for their time and roles in teaching within the program. They include Gupreet Dhaliwal, Andy Josephson, Vanja Douglas, Michelle Milic, Brian Daniels, Quinny Cheng, Lindy Fox, Diane Sliwka, Ralph Wang, and Thomas Urbania.
Disclosure: Nothing to report.
- , . The emerging role of “hospitalists” in the American health care system. N Engl J Med. 1996;337(7):514–517.
- Society of Hospital Medicine. Available at: http://www.hospitalmedicine.org/Content/NavigationMenu/Membership2/HospitalFocusedPractice/Hospital_Focused_Pra.htm. Accessed October 1, 2013.
- , , , . Hospital medicine fellowships: works in progress. Am J Med. 2006;119(1):72.e1–e7.
- Society of Hospital Medicine. Core competencies in hospital medicine. Available at: http://www.hospitalmedicine.org/Content/NavigationMenu/Education/CoreCurriculum/Core_Competencies.htm. Accessed October 1, 2013.
- , . The expanding role of hospitalists in the United States. Swiss Med Wkly. 2006;136(37‐38);591–596.
- Accreditation Council for Continuing Medical Education. CME content: definition and examples Available at: http://www.accme.org/requirements/accreditation‐requirements‐cme‐providers/policies‐and‐definitions/cme‐content‐definition‐and‐examples. Accessed October 1, 2013.
- , , , . Changing physician performance. A systematic review of the effect of continuing medical education strategies. JAMA. 1995;274(9):700–705.
- , . Continuing medical education and the physician as a learner: guide to the evidence. JAMA. 2002;288(9):1057–1060.
- , , , , . Barriers to innovation in continuing medical eduation. J Contin Educ Health Prof. 2008;28(3):148–156.
- . Adult learning theory for the 21st century. In: Merriam S. Thrid Update on Adult Learning Theory: New Directions for Adult and Continuing Education. San Francisco, CA: Jossey‐Bass; 2008:93–98.
- .UCSF management of the hospitalized patient CME course. Available at: http://www.ucsfcme.com/2014/MDM14P01/info.html. Accessed October 1, 2013.
- Continuing medical education effect on practice performance: effectiveness of continuing medical education: American College or Chest Physicians evidence‐based educational guidelines. Chest. 2009;135(3 suppl);42S–48S.
- Continuing medical education effect on clinical outcomes: effectiveness of continuing medical education: American College or Chest Physicians evidence‐based educational guidelines. Chest. 2009;135(3 suppl);49S–55S.
I hear and I forget, I see and I remember, I do and I understand.
Confucius
Hospital medicine, first described in 1996,[1] is the fastest growing specialty in United States medical history, now with approximately 40,000 practitioners.[2] Although hospitalists undoubtedly learned many of their key clinical skills during residency training, there is no hospitalist‐specific residency training pathway and a limited number of largely research‐oriented fellowships.[3] Furthermore, hospitalists are often asked to care for surgical patients, those with acute neurologic disorders, and patients in intensive care units, while also contributing to quality improvement and patient safety initiatives.[4] This suggests that the vast majority of hospitalists have not had specific training in many key competencies for the field.[5]
Continuing medical education (CME) has traditionally been the mechanism to maintain, develop, or increase the knowledge, skills, and professional performance of physicians.[6] Most CME activities, including those for hospitalists, are staged as live events in hotel conference rooms or as local events in a similarly passive learning environment (eg, grand rounds and medical staff meetings). Online programs, audiotapes, and expanding electronic media provide increasing and alternate methods for hospitalists to obtain their required CME. All of these activities passively deliver content to a group of diverse and experienced learners. They fail to take advantage of adult learning principles and may have little direct impact on professional practice.[7, 8] Traditional CME is often derided as a barrier to innovative educational methods for these reasons, as adults learn best through active participation, when the information is relevant and practically applied.[9, 10]
To provide practicing hospitalists with necessary continuing education, we designed the University of California, San Francisco (UCSF) Hospitalist Mini‐College (UHMC). This 3‐day course brings adult learners to the bedside for small‐group and active learning focused on content areas relevant to today's hospitalists. We describe the development, content, outcomes, and lessons learned from UHMC's first 5 years.
METHODS
Program Development
We aimed to develop a program that focused on curricular topics that would be highly valued by practicing hospitalists delivered in an active learning small‐group environment. We first conducted an informal needs assessment of community‐based hospitalists to better understand their roles and determine their perceptions of gaps in hospitalist training compared to current requirements for practice. We then reviewed available CME events targeting hospitalists and compared these curricula to the gaps discovered from the needs assessment. We also reviewed the Society of Hospital Medicine's core competencies to further identify gaps in scope of practice.[4] Finally, we reviewed the literature to identify CME curricular innovations in the clinical setting and found no published reports.
Program Setting, Participants, and Faculty
The UHMC course was developed and offered first in 2008 as a precourse to the UCSF Management of the Hospitalized Medicine course, a traditional CME offering that occurs annually in a hotel setting.[11] The UHMC takes place on the campus of UCSF Medical Center, a 600‐bed academic medical center in San Francisco. Registered participants were required to complete limited credentialing paperwork, which allowed them to directly observe clinical care and interact with hospitalized patients. Participants were not involved in any clinical decision making for the patients they met or examined. The course was limited to a maximum of 33 participants annually to optimize active participation, small‐group bedside activities, and a personalized learning experience. UCSF faculty selected to teach in the UHMC were chosen based on exemplary clinical and teaching skills. They collaborated with course directors in the development of their session‐specific goals and curriculum.
Program Description
Figure 1 is a representative calendar view of the 3‐day UHMC course. The curricular topics were selected based on the findings from our needs assessment, our ability to deliver that curriculum using our small‐group active learning framework, and to minimize overlap with content of the larger course. Course curriculum was refined annually based on participant feedback and course director observations.
The program was built on a structure of 4 clinical domains and 2 clinical skills labs. The clinical domains included: (1) Hospital‐Based Neurology, (2) Critical Care Medicine in the Intensive Care Unit, (3) Surgical Comanagement and Medical Consultation, and (4) Hospital‐Based Dermatology. Participants were divided into 3 groups of 10 participants each and rotated through each domain in the afternoons. The clinical skills labs included: (1) Interpretation of Radiographic Studies and (2) Use of Ultrasound and Enhancing Confidence in Performing Bedside Procedures. We also developed specific sessions to teach about patient safety and to allow course attendees to participate in traditional academic learning vehicles (eg, a Morning Report and Morbidity and Mortality case conference). Below, we describe each session's format and content.
Clinical Domains
Hospital‐Based Neurology
Attendees participated in both bedside evaluation and case‐based discussions of common neurologic conditions seen in the hospital. In small groups of 5, participants were assigned patients to examine on the neurology ward. After their evaluations, they reported their findings to fellow participants and the faculty, setting the foundation for discussion of clinical management, review of neuroimaging, and exploration of current evidence to inform the patient's diagnosis and management. Participants and faculty then returned to the bedside to hone neurologic examination skills and complete the learning process. Given the unpredictability of what conditions would be represented on the ward in a given day, review of commonly seen conditions was always a focus, such as stroke, seizures, delirium, and neurologic examination pearls.
Critical Care
Attendees participated in case‐based discussions of common clinical conditions with similar review of current evidence, relevant imaging, and bedside exam pearls for the intubated patient. For this domain, attendees also participated in an advanced simulation tutorial in ventilator management, which was then applied at the bedside of intubated patients. Specific topics covered include sepsis, decompensated chronic obstructive lung disease, vasopressor selection, novel therapies in critically ill patients, and use of clinical pathways and protocols for improved quality of care.
Surgical Comanagement and Medical Consultation
Attendees participated in case‐based discussions applying current evidence to perioperative controversies and the care of the surgical patient. They also discussed the expanding role of the hospitalist in nonmedical patients.
Hospital‐Based Dermatology
Attendees participated in bedside evaluation of acute skin eruptions based on available patients admitted to the hospital. They discussed the approach to skin eruptions, key diagnoses, and when dermatologists should be consulted for their expertise. Specific topics included drug reactions, the red leg, life‐threating conditions (eg, Stevens‐Johnson syndrome), and dermatologic examination pearls. This domain was added in 2010.
Clinical Skills Labs
Radiology
In groups of 15, attendees reviewed common radiographs that hospitalists frequently order or evaluate (eg, chest x‐rays; kidney, ureter, and bladder; placement of endotracheal or feeding tube). They also reviewed the most relevant and not‐to‐miss findings on other commonly ordered studies such as abdominal or brain computerized tomography scans.
Hospital Procedures With Bedside Ultrasound
Attendees participated in a half‐day session to gain experience with the following procedures: paracentesis, lumbar puncture, thoracentesis, and central lines. They participated in an initial overview of procedural safety followed by hands‐on application sessions, in which they rotated through clinical workstations in groups of 5. At each work station, they were provided an opportunity to practice techniques, including the safe use of ultrasound on both live (standardized patients) and simulation models.
Other Sessions
Building Diagnostic Acumen and Clinical Reasoning
The opening session of the UHMC reintroduces attendees to the traditional academic morning report format, in which a case is presented and participants are asked to assess the information, develop differential diagnoses, discuss management options, and consider their own clinical reasoning skills. This provides frameworks for diagnostic reasoning, highlights common cognitive errors, and teaches attendees how to develop expertise in their own diagnostic thinking. The session also sets the stage and expectation for active learning and participation in the UHMC.
Root Cause Analysis and Systems Thinking
As the only nonclinical session in the UHMC, this session introduces participants to systems thinking and patient safety. Attendees participate in a root cause analysis role play surrounding a serious medical error and discuss the implications, their reflections, and then propose solutions through interactive table discussions. The session also emphasizes the key role hospitalists should play in improving patient safety.
Clinical Case Conference
Attendees participated in the weekly UCSF Department of Medicine Morbidity and Mortality conference. This is a traditional case conference that brings together learners, expert discussants, and an interesting or challenging case. This allows attendees to synthesize much of the course learning through active participation in the case discussion. Rather than creating a new conference for the participants, we brought the participants to the existing conference as part of their UHMC immersion experience.
Meet the Professor
Attendees participated in an informal discussion with a national leader (R.M.W.) in hospital medicine. This allowed for an interactive exchange of ideas and an understanding of the field overall.
Online Search Strategies
This interactive computer lab session allowed participants to explore the ever‐expanding number of online resources to answer clinical queries. This session was replaced in 2010 with the dermatology clinical domain based on participant feedback.
Program Evaluation
Participants completed a pre‐UHMC survey that provided demographic information and attributes about themselves, their clinical practice, and experience. Participants also completed course evaluations consistent with Accreditation Council for Continuing Medical Education standards following the program. The questions asked for each activity were rated on a 1‐to‐5 scale (1=poor, 5=excellent) and also included open‐ended questions to assess overall experiences.
RESULTS
Participant Demographics
During the first 5 years of the UHMC, 152 participants enrolled and completed the program; 91% completed the pre‐UHMC survey and 89% completed the postcourse evaluation. Table 1 describes the self‐reported participant demographics, including years in practice, number of hospitalist jobs, overall job satisfaction, and time spent doing clinical work. Overall, 68% of all participants had been self‐described hospitalists for <4 years, with 62% holding only 1 hospitalist job during that time; 77% reported being pretty or very satisfied with their jobs, and 72% reported clinical care as the attribute they love most in their job. Table 2 highlights the type of work attendees participate in within their clinical practice. More than half manage patients with neurologic disorders and care for critically ill patients, whereas virtually all perform preoperative medical evaluations and medical consultation
| Question | Response Options | 2008 (n=4) | 2009 (n=26) | 2010 (n=29) | 2011 (n=31) | 2012 (n=28) | Average (n=138) |
|---|---|---|---|---|---|---|---|
| |||||||
| How long have you been a hospitalist? | <2 years | 52% | 35% | 37% | 30% | 25% | 36% |
| 24 years | 26% | 39% | 30% | 30% | 38% | 32% | |
| 510 years | 11% | 17% | 15% | 26% | 29% | 20% | |
| >10 years | 11% | 9% | 18% | 14% | 8% | 12% | |
| How many hospitalist jobs have you had? | 1 | 63% | 61% | 62% | 62% | 58% | 62% |
| 2 to 3 | 37% | 35% | 23% | 35% | 29% | 32% | |
| >3 | 0% | 4% | 15% | 1% | 13% | 5% | |
| How satisfied are you with your current position? | Not satisfied | 1% | 4% | 4% | 4% | 0% | 4% |
| Somewhat satisfied | 11% | 13% | 39% | 17% | 17% | 19% | |
| Pretty satisfied | 59% | 52% | 35% | 57% | 38% | 48% | |
| Very satisfied | 26% | 30% | 23% | 22% | 46% | 29% | |
| What do you love most about your job? | Clinical care | 85% | 61% | 65% | 84% | 67% | 72% |
| Teaching | 1% | 17% | 12% | 1% | 4% | 7% | |
| QI or safety work | 0% | 4% | 0% | 1% | 8% | 3% | |
| Other (not specified) | 14% | 18% | 23% | 14% | 21% | 18% | |
| What percent of your time is spent doing clinical care? | 100% | 39% | 36% | 52% | 46% | 58% | 46% |
| 75%100% | 58% | 50% | 37% | 42% | 33% | 44% | |
| 5075% | 0% | 9% | 11% | 12% | 4% | 7% | |
| 25%50% | 4% | 5% | 0% | 0% | 5% | 3% | |
| <25% | 0% | 0% | 0% | 0% | 0% | 0% | |
| Question | Response Options | 2008 (n=24) | 2009 (n=26) | 2010 (n=29) | 2011 (n=31) | 2012 (n=28) | Average(n=138) |
|---|---|---|---|---|---|---|---|
| |||||||
| Do you primarily manage patients with neurologic disorders in your hospital? | Yes | 62% | 50% | 62% | 62% | 63% | 60% |
| Do you primarily manage critically ill ICU patients in your hospital? | Yes and without an intensivist | 19% | 23% | 19% | 27% | 21% | 22% |
| Yes but with an intensivist | 54% | 50% | 44% | 42% | 67% | 51% | |
| No | 27% | 27% | 37% | 31% | 13% | 27% | |
| Do you perform preoperative medical evaluations and medical consultation? | Yes | 96% | 91% | 96% | 96% | 92% | 94% |
| Which of the following describes your role in the care of surgical patients? | Traditional medical consultant | 33% | 28% | 28% | 30% | 24% | 29% |
| Comanagement (shared responsibility with surgeon) | 33% | 34% | 42% | 39% | 35% | 37% | |
| Attending of record with surgeon acting as consultant | 26% | 24% | 26% | 30% | 35% | 28% | |
| Do you have bedside ultrasound available in your daily practice? | Yes | 38% | 32% | 52% | 34% | 38% | 39% |
Participant Experience
Overall, participants rated the quality of the UHMC course highly (4.65; 15 scale). The neurology clinical domain (4.83) and clinical reasoning session (4.72) were the highest‐rated sessions. Compared to all UCSF CME course offerings between January 2010 and September 2012, the UHMC rated higher than the cumulative overall rating from those 227 courses (4.65 vs 4.44). For UCSF CME courses offered in 2011 and 2012, 78% of participants (n=11,447) reported a high or definite likelihood to change practice. For UHMC participants during the same time period (n=57), 98% reported a similar likelihood to change practice. Table 3 provides selected participant comments from their postcourse evaluations.
|
| Great pearls, broad ranging discussion of many controversial and common topics, and I loved the teaching format. |
| I thought the conception of the teaching model was really effectivehands‐on exams in small groups, each demonstrating a different part of the neurologic exam, followed by presentation and discussion, and ending in bedside rounds with the teaching faculty. |
| Excellent review of key topicswide variety of useful and practical points. Very high application value. |
| Great course. I'd take it again and again. It was a superb opportunity to review technique, equipment, and clinical decision making. |
| Overall outstanding course! Very informative and fun. Format was great. |
| Forward and clinically relevant. Like the bedside teaching and how they did it.The small size of the course and the close attention paid by the faculty teaching the course combined with the opportunity to see and examine patients in the hospital was outstanding. |
DISCUSSION
We developed an innovative CME program that brought participants to an academic health center for a participatory, hands‐on, and small‐group experience. They learned about topics relevant to today's hospitalists, rated the experience very highly, and reported a nearly unanimous likelihood to change their practice. Reflecting on our program's first 5 years, there were several lessons learned that may guide others committed to providing a similar CME experience.
First, hospital medicine is a dynamic field. Conducting a needs assessment to match clinical topics to what attendees required in their own practice was critical. Iterative changes from year to year reflected formal participant feedback as well as informal conversations with the teaching faculty. For instance, attendees were not only interested in the clinical topics but often wanted to see examples of clinical pathways, order sets, and other systems in place to improve care for patients with common conditions. Our participant presurvey also helped identify and reinforce the curricular topics that teaching faculty focused on each year. Being responsive to the changing needs of hospitalists and the environment is a crucial part of providing a relevant CME experience.
We also used an innovative approach to teaching, founded in adult and effective CME learning principles. CME activities are geared toward adult physicians, and studies of their effectiveness recommend that sessions should be interactive and utilize multiple modalities of learning.[12] When attendees actively participate and are provided an opportunity to practice skills, it may have a positive effect on patient outcomes.[13] All UHMC faculty were required to couple presentations of the latest evidence for clinical topics with small‐group and hands‐on learning modalities. This also required that we utilize a teaching faculty known for both their clinical expertise and teaching recognition. Together, the learning modalities and the teaching faculty likely accounted for the highly rated course experience and likelihood to change practice.
Finally, our course brought participants to an academic medical center and into the mix of clinical care as opposed to the more traditional hotel venue. This was necessary to deliver the curriculum as described, but also had the unexpected benefit of energizing the participants. Many had not been in a teaching setting since their residency training, and bringing them back into this milieu motivated them to learn and share their inspiration. As there are no published studies of CME experiences in the clinical environment, this observation is noteworthy and deserves to be explored and evaluated further.
What are the limitations of our approach to bringing CME to the bedside? First, the economics of an intensive 3‐day course with a maximum of 33 attendees are far different than those of a large hotel‐based offering. There are no exhibitors or outside contributions. The cost of the course to participants is $2500 (discounted if attending the larger course as well), which is 2 to 3 times higher than most traditional CME courses of the same length. Although the cost is high, the course has sold out each year with a waiting list. Part of the cost is also faculty time. The time, preparation, and need to teach on the fly to meet the differing participant educational needs is fundamentally different than delivering a single lecture in a hotel conference room. Not surprisingly, our faculty enjoy this teaching opportunity and find it equally unique and valuable; no faculty have dropped out of teaching the course, and many describe it as 1 of the teaching highlights of the year. Scalability of the UHMC is challenging for these reasons, but our model could be replicated in other teaching institutions, even as a local offering for their own providers.
In summary, we developed a hospital‐based, highly interactive, small‐group CME course that emphasizes case‐based teaching. The course has sold out each year, and evaluations suggest that it is highly valued and is meeting curricular goals better than more traditional CME courses. We hope our course description and success may motivate others to consider moving beyond the traditional CME for hospitalists and explore further innovations. With the field growing and changing at a rapid pace, innovative CME experiences will be necessary to assure that hospitalists continue to provide exemplary and safe care to their patients.
Acknowledgements
The authors thank Kapo Tam for her program management of the UHMC, and Katherine Li and Zachary Martin for their invaluable administrative support and coordination. The authors are also indebted to faculty colleagues for their time and roles in teaching within the program. They include Gupreet Dhaliwal, Andy Josephson, Vanja Douglas, Michelle Milic, Brian Daniels, Quinny Cheng, Lindy Fox, Diane Sliwka, Ralph Wang, and Thomas Urbania.
Disclosure: Nothing to report.
- , . The emerging role of “hospitalists” in the American health care system. N Engl J Med. 1996;337(7):514–517.
- Society of Hospital Medicine. Available at: http://www.hospitalmedicine.org/Content/NavigationMenu/Membership2/HospitalFocusedPractice/Hospital_Focused_Pra.htm. Accessed October 1, 2013.
- , , , . Hospital medicine fellowships: works in progress. Am J Med. 2006;119(1):72.e1–e7.
- Society of Hospital Medicine. Core competencies in hospital medicine. Available at: http://www.hospitalmedicine.org/Content/NavigationMenu/Education/CoreCurriculum/Core_Competencies.htm. Accessed October 1, 2013.
- , . The expanding role of hospitalists in the United States. Swiss Med Wkly. 2006;136(37‐38);591–596.
- Accreditation Council for Continuing Medical Education. CME content: definition and examples Available at: http://www.accme.org/requirements/accreditation‐requirements‐cme‐providers/policies‐and‐definitions/cme‐content‐definition‐and‐examples. Accessed October 1, 2013.
- , , , . Changing physician performance. A systematic review of the effect of continuing medical education strategies. JAMA. 1995;274(9):700–705.
- , . Continuing medical education and the physician as a learner: guide to the evidence. JAMA. 2002;288(9):1057–1060.
- , , , , . Barriers to innovation in continuing medical eduation. J Contin Educ Health Prof. 2008;28(3):148–156.
- . Adult learning theory for the 21st century. In: Merriam S. Thrid Update on Adult Learning Theory: New Directions for Adult and Continuing Education. San Francisco, CA: Jossey‐Bass; 2008:93–98.
- .UCSF management of the hospitalized patient CME course. Available at: http://www.ucsfcme.com/2014/MDM14P01/info.html. Accessed October 1, 2013.
- Continuing medical education effect on practice performance: effectiveness of continuing medical education: American College or Chest Physicians evidence‐based educational guidelines. Chest. 2009;135(3 suppl);42S–48S.
- Continuing medical education effect on clinical outcomes: effectiveness of continuing medical education: American College or Chest Physicians evidence‐based educational guidelines. Chest. 2009;135(3 suppl);49S–55S.

Focusing on Value
Over the last 30 years, rounds of therapeutic treatments with cost consciousness and cost containment have been administered to the healthcare industry, with generally disappointing clinical response. The last treatment cycle came in the 1990s, with the combination therapy of prospective payment and managed care, treatments that produced a transient remission in cost inflation but that left the healthcare system spent and decidedly unenthusiastic about another round of intensive therapy. For the next 15 years or so, the underlying conditions remained untreated, and unsurprisingly, runaway healthcare inflation returned. To continue this metaphor only a bit further, in 2013 the healthcare system is again facing intensive treatments, but in this case the treatments seem more likely to produce a strong and durable clinical response.
Although some argue that current efforts shall also pass, we believe that the present day is clearly different. A major difference is the implementation of the Affordable Care Act, which creates new structures to facilitate and incentives to promote cost reductions. More importantly, there has been a sea change in how the publicnot just payors or employersview healthcare costs. The ideas that care is too expensive and that much of it adds no value to patients have gained wide acceptance across the political spectrum, among patients, and increasingly among physicians.
It was in this context that the American Board of Internal Medicine Foundation (ABIMF) launched its Choosing Wisely campaign in 2011.[1] The stated goal of the campaign was to promote important conversations [between doctors and patients] necessary to ensure the right care is delivered at the right time. Importantly, this careful framing successfully avoided the caricatures of rationing or death panels, reactions that doomed prior efforts to engage all stakeholders in a reasoned national dialogue about costs and value.
The ABIMF chose an approach of having physicians identify tests and procedures that may be unnecessary in certain situations. Working with Consumer Reports, the Foundation asked a wide range of medical specialty societies to develop their own list of tests and procedures that could potentially be avoided with no harm to patients. The vast majority, 25 as of July 2013, chose to participate.
In February 2013, the Society of Hospital Medicine (SHM) joined the initiative when it posted adult and pediatric versions of Five Things Physicians and Patients Should Question.[2] We are pleased to publish summaries of the recommendations and the processes by which the 2 working groups produced their lists in the Journal of Hospital Medicine.[3, 4]
In reading these articles, we are struck by the importance of the SHM's work to reduce costs and improve value. However, it really is a first step: both articles must now catalyze a body of work to create and sustain meaningful change.
Although many of the 10 targets have strong face validity, it is not clear whether they are in fact the most common, costly, or low‐value practices under the purview of hospitalists. Given the fact that the selection process involved both evidence‐based reviews and consensus, it is possible that other, potentially more contentious, practices may provide even more bang for the buck, or in this case, nonbuck.
Nevertheless, these are quibbles. These lists are good starting points, and in fact many hospitalist groups, including our own, are using the SHM practices as a foundation for our waste‐reduction efforts. The next challenge will be translating these recommendations into actionable measures and then clinical practice. For example, 1 of the adult recommendations is to avoid repeat blood counts and chemistries in patients who are clinically stable. Concepts of clinical stability are notoriously difficult to define within specific patient subgroups, much less across the diverse patient populations seen by hospitalists. One approach here would be to narrow the focus (eg, do not order repeated blood counts in patients with gastrointestinal bleeding whose labs have been stable for 48 hours), but this step would limit the cost savings. Other measures, such as those related to urinary catheters, are more clearly defined and seem closer to being widely adoptable.
For all these measures, the ultimate question remains: How much can actually be saved and how do we measure the savings? The marginal cost of a complete blood count is extraordinarily small in comparison to an entire hospital stay, but it is possible that eliminating redundant testing also reduces the costs related to follow‐up of false positive findings. Reducing the use of urinary catheters can cut the costs of urinary tract infections and the complications of treatment, but these costs could be offset by the higher‐level nursing care needed to mobilize patients earlier or assist patients in toileting, squeezing the proverbial balloon. For all these measures, it is unclear whether what might be relatively small variable cost reductions related to specific tests/procedures can lead to subsequent reduction in fixed costs related to facilities and equipment, where more than 70% of healthcare costs lie.[5] In other words, reducing the number of lab technicians and the amount of laboratory equipment needed will lead to far greater cost reductions than reducing individual test utilization.
None of this is to say that the Choosing Wisely campaign is without merit. To the contrary, the campaign and the efforts of the SHM are early and critical steps in changing the behavior of a profession. Since the early days of hospital medicine, hospitalists have embraced cost reduction and value improvement as a central focus. By successfully engaging consumers and the community of medical specialties, Choosing Wisely has created a language and a framework that will allow our field and others to tackle the crucial work of resource stewardship with new purpose, and we hope, unprecedented success.
Disclosures
Dr. Wachter is immediate past‐chair of the American Board of Internal Medicine (ABIM) and serves on the ABIM Foundation's Board of Trustees. Dr. Auerbach receives honoraria from the American Board of Internal Medicine as a contributor to the Maintenance of Certification question pool.
- , . Choosing wisely: helping physicians and patients make smart decisions about their care. JAMA. 2012;307:1801–1802.
- Are you choosing wisely? 2013. Available at: http://www.hospitalmedicine.org/AM/Template.cfm?Section=Quality_Improvement8:486–492.
- , , , et al. Choosing Wisely in inpatient pediatrics: 5 opportunities for improved healthcare value. J Hosp Med. 2013;8:479–485.
- , , , et al. Distribution of variable vs fixed costs of hospital care. JAMA. 1999;281:644–649.
Over the last 30 years, rounds of therapeutic treatments with cost consciousness and cost containment have been administered to the healthcare industry, with generally disappointing clinical response. The last treatment cycle came in the 1990s, with the combination therapy of prospective payment and managed care, treatments that produced a transient remission in cost inflation but that left the healthcare system spent and decidedly unenthusiastic about another round of intensive therapy. For the next 15 years or so, the underlying conditions remained untreated, and unsurprisingly, runaway healthcare inflation returned. To continue this metaphor only a bit further, in 2013 the healthcare system is again facing intensive treatments, but in this case the treatments seem more likely to produce a strong and durable clinical response.
Although some argue that current efforts shall also pass, we believe that the present day is clearly different. A major difference is the implementation of the Affordable Care Act, which creates new structures to facilitate and incentives to promote cost reductions. More importantly, there has been a sea change in how the publicnot just payors or employersview healthcare costs. The ideas that care is too expensive and that much of it adds no value to patients have gained wide acceptance across the political spectrum, among patients, and increasingly among physicians.
It was in this context that the American Board of Internal Medicine Foundation (ABIMF) launched its Choosing Wisely campaign in 2011.[1] The stated goal of the campaign was to promote important conversations [between doctors and patients] necessary to ensure the right care is delivered at the right time. Importantly, this careful framing successfully avoided the caricatures of rationing or death panels, reactions that doomed prior efforts to engage all stakeholders in a reasoned national dialogue about costs and value.
The ABIMF chose an approach of having physicians identify tests and procedures that may be unnecessary in certain situations. Working with Consumer Reports, the Foundation asked a wide range of medical specialty societies to develop their own list of tests and procedures that could potentially be avoided with no harm to patients. The vast majority, 25 as of July 2013, chose to participate.
In February 2013, the Society of Hospital Medicine (SHM) joined the initiative when it posted adult and pediatric versions of Five Things Physicians and Patients Should Question.[2] We are pleased to publish summaries of the recommendations and the processes by which the 2 working groups produced their lists in the Journal of Hospital Medicine.[3, 4]
In reading these articles, we are struck by the importance of the SHM's work to reduce costs and improve value. However, it really is a first step: both articles must now catalyze a body of work to create and sustain meaningful change.
Although many of the 10 targets have strong face validity, it is not clear whether they are in fact the most common, costly, or low‐value practices under the purview of hospitalists. Given the fact that the selection process involved both evidence‐based reviews and consensus, it is possible that other, potentially more contentious, practices may provide even more bang for the buck, or in this case, nonbuck.
Nevertheless, these are quibbles. These lists are good starting points, and in fact many hospitalist groups, including our own, are using the SHM practices as a foundation for our waste‐reduction efforts. The next challenge will be translating these recommendations into actionable measures and then clinical practice. For example, 1 of the adult recommendations is to avoid repeat blood counts and chemistries in patients who are clinically stable. Concepts of clinical stability are notoriously difficult to define within specific patient subgroups, much less across the diverse patient populations seen by hospitalists. One approach here would be to narrow the focus (eg, do not order repeated blood counts in patients with gastrointestinal bleeding whose labs have been stable for 48 hours), but this step would limit the cost savings. Other measures, such as those related to urinary catheters, are more clearly defined and seem closer to being widely adoptable.
For all these measures, the ultimate question remains: How much can actually be saved and how do we measure the savings? The marginal cost of a complete blood count is extraordinarily small in comparison to an entire hospital stay, but it is possible that eliminating redundant testing also reduces the costs related to follow‐up of false positive findings. Reducing the use of urinary catheters can cut the costs of urinary tract infections and the complications of treatment, but these costs could be offset by the higher‐level nursing care needed to mobilize patients earlier or assist patients in toileting, squeezing the proverbial balloon. For all these measures, it is unclear whether what might be relatively small variable cost reductions related to specific tests/procedures can lead to subsequent reduction in fixed costs related to facilities and equipment, where more than 70% of healthcare costs lie.[5] In other words, reducing the number of lab technicians and the amount of laboratory equipment needed will lead to far greater cost reductions than reducing individual test utilization.
None of this is to say that the Choosing Wisely campaign is without merit. To the contrary, the campaign and the efforts of the SHM are early and critical steps in changing the behavior of a profession. Since the early days of hospital medicine, hospitalists have embraced cost reduction and value improvement as a central focus. By successfully engaging consumers and the community of medical specialties, Choosing Wisely has created a language and a framework that will allow our field and others to tackle the crucial work of resource stewardship with new purpose, and we hope, unprecedented success.
Disclosures
Dr. Wachter is immediate past‐chair of the American Board of Internal Medicine (ABIM) and serves on the ABIM Foundation's Board of Trustees. Dr. Auerbach receives honoraria from the American Board of Internal Medicine as a contributor to the Maintenance of Certification question pool.
- , . Choosing wisely: helping physicians and patients make smart decisions about their care. JAMA. 2012;307:1801–1802.
- Are you choosing wisely? 2013. Available at: http://www.hospitalmedicine.org/AM/Template.cfm?Section=Quality_Improvement8:486–492.
- , , , et al. Choosing Wisely in inpatient pediatrics: 5 opportunities for improved healthcare value. J Hosp Med. 2013;8:479–485.
- , , , et al. Distribution of variable vs fixed costs of hospital care. JAMA. 1999;281:644–649.
Academic Hospitalist Balanced Scorecard
The field of hospital medicine, now the fastest growing specialty in medical history,[1] was born out of pressure to improve the efficiency and quality of clinical care in US hospitals.[2] Delivering safe and high‐value clinical care is a central goal of the field and has been an essential component of its growth and success.
The clinical demands on academic hospitalists have grown recently, fueled by the need to staff services previously covered by housestaff, whose hours are now restricted. Despite these new demands, expectations have grown in other arenas as well. Academic hospitalist groups (AHGs) are often expected to make significant contributions in quality improvement, patient safety, education, research, and administration. With broad expectations beyond clinical care, AHGs face unique challenges. Groups that focus mainly on providing coverage and improving clinical performance may find that they are unable to fully contribute in these other domains. To be successful, AHGs must develop strategies that balance their energies, resources, and performance.
The balanced scorecard (BSC) was introduced by Kaplan and Norton in 1992 to allow corporations to view their performance broadly, rather than narrowly focusing on financial measures. The BSC requires organizations to develop a balanced portfolio of performance metrics across 4 key perspectives: financial, customers, internal processes, and learning and growth. Metrics within these perspectives should help answer fundamental questions about the organization (Table 1).[3] Over time, the BSC evolved from a performance measurement tool to a strategic management system.[4] Successful organizations translate their mission and vision to specific strategic objectives in each of the 4 perspectives, delineate how these objectives will help the organization reach its vision with a strategy map,[5] and then utilize the BSC to track and monitor performance to ensure that the vision is achieved.[6]
| BSC Perspective | Traditional Questions[3] | Questions Revised for AHCs |
|---|---|---|
| ||
| Financial | How do we look to our shareholders? | What financial condition must we be in to allow us to accomplish our mission? |
| Customers | How do customers see us? | How do we ensure that our services and products add the level of value desired by our stakeholders? |
| Internal processes | What must we excel at? | How do we produce our products and services to add maximum value for our customers and stakeholders? |
| Learning and growth | How can we continue to improve and create value? | How do we ensure that we change and improve in order to achieve our vision? |
Although originally conceived for businesses, the BSC has found its way into the healthcare industry, with reports of successful implementation in organizations ranging from individual departments to research collaboratives[7] to national healthcare systems.[8] However, there are few reports of BSC implementation in academic health centers.[9, 10] Because most academic centers are not‐for‐profit, Zelman suggests that the 4 BSC perspectives be modified to better fit their unique characteristics (Table 1).[11] To the best of our knowledge, there is no literature describing the development of a BSC in an academic hospitalist group. In this article, we describe the development of, and early experiences with, an academic hospital medicine BSC developed as part of a strategic planning initiative.
METHODS
The University of California, San Francisco (UCSF) Division of Hospital Medicine (DHM) was established in 2005. Currently, there are more than 50 faculty members, having doubled in the last 4 years. In addition to staffing several housestaff and nonhousestaff clinical services, faculty are involved in a wide variety of nonclinical endeavors at local and national levels. They participate and lead initiatives in education, faculty development, patient safety, care efficiency, quality improvement, information technology, and global health. There is an active research enterprise that generates nearly $5 million in grant funding annually.
Needs Assessment
During a division retreat in 2009, faculty identified several areas in need of improvement, including: clinical care processes, educational promotion, faculty development, and work‐life balance. Based on these needs, divisional mission and vision statements were created (Table 2).
|
| Our mission: to provide the highest quality clinical care, education, research, and innovation in academic hospital medicine. |
| Our vision: to be the best division of hospital medicine by promoting excellence, integrity, innovation, and professional satisfaction among our faculty, trainees, and staff. |
Division leadership made it a priority to create a strategic plan to address these wide‐ranging issues. To accomplish this, we recognized the need to develop a formal way of translating our vision into specific and measurable objectives, establish systems of performance measurement, improve accountability, and effectively communicate these strategic goals to the group. Based on these needs, we set out to develop a divisional BSC.
Development
At the time of BSC development, the DHM was organized into 4 functional areas: quality and safety, education, faculty development, and academics and research. A task force was formed, comprised of 8 senior faculty representing these key areas. The mission and vision statements were used as the foundation for the development of division goals and objectives. The group was careful to choose objectives within each of the 4 BSC perspectives for academic centers, as defined by Zelman (Table 1). The taskforce then brainstormed specific metrics that would track performance within the 4 functional areas. The only stipulation during this process was that the metrics had to meet the following criteria:
- Important to the division and to the individual faculty members
- Measurable through either current or developed processes
- Data are valid and their validity trusted by the faculty members
- Amenable to improvement by faculty (ie, through their individual action they could impact the metric)
From the subsequent list of metrics, we used a modified Delphi method to rank‐order them by importance to arrive at our final set of metrics. Kaplan and Norton noted that focusing on a manageable number of metrics (ie, a handful in each BSC perspective) is important for an achievable strategic vision.[6] With the metrics chosen, we identified data sources or developed new systems to collect data for which there was no current source. We assigned individuals responsible for collecting and analyzing the data, identified local or national benchmarks, if available, and established performance targets for the coming year, when possible.
The BSC is updated quarterly, and results are presented to the division during a noon meeting and posted on the division website. Metrics are re‐evaluated on a yearly basis. They are continued, modified, or discarded depending on performance and/or changes in strategic priorities.
The initial BSC focused on division‐wide metrics and performance. Early efforts to develop the scorecard were framed as experimental, with no clear decision taken regarding how metrics might ultimately be used to improve performance (ie, how public to make both individual and group results, whether to tie bonus payments to performance).
RESULTS
There were 41 initial metrics considered by the division BSC task force (Table 3). Of these, 16 were chosen for the initial BSC through the modified Delphi method. Over the past 2 years, these initial metrics have been modified to reflect current strategic goals and objectives. Figure 1 illustrates the BSC for fiscal year (FY) 2012. An online version of this, complete with graphical representations of the data and metric definitions, can be found at
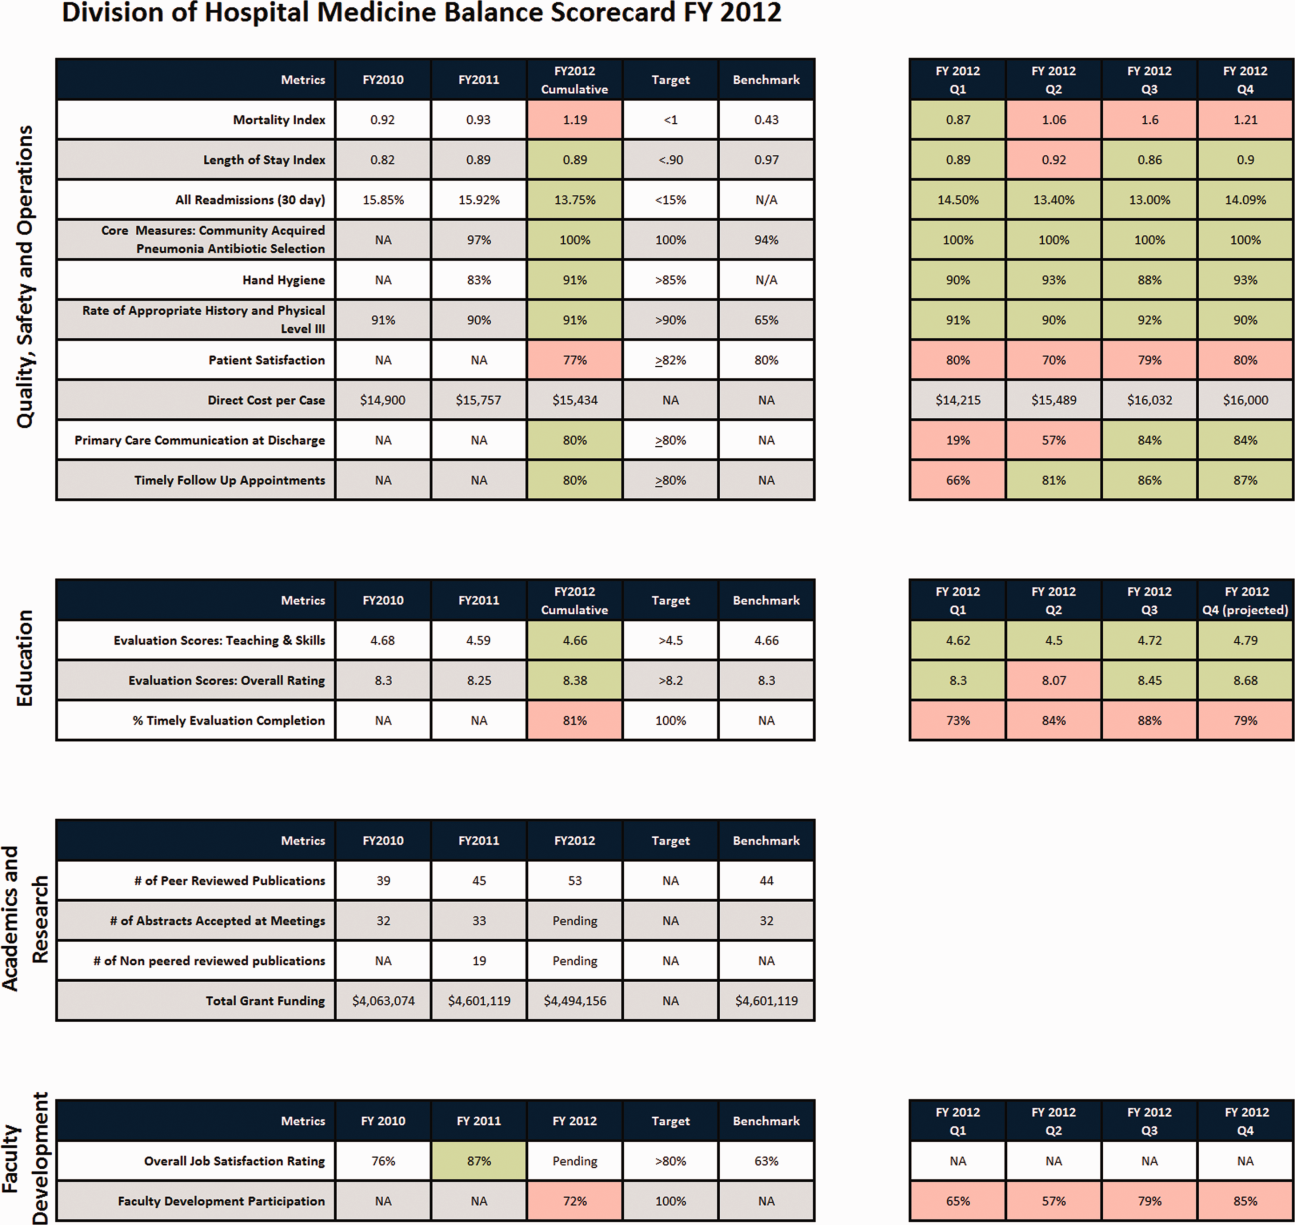
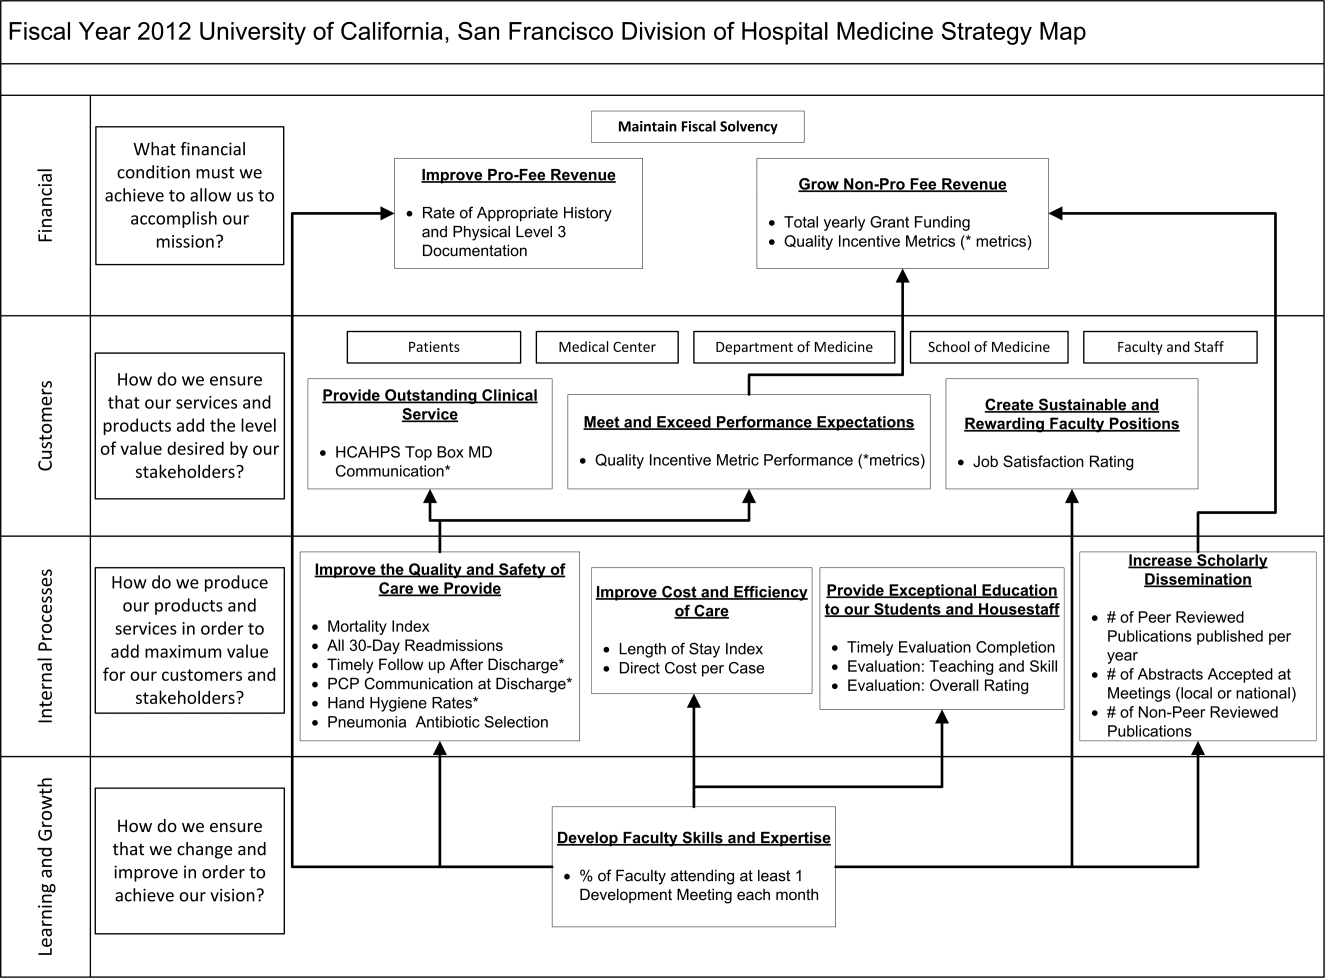
| Quality, Safety, and Operations | Education | Academics and Research | Faculty Development |
|---|---|---|---|
| |||
| Appropriate level of care | CME courses taught | Abstracts accepted | Attendance and participation |
| Billing and documentation | Curriculum development | Academic reputation | Being an agent of change |
| Clinical efficiency | Student/housestaff feedback | Grant funding | Division citizenship |
| Clinical professionalism | Mentoring | Mentorship | Job satisfaction |
| Communication | Quality of teaching rounds | Papers published | Mentorship |
| Core measures performance | Participation in national organizations | Committees and task forces | |
| Practice evidence‐based medicine | |||
| Fund of knowledge | |||
| Guideline adherence | |||
| Unplanned transfers to ICU | |||
| Implementation and initiation of projects | |||
| Length of stay | |||
| Medical errors | |||
| Mortality | |||
| Multidisciplinary approach to patient care | |||
| Multisource feedback evaluations | |||
| Never events | |||
| Patient‐centered care | |||
| Patient satisfaction | |||
| Practice‐based learning | |||
| Procedures | |||
| Readmissions | |||
| Reputation and expertise | |||
| Seeing patient on the day of admission | |||
| Quality of transfers of care | |||
DISCUSSION
Like many hospitalist groups, our division has experienced tremendous growth, both in our numbers and the breadth of roles that we fill. With this growth has come increasing expectations in multiple domains, competing priorities, and limited resources. We successfully developed a BSC as a tool to help our division reach its vision: balancing high quality clinical care, education, academics, and faculty development while maintaining a strong sense of community. We have found that the BSC has helped us meet several key goals.
The first goal was to allow for a broad view of our performance. This is the BSC's most basic function, and we saw immediate and tangible benefits. The scorecard provided a broad snapshot of our performance in a single place. For example, in the clinical domain, we saw that our direct cost per case was increasing despite our adjusted average length of stay remaining stable from FY2010‐FY2011. In academics and research, we saw that the number of abstracts accepted at national meetings increased by almost 30% in FY2011 (Figure 1).
The second goal was to create transparency and accountability. By measuring performance and displaying it on the division Web site, the BSC has promoted transparency. If performance does not meet our targets, the division as a whole becomes accountable. Leadership must understand why performance fell short and initiate changes to improve it. For instance, the rising direct cost per case has spurred the development of a high‐value care committee tasked with finding ways of reducing cost while providing high‐quality care.[12]
The third goal was to communicate goals and engage our faculty. As our division has grown, ensuring a shared vision among our entire faculty became an increasing challenge. The BSC functions as a communication platform between leadership and faculty, and yielded multiple benefits. As the metrics were born out of our mission and vision, the BSC has become a tangible representation of our core values. Moreover, individual faculty can see that they are part of a greater, high‐performing organization and realize they can impact the group's performance through their individual effort. For example, this has helped promote receptivity to carefully disseminated individual performance measures for billing and documentation, and patient satisfaction, in conjunction with faculty development in these areas.
The fourth goal was to ensure that we use data to guide strategic decisions. We felt that strategic decisions needed to be based on objective, rather than perceived or anecdotal, information. This meant translating our vision into measurable objectives that would drive performance improvement. For example, before the BSC, we were committed to the dissemination of our research and innovations. Yet, we quickly realized that we did not have a system to collect even basic data on academic performancea deficit we filled by leveraging information gathered from online databases and faculty curricula vitae. These data allowed us, for the first time, to objectively reflect on this as a strategic goal and to have an ongoing mechanism to monitor academic productivity.
Lessons Learned/Keys to Success
With our initial experience, we have gained insight that may be helpful to other AHGs considering implementing a BSC. First, and most importantly, AHGs should take the necessary time to build consensus and buy‐in. Particularly in areas where data are analyzed for the first time, faculty are often wary about the validity of the data or the purpose and utility of performance measurement. Faculty may be concerned about how collection of performance data could affect promotion or create a hostile and competitive work environment.
This concern grows when one moves from division‐wide to individual data. It is inevitable that the collection and dissemination of performance data will create some level of discomfort among faculty members, which can be a force for improvement or for angst. These issues should be anticipated, discussed, and actively managed. It is critical to be transparent with how data will be used. We have made clear that the transition from group to individual performance data, and from simple transparency to incentives, will be done thoughtfully and with tremendous input from our faculty. This tension can also be mitigated by choosing metrics that are internally driven, rather than determined by external groups (ie, following the principle that the measures should be important to the division and individual faculty members).
Next, the process of developing a mature BSC takes time. Much of our first year was spent developing systems for measurement, collecting data, and determining appropriate comparators and targets. The data in the first BSC functioned mainly as a baseline marker of performance. Some metrics, particularly in education and academics, had no national or local benchmarks. In these cases we identified comparable groups (such as other medical teaching services or other well‐established AHGs) or merely used our prior year's performance as a benchmark. Also, some of our metrics did not initially have performance targets. In most instances, this was because this was the first time that we looked at these data, and it was unclear what an appropriate target would be until more data became available.
Moving into our third year, we are seeing a natural evolution in the BSC's use. Some metrics that were initially chosen have been replaced or modified to reflect changing goals and priorities. Functional directors participate in choosing and developing performance metrics in their area. Previously, there was no formal structure for these groups to develop and measure strategic objectives and be accountable for performance improvement. They are now expected to define goals with measurable outcomes, to report progress to division leadership, and to develop their own scorecard to track performance. Each group chooses 2 to 4 metrics within their domain that are the most important for the division to improve on, which are then included in the division BSC.
We have also made efforts to build synergy between our BSC and performance goals set by external groups. Although continuing to favor metrics that are internally driven and meaningful to our faculty, we recognize that our goals must also reflect the needs and interests of broader stakeholders. For example, hand hygiene rates and patient satisfaction scores are UCSF medical center and divisional priorities (the former includes them in a financial incentive system for managers, staff, and many physicians) and are incorporated into the BSC as division‐wide incentive metrics.
Limitations
Our project has several limitations. It was conducted at a single institution, and our metrics may not be generalizable to other groups. However, the main goal of this article was not to focus on specific metrics but the process that we undertook to choose and develop them. Other institutions will likely identify different metrics based on their specific strategic objectives. We are also early in our experience with the BSC, and it is still not clear what effect it will have on the desired outcomes for our objectives. However, Henriksen recently reported that implementing a BSC at a large academic health center, in parallel with other performance improvement initiatives, resulted in substantial improvement in their chosen performance metrics.[13]
Despite the several years of development, we still view this as an early version of a BSC. To fully realize its benefits, an organization must choose metrics that will not simply measure performance but drive it. Our current BSC relies primarily on lagging measures, which show what our performance has been, and includes few leading metrics, which can predict trends in performance. As explained by Kaplan and Norton, this type of BSC risks skewing toward controlling rather than driving performance.[14] A mature BSC will include a mix of leading and lagging indicators, the combination illustrating a logical progression from measurement to performance. For instance, we measure total grant funding per year, which is a lagging indicator. However, to be most effective we could measure the percent of faculty who have attended grant‐writing workshops, the number of new grant sources identified, or the number of grant proposals submitted each quarter. These leading indicators would allow us to see performance trends that could be improved before the final outcome, total grant funding, is realized.
Finally, the issues surrounding the acceptability of this overall strategy will likely hinge on how we implement the more complex steps that relate to transparency, individual attribution, and perhaps ultimately incentives. Success in this area depends as much on culture as on strategy.
Next Steps
The next major step in the evolution of the BSC, and part of a broader faculty development program, will be the development of individual BSCs. They will be created using a similar methodology and allow faculty to reflect on their performance compared to peers and recognized benchmarks. Ideally, this will allow hospitalists in our group to establish personal strategic plans and monitor their performance over time. Individualizing these BSCs will be critical; although a research‐oriented faculty member might be striving for more than 5 publications and a large grant in a year, a clinician‐educator may seek outstanding teaching reviews and completion of a key quality improvement project. Both efforts need to be highly valued, and the divisional BSC should roll up these varied individual goals into a balanced whole.
In conclusion, we successfully developed and implemented a BSC to aid in strategic planning. The BSC ensures that we make strategic decisions using data, identify internally driven objectives, develop systems of performance measurement, and increase transparency and accountability. Our hope is that this description of the development of our BSC will be useful to other groups considering a similar endeavor.
Acknowledgments
The authors thank Noori Dhillon, Sadaf Akbaryar, Katie Quinn, Gerri Berg, and Maria Novelero for data collection and analysis. The authors also thank the faculty and staff who participated in the development process of the BSC.
Disclosure
Nothing to report.
- . The hospitalist field turns 15: new opportunities and challenges. J Hosp Med. 2011;6(4):E1–E4.
- , . The emerging role of “hospitalists” in the American health care system. N Engl J Med. 1996;335(7):514–517.
- , . The balanced scorecard—measures that drive performance. Harv Bus Rev. 1992;70(1):71–79.
- , . Using the balanced scorecard as a strategic management system. Harv Bus Rev. 1996;74(1):75–85.
- , . Having trouble with your strategy? Then map it. Harv Bus Rev. 2000;78:167–176, 202.
- , . Putting the balanced scorecard to work. Harv Bus Rev. 1993;71:134–147.
- , , , et al. Development and implementation of a performance measure tool in an academic pediatric research network. Contemp Clin Trials. 2010;31(5):429–437.
- , . Lives in the balance: an analysis of the balanced scorecard (BSC) in healthcare organizations. Int J Prod Perform Manag. 2007;57(1):6–21.
- , . The “Balanced Scorecard”: development and implementation in an academic clinical department. Acad Med. 1999;74(2):114–122.
- . Introducing a balanced scorecard management system in a university anesthesiology department. Anesth Analg. 2002;95(6):1731–1738, table of contents.
- , , , , . Issues for academic health centers to consider before implementing a balanced‐scorecard effort. Acad Med. 1999;74(12):1269–1277.
- , . Cents and sensitivity—teaching physicians to think about costs. N Engl J Med. 2012;367(2):99–101.
- , , , et al. 10‐year experience integrating strategic performance improvement initiatives: can the balanced scorecard, Six Sigma, and team training all thrive in a single hospital? In: Henriksen K, Battles JB, Keyes MA, Grady ML, eds. Advances in Patient Safety: New Directions and Alternative Approaches. Vol 3. Performance and Tools. Rockville, MD: Agency for Healthcare Research and Quality; 2008. Available at: http://www.ncbi.nlm.nih.gov/books/NBK43660. Accessed 15 June 2011.
- , . Linking the balanced scorecard to strategy. Calif Manage Rev. 1996;39(1):53–79.
The field of hospital medicine, now the fastest growing specialty in medical history,[1] was born out of pressure to improve the efficiency and quality of clinical care in US hospitals.[2] Delivering safe and high‐value clinical care is a central goal of the field and has been an essential component of its growth and success.
The clinical demands on academic hospitalists have grown recently, fueled by the need to staff services previously covered by housestaff, whose hours are now restricted. Despite these new demands, expectations have grown in other arenas as well. Academic hospitalist groups (AHGs) are often expected to make significant contributions in quality improvement, patient safety, education, research, and administration. With broad expectations beyond clinical care, AHGs face unique challenges. Groups that focus mainly on providing coverage and improving clinical performance may find that they are unable to fully contribute in these other domains. To be successful, AHGs must develop strategies that balance their energies, resources, and performance.
The balanced scorecard (BSC) was introduced by Kaplan and Norton in 1992 to allow corporations to view their performance broadly, rather than narrowly focusing on financial measures. The BSC requires organizations to develop a balanced portfolio of performance metrics across 4 key perspectives: financial, customers, internal processes, and learning and growth. Metrics within these perspectives should help answer fundamental questions about the organization (Table 1).[3] Over time, the BSC evolved from a performance measurement tool to a strategic management system.[4] Successful organizations translate their mission and vision to specific strategic objectives in each of the 4 perspectives, delineate how these objectives will help the organization reach its vision with a strategy map,[5] and then utilize the BSC to track and monitor performance to ensure that the vision is achieved.[6]
| BSC Perspective | Traditional Questions[3] | Questions Revised for AHCs |
|---|---|---|
| ||
| Financial | How do we look to our shareholders? | What financial condition must we be in to allow us to accomplish our mission? |
| Customers | How do customers see us? | How do we ensure that our services and products add the level of value desired by our stakeholders? |
| Internal processes | What must we excel at? | How do we produce our products and services to add maximum value for our customers and stakeholders? |
| Learning and growth | How can we continue to improve and create value? | How do we ensure that we change and improve in order to achieve our vision? |
Although originally conceived for businesses, the BSC has found its way into the healthcare industry, with reports of successful implementation in organizations ranging from individual departments to research collaboratives[7] to national healthcare systems.[8] However, there are few reports of BSC implementation in academic health centers.[9, 10] Because most academic centers are not‐for‐profit, Zelman suggests that the 4 BSC perspectives be modified to better fit their unique characteristics (Table 1).[11] To the best of our knowledge, there is no literature describing the development of a BSC in an academic hospitalist group. In this article, we describe the development of, and early experiences with, an academic hospital medicine BSC developed as part of a strategic planning initiative.
METHODS
The University of California, San Francisco (UCSF) Division of Hospital Medicine (DHM) was established in 2005. Currently, there are more than 50 faculty members, having doubled in the last 4 years. In addition to staffing several housestaff and nonhousestaff clinical services, faculty are involved in a wide variety of nonclinical endeavors at local and national levels. They participate and lead initiatives in education, faculty development, patient safety, care efficiency, quality improvement, information technology, and global health. There is an active research enterprise that generates nearly $5 million in grant funding annually.
Needs Assessment
During a division retreat in 2009, faculty identified several areas in need of improvement, including: clinical care processes, educational promotion, faculty development, and work‐life balance. Based on these needs, divisional mission and vision statements were created (Table 2).
|
| Our mission: to provide the highest quality clinical care, education, research, and innovation in academic hospital medicine. |
| Our vision: to be the best division of hospital medicine by promoting excellence, integrity, innovation, and professional satisfaction among our faculty, trainees, and staff. |
Division leadership made it a priority to create a strategic plan to address these wide‐ranging issues. To accomplish this, we recognized the need to develop a formal way of translating our vision into specific and measurable objectives, establish systems of performance measurement, improve accountability, and effectively communicate these strategic goals to the group. Based on these needs, we set out to develop a divisional BSC.
Development
At the time of BSC development, the DHM was organized into 4 functional areas: quality and safety, education, faculty development, and academics and research. A task force was formed, comprised of 8 senior faculty representing these key areas. The mission and vision statements were used as the foundation for the development of division goals and objectives. The group was careful to choose objectives within each of the 4 BSC perspectives for academic centers, as defined by Zelman (Table 1). The taskforce then brainstormed specific metrics that would track performance within the 4 functional areas. The only stipulation during this process was that the metrics had to meet the following criteria:
- Important to the division and to the individual faculty members
- Measurable through either current or developed processes
- Data are valid and their validity trusted by the faculty members
- Amenable to improvement by faculty (ie, through their individual action they could impact the metric)
From the subsequent list of metrics, we used a modified Delphi method to rank‐order them by importance to arrive at our final set of metrics. Kaplan and Norton noted that focusing on a manageable number of metrics (ie, a handful in each BSC perspective) is important for an achievable strategic vision.[6] With the metrics chosen, we identified data sources or developed new systems to collect data for which there was no current source. We assigned individuals responsible for collecting and analyzing the data, identified local or national benchmarks, if available, and established performance targets for the coming year, when possible.
The BSC is updated quarterly, and results are presented to the division during a noon meeting and posted on the division website. Metrics are re‐evaluated on a yearly basis. They are continued, modified, or discarded depending on performance and/or changes in strategic priorities.
The initial BSC focused on division‐wide metrics and performance. Early efforts to develop the scorecard were framed as experimental, with no clear decision taken regarding how metrics might ultimately be used to improve performance (ie, how public to make both individual and group results, whether to tie bonus payments to performance).
RESULTS
There were 41 initial metrics considered by the division BSC task force (Table 3). Of these, 16 were chosen for the initial BSC through the modified Delphi method. Over the past 2 years, these initial metrics have been modified to reflect current strategic goals and objectives. Figure 1 illustrates the BSC for fiscal year (FY) 2012. An online version of this, complete with graphical representations of the data and metric definitions, can be found at
| Quality, Safety, and Operations | Education | Academics and Research | Faculty Development |
|---|---|---|---|
| |||
| Appropriate level of care | CME courses taught | Abstracts accepted | Attendance and participation |
| Billing and documentation | Curriculum development | Academic reputation | Being an agent of change |
| Clinical efficiency | Student/housestaff feedback | Grant funding | Division citizenship |
| Clinical professionalism | Mentoring | Mentorship | Job satisfaction |
| Communication | Quality of teaching rounds | Papers published | Mentorship |
| Core measures performance | Participation in national organizations | Committees and task forces | |
| Practice evidence‐based medicine | |||
| Fund of knowledge | |||
| Guideline adherence | |||
| Unplanned transfers to ICU | |||
| Implementation and initiation of projects | |||
| Length of stay | |||
| Medical errors | |||
| Mortality | |||
| Multidisciplinary approach to patient care | |||
| Multisource feedback evaluations | |||
| Never events | |||
| Patient‐centered care | |||
| Patient satisfaction | |||
| Practice‐based learning | |||
| Procedures | |||
| Readmissions | |||
| Reputation and expertise | |||
| Seeing patient on the day of admission | |||
| Quality of transfers of care | |||
DISCUSSION
Like many hospitalist groups, our division has experienced tremendous growth, both in our numbers and the breadth of roles that we fill. With this growth has come increasing expectations in multiple domains, competing priorities, and limited resources. We successfully developed a BSC as a tool to help our division reach its vision: balancing high quality clinical care, education, academics, and faculty development while maintaining a strong sense of community. We have found that the BSC has helped us meet several key goals.
The first goal was to allow for a broad view of our performance. This is the BSC's most basic function, and we saw immediate and tangible benefits. The scorecard provided a broad snapshot of our performance in a single place. For example, in the clinical domain, we saw that our direct cost per case was increasing despite our adjusted average length of stay remaining stable from FY2010‐FY2011. In academics and research, we saw that the number of abstracts accepted at national meetings increased by almost 30% in FY2011 (Figure 1).
The second goal was to create transparency and accountability. By measuring performance and displaying it on the division Web site, the BSC has promoted transparency. If performance does not meet our targets, the division as a whole becomes accountable. Leadership must understand why performance fell short and initiate changes to improve it. For instance, the rising direct cost per case has spurred the development of a high‐value care committee tasked with finding ways of reducing cost while providing high‐quality care.[12]
The third goal was to communicate goals and engage our faculty. As our division has grown, ensuring a shared vision among our entire faculty became an increasing challenge. The BSC functions as a communication platform between leadership and faculty, and yielded multiple benefits. As the metrics were born out of our mission and vision, the BSC has become a tangible representation of our core values. Moreover, individual faculty can see that they are part of a greater, high‐performing organization and realize they can impact the group's performance through their individual effort. For example, this has helped promote receptivity to carefully disseminated individual performance measures for billing and documentation, and patient satisfaction, in conjunction with faculty development in these areas.
The fourth goal was to ensure that we use data to guide strategic decisions. We felt that strategic decisions needed to be based on objective, rather than perceived or anecdotal, information. This meant translating our vision into measurable objectives that would drive performance improvement. For example, before the BSC, we were committed to the dissemination of our research and innovations. Yet, we quickly realized that we did not have a system to collect even basic data on academic performancea deficit we filled by leveraging information gathered from online databases and faculty curricula vitae. These data allowed us, for the first time, to objectively reflect on this as a strategic goal and to have an ongoing mechanism to monitor academic productivity.
Lessons Learned/Keys to Success
With our initial experience, we have gained insight that may be helpful to other AHGs considering implementing a BSC. First, and most importantly, AHGs should take the necessary time to build consensus and buy‐in. Particularly in areas where data are analyzed for the first time, faculty are often wary about the validity of the data or the purpose and utility of performance measurement. Faculty may be concerned about how collection of performance data could affect promotion or create a hostile and competitive work environment.
This concern grows when one moves from division‐wide to individual data. It is inevitable that the collection and dissemination of performance data will create some level of discomfort among faculty members, which can be a force for improvement or for angst. These issues should be anticipated, discussed, and actively managed. It is critical to be transparent with how data will be used. We have made clear that the transition from group to individual performance data, and from simple transparency to incentives, will be done thoughtfully and with tremendous input from our faculty. This tension can also be mitigated by choosing metrics that are internally driven, rather than determined by external groups (ie, following the principle that the measures should be important to the division and individual faculty members).
Next, the process of developing a mature BSC takes time. Much of our first year was spent developing systems for measurement, collecting data, and determining appropriate comparators and targets. The data in the first BSC functioned mainly as a baseline marker of performance. Some metrics, particularly in education and academics, had no national or local benchmarks. In these cases we identified comparable groups (such as other medical teaching services or other well‐established AHGs) or merely used our prior year's performance as a benchmark. Also, some of our metrics did not initially have performance targets. In most instances, this was because this was the first time that we looked at these data, and it was unclear what an appropriate target would be until more data became available.
Moving into our third year, we are seeing a natural evolution in the BSC's use. Some metrics that were initially chosen have been replaced or modified to reflect changing goals and priorities. Functional directors participate in choosing and developing performance metrics in their area. Previously, there was no formal structure for these groups to develop and measure strategic objectives and be accountable for performance improvement. They are now expected to define goals with measurable outcomes, to report progress to division leadership, and to develop their own scorecard to track performance. Each group chooses 2 to 4 metrics within their domain that are the most important for the division to improve on, which are then included in the division BSC.
We have also made efforts to build synergy between our BSC and performance goals set by external groups. Although continuing to favor metrics that are internally driven and meaningful to our faculty, we recognize that our goals must also reflect the needs and interests of broader stakeholders. For example, hand hygiene rates and patient satisfaction scores are UCSF medical center and divisional priorities (the former includes them in a financial incentive system for managers, staff, and many physicians) and are incorporated into the BSC as division‐wide incentive metrics.
Limitations
Our project has several limitations. It was conducted at a single institution, and our metrics may not be generalizable to other groups. However, the main goal of this article was not to focus on specific metrics but the process that we undertook to choose and develop them. Other institutions will likely identify different metrics based on their specific strategic objectives. We are also early in our experience with the BSC, and it is still not clear what effect it will have on the desired outcomes for our objectives. However, Henriksen recently reported that implementing a BSC at a large academic health center, in parallel with other performance improvement initiatives, resulted in substantial improvement in their chosen performance metrics.[13]
Despite the several years of development, we still view this as an early version of a BSC. To fully realize its benefits, an organization must choose metrics that will not simply measure performance but drive it. Our current BSC relies primarily on lagging measures, which show what our performance has been, and includes few leading metrics, which can predict trends in performance. As explained by Kaplan and Norton, this type of BSC risks skewing toward controlling rather than driving performance.[14] A mature BSC will include a mix of leading and lagging indicators, the combination illustrating a logical progression from measurement to performance. For instance, we measure total grant funding per year, which is a lagging indicator. However, to be most effective we could measure the percent of faculty who have attended grant‐writing workshops, the number of new grant sources identified, or the number of grant proposals submitted each quarter. These leading indicators would allow us to see performance trends that could be improved before the final outcome, total grant funding, is realized.
Finally, the issues surrounding the acceptability of this overall strategy will likely hinge on how we implement the more complex steps that relate to transparency, individual attribution, and perhaps ultimately incentives. Success in this area depends as much on culture as on strategy.
Next Steps
The next major step in the evolution of the BSC, and part of a broader faculty development program, will be the development of individual BSCs. They will be created using a similar methodology and allow faculty to reflect on their performance compared to peers and recognized benchmarks. Ideally, this will allow hospitalists in our group to establish personal strategic plans and monitor their performance over time. Individualizing these BSCs will be critical; although a research‐oriented faculty member might be striving for more than 5 publications and a large grant in a year, a clinician‐educator may seek outstanding teaching reviews and completion of a key quality improvement project. Both efforts need to be highly valued, and the divisional BSC should roll up these varied individual goals into a balanced whole.
In conclusion, we successfully developed and implemented a BSC to aid in strategic planning. The BSC ensures that we make strategic decisions using data, identify internally driven objectives, develop systems of performance measurement, and increase transparency and accountability. Our hope is that this description of the development of our BSC will be useful to other groups considering a similar endeavor.
Acknowledgments
The authors thank Noori Dhillon, Sadaf Akbaryar, Katie Quinn, Gerri Berg, and Maria Novelero for data collection and analysis. The authors also thank the faculty and staff who participated in the development process of the BSC.
Disclosure
Nothing to report.
- . The hospitalist field turns 15: new opportunities and challenges. J Hosp Med. 2011;6(4):E1–E4.
- , . The emerging role of “hospitalists” in the American health care system. N Engl J Med. 1996;335(7):514–517.
- , . The balanced scorecard—measures that drive performance. Harv Bus Rev. 1992;70(1):71–79.
- , . Using the balanced scorecard as a strategic management system. Harv Bus Rev. 1996;74(1):75–85.
- , . Having trouble with your strategy? Then map it. Harv Bus Rev. 2000;78:167–176, 202.
- , . Putting the balanced scorecard to work. Harv Bus Rev. 1993;71:134–147.
- , , , et al. Development and implementation of a performance measure tool in an academic pediatric research network. Contemp Clin Trials. 2010;31(5):429–437.
- , . Lives in the balance: an analysis of the balanced scorecard (BSC) in healthcare organizations. Int J Prod Perform Manag. 2007;57(1):6–21.
- , . The “Balanced Scorecard”: development and implementation in an academic clinical department. Acad Med. 1999;74(2):114–122.
- . Introducing a balanced scorecard management system in a university anesthesiology department. Anesth Analg. 2002;95(6):1731–1738, table of contents.
- , , , , . Issues for academic health centers to consider before implementing a balanced‐scorecard effort. Acad Med. 1999;74(12):1269–1277.
- , . Cents and sensitivity—teaching physicians to think about costs. N Engl J Med. 2012;367(2):99–101.
- , , , et al. 10‐year experience integrating strategic performance improvement initiatives: can the balanced scorecard, Six Sigma, and team training all thrive in a single hospital? In: Henriksen K, Battles JB, Keyes MA, Grady ML, eds. Advances in Patient Safety: New Directions and Alternative Approaches. Vol 3. Performance and Tools. Rockville, MD: Agency for Healthcare Research and Quality; 2008. Available at: http://www.ncbi.nlm.nih.gov/books/NBK43660. Accessed 15 June 2011.
- , . Linking the balanced scorecard to strategy. Calif Manage Rev. 1996;39(1):53–79.

Can Healthcare Go From Good to Great?
The American healthcare system produces a product whose quality, safety, reliability, and cost would be incompatible with corporate survival, were they created by a business operating in a competitive industry. Care fails to comport with best evidence nearly half of the time.1 Tens of thousands of Americans die yearly from preventable medical mistakes.2 The healthcare inflation rate is nearly twice that of the rest of the economy, rapidly outstripping the ability of employers, tax revenues, and consumers to pay the mounting bills.
Increasingly, the healthcare system is being held accountable for this lack of value. Whether through a more robust accreditation and regulatory environment, public reporting of quality and safety metrics, or pay for performance (or no pay for errors) initiatives, outside stakeholders are creating performance pressures that scarcely existed a decade ago.
Healthcare organizations and providers have begun to take notice and act, often by seeking answers from industries outside healthcare and thoughtfully importing these lessons into medicine. For example, the use of checklists has been adopted by healthcare (from aviation), with impressive results.3, 4 Many quality methods drawn from industry (Lean, Toyota, Six Sigma) have been used to try to improve performance and remove waste from complex processes.5, 6
While these efforts have been helpful, their focus has generally been at the point‐of‐careimproving the care of patients with acute myocardial infarction or decreasing readmissions. However, while the business community has long recognized that poor management and structure can thwart most efforts to improve individual processes, healthcare has paid relatively little attention to issues of organizational structure and leadership. The question arises: Could methods that have been used to learn from top‐performing businesses be helpful to healthcare's efforts to improve its own organizational performance?
In this article, we describe perhaps the best known effort to identify top‐performing corporations, compare them to carefully selected organizations that failed to achieve similar levels of performance, and glean lessons from these analyses. This effort, described in a book entitled Good to Great: Why Some Companies Make the Leapand Others Don't, has sold more than 3 million copies in its 35 languages, and is often cited by business leaders as a seminal work. We ask whether the methods of Good to Great might be applicable to healthcare organizations seeking to produce the kinds of value that patients and purchasers need and deserve.
GOOD TO GREAT METHODOLOGY
In 2001, business consultant Jim Collins published Good to Great. Its methods can be divided into 3 main components: (1) a gold standard metric to identify top organizations; (2) the creation of a control group of organizations that appeared similar to the top performers at the start of the study, but failed to match the successful organizations' performance over time; and (3) a detailed review of the methods, leadership, and structure of both the winning and laggard organizations, drawing lessons from their differences. Before discussing whether these methods could be used to analyze healthcare organizations, it is worth describing Collins' methods in more detail.
The first component of Good to Great's structure was the use of 4 metrics to identify top‐performing companies (Table 1). To select the good to great companies, Collins and his team began with a field of 1435 companies drawn from Fortune magazine's rankings of America's largest public companies. They then used the criteria in Table 1 to narrow the list to their final 11 companies, which formed the experimental group for the analysis.
|
| The company had to show a pattern of good performance punctuated by a transition point when it shifted to great performance. Great performance was defined as a cumulative total stock return of at least 3 times the general stock market for the period from the transition point through 15 years. |
| The transition from good to great had to be company‐specific, not an industry‐wide event. |
| The company had to be an established enterprise, not a startup, in business for at least 10 years prior to its transition. |
| At the time of the selection (in 1996), the company still had to show an upward trend. |
After identifying these 11 top‐performing companies, Collins created a control group, composed of companies with similar attributes that could have made the transition, but failed to do so.7 To create the control group, Collins matched and scored a pool of control group candidates based on the following criteria: similarities of business model, size, age, and cumulative stock returns prior to the good to great transition. When there were several potential controls, Collins chose companies that were larger, more profitable, and had a stronger market position and reputation prior to the transition, in order to increase the probability that the experimental companies' successes were not incidental.8 Table 2 lists the paired experimental and control companies.
| Experimental Company | Control Company |
|---|---|
| |
| Abbott | Upjohn |
| Circuit City | Silo |
| Fannie Mae | Great Western |
| Gillette | Warner‐Lambert |
| Kimberly‐Clark | Scott Paper |
| Kroger | A&P |
| Nucor | Bethlehem Steel |
| Philip Morris | R.J. Reynolds |
| Pitney Bowes | Addressograph |
| Walgreen's | Eckerd |
| Wells Fargo | Bank of America |
Finally, Collins performed a detailed historical analysis on the experimental and control groups, using materials (such as major articles published on the company, books, academic case studies, analyst reports, and financial and annual reports) that assessed the companies in real time. Good to Great relied on evidence from the period of interest (ie, accrued prior to the transition point) to avoid biases that would likely result from relying on retrospective sources of data.9
This analysis identified a series of factors that were generally present in good to great companies and absent in the control organizations. In brief, they were: building a culture of discipline, making change through gradual and consistent improvement, having a leader with a paradoxical blend of personal humility and professional will, and relentlessly focusing on hiring and nurturing the best employees. Over 6000 articles and 5 years of analysis support these conclusions.8
EFFORTS TO DATE TO ANALYZE HEALTHCARE ORGANIZATIONAL CHARACTERISTICS
We reviewed a convenience sample of the literature on organizational change in healthcare, and found only 1 study that utilized a similar methodology to that of Good to Great: an analysis of the academic medical centers that participate in the University HealthSystem Consortium (UHC). Drawing inspiration from Collins' methodologies, the UHC study developed a holistic measure of quality, based on safety, mortality, compliance with evidence‐based practices, and equity of care. Using these criteria, the investigators selected 3 UHC member organizations that were performing extremely well, and 3 others performing toward the middle and bottom of the pack. Experts on health system organization then conducted detailed site visits to these 6 academic medical centers. The researchers were blinded to these rankings at the time of the visits, but were able to perfectly predict which cohort the organizations were in.
The investigators analyzed the factors that seemed to be present in the top‐performing organizations, but were absent in the laggards, and found: hospital leadership emphasizing a patients‐first mission, an alignment of departmental objectives to reduce conflict, a concrete accountability structure for quality, a relentless focus on measurable improvement, and a culture promoting interprofessional collaboration on quality.10
While the UHC study is among the most robust exploration of healthcare organization dynamics in the literature, it has a few limitations. The first is that it studied a small, relatively specialized population: UHC members, which are large, mostly urban, well‐resourced teaching hospitals. While studying segments of populations can limit the generalizability of some of the UHC studies' findings, their approach can be a useful model to apply to studying other types of healthcare institutions. (And, to be fair, Good to Great also studies a specialized populationFortune 500 companiesand thus its lessons need to be extrapolated to other businesses, such as small companies, with a degree of caution.) The study also suffers from the relative paucity of publicly accessible organizational data in healthcare. The fact that the UHC investigators depended on both top‐performing and laggard hospitals, to voluntarily release their organizational data and permit a detailed site visit, potentially introduces a selection bias into the survey population, a bias not present in Good to Great due to Collins' protocol for matching cases and controls.
There have been several other efforts, using different methods, to determine organizational predictors of success in healthcare. The results of several important studies are shown in Table 3. Taken together, they indicate that higher performing organizations make practitioners accountable for performance measurements, and implement systems designed to both reduce errors and facilitate adherence to evidence‐based guidelines. In addition to these studies, several consulting organizations and foundations have performed focused reviews of high‐performing healthcare organizations in an effort to identify key success factors.11 These studies, while elucidating factors that influence organizational performance, suffer from variable quality measures and subjective methods for gathering organizational data, both of which are addressed within a good to great‐style analysis.12
| Study | Key Findings |
|---|---|
| |
| Keroack et al.10 | Superior‐performing organizations were distinguished from average ones by having: hospital leadership emphasizing a patients‐first mission, an alignment of departmental objectives to reduce conflict, concrete accountability structures for quality, a relentless focus on measurable improvement, and a culture promoting interprofessional collaboration toward quality improvement measures. |
| Jha et al.22 | Factors that led to the VA's improved performance included: |
| Implementation of a systematic approach to measurement, management, and accountability for quality. | |
| Initiating routine performance measurements for high‐priority conditions. | |
| Creating performance contracts to hold managers accountable for meeting improvement goals. | |
| Having an independent agency gather and monitor data. | |
| Implementing process improvements, such as an integrated, comprehensive medical‐record system. | |
| Making performance data public and distributing these data widely within the VA and among other key stakeholders (veterans' service organizations, Congress). | |
| Shortell et al.20 | Focusing on reducing the barriers and encouraging the adoption of evidence‐based organizational management is associated with better patient outcomes. Examples of reducing barriers to encourage adoption of evidence‐based guidelines include: |
| Installing an IT system to improve chronic care management. | |
| Creating a culture where practitioners can help each other learn from their mistakes. | |
| Knaus et al.21 | The interaction and coordination of each hospital's ICU staff had a greater correlation with reduced mortality rates than did the unit's administrative structure, amount of specialized treatment used, or the hospital's teaching status. |
| Pronovost et al.3 | Introducing a checklist of 5 evidence‐based procedures into a healthcare team's operation can significantly reduce the rate of catheter‐associated infections. |
| Simple process change interventions, such as checklists, must be accompanied by efforts to improve team culture and create leadership accountability and engagement. | |
| Pronovost et al.30 | Implementing evidence‐based therapies by embedding them within a healthcare team's culture is more effective than simply focusing on changing physician behavior. |
| The authors proposed a 4‐step model for implementing evidence‐based therapies: select interventions with the largest benefit and lowest barriers to use, identify local barriers to implementation, measure performance, and ensure all patients receive the interventions. | |
Perhaps the best‐known study on healthcare organizational performance is The Dartmouth Atlas, an analysis that (though based on data accumulated over more than 30 years) has received tremendous public attention, in recent years, in the context of the debate over healthcare reform.13 However, by early 2010, the Dartmouth analysis was stirring controversy, with some observers expressing concerns over its focus on care toward the end of life, its methods for adjusting for case‐mix and sociodemographic predictors of outcomes and costs, and its exclusive use of Medicare data.14, 15 These limitations are also addressed by a good to great‐style analysis.
WOULD A GOOD TO GREAT ANALYSIS BE POSSIBLE IN HEALTHCARE?
While this review of prior research on organizational success factors in healthcare illustrates considerable interest in this area, none of the studies, to date, matches Good to Great in the robustness of the analysis or, obviously, its impact on the profession. Could a good to great analysis be carried out in healthcare? It is worth considering this by assessing each of Collins' 3 key steps: identifying the enterprises that made a good to great leap, selecting appropriate control organizations, and determining the factors that contributed to the successes of the former group.
Good to Great used an impressive elevation in stock price as a summary measure of organizational success. In the for‐profit business world, it is often assumed that Adam Smith's invisible hand makes corporate information available to investors, causing an organization's stock price to capture the overall success of its business strategy, including its product quality and operational efficiency.16 In the healthcare world, mostly populated by non‐profit organizations that are simultaneously working toward a bottom line and carrying out a social mission, there is no obvious equivalent to the stock price for measuring overall organizational performance and value. All of the methods for judging top hospitals, for example, are flaweda recent study found that the widely cited U.S. News & World Report's America's Best Hospitals list is largely driven by hospital reputation,17 while another study found glaring inconsistencies among methods used to calculate risk‐adjusted mortality rates.18 A generally accepted set of metrics defining the value of care produced by a healthcare organization (including quality, safety, access, patient satisfaction, and efficiency) would be needed to mirror the first good to great step: defining top‐performing organizations using a gold standard.19 The summary measure used in the UHC study is the closest we have seen to a good to great‐style summary performance measure in healthcare.10
While it is important to identify a gold‐standard measure of organizational quality, careful selection of a control organization may be the most important step in conducting a good to great analysis. Although Collins' use of stock price as a summary measure of organizational performance is the best measure available in business, it is by no means perfect. Despite this shortcoming, however, Collins believes that the central requirement is not finding a perfect measure of organizational success, but rather determining what correlates with a divergence of performance in stock price (J. Collins, oral communication, July 2010). Similar to clinical trials, meticulous matching of a good to great organization with a control has the advantage of canceling out extraneous environmental factors, thereby enabling the elucidation of organizational factors that contribute to divergent performance. Good to Great's methods depended on substantial historical background to define top performers and controls. Unfortunately, healthcare lacks an analog to the business world's robust historical and publicly accessible record of performance and organizational data. Therefore, even if a certain organization was determined to be a top performer based on a gold‐standard measure, selecting a control organization by matching its organizational and performance data to the top performer's would be unfeasible.
Finally, the lack of a historical record in healthcare also places substantial roadblocks in the way of looking under the organization's hood. Even in pioneering organizational analyses by Shortell et al.,20 Knaus et al.,21 and Jha et al.,22 substantial parts of their analyses relied on retrospective accounts to determine organizational characteristics. To remove the bias that comes from knowing the organization's ultimate performance, Collins was careful to base his analysis of organizational structures and leadership on documents available before the good to great transition. Equivalent data in healthcare are extremely difficult to find.
While it is best to rely on an historical record, it may be possible to carry out a good to great‐type analysis through meticulous structuring of personal interviews. Collins has endorsed a non‐healthcare study that utilized the good to great matching strategy but used personal interviews to make up for lack of access to a substantial historical record.23 To reduce the bias inherent in relying on interviews, the research team ensured that the good to great transition was sustained for many years, and that the practices elicited from the interviews started before the good to great transition. Both of these techniques helped increase the probability that the identified practices contributed to the transition to superior results (in this case, in public education outcomes) and, thus, that the adoption of these practices could result in improvements elsewhere (J. Collins, oral communication, July 2010).
To make such a study possible in healthcare, more organizational data are required. Without prodding by outside stakeholders, most healthcare organizations have been reluctant to publicize performance data for fear of malpractice risk,24 or based on their belief that current data paint an incomplete or inaccurate picture of their quality.25 Trends toward required reporting of quality data (such as via Medicare's Hospital Compare Web site) offer hope that future comparisons could rely on robust organizational quality and safety data. Instituting healthcare analogs to Securities & Exchange Commission (SEC) reporting mandates would further ameliorate this information deficit.26
While we believe that Good to Great offers lessons relevant to healthcare, there are limitations that are worth considering. First, the extraordinary complexity of healthcare organizations makes it likely that a matched‐pair‐type study would need to be accompanied by other types of analyses, including more quantitative analyses of large datasets, to give a full picture of structural and leadership predictors of strong performance. Moreover, before embracing the good to great method, some will undoubtedly point to the demise of Circuit City and Fannie Mae (2 of the Good to Great companies; Table 2) as a cautionary note. Collins addresses this issue with the commonsensical argument that the success of a company needs to be judged in the context of the era. By way of analogy, he points to the value of studying a sports team, such as the John Wooden‐coached UCLA teams of the 1960s and 1970s, notwithstanding the less stellar performance of today's UCLA team. In fact, Collins' recent book mines some of these failures for their important lessons.27
GOOD TO GREAT IN HEALTHCARE
Breaking through healthcare's myopia to explore solutions drawn from other industries, such as checklists, simulation, and industrial approaches to quality improvement, has yielded substantial insights and catalyzed major improvements in care. Similarly, we believe that finding ways to measure the performance of healthcare organizations on both cost and quality, to learn from those organizations achieving superior performance, and to create a policy and educational environment that rewards superior performance and helps poor performers improve, is a defining issue for healthcare. This will be particularly crucial as the policy environment changestransitions to Accountable Care Organizations28 and bundled payments29 are likely to increase the pressure on healthcare organizations to learn the secrets of their better‐performing brethren. These shifts are likely to put an even greater premium on the kinds of leadership, organizational structure, and ability to adapt to a changing environment that Collins highlighted in his analysis. After all, it is under the most challenging conditions that top organizations often prove their mettle.
Although there are considerable challenges in performing a good to great analysis in healthcare (Table 4), the overall point remains: Healthcare is likely to benefit from rigorous, unbiased methods to distinguish successful from less successful organizations, to learn the lessons of both, and to apply these lessons to improvement efforts.
| Issue* | Good to Great* | What Exists in Healthcare | How Healthcare Can Fill in the Gaps |
|---|---|---|---|
| |||
| Gold standard measure of quality | Cumulative total stock return of at least 3 times the general market for the period from the transition point through 15 years. | Risk‐adjusted patient outcomes data (eg, mortality), process data (eg, appropriate medication use), structural data (eg, stroke center). | Create a more robust constellation of quality criteria to measure organizational performance (risk‐adjusted patient outcomes, avoidable deaths, adherence to evidence‐based guidelines, cost effectiveness, patient satisfaction); develop a generally accepted roll‐up measure. Of the studies we reviewed, the UHC study's summary measure was the closest representation to a good to great‐summary performance measure. |
| At the time of the selection, the good to great company still had to show an upward trend. | The study of the VA's transformation and the ongoing UHC study stand out as examples of studying the upward trends of healthcare organizations.22 | Make sure that the high‐performing healthcare organizations are still improvingas indicated by gold standard measures. Once the organizations are identified, study the methods these organizations utilized to improve their performance. | |
| The turnaround had to be company‐specific, not an industry‐wide event. | A few organizations have been lauded for transformations (such as the VA system).22 In most circumstances, organizations praised for high quality (eg, Geisinger, Mayo Clinic, Cleveland Clinic) have long‐established corporate tradition and culture that would be difficult to imitate. The VA operates within a system that is unique and not replicable by most healthcare organizations. | Healthcare needs to identify more examples like the VA turnaround, particularly examples of hospitals or healthcare organizations operating in more typical environmentssuch as a community or rural hospital. | |
| The company had to be an established enterprise, not a startup, in business for at least 10 years prior to its transition. | Most of the healthcare organizations of interest are large organizations with complex corporate cultures, not startups. | Not applicable. | |
| Comparison method | Collins selected a comparison company that was almost exactly the same as the good to great company, except for the transition. The selection criteria were business fit, size fit, age fit, stock chart fit, conservative test, and face validity.* | Healthcare organizational studies are mostly comparisons of organizations that all experience success; few studies compare high‐performing with nonhigh‐performing organizations. (Jha et al. compared Medicare data from non‐VA hospitals and the VA, but did not use similar criteria to select similar organizations22; Keroack and colleagues' comparison of 3 mediocre to 3 superior‐performing hospitals is the closest analog to the Good to Great methodology thus far.10) | Similar to the Good to Great study, a set of factors that can categorize healthcare organizations according to similarities must be devised (eg, outpatient care, inpatient care, academic affiliation, tertiary care center, patient demographics), but finding similar organizations whose performance diverged over time is challenging. |
| Analysis of factors that separated great companies from those that did not make the transition to greatness | Good to Great used annual reports, letters to shareholders, articles written about the company during the period of interest, books about the company, business school case studies, analyst reports written in real time. | Most of the research conducted thus far has been retrospective analyses of why organizations became top performers. | The historical source of data is almost nonexistent in comparison with the business world. A parallel effort would have to capture a mixture of structure and process changes, along with organizational variables. The most effective method would be a prospective organizational assessment of several organizations, following them over time to see which ones markedly improved their performance. |
- ,,, et al.The quality of health care delivered to adults in the United States.N Engl J Med.2003;348(26):2635–2645.
- ,,;for the Institute of Medicine (US), Committee on Quality of Health Care in America.To Err Is Human: Building a Safer Health System.Washington, DC:National Academy Press;1999. Available at: http://www.nap.edu/books/0309068371/html/. Accessed August 22, 2011.
- ,,, et al.An intervention to decrease catheter‐related bloodstream infections in the ICU.N Engl J Med.2006;355(26):2725–2732.
- ,,, et al.A surgical safety checklist to reduce morbidity and mortality in a global population.N Engl J Med.2009;360(5):491–499.
- ,,,,,.Using industrial processes to improve patient care.BMJ.2004;328(7432):162–164.
- ,,,,.Lean six sigma in healthcare.J Healthc Qual.2006;28(2):4–11.
- .Good to great.Fast Company. September 30,2001. Available at: http://www.fastcompany.com/magazine/51/goodtogreat.html. Accessed August 22, 2011.
- .Good to Great: Why Some Companies Make the Leap… and Others Don't.New York, NY:HarperBusiness;2001.
- .It's in the research.Jim Collins. Available at: http://www.jimcollins.com/books/research.html. Accessed May 23,2010.
- ,,,,,.Organizational factors associated with high performance in quality and safety in academic medical centers.Acad Med.2007;82(12):1178–1186.
- ,,,,.Hosptial Quality: Ingredients for Success—a Case Study of Beth Israel Deaconess Medical Center.New York, NY:Commonwealth Fund;2004. Available at: http://www.commonwealthfund.org/Content/Publications/Fund‐Reports/2004/Jul/Hospital‐Quality–Ingredients‐for‐Success‐A‐Case‐Study‐of‐Beth‐Israel‐Deaconess‐Medical‐Center. aspx. Accessed August 22, 2011.
- ,,;for the Commonwealth Fund.Hospital quality improvement strategies and lessons from U.S. hospitals.New York, NY:Commonwealth Fund;2007. Available at: http://www.commonwealthfund.org/usr_doc/Silow‐Carroll_hosp_quality_ improve_strategies_lessons_1009.pdf?section=4039. Accessed August 22, 2011.
- .The cost conundrum: what a Texas town can teach us about healthcare.The New Yorker. June 1,2009.
- .A map to bad policy—hospital efficiency measures in the Dartmouth Atlas.N Engl J Med.2010;362(7):569–574.
- ,.Critics question study cited in health debate.The New York Times. June 2,2010.
- Smith A. Campbell RH, Skinner AS, eds.An Inquiry Into the Nature and Causes of the Wealth of Nations.Oxford, England:Clarendon Press;1976.
- .The role of reputation in U.S. News 152(8):521–525.
- ,,,,.Variability in the measurement of hospital‐wide mortality rates.N Engl J Med.2010;363(26):2530–2539.
- .The elephant of patient safety: what you see depends on how you look.Jt Comm J Qual Patient Saf.2010;36(9):399–401.
- ,,.Improving patient care by linking evidence‐based medicine and evidence‐based management.JAMA.2007;298(6):673–676.
- ,,,.An evaluation of outcome from intensive care in major medical centers.Ann Intern Med.1986;104(3):410–418.
- ,,,.Effect of the transformation of the Veterans Affairs Health Care System on the quality of care.N Engl J Med.2003;348(22):2218–2227.
- ;for the Morrison Institute for Public Policy, Center for the Future of Arizona.Why Some Schools With Latino Children Beat the Odds, and Others Don't.Tempe, AZ:Morrison Institute for Public Policy;2006.
- ,,, et al.Error reporting and disclosure systems: views from hospital leaders.JAMA.2005;293(11):1359–1366.
- .Public release of performance data: a progress report from the front.JAMA.2000;283(14):1884–1886.
- ,,.The GAAP in quality measurement and reporting.JAMA.2007;298(15):1800–1802.
- .How the Mighty Fall: And Why Some Companies Never Give in.New York, NY:Jim Collins [distributed in the US and Canada exclusively by HarperCollins Publishers];2009.
- ,,,.Creating accountable care organizations: the extended hospital medical staff.Health Aff (Millwood).2007;26(1):w44–w57.
- ,,,.Using Medicare payment policy to transform the health system: a framework for improving performance.Health Aff (Millwood).2009;28(2):w238–w250.
- ,,.Translating evidence into practice: a model for large scale knowledge translation.BMJ.2008;337:a1714.
The American healthcare system produces a product whose quality, safety, reliability, and cost would be incompatible with corporate survival, were they created by a business operating in a competitive industry. Care fails to comport with best evidence nearly half of the time.1 Tens of thousands of Americans die yearly from preventable medical mistakes.2 The healthcare inflation rate is nearly twice that of the rest of the economy, rapidly outstripping the ability of employers, tax revenues, and consumers to pay the mounting bills.
Increasingly, the healthcare system is being held accountable for this lack of value. Whether through a more robust accreditation and regulatory environment, public reporting of quality and safety metrics, or pay for performance (or no pay for errors) initiatives, outside stakeholders are creating performance pressures that scarcely existed a decade ago.
Healthcare organizations and providers have begun to take notice and act, often by seeking answers from industries outside healthcare and thoughtfully importing these lessons into medicine. For example, the use of checklists has been adopted by healthcare (from aviation), with impressive results.3, 4 Many quality methods drawn from industry (Lean, Toyota, Six Sigma) have been used to try to improve performance and remove waste from complex processes.5, 6
While these efforts have been helpful, their focus has generally been at the point‐of‐careimproving the care of patients with acute myocardial infarction or decreasing readmissions. However, while the business community has long recognized that poor management and structure can thwart most efforts to improve individual processes, healthcare has paid relatively little attention to issues of organizational structure and leadership. The question arises: Could methods that have been used to learn from top‐performing businesses be helpful to healthcare's efforts to improve its own organizational performance?
In this article, we describe perhaps the best known effort to identify top‐performing corporations, compare them to carefully selected organizations that failed to achieve similar levels of performance, and glean lessons from these analyses. This effort, described in a book entitled Good to Great: Why Some Companies Make the Leapand Others Don't, has sold more than 3 million copies in its 35 languages, and is often cited by business leaders as a seminal work. We ask whether the methods of Good to Great might be applicable to healthcare organizations seeking to produce the kinds of value that patients and purchasers need and deserve.
GOOD TO GREAT METHODOLOGY
In 2001, business consultant Jim Collins published Good to Great. Its methods can be divided into 3 main components: (1) a gold standard metric to identify top organizations; (2) the creation of a control group of organizations that appeared similar to the top performers at the start of the study, but failed to match the successful organizations' performance over time; and (3) a detailed review of the methods, leadership, and structure of both the winning and laggard organizations, drawing lessons from their differences. Before discussing whether these methods could be used to analyze healthcare organizations, it is worth describing Collins' methods in more detail.
The first component of Good to Great's structure was the use of 4 metrics to identify top‐performing companies (Table 1). To select the good to great companies, Collins and his team began with a field of 1435 companies drawn from Fortune magazine's rankings of America's largest public companies. They then used the criteria in Table 1 to narrow the list to their final 11 companies, which formed the experimental group for the analysis.
|
| The company had to show a pattern of good performance punctuated by a transition point when it shifted to great performance. Great performance was defined as a cumulative total stock return of at least 3 times the general stock market for the period from the transition point through 15 years. |
| The transition from good to great had to be company‐specific, not an industry‐wide event. |
| The company had to be an established enterprise, not a startup, in business for at least 10 years prior to its transition. |
| At the time of the selection (in 1996), the company still had to show an upward trend. |
After identifying these 11 top‐performing companies, Collins created a control group, composed of companies with similar attributes that could have made the transition, but failed to do so.7 To create the control group, Collins matched and scored a pool of control group candidates based on the following criteria: similarities of business model, size, age, and cumulative stock returns prior to the good to great transition. When there were several potential controls, Collins chose companies that were larger, more profitable, and had a stronger market position and reputation prior to the transition, in order to increase the probability that the experimental companies' successes were not incidental.8 Table 2 lists the paired experimental and control companies.
| Experimental Company | Control Company |
|---|---|
| |
| Abbott | Upjohn |
| Circuit City | Silo |
| Fannie Mae | Great Western |
| Gillette | Warner‐Lambert |
| Kimberly‐Clark | Scott Paper |
| Kroger | A&P |
| Nucor | Bethlehem Steel |
| Philip Morris | R.J. Reynolds |
| Pitney Bowes | Addressograph |
| Walgreen's | Eckerd |
| Wells Fargo | Bank of America |
Finally, Collins performed a detailed historical analysis on the experimental and control groups, using materials (such as major articles published on the company, books, academic case studies, analyst reports, and financial and annual reports) that assessed the companies in real time. Good to Great relied on evidence from the period of interest (ie, accrued prior to the transition point) to avoid biases that would likely result from relying on retrospective sources of data.9
This analysis identified a series of factors that were generally present in good to great companies and absent in the control organizations. In brief, they were: building a culture of discipline, making change through gradual and consistent improvement, having a leader with a paradoxical blend of personal humility and professional will, and relentlessly focusing on hiring and nurturing the best employees. Over 6000 articles and 5 years of analysis support these conclusions.8
EFFORTS TO DATE TO ANALYZE HEALTHCARE ORGANIZATIONAL CHARACTERISTICS
We reviewed a convenience sample of the literature on organizational change in healthcare, and found only 1 study that utilized a similar methodology to that of Good to Great: an analysis of the academic medical centers that participate in the University HealthSystem Consortium (UHC). Drawing inspiration from Collins' methodologies, the UHC study developed a holistic measure of quality, based on safety, mortality, compliance with evidence‐based practices, and equity of care. Using these criteria, the investigators selected 3 UHC member organizations that were performing extremely well, and 3 others performing toward the middle and bottom of the pack. Experts on health system organization then conducted detailed site visits to these 6 academic medical centers. The researchers were blinded to these rankings at the time of the visits, but were able to perfectly predict which cohort the organizations were in.
The investigators analyzed the factors that seemed to be present in the top‐performing organizations, but were absent in the laggards, and found: hospital leadership emphasizing a patients‐first mission, an alignment of departmental objectives to reduce conflict, a concrete accountability structure for quality, a relentless focus on measurable improvement, and a culture promoting interprofessional collaboration on quality.10
While the UHC study is among the most robust exploration of healthcare organization dynamics in the literature, it has a few limitations. The first is that it studied a small, relatively specialized population: UHC members, which are large, mostly urban, well‐resourced teaching hospitals. While studying segments of populations can limit the generalizability of some of the UHC studies' findings, their approach can be a useful model to apply to studying other types of healthcare institutions. (And, to be fair, Good to Great also studies a specialized populationFortune 500 companiesand thus its lessons need to be extrapolated to other businesses, such as small companies, with a degree of caution.) The study also suffers from the relative paucity of publicly accessible organizational data in healthcare. The fact that the UHC investigators depended on both top‐performing and laggard hospitals, to voluntarily release their organizational data and permit a detailed site visit, potentially introduces a selection bias into the survey population, a bias not present in Good to Great due to Collins' protocol for matching cases and controls.
There have been several other efforts, using different methods, to determine organizational predictors of success in healthcare. The results of several important studies are shown in Table 3. Taken together, they indicate that higher performing organizations make practitioners accountable for performance measurements, and implement systems designed to both reduce errors and facilitate adherence to evidence‐based guidelines. In addition to these studies, several consulting organizations and foundations have performed focused reviews of high‐performing healthcare organizations in an effort to identify key success factors.11 These studies, while elucidating factors that influence organizational performance, suffer from variable quality measures and subjective methods for gathering organizational data, both of which are addressed within a good to great‐style analysis.12
| Study | Key Findings |
|---|---|
| |
| Keroack et al.10 | Superior‐performing organizations were distinguished from average ones by having: hospital leadership emphasizing a patients‐first mission, an alignment of departmental objectives to reduce conflict, concrete accountability structures for quality, a relentless focus on measurable improvement, and a culture promoting interprofessional collaboration toward quality improvement measures. |
| Jha et al.22 | Factors that led to the VA's improved performance included: |
| Implementation of a systematic approach to measurement, management, and accountability for quality. | |
| Initiating routine performance measurements for high‐priority conditions. | |
| Creating performance contracts to hold managers accountable for meeting improvement goals. | |
| Having an independent agency gather and monitor data. | |
| Implementing process improvements, such as an integrated, comprehensive medical‐record system. | |
| Making performance data public and distributing these data widely within the VA and among other key stakeholders (veterans' service organizations, Congress). | |
| Shortell et al.20 | Focusing on reducing the barriers and encouraging the adoption of evidence‐based organizational management is associated with better patient outcomes. Examples of reducing barriers to encourage adoption of evidence‐based guidelines include: |
| Installing an IT system to improve chronic care management. | |
| Creating a culture where practitioners can help each other learn from their mistakes. | |
| Knaus et al.21 | The interaction and coordination of each hospital's ICU staff had a greater correlation with reduced mortality rates than did the unit's administrative structure, amount of specialized treatment used, or the hospital's teaching status. |
| Pronovost et al.3 | Introducing a checklist of 5 evidence‐based procedures into a healthcare team's operation can significantly reduce the rate of catheter‐associated infections. |
| Simple process change interventions, such as checklists, must be accompanied by efforts to improve team culture and create leadership accountability and engagement. | |
| Pronovost et al.30 | Implementing evidence‐based therapies by embedding them within a healthcare team's culture is more effective than simply focusing on changing physician behavior. |
| The authors proposed a 4‐step model for implementing evidence‐based therapies: select interventions with the largest benefit and lowest barriers to use, identify local barriers to implementation, measure performance, and ensure all patients receive the interventions. | |
Perhaps the best‐known study on healthcare organizational performance is The Dartmouth Atlas, an analysis that (though based on data accumulated over more than 30 years) has received tremendous public attention, in recent years, in the context of the debate over healthcare reform.13 However, by early 2010, the Dartmouth analysis was stirring controversy, with some observers expressing concerns over its focus on care toward the end of life, its methods for adjusting for case‐mix and sociodemographic predictors of outcomes and costs, and its exclusive use of Medicare data.14, 15 These limitations are also addressed by a good to great‐style analysis.
WOULD A GOOD TO GREAT ANALYSIS BE POSSIBLE IN HEALTHCARE?
While this review of prior research on organizational success factors in healthcare illustrates considerable interest in this area, none of the studies, to date, matches Good to Great in the robustness of the analysis or, obviously, its impact on the profession. Could a good to great analysis be carried out in healthcare? It is worth considering this by assessing each of Collins' 3 key steps: identifying the enterprises that made a good to great leap, selecting appropriate control organizations, and determining the factors that contributed to the successes of the former group.
Good to Great used an impressive elevation in stock price as a summary measure of organizational success. In the for‐profit business world, it is often assumed that Adam Smith's invisible hand makes corporate information available to investors, causing an organization's stock price to capture the overall success of its business strategy, including its product quality and operational efficiency.16 In the healthcare world, mostly populated by non‐profit organizations that are simultaneously working toward a bottom line and carrying out a social mission, there is no obvious equivalent to the stock price for measuring overall organizational performance and value. All of the methods for judging top hospitals, for example, are flaweda recent study found that the widely cited U.S. News & World Report's America's Best Hospitals list is largely driven by hospital reputation,17 while another study found glaring inconsistencies among methods used to calculate risk‐adjusted mortality rates.18 A generally accepted set of metrics defining the value of care produced by a healthcare organization (including quality, safety, access, patient satisfaction, and efficiency) would be needed to mirror the first good to great step: defining top‐performing organizations using a gold standard.19 The summary measure used in the UHC study is the closest we have seen to a good to great‐style summary performance measure in healthcare.10
While it is important to identify a gold‐standard measure of organizational quality, careful selection of a control organization may be the most important step in conducting a good to great analysis. Although Collins' use of stock price as a summary measure of organizational performance is the best measure available in business, it is by no means perfect. Despite this shortcoming, however, Collins believes that the central requirement is not finding a perfect measure of organizational success, but rather determining what correlates with a divergence of performance in stock price (J. Collins, oral communication, July 2010). Similar to clinical trials, meticulous matching of a good to great organization with a control has the advantage of canceling out extraneous environmental factors, thereby enabling the elucidation of organizational factors that contribute to divergent performance. Good to Great's methods depended on substantial historical background to define top performers and controls. Unfortunately, healthcare lacks an analog to the business world's robust historical and publicly accessible record of performance and organizational data. Therefore, even if a certain organization was determined to be a top performer based on a gold‐standard measure, selecting a control organization by matching its organizational and performance data to the top performer's would be unfeasible.
Finally, the lack of a historical record in healthcare also places substantial roadblocks in the way of looking under the organization's hood. Even in pioneering organizational analyses by Shortell et al.,20 Knaus et al.,21 and Jha et al.,22 substantial parts of their analyses relied on retrospective accounts to determine organizational characteristics. To remove the bias that comes from knowing the organization's ultimate performance, Collins was careful to base his analysis of organizational structures and leadership on documents available before the good to great transition. Equivalent data in healthcare are extremely difficult to find.
While it is best to rely on an historical record, it may be possible to carry out a good to great‐type analysis through meticulous structuring of personal interviews. Collins has endorsed a non‐healthcare study that utilized the good to great matching strategy but used personal interviews to make up for lack of access to a substantial historical record.23 To reduce the bias inherent in relying on interviews, the research team ensured that the good to great transition was sustained for many years, and that the practices elicited from the interviews started before the good to great transition. Both of these techniques helped increase the probability that the identified practices contributed to the transition to superior results (in this case, in public education outcomes) and, thus, that the adoption of these practices could result in improvements elsewhere (J. Collins, oral communication, July 2010).
To make such a study possible in healthcare, more organizational data are required. Without prodding by outside stakeholders, most healthcare organizations have been reluctant to publicize performance data for fear of malpractice risk,24 or based on their belief that current data paint an incomplete or inaccurate picture of their quality.25 Trends toward required reporting of quality data (such as via Medicare's Hospital Compare Web site) offer hope that future comparisons could rely on robust organizational quality and safety data. Instituting healthcare analogs to Securities & Exchange Commission (SEC) reporting mandates would further ameliorate this information deficit.26
While we believe that Good to Great offers lessons relevant to healthcare, there are limitations that are worth considering. First, the extraordinary complexity of healthcare organizations makes it likely that a matched‐pair‐type study would need to be accompanied by other types of analyses, including more quantitative analyses of large datasets, to give a full picture of structural and leadership predictors of strong performance. Moreover, before embracing the good to great method, some will undoubtedly point to the demise of Circuit City and Fannie Mae (2 of the Good to Great companies; Table 2) as a cautionary note. Collins addresses this issue with the commonsensical argument that the success of a company needs to be judged in the context of the era. By way of analogy, he points to the value of studying a sports team, such as the John Wooden‐coached UCLA teams of the 1960s and 1970s, notwithstanding the less stellar performance of today's UCLA team. In fact, Collins' recent book mines some of these failures for their important lessons.27
GOOD TO GREAT IN HEALTHCARE
Breaking through healthcare's myopia to explore solutions drawn from other industries, such as checklists, simulation, and industrial approaches to quality improvement, has yielded substantial insights and catalyzed major improvements in care. Similarly, we believe that finding ways to measure the performance of healthcare organizations on both cost and quality, to learn from those organizations achieving superior performance, and to create a policy and educational environment that rewards superior performance and helps poor performers improve, is a defining issue for healthcare. This will be particularly crucial as the policy environment changestransitions to Accountable Care Organizations28 and bundled payments29 are likely to increase the pressure on healthcare organizations to learn the secrets of their better‐performing brethren. These shifts are likely to put an even greater premium on the kinds of leadership, organizational structure, and ability to adapt to a changing environment that Collins highlighted in his analysis. After all, it is under the most challenging conditions that top organizations often prove their mettle.
Although there are considerable challenges in performing a good to great analysis in healthcare (Table 4), the overall point remains: Healthcare is likely to benefit from rigorous, unbiased methods to distinguish successful from less successful organizations, to learn the lessons of both, and to apply these lessons to improvement efforts.
| Issue* | Good to Great* | What Exists in Healthcare | How Healthcare Can Fill in the Gaps |
|---|---|---|---|
| |||
| Gold standard measure of quality | Cumulative total stock return of at least 3 times the general market for the period from the transition point through 15 years. | Risk‐adjusted patient outcomes data (eg, mortality), process data (eg, appropriate medication use), structural data (eg, stroke center). | Create a more robust constellation of quality criteria to measure organizational performance (risk‐adjusted patient outcomes, avoidable deaths, adherence to evidence‐based guidelines, cost effectiveness, patient satisfaction); develop a generally accepted roll‐up measure. Of the studies we reviewed, the UHC study's summary measure was the closest representation to a good to great‐summary performance measure. |
| At the time of the selection, the good to great company still had to show an upward trend. | The study of the VA's transformation and the ongoing UHC study stand out as examples of studying the upward trends of healthcare organizations.22 | Make sure that the high‐performing healthcare organizations are still improvingas indicated by gold standard measures. Once the organizations are identified, study the methods these organizations utilized to improve their performance. | |
| The turnaround had to be company‐specific, not an industry‐wide event. | A few organizations have been lauded for transformations (such as the VA system).22 In most circumstances, organizations praised for high quality (eg, Geisinger, Mayo Clinic, Cleveland Clinic) have long‐established corporate tradition and culture that would be difficult to imitate. The VA operates within a system that is unique and not replicable by most healthcare organizations. | Healthcare needs to identify more examples like the VA turnaround, particularly examples of hospitals or healthcare organizations operating in more typical environmentssuch as a community or rural hospital. | |
| The company had to be an established enterprise, not a startup, in business for at least 10 years prior to its transition. | Most of the healthcare organizations of interest are large organizations with complex corporate cultures, not startups. | Not applicable. | |
| Comparison method | Collins selected a comparison company that was almost exactly the same as the good to great company, except for the transition. The selection criteria were business fit, size fit, age fit, stock chart fit, conservative test, and face validity.* | Healthcare organizational studies are mostly comparisons of organizations that all experience success; few studies compare high‐performing with nonhigh‐performing organizations. (Jha et al. compared Medicare data from non‐VA hospitals and the VA, but did not use similar criteria to select similar organizations22; Keroack and colleagues' comparison of 3 mediocre to 3 superior‐performing hospitals is the closest analog to the Good to Great methodology thus far.10) | Similar to the Good to Great study, a set of factors that can categorize healthcare organizations according to similarities must be devised (eg, outpatient care, inpatient care, academic affiliation, tertiary care center, patient demographics), but finding similar organizations whose performance diverged over time is challenging. |
| Analysis of factors that separated great companies from those that did not make the transition to greatness | Good to Great used annual reports, letters to shareholders, articles written about the company during the period of interest, books about the company, business school case studies, analyst reports written in real time. | Most of the research conducted thus far has been retrospective analyses of why organizations became top performers. | The historical source of data is almost nonexistent in comparison with the business world. A parallel effort would have to capture a mixture of structure and process changes, along with organizational variables. The most effective method would be a prospective organizational assessment of several organizations, following them over time to see which ones markedly improved their performance. |
- ,,, et al.The quality of health care delivered to adults in the United States.N Engl J Med.2003;348(26):2635–2645.
- ,,;for the Institute of Medicine (US), Committee on Quality of Health Care in America.To Err Is Human: Building a Safer Health System.Washington, DC:National Academy Press;1999. Available at: http://www.nap.edu/books/0309068371/html/. Accessed August 22, 2011.
- ,,, et al.An intervention to decrease catheter‐related bloodstream infections in the ICU.N Engl J Med.2006;355(26):2725–2732.
- ,,, et al.A surgical safety checklist to reduce morbidity and mortality in a global population.N Engl J Med.2009;360(5):491–499.
- ,,,,,.Using industrial processes to improve patient care.BMJ.2004;328(7432):162–164.
- ,,,,.Lean six sigma in healthcare.J Healthc Qual.2006;28(2):4–11.
- .Good to great.Fast Company. September 30,2001. Available at: http://www.fastcompany.com/magazine/51/goodtogreat.html. Accessed August 22, 2011.
- .Good to Great: Why Some Companies Make the Leap… and Others Don't.New York, NY:HarperBusiness;2001.
- .It's in the research.Jim Collins. Available at: http://www.jimcollins.com/books/research.html. Accessed May 23,2010.
- ,,,,,.Organizational factors associated with high performance in quality and safety in academic medical centers.Acad Med.2007;82(12):1178–1186.
- ,,,,.Hosptial Quality: Ingredients for Success—a Case Study of Beth Israel Deaconess Medical Center.New York, NY:Commonwealth Fund;2004. Available at: http://www.commonwealthfund.org/Content/Publications/Fund‐Reports/2004/Jul/Hospital‐Quality–Ingredients‐for‐Success‐A‐Case‐Study‐of‐Beth‐Israel‐Deaconess‐Medical‐Center. aspx. Accessed August 22, 2011.
- ,,;for the Commonwealth Fund.Hospital quality improvement strategies and lessons from U.S. hospitals.New York, NY:Commonwealth Fund;2007. Available at: http://www.commonwealthfund.org/usr_doc/Silow‐Carroll_hosp_quality_ improve_strategies_lessons_1009.pdf?section=4039. Accessed August 22, 2011.
- .The cost conundrum: what a Texas town can teach us about healthcare.The New Yorker. June 1,2009.
- .A map to bad policy—hospital efficiency measures in the Dartmouth Atlas.N Engl J Med.2010;362(7):569–574.
- ,.Critics question study cited in health debate.The New York Times. June 2,2010.
- Smith A. Campbell RH, Skinner AS, eds.An Inquiry Into the Nature and Causes of the Wealth of Nations.Oxford, England:Clarendon Press;1976.
- .The role of reputation in U.S. News 152(8):521–525.
- ,,,,.Variability in the measurement of hospital‐wide mortality rates.N Engl J Med.2010;363(26):2530–2539.
- .The elephant of patient safety: what you see depends on how you look.Jt Comm J Qual Patient Saf.2010;36(9):399–401.
- ,,.Improving patient care by linking evidence‐based medicine and evidence‐based management.JAMA.2007;298(6):673–676.
- ,,,.An evaluation of outcome from intensive care in major medical centers.Ann Intern Med.1986;104(3):410–418.
- ,,,.Effect of the transformation of the Veterans Affairs Health Care System on the quality of care.N Engl J Med.2003;348(22):2218–2227.
- ;for the Morrison Institute for Public Policy, Center for the Future of Arizona.Why Some Schools With Latino Children Beat the Odds, and Others Don't.Tempe, AZ:Morrison Institute for Public Policy;2006.
- ,,, et al.Error reporting and disclosure systems: views from hospital leaders.JAMA.2005;293(11):1359–1366.
- .Public release of performance data: a progress report from the front.JAMA.2000;283(14):1884–1886.
- ,,.The GAAP in quality measurement and reporting.JAMA.2007;298(15):1800–1802.
- .How the Mighty Fall: And Why Some Companies Never Give in.New York, NY:Jim Collins [distributed in the US and Canada exclusively by HarperCollins Publishers];2009.
- ,,,.Creating accountable care organizations: the extended hospital medical staff.Health Aff (Millwood).2007;26(1):w44–w57.
- ,,,.Using Medicare payment policy to transform the health system: a framework for improving performance.Health Aff (Millwood).2009;28(2):w238–w250.
- ,,.Translating evidence into practice: a model for large scale knowledge translation.BMJ.2008;337:a1714.
Hospital Performance Trends
The Joint Commission (TJC) currently accredits approximately 4546 acute care, critical access, and specialty hospitals,1 accounting for approximately 82% of U.S. hospitals (representing 92% of hospital beds). Hospitals seeking to earn and maintain accreditation undergo unannounced on‐site visits by a team of Joint Commission surveyors at least once every 3 years. These surveys address a variety of domains, including the environment of care, infection prevention and control, information management, adherence to a series of national patient safety goals, and leadership.1
The survey process has changed markedly in recent years. Since 2002, accredited hospitals have been required to continuously collect and submit selected performance measure data to The Joint Commission throughout the three‐year accreditation cycle. The tracer methodology, an evaluation method in which surveyors select a patient to follow through the organization in order to assess compliance with selected standards, was instituted in 2004. Soon thereafter, on‐site surveys went from announced to unannounced in 2006.
Despite the 50+ year history of hospital accreditation in the United States, there has been surprisingly little research on the link between accreditation status and measures of hospital quality (both processes and outcomes). It is only recently that a growing number of studies have attempted to examine this relationship. Empirical support for the relationship between accreditation and other quality measures is emerging. Accredited hospitals have been shown to provide better emergency response planning2 and training3 compared to non‐accredited hospitals. Accreditation has been observed to be a key predictor of patient safety system implementation4 and the primary driver of hospitals' patient‐safety initiatives.5 Accredited trauma centers have been associated with significant reductions in patient mortality,6 and accreditation has been linked to better compliance with evidence‐based methadone and substance abuse treatment.7, 8 Accredited hospitals have been shown to perform better on measures of hospital quality in acute myocardial infarction (AMI), heart failure, and pneumonia care.9, 10 Similarly, accreditation has been associated with lower risk‐adjusted in‐hospital mortality rates for congestive heart failure (CHF), stroke, and pneumonia.11, 12 The results of such research, however, have not always been consistent. Several studies have been unable to demonstrate a relationship between accreditation and quality measures. A study of financial and cost‐related outcome measures found no relationship to accreditation,13 and a study comparing medication error rates across different types of organizations found no relationship to accreditation status.14 Similarly, a comparison of accredited versus non‐accredited ambulatory surgical organizations found that patients were less likely to be hospitalized when treated at an accredited facility for colonoscopy procedures, but no such relationship was observed for the other 4 procedures studied.15
While the research to date has been generally supportive of the link between accreditation and other measures of health care quality, the studies were typically limited to only a few measures and/or involved relatively small samples of accredited and non‐accredited organizations. Over the last decade, however, changes in the performance measurement landscape have created previously unavailable opportunities to more robustly examine the relationship between accreditation and other indicators of hospital quality.
At about the same time that The Joint Commission's accreditation process was becoming more vigorous, the Centers for Medicare and Medicaid Services (CMS) began a program of publicly reporting quality data (
By using a population of hospitals and a range of standardized quality measures greater than those used in previous studies, we seek to address the following questions: Is Joint Commission accreditation status truly associated with higher quality care? And does accreditation status help identify hospitals that are more likely to improve their quality and safety over time?
METHODS
Performance Measures
Since July 2002, U.S. hospitals have been collecting data on standardized measures of quality developed by The Joint Commission and CMS. These measures have been endorsed by the National Quality Forum16 and adopted by the Hospital Quality Alliance.17 The first peer‐reviewed reports using The Joint Commission/CMS measure data confirmed that the measures could successfully monitor and track hospital improvement and identify disparities in performance,18, 19 as called for by the Institute of Medicine's (IOM) landmark 2001 report, Crossing the Quality Chasm.20
In order to promote transparency in health care, both CMSthrough the efforts of the Hospital Quality Allianceand The Joint Commission began publicly reporting measure rates in 2004 using identical measure and data element specifications. It is important to note that during the five‐year span covered by this study, both The Joint Commission and CMS emphasized the reporting of performance measure data. While performance improvement has been the clear objective of these efforts, neither organization established targets for measure rates or set benchmarks for performance improvement. Similarly, while Joint Commission‐accredited hospitals were required to submit performance measure data as a condition of accreditation, their actual performance on the measure rates did not factor into the accreditation decision. In the absence of such direct leverage, it is interesting to note that several studies have demonstrated the positive impact of public reporting on hospital performance,21 and on providing useful information to the general public and health care professionals regarding hospital quality.22
The 16 measures used in this study address hospital compliance with evidence‐based processes of care recommended by the clinical treatment guidelines of respected professional societies.23 Process of care measures are particularly well suited for quality improvement purposes, as they can identify deficiencies which can be immediately addressed by hospitals and do not require risk‐adjustment, as opposed to outcome measures, which do not necessarily directly identify obvious performance improvement opportunities.2426 The measures were also implemented in sets in order to provide hospitals with a more complete portrayal of quality than might be provided using unrelated individual measures. Research has demonstrated that greater collective performance on these process measures is associated with improved one‐year survival after heart failure hospitalization27 and inpatient mortality for those Medicare patients discharged with acute myocardial infarction, heart failure, and pneumonia,28 while other research has shown little association with short‐term outcomes.29
Using the Specifications Manual for National Hospital Inpatient Quality Measures,16 hospitals identify the initial measure populations through International Classification of Diseases (ICD‐CM‐9) codes and patient age obtained through administrative data. Trained abstractors then collect the data for measure‐specific data elements through medical record review on the identified measure population or a sample of this population. Measure algorithms then identify patients in the numerator and denominator of each measure.
Process measure rates reflect the number of times a hospital treated a patient in a manner consistent with specific evidence‐based clinical practice guidelines (numerator cases), divided by the number of patients who were eligible to receive such care (denominator cases). Because precise measure specifications permit the exclusion of patients contraindicated to receive the specific process of care for the measure, ideal performance should be characterized by measure rates that approach 100% (although rare or unpredictable situations, and the reality that no measure is perfect in its design, make consistent performance at 100% improbable). Accuracy of the measure data, as measured by data element agreement rates on reabstraction, has been reported to exceed 90%.30
In addition to the individual performance measures, hospital performance was assessed using 3 condition‐specific summary scores, one for each of the 3 clinical areas: acute myocardial infarction, heart failure, and pneumonia. The summary scores are a weighted average of the individual measure rates in the clinical area, where the weights are the sample sizes for each of the measures.31 A summary score was also calculated based on all 16 measures as a summary measure of overall compliance with recommended care.
One way of studying performance measurement in a way that relates to standards is to evaluate whether a hospital achieves a high rate of performance, where high is defined as a performance rate of 90% or more. In this context, measures were created from each of the 2004 and 2008 hospital performance rates by dichotomizing them as being either less than 90%, or greater than or equal to 90%.32
Data Sources
The data for the measures included in the study are available on the CMS Hospital Compare public databases or The Joint Commission for discharges in 2004 and 2008.33 These 16 measures, active for all 5 years of the study period, include: 7 measures related to acute myocardial infarction care; 4 measures related to heart failure care; and 5 measures related to pneumonia care. The majority of the performance data for the study were obtained from the yearly CMS Hospital Compare public download databases (
Hospital Characteristics
We then linked the CMS performance data, augmented by The Joint Commission performance data when necessary, to hospital characteristics data in the American Hospital Association (AHA) Annual Survey with respect to profit status, number of beds (<100 beds, 100299 beds, 300+ beds), rural status, geographic region, and whether or not the hospital was a critical access hospital. (Teaching status, although available in the AHA database, was not used in the analysis, as almost all teaching hospitals are Joint Commission accredited.) These characteristics were chosen since previous research has identified them as being associated with hospital quality.9, 19, 3437 Data on accreditation status were obtained from The Joint Commission's hospital accreditation database. Hospitals were grouped into 3 hospital accreditation strata based on longitudinal hospital accreditation status between 2004 and 2008: 1) hospitals not accredited in the study period; 2) hospitals accredited between one to four years; and 3) hospitals accredited for the entire study period. Analyses of this middle group (those hospitals accredited for part of the study period; n = 212, 5.4% of the whole sample) led to no significant change in our findings (their performance tended to be midway between always accredited and never‐accredited hospitals) and are thus omitted from our results. Instead, we present only hospitals who were never accredited (n = 762) and those who were accredited through the entire study period (n = 2917).
Statistical Analysis
We assessed the relationship between hospital characteristics and 2004 performance of Joint Commission‐accredited hospitals with hospitals that were not Joint Commission accredited using 2 tests for categorical variables and t tests for continuous variables. Linear regression was used to estimate the five‐year change in performance at each hospital as a function of accreditation group, controlling for hospital characteristics. Baseline hospital performance was also included in the regression models to control for ceiling effects for those hospitals with high baseline performance. To summarize the results, we used the regression models to calculate adjusted change in performance for each accreditation group, and calculated a 95% confidence interval and P value for the difference between the adjusted change scores, using bootstrap methods.38
Next we analyzed the association between accreditation and the likelihood of high 2008 hospital performance by dichotomizing the hospital rates, using a 90% cut point, and using logistic regression to estimate the probability of high performance as a function of accreditation group, controlling for hospital characteristics and baseline hospital performance. The logistic models were then used to calculate adjusted rates of high performance for each accreditation group in presenting the results.
We used two‐sided tests for significance; P < 0.05 was considered statistically significant. This study had no external funding source.
RESULTS
For the 16 individual measures used in this study, a total of 4798 hospitals participated in Hospital Compare or reported data to The Joint Commission in 2004 or 2008. Of these, 907 were excluded because the performance data were not available for either 2004 (576 hospitals) or 2008 (331 hospitals) resulting in a missing value for the change in performance score. Therefore, 3891 hospitals (81%) were included in the final analyses. The 907 excluded hospitals were more likely to be rural (50.8% vs 17.5%), be critical access hospitals (53.9% vs 13.9%), have less than 100 beds (77.4% vs 37.6%), be government owned (34.6% vs 22.1%), be for profit (61.4% vs 49.5%), or be unaccredited (79.8% vs 45.8% in 2004; 75.6% vs 12.8% in 2008), compared with the included hospitals (P < 0.001 for all comparisons).
Hospital Performance at Baseline
Joint Commission‐accredited hospitals were more likely to be large, for profit, or urban, and less likely to be government owned, from the Midwest, or critical access (Table 1). Non‐accredited hospitals performed more poorly than accredited hospitals on most of the publicly reported measures in 2004; the only exception is the timing of initial antibiotic therapy measure for pneumonia (Table 2).
| Characteristic | Non‐Accredited (n = 786) | Accredited (n = 3105) | P Value* |
|---|---|---|---|
| |||
| Profit status, No. (%) | <0.001 | ||
| For profit | 60 (7.6) | 586 (18.9) | |
| Government | 289 (36.8) | 569 (18.3) | |
| Not for profit | 437 (55.6) | 1,950 (62.8) | |
| Census region, No. (%) | <0.001 | ||
| Northeast | 72 (9.2) | 497 (16.0) | |
| Midwest | 345 (43.9) | 716 (23.1) | |
| South | 248 (31.6) | 1,291 (41.6) | |
| West | 121 (15.4) | 601 (19.4) | |
| Rural setting, No. (%) | <0.001 | ||
| Rural | 495 (63.0) | 833 (26.8) | |
| Urban | 291 (37.0) | 2,272 (73.2) | |
| Bed size | <0.001 | ||
| <100 beds | 603 (76.7) | 861 (27.7) | |
| 100299 beds | 158 (20.1) | 1,444 (46.5) | |
| 300+ beds | 25 (3.2) | 800 (25.8) | |
| Critical access hospital status, No. (%) | <0.001 | ||
| Critical access hospital | 376 (47.8) | 164 (5.3) | |
| Acute care hospital | 410 (52.2) | 2,941 (94.7) | |
| Quality Measure, Mean (SD)* | 2004 | 2008 | ||||
|---|---|---|---|---|---|---|
| Non‐Accredited | Accredited | P Value | Non‐Accredited | Accredited | P Value | |
| (n = 786) | (n = 3105) | (n = 950) | (n = 2,941) | |||
| ||||||
| AMI | ||||||
| Aspirin at admission | 87.1 (20.0) | 92.6 (9.4) | <0.001 | 88.6 (22.1) | 96.0 (8.6) | <0.001 |
| Aspirin at discharge | 81.2 (26.1) | 88.5 (14.9) | <0.001 | 87.8 (22.7) | 94.8 (10.1) | <0.001 |
| ACE inhibitor for LV dysfunction | 72.1 (33.4) | 76.7 (22.9) | 0.010 | 83.2 (30.5) | 92.1 (14.8) | <0.001 |
| Beta blocker at discharge | 78.2 (27.9) | 87.0 (16.2) | <0.001 | 87.4 (23.4) | 95.5 (9.9) | <0.001 |
| Smoking cessation advice | 59.6 (40.8) | 74.5 (29.9) | <0.001 | 87.2 (29.5) | 97.2 (11.3) | <0.001 |
| PCI received within 90 min | 60.3 (26.2) | 60.6 (23.8) | 0.946 | 70.1 (24.8) | 77.7 (19.2) | 0.006 |
| Thrombolytic agent within 30 min | 27.9 (35.5) | 32.1 (32.8) | 0.152 | 31.4 (40.7) | 43.7 (40.2) | 0.008 |
| Composite AMI score | 80.6 (20.3) | 87.7 (10.4) | <0.001 | 85.8 (20.0) | 94.6 (8.1) | <0.001 |
| Heart failure | ||||||
| Discharge instructions | 36.8 (32.3) | 49.7 (28.2) | <0.001 | 67.4 (29.6) | 82.3 (16.4) | <0.001 |
| Assessment of LV function | 63.3 (27.6) | 83.6 (14.9) | <0.001 | 79.6 (24.4) | 95.6 (8.1) | <0.001 |
| ACE inhibitor for LV dysfunction | 70.8 (27.6) | 75.7 (16.3) | <0.001 | 82.5 (22.7) | 91.5 (9.7) | <0.001 |
| Smoking cessation advice | 57.1 (36.4) | 68.6 (26.2) | <0.001 | 81.5 (29.9) | 96.1 (10.7) | <0.001 |
| Composite heart failure score | 56.3 (24.1) | 71.2 (15.6) | <0.001 | 75.4 (22.3) | 90.4 (9.4) | <0.001 |
| Pneumonia | ||||||
| Oxygenation assessment | 97.4 (7.3) | 98.4 (4.0) | <0.001 | 99.0 (3.2) | 99.7 (1.2) | <0.001 |
| Pneumococcal vaccination | 45.5 (29.0) | 48.7 (26.2) | 0.007 | 79.9 (21.3) | 87.9 (12.9) | <0.001 |
| Timing of initial antibiotic therapy | 80.6 (13.1) | 70.9 (14.0) | <0.001 | 93.4 (9.2) | 93.6 (6.1) | 0.525 |
| Smoking cessation advice | 56.6 (33.1) | 65.7 (24.8) | <0.001 | 81.6 (25.1) | 94.4 (11.4) | <0.001 |
| Initial antibiotic selection | 73.6 (19.6) | 74.1 (13.4) | 0.508 | 86.1 (13.8) | 88.6 (8.7) | <0.001 |
| Composite pneumonia score | 77.2 (10.2) | 76.6 (8.2) | 0.119 | 90.0 (9.6) | 93.6 (4.9) | <0.001 |
| Overall composite | 73.7 (10.6) | 78.0 (8.7) | <0.001 | 86.8 (11.1) | 93.3 (5.0) | <0.001 |
Five‐Year Changes in Hospital Performance
Between 2004 and 2008, Joint Commission‐accredited hospitals improved their performance more than did non‐accredited hospitals (Table 3). After adjustment for baseline characteristics previously shown to be associated with performance, the overall relative (absolute) difference in improvement was 26% (4.2%) (AMI score difference 67% [3.9%], CHF 48% [10.1%], and pneumonia 21% [3.7%]). Accredited hospitals improved their performance significantly more than non‐accredited for 13 of the 16 individual performance measures.
| Characteristic | Change in Performance* | Absolute Difference, Always vs Never (95% CI) | Relative Difference, % Always vs Never | P Value | |
|---|---|---|---|---|---|
| Never Accredited (n = 762) | Always Accredited (n = 2,917) | ||||
| |||||
| AMI | |||||
| Aspirin at admission | 1.1 | 2.0 | 3.2 (1.25.2) | 160 | 0.001 |
| Aspirin at discharge | 4.7 | 8.0 | 3.2 (1.45.1) | 40 | 0.008 |
| ACE inhibitor for LV dysfunction | 8.5 | 15.9 | 7.4 (3.711.5) | 47 | <0.001 |
| Beta blocker at discharge | 4.4 | 8.4 | 4.0 (2.06.0) | 48 | <0.001 |
| Smoking cessation advice | 18.6 | 22.4 | 3.7 (1.16.9) | 17 | 0.012 |
| PCI received within 90 min | 6.3 | 13.0 | 6.7 (0.314.2) | 52 | 0.070 |
| Thrombolytic agent within 30 min | 0.6 | 5.4 | 6.1 (9.520.4) | 113 | 0.421 |
| Composite AMI score | 2.0 | 5.8 | 3.9 (2.25.5) | 67 | <0.001 |
| Heart failure | |||||
| Discharge instructions | 24.2 | 35.6 | 11.4 (8.714.0) | 32 | <0.001 |
| Assessment of LV function | 4.6 | 12.8 | 8.3 (6.610.0) | 65 | <0.001 |
| ACE inhibitor for LV dysfunction | 10.1 | 15.2 | 5.1 (3.56.8) | 34 | <0.001 |
| Smoking cessation advice | 20.5 | 26.4 | 6.0 (3.38.7) | 23 | <0.001 |
| Composite heart failure score | 10.8 | 20.9 | 10.1 (8.312.0) | 48 | <0.001 |
| Pneumonia | |||||
| Oxygenation assessment | 0.9 | 1.4 | 0.6 (0.30.9) | 43 | <0.001 |
| Pneumococcal vaccination | 33.4 | 40.9 | 7.5 (5.69.4) | 18 | <0.001 |
| Timing of initial antibiotic therapy | 19.2 | 21.1 | 1.9 (1.12.7) | 9 | <0.001 |
| Smoking cessation advice | 21.8 | 27.9 | 6.0 (3.88.3) | 22 | <0.001 |
| Initial antibiotic selection | 13.6 | 14.3 | 0.7 (0.51.9) | 5 | 0.293 |
| Composite pneumonia score | 13.7 | 17.5 | 3.7 (2.84.6) | 21 | <0.001 |
| Overall composite | 12.0 | 16.1 | 4.2 (3.25.1) | 26 | <0.001 |
High Performing Hospitals in 2008
The likelihood that a hospital was a high performer in 2008 was significantly associated with Joint Commission accreditation status, with a higher proportion of accredited hospitals reaching the 90% threshold compared to never‐accredited hospitals (Table 4). Accredited hospitals attained the 90% threshold significantly more often for 13 of the 16 performance measures and all four summary scores, compared to non‐accredited hospitals. In 2008, 82% of Joint Commission‐accredited hospitals demonstrated greater than 90% on the overall summary score, compared to 48% of never‐accredited hospitals. Even after adjusting for differences among hospitals, including performance at baseline, Joint Commission‐accredited hospitals were more likely than never‐accredited hospitals to exceed 90% performance in 2008 (84% vs 69%).
| Characteristic | Percent of Hospitals with Performance Over 90% Adjusted (Actual) | Odds Ratio, Always vs Never (95% CI) | P Value | |
|---|---|---|---|---|
| Never Accredited (n = 762) | Always Accredited (n = 2,917) | |||
| ||||
| AMI | ||||
| Aspirin at admission | 91.8 (71.8) | 93.9 (90.7) | 1.38 (1.001.89) | 0.049 |
| Aspirin at discharge | 83.7 (69.2) | 88.2 (85.1) | 1.45 (1.081.94) | 0.013 |
| ACE inhibitor for LV dysfunction | 65.1 (65.8) | 77.2 (76.5) | 1.81 (1.322.50) | <0.001 |
| Beta blocker at discharge | 84.7 (69.4) | 90.9 (88.4) | 1.80 (1.332.44) | <0.001 |
| Smoking cessation advice | 91.1 (81.3) | 95.9 (94.1) | 2.29 (1.314.01) | 0.004 |
| PCI received within 90 min | 21.5 (16.2) | 29.9 (29.8) | 1.56 (0.713.40) | 0.265 |
| Thrombolytic agent within 30 min | 21.4 (21.3) | 22.7 (23.6) | 1.08 (0.422.74) | 0.879 |
| Composite AMI score | 80.5 (56.6) | 88.2 (85.9) | 1.82 (1.372.41) | <0.001 |
| Heart failure | ||||
| Discharge instructions | 27.0 (26.3) | 38.9 (39.3) | 1.72 (1.302.27) | <0.001 |
| Assessment of LV function | 76.2 (45.0) | 89.1 (88.8) | 2.54 (1.953.31) | <0.001 |
| ACE inhibitor for LV dysfunction | 58.0 (51.4) | 67.8 (68.5) | 1.52 (1.211.92) | <0.001 |
| Smoking cessation advice | 84.2 (62.3) | 90.3 (89.2) | 1.76 (1.282.43) | <0.001 |
| Composite heart failure score | 38.2 (27.6) | 61.5 (64.6) | 2.57 (2.033.26) | <0.001 |
| Pneumonia | ||||
| Oxygenation assessment | 100 (98.2) | 100 (99.8) | 4.38 (1.201.32) | 0.025 |
| Pneumococcal vaccination | 44.1 (40.3) | 57.3 (58.2) | 1.70 (1.362.12) | <0.001 |
| Timing of initial antibiotic therapy | 74.3 (79.1) | 84.2 (82.7) | 1.85 (1.402.46) | <0.001 |
| Smoking cessation advice | 76.2 (54.6) | 85.8 (84.2) | 1.89 (1.422.51) | <0.001 |
| Initial antibiotic selection | 51.8 (47.4) | 51.0 (51.8) | 0.97 (0.761.25) | 0.826 |
| Composite pneumonia score | 69.3 (59.4) | 85.3 (83.9) | 2.58 (2.013.31) | <0.001 |
| Overall composite | 69.0 (47.5) | 83.8 (82.0) | 2.32 (1.763.06) | <0.001 |
DISCUSSION
While accreditation has face validity and is desired by key stakeholders, it is expensive and time consuming. Stakeholders thus are justified in seeking evidence that accreditation is associated with better quality and safety. Ideally, not only would it be associated with better performance at a single point in time, it would also be associated with the pace of improvement over time.
Our study is the first, to our knowledge, to show the association of accreditation status with improvement in the trajectory of performance over a five‐year period. Taking advantage of the fact that the accreditation process changed substantially at about the same time that TJC and CMS began requiring public reporting of evidence‐based quality measures, we found that hospitals accredited by The Joint Commission had had larger improvements in hospital performance from 2004 to 2008 than non‐accredited hospitals, even though the former started with higher baseline performance levels. This accelerated improvement was broad‐based: Accredited hospitals were more likely to achieve superior performance (greater than 90% adherence to quality measures) in 2008 on 13 of 16 nationally standardized quality‐of‐care measures, three clinical area summary scores, and an overall score compared to hospitals that were not accredited. These results are consistent with other studies that have looked at both process and outcome measures and accreditation.912
It is important to note that the observed accreditation effect reflects a difference between hospitals that have elected to seek one particular self‐regulatory alternative to the more restrictive and extensive public regulatory or licensure requirements with those that have not.39 The non‐accredited hospitals that were included in this study are not considered to be sub‐standard hospitals. In fact, hospitals not accredited by The Joint Commission have also met the standards set by Medicare in the Conditions of Participation, and our study demonstrates that these hospitals achieved reasonably strong performance on publicly reported quality measures (86.8% adherence on the composite measure in 2008) and considerable improvement over the 5 years of public reporting (average improvement on composite measure from 2004 to 2008 of 11.8%). Moreover, there are many paths to improvement, and some non‐accredited hospitals achieve stellar performance on quality measures, perhaps by embracing other methods to catalyze improvement.
That said, our data demonstrate that, on average, accredited hospitals achieve superior performance on these evidence‐based quality measures, and their performance improved more strikingly over time. In interpreting these results, it is important to recognize that, while Joint Commission‐accredited hospitals must report quality data, performance on these measures is not directly factored into the accreditation decision; if this were not so, one could argue that this association is a statistical tautology. As it is, we believe that the 2 measures (accreditation and publicly reported quality measures) are two independent assessments of the quality of an organization, and, while the performance measures may not be a gold standard, a measure of their association does provide useful information about the degree to which accreditation is linked to organizational quality.
There are several potential limitations of the current study. First, while we adjusted for most of the known hospital demographic and organizational factors associated with performance, there may be unidentified factors that are associated with both accreditation and performance. This may not be relevant to a patient or payer choosing a hospital based on accreditation status (who may not care whether accreditation is simply associated with higher quality or actually helps produce such quality), but it is relevant to policy‐makers, who may weigh the value of embracing accreditation versus other maneuvers (such as pay for performance or new educational requirements) as a vehicle to promote high‐quality care.
A second limitation is that the specification of the measures can change over time due to the acquisition of new clinical knowledge, which makes longitudinal comparison and tracking of results over time difficult. There were two measures that had definitional changes that had noticeable impact on longitudinal trends: the AMI measure Primary Percutaneous Coronary Intervention (PCI) Received within 90 Minutes of Hospital Arrival (which in 2004 and 2005 used 120 minutes as the threshold), and the pneumonia measure Antibiotic Within 4 Hours of Arrival (which in 2007 changed the threshold to six hours). Other changes included adding angiotensin‐receptor blocker therapy (ARB) as an alternative to angiotensin‐converting enzyme inhibitor (ACEI) therapy in 2005 to the AMI and heart failure measures ACEI or ARB for left ventricular dysfunction. Other less significant changes have been made to the data collection methods for other measures, which could impact the interpretation of changes in performance over time. That said, these changes influenced both accredited and non‐accredited hospitals equally, and we cannot think of reasons that they would have created differential impacts.
Another limitation is that the 16 process measures provide a limited picture of hospital performance. Although the three conditions in the study account for over 15% of Medicare admissions,19 it is possible that non‐accredited hospitals performed as well as accredited hospitals on other measures of quality that were not captured by the 16 measures. As more standardized measures are added to The Joint Commission and CMS databases, it will be possible to use the same study methodology to incorporate these additional domains.
From the original cohort of 4798 hospitals reporting in 2004 or 2008, 19% were not included in the study due to missing data in either 2004 or 2008. Almost two‐thirds of the hospitals excluded from the study were missing 2004 data and, of these, 77% were critical access hospitals. The majority of these critical access hospitals (97%) were non‐accredited. This is in contrast to the hospitals missing 2008 data, of which only 13% were critical access. Since reporting of data to Hospital Compare was voluntary in 2004, it appears that critical access hospitals chose to wait later to report data to Hospital Compare, compared to acute care hospitals. Since critical access hospitals tended to have lower rates, smaller sample sizes, and be non‐accredited, the results of the study would be expected to slightly underestimate the difference between accredited and non‐accredited hospitals.
Finally, while we have argued that the publicly reported quality measures and TJC accreditation decisions provide different lenses into the quality of a given hospital, we cannot entirely exclude the possibility that there are subtle relationships between these two methods that might be partly responsible for our findings. For example, while performance measure rates do not factor directly into the accreditation decision, it is possible that Joint Commission surveyors may be influenced by their knowledge of these rates and biased in their scoring of unrelated standards during the survey process. While we cannot rule out such biases, we are aware of no research on the subject, and have no reason to believe that such biases may have confounded the analysis.
In summary, we found that Joint Commission‐accredited hospitals outperformed non‐accredited hospitals on nationally standardized quality measures of AMI, heart failure, and pneumonia. The performance gap between Joint Commission‐accredited and non‐accredited hospitals increased over the five years of the study. Future studies should incorporate more robust and varied measures of quality as outcomes, and seek to examine the nature of the observed relationship (ie, whether accreditation is simply a marker of higher quality and more rapid improvement, or the accreditation process actually helps create these salutary outcomes).
Acknowledgements
The authors thank Barbara Braun, PhD and Nicole Wineman, MPH, MBA for their literature review on the impact of accreditation, and Barbara Braun, PhD for her thoughtful review of the manuscript.
- The Joint Commission. Facts About Hospital Accreditation. Available at: http://www.jointcommission.org/assets/1/18/Hospital_Accreditation_1_31_11.pdf. Accessed on Feb 16, 2011.
- ,.Emergency Response Planning in Hospitals, United States: 2003–2004. Advance Data from Vital and Health Statistics; No. 391.Hattsville, MD:National Center for Health Statistics;2007.
- ,.Training for Terrorism‐Related Conditions in Hospitals, United States: 2003–2004. Advance Data from Vital and Health Statistics; No. 380.Hattsville, MD:National Center for Health Statistics;2006.
- ,,,.Hospital patient safety: characteristics of best‐performing hospitals.J Healthcare Manag.2007;52 (3):188–205.
- ,,.What is driving hospitals' patient‐safety efforts?Health Aff.2004;23(2):103–115.
- ,.The impact of trauma centre accreditation on patient outcome.Injury.2006;37(12):1166–1171.
- ,.Factors that influence staffing of outpatient substance abuse treatment programs.Psychiatr Serv.2005;56(8)934–939.
- ,.Changes in methadone treatment practices. Results from a national panel study, 1988–2000.JAMA.2002;288:850–856.
- ,,, et al.Quality of care for the treatment of acute medical conditions in US hospitals.Arch Intern Med.2006;166:2511–2517.
- ,,,.JCAHO accreditation and quality of care for acute myocardial infarction.Health Aff.2003;22(2):243–254.
- ,,, et al.Is JCAHO Accreditation Associated with Better Patient Outcomes in Rural Hospitals? Academy Health Annual Meeting; Boston, MA; June2005.
- .Hospital quality of care: the link between accreditation and mortality.J Clin Outcomes Manag.2003;10(9):473–480.
- , , . Structural versus outcome measures in hospitals: A comparison of Joint Commission and medicare outcome scores in hospitals. Qual Manage Health Care. 2002;10(2): 29–38.
- ,,,,.Medication errors observed in 36 health care facilities.Arch Intern Med.2002;162:1897–1903.
- ,,,,.Quality of care in accredited and non‐accredited ambulatory surgical centers.Jt Comm J Qual Patient Saf.2008;34(9):546–551.
- Joint Commission on Accreditation of Healthcare Organizations. Specification Manual for National Hospital Quality Measures 2009. Available at: http://www.jointcommission.org/PerformanceMeasurement/PerformanceMeasurement/Current+NHQM+Manual.htm. Accessed May 21,2009.
- Hospital Quality Alliance Homepage. Available at: http://www.hospitalqualityalliance.org/hospitalqualityalliance/index.html. Accessed May 6,2010
- ,,,,.Quality of care in U.S. hospitals as reflected by standardized measures, 2002–2004.N Engl J Med.2005;353(3):255–264.
- ,,,.Care in U.S. hospitals—the Hospital Quality Alliance Program.N Engl J Med.2005;353:265–274.
- Institute of Medicine, Committee on Quality Health Care in America.Crossing the Quality Chasm: A New Health System for the 21st Century.Washington, DC:The National Academy Press;2001.
- ,,.Does publicizing hospital performance stimulate quality improvement efforts?Health Aff.2003;22(2):84–94.
- ,,,.Performance of top ranked heart care hospitals on evidence‐based process measures.Circulation.2006;114:558–564.
- The Joint Commission Performance Measure Initiatives Homepage. Available at: http://www.jointcommission.org/PerformanceMeasurement/PerformanceMeasurement/default.htm. Accessed on July 27,2010.
- .Using health outcomes data to compare plans, networks and providers.Int J Qual Health Care.1998;10(6):477–483.
- .Process versus outcome indicators in the assessment of quality of health care.Int J Qual Health Care.2001;13:475–480.
- .Does paying for performance improve the quality of health care?Med Care Res Rev.2006;63(1):122S–125S.
- ,,, et al.Incremental survival benefit with adherence to standardized health failure core measures: a performance evaluation study of 2958 patients.J Card Fail.2008;14(2):95–102.
- ,,,.The inverse relationship between mortality rates and performance in the hospital quality alliance measures.Health Aff.2007;26(4):1104–1110.
- ,,, et al.Hospital quality for acute myocardial infarction: correlation among process measures and relationship with short‐term mortality.JAMA.2006:296(1):72–78.
- ,,,,.Assessing the reliability of standardized performance measures.Int J Qual Health Care.2006;18:246–255.
- Centers for Medicare and Medicaid Services (CMS). CMS HQI Demonstration Project‐Composite Quality Score Methodology Overview. Available at: http://www.cms.hhs.gov/HospitalQualityInits/downloads/HospitalCompositeQualityScoreMethodologyOverview.pdf. Accessed March 8,2010.
- ,,,.Assessing the accuracy of hospital performance measures.Med Decis Making.2007;27:9–20.
- Quality Check Data Download Website. Available at: http://www.healthcarequalitydata.org. Accessed May 21,2009.
- ,,.Hospital characteristics and mortality rates.N Engl J Med.1989;321(25):1720–1725.
- ,.United States rural hospital quality in the Hospital Compare Database—accounting for hospital characteristics.Health Policy.2008;87:112–127.
- ,,,,,.Characteristics of hospitals demonstrating superior performance in patient experience and clinical process measures of care.Med Care Res Rev.2010;67(1):38–55.
- ,,.Comparison of change in quality of care between safety‐net and non‐safety‐net hospitals.JAMA.2008;299(18):2180–2187.
- ,.Bootstrap Methods and Their Application.New York:Cambridge;1997:chap 6.
- ,,,.The role of accreditation in an era of market‐driven accountability.Am J Manag Care.2005;11(5):290–293.
The Joint Commission (TJC) currently accredits approximately 4546 acute care, critical access, and specialty hospitals,1 accounting for approximately 82% of U.S. hospitals (representing 92% of hospital beds). Hospitals seeking to earn and maintain accreditation undergo unannounced on‐site visits by a team of Joint Commission surveyors at least once every 3 years. These surveys address a variety of domains, including the environment of care, infection prevention and control, information management, adherence to a series of national patient safety goals, and leadership.1
The survey process has changed markedly in recent years. Since 2002, accredited hospitals have been required to continuously collect and submit selected performance measure data to The Joint Commission throughout the three‐year accreditation cycle. The tracer methodology, an evaluation method in which surveyors select a patient to follow through the organization in order to assess compliance with selected standards, was instituted in 2004. Soon thereafter, on‐site surveys went from announced to unannounced in 2006.
Despite the 50+ year history of hospital accreditation in the United States, there has been surprisingly little research on the link between accreditation status and measures of hospital quality (both processes and outcomes). It is only recently that a growing number of studies have attempted to examine this relationship. Empirical support for the relationship between accreditation and other quality measures is emerging. Accredited hospitals have been shown to provide better emergency response planning2 and training3 compared to non‐accredited hospitals. Accreditation has been observed to be a key predictor of patient safety system implementation4 and the primary driver of hospitals' patient‐safety initiatives.5 Accredited trauma centers have been associated with significant reductions in patient mortality,6 and accreditation has been linked to better compliance with evidence‐based methadone and substance abuse treatment.7, 8 Accredited hospitals have been shown to perform better on measures of hospital quality in acute myocardial infarction (AMI), heart failure, and pneumonia care.9, 10 Similarly, accreditation has been associated with lower risk‐adjusted in‐hospital mortality rates for congestive heart failure (CHF), stroke, and pneumonia.11, 12 The results of such research, however, have not always been consistent. Several studies have been unable to demonstrate a relationship between accreditation and quality measures. A study of financial and cost‐related outcome measures found no relationship to accreditation,13 and a study comparing medication error rates across different types of organizations found no relationship to accreditation status.14 Similarly, a comparison of accredited versus non‐accredited ambulatory surgical organizations found that patients were less likely to be hospitalized when treated at an accredited facility for colonoscopy procedures, but no such relationship was observed for the other 4 procedures studied.15
While the research to date has been generally supportive of the link between accreditation and other measures of health care quality, the studies were typically limited to only a few measures and/or involved relatively small samples of accredited and non‐accredited organizations. Over the last decade, however, changes in the performance measurement landscape have created previously unavailable opportunities to more robustly examine the relationship between accreditation and other indicators of hospital quality.
At about the same time that The Joint Commission's accreditation process was becoming more vigorous, the Centers for Medicare and Medicaid Services (CMS) began a program of publicly reporting quality data (
By using a population of hospitals and a range of standardized quality measures greater than those used in previous studies, we seek to address the following questions: Is Joint Commission accreditation status truly associated with higher quality care? And does accreditation status help identify hospitals that are more likely to improve their quality and safety over time?
METHODS
Performance Measures
Since July 2002, U.S. hospitals have been collecting data on standardized measures of quality developed by The Joint Commission and CMS. These measures have been endorsed by the National Quality Forum16 and adopted by the Hospital Quality Alliance.17 The first peer‐reviewed reports using The Joint Commission/CMS measure data confirmed that the measures could successfully monitor and track hospital improvement and identify disparities in performance,18, 19 as called for by the Institute of Medicine's (IOM) landmark 2001 report, Crossing the Quality Chasm.20
In order to promote transparency in health care, both CMSthrough the efforts of the Hospital Quality Allianceand The Joint Commission began publicly reporting measure rates in 2004 using identical measure and data element specifications. It is important to note that during the five‐year span covered by this study, both The Joint Commission and CMS emphasized the reporting of performance measure data. While performance improvement has been the clear objective of these efforts, neither organization established targets for measure rates or set benchmarks for performance improvement. Similarly, while Joint Commission‐accredited hospitals were required to submit performance measure data as a condition of accreditation, their actual performance on the measure rates did not factor into the accreditation decision. In the absence of such direct leverage, it is interesting to note that several studies have demonstrated the positive impact of public reporting on hospital performance,21 and on providing useful information to the general public and health care professionals regarding hospital quality.22
The 16 measures used in this study address hospital compliance with evidence‐based processes of care recommended by the clinical treatment guidelines of respected professional societies.23 Process of care measures are particularly well suited for quality improvement purposes, as they can identify deficiencies which can be immediately addressed by hospitals and do not require risk‐adjustment, as opposed to outcome measures, which do not necessarily directly identify obvious performance improvement opportunities.2426 The measures were also implemented in sets in order to provide hospitals with a more complete portrayal of quality than might be provided using unrelated individual measures. Research has demonstrated that greater collective performance on these process measures is associated with improved one‐year survival after heart failure hospitalization27 and inpatient mortality for those Medicare patients discharged with acute myocardial infarction, heart failure, and pneumonia,28 while other research has shown little association with short‐term outcomes.29
Using the Specifications Manual for National Hospital Inpatient Quality Measures,16 hospitals identify the initial measure populations through International Classification of Diseases (ICD‐CM‐9) codes and patient age obtained through administrative data. Trained abstractors then collect the data for measure‐specific data elements through medical record review on the identified measure population or a sample of this population. Measure algorithms then identify patients in the numerator and denominator of each measure.
Process measure rates reflect the number of times a hospital treated a patient in a manner consistent with specific evidence‐based clinical practice guidelines (numerator cases), divided by the number of patients who were eligible to receive such care (denominator cases). Because precise measure specifications permit the exclusion of patients contraindicated to receive the specific process of care for the measure, ideal performance should be characterized by measure rates that approach 100% (although rare or unpredictable situations, and the reality that no measure is perfect in its design, make consistent performance at 100% improbable). Accuracy of the measure data, as measured by data element agreement rates on reabstraction, has been reported to exceed 90%.30
In addition to the individual performance measures, hospital performance was assessed using 3 condition‐specific summary scores, one for each of the 3 clinical areas: acute myocardial infarction, heart failure, and pneumonia. The summary scores are a weighted average of the individual measure rates in the clinical area, where the weights are the sample sizes for each of the measures.31 A summary score was also calculated based on all 16 measures as a summary measure of overall compliance with recommended care.
One way of studying performance measurement in a way that relates to standards is to evaluate whether a hospital achieves a high rate of performance, where high is defined as a performance rate of 90% or more. In this context, measures were created from each of the 2004 and 2008 hospital performance rates by dichotomizing them as being either less than 90%, or greater than or equal to 90%.32
Data Sources
The data for the measures included in the study are available on the CMS Hospital Compare public databases or The Joint Commission for discharges in 2004 and 2008.33 These 16 measures, active for all 5 years of the study period, include: 7 measures related to acute myocardial infarction care; 4 measures related to heart failure care; and 5 measures related to pneumonia care. The majority of the performance data for the study were obtained from the yearly CMS Hospital Compare public download databases (
Hospital Characteristics
We then linked the CMS performance data, augmented by The Joint Commission performance data when necessary, to hospital characteristics data in the American Hospital Association (AHA) Annual Survey with respect to profit status, number of beds (<100 beds, 100299 beds, 300+ beds), rural status, geographic region, and whether or not the hospital was a critical access hospital. (Teaching status, although available in the AHA database, was not used in the analysis, as almost all teaching hospitals are Joint Commission accredited.) These characteristics were chosen since previous research has identified them as being associated with hospital quality.9, 19, 3437 Data on accreditation status were obtained from The Joint Commission's hospital accreditation database. Hospitals were grouped into 3 hospital accreditation strata based on longitudinal hospital accreditation status between 2004 and 2008: 1) hospitals not accredited in the study period; 2) hospitals accredited between one to four years; and 3) hospitals accredited for the entire study period. Analyses of this middle group (those hospitals accredited for part of the study period; n = 212, 5.4% of the whole sample) led to no significant change in our findings (their performance tended to be midway between always accredited and never‐accredited hospitals) and are thus omitted from our results. Instead, we present only hospitals who were never accredited (n = 762) and those who were accredited through the entire study period (n = 2917).
Statistical Analysis
We assessed the relationship between hospital characteristics and 2004 performance of Joint Commission‐accredited hospitals with hospitals that were not Joint Commission accredited using 2 tests for categorical variables and t tests for continuous variables. Linear regression was used to estimate the five‐year change in performance at each hospital as a function of accreditation group, controlling for hospital characteristics. Baseline hospital performance was also included in the regression models to control for ceiling effects for those hospitals with high baseline performance. To summarize the results, we used the regression models to calculate adjusted change in performance for each accreditation group, and calculated a 95% confidence interval and P value for the difference between the adjusted change scores, using bootstrap methods.38
Next we analyzed the association between accreditation and the likelihood of high 2008 hospital performance by dichotomizing the hospital rates, using a 90% cut point, and using logistic regression to estimate the probability of high performance as a function of accreditation group, controlling for hospital characteristics and baseline hospital performance. The logistic models were then used to calculate adjusted rates of high performance for each accreditation group in presenting the results.
We used two‐sided tests for significance; P < 0.05 was considered statistically significant. This study had no external funding source.
RESULTS
For the 16 individual measures used in this study, a total of 4798 hospitals participated in Hospital Compare or reported data to The Joint Commission in 2004 or 2008. Of these, 907 were excluded because the performance data were not available for either 2004 (576 hospitals) or 2008 (331 hospitals) resulting in a missing value for the change in performance score. Therefore, 3891 hospitals (81%) were included in the final analyses. The 907 excluded hospitals were more likely to be rural (50.8% vs 17.5%), be critical access hospitals (53.9% vs 13.9%), have less than 100 beds (77.4% vs 37.6%), be government owned (34.6% vs 22.1%), be for profit (61.4% vs 49.5%), or be unaccredited (79.8% vs 45.8% in 2004; 75.6% vs 12.8% in 2008), compared with the included hospitals (P < 0.001 for all comparisons).
Hospital Performance at Baseline
Joint Commission‐accredited hospitals were more likely to be large, for profit, or urban, and less likely to be government owned, from the Midwest, or critical access (Table 1). Non‐accredited hospitals performed more poorly than accredited hospitals on most of the publicly reported measures in 2004; the only exception is the timing of initial antibiotic therapy measure for pneumonia (Table 2).
| Characteristic | Non‐Accredited (n = 786) | Accredited (n = 3105) | P Value* |
|---|---|---|---|
| |||
| Profit status, No. (%) | <0.001 | ||
| For profit | 60 (7.6) | 586 (18.9) | |
| Government | 289 (36.8) | 569 (18.3) | |
| Not for profit | 437 (55.6) | 1,950 (62.8) | |
| Census region, No. (%) | <0.001 | ||
| Northeast | 72 (9.2) | 497 (16.0) | |
| Midwest | 345 (43.9) | 716 (23.1) | |
| South | 248 (31.6) | 1,291 (41.6) | |
| West | 121 (15.4) | 601 (19.4) | |
| Rural setting, No. (%) | <0.001 | ||
| Rural | 495 (63.0) | 833 (26.8) | |
| Urban | 291 (37.0) | 2,272 (73.2) | |
| Bed size | <0.001 | ||
| <100 beds | 603 (76.7) | 861 (27.7) | |
| 100299 beds | 158 (20.1) | 1,444 (46.5) | |
| 300+ beds | 25 (3.2) | 800 (25.8) | |
| Critical access hospital status, No. (%) | <0.001 | ||
| Critical access hospital | 376 (47.8) | 164 (5.3) | |
| Acute care hospital | 410 (52.2) | 2,941 (94.7) | |
| Quality Measure, Mean (SD)* | 2004 | 2008 | ||||
|---|---|---|---|---|---|---|
| Non‐Accredited | Accredited | P Value | Non‐Accredited | Accredited | P Value | |
| (n = 786) | (n = 3105) | (n = 950) | (n = 2,941) | |||
| ||||||
| AMI | ||||||
| Aspirin at admission | 87.1 (20.0) | 92.6 (9.4) | <0.001 | 88.6 (22.1) | 96.0 (8.6) | <0.001 |
| Aspirin at discharge | 81.2 (26.1) | 88.5 (14.9) | <0.001 | 87.8 (22.7) | 94.8 (10.1) | <0.001 |
| ACE inhibitor for LV dysfunction | 72.1 (33.4) | 76.7 (22.9) | 0.010 | 83.2 (30.5) | 92.1 (14.8) | <0.001 |
| Beta blocker at discharge | 78.2 (27.9) | 87.0 (16.2) | <0.001 | 87.4 (23.4) | 95.5 (9.9) | <0.001 |
| Smoking cessation advice | 59.6 (40.8) | 74.5 (29.9) | <0.001 | 87.2 (29.5) | 97.2 (11.3) | <0.001 |
| PCI received within 90 min | 60.3 (26.2) | 60.6 (23.8) | 0.946 | 70.1 (24.8) | 77.7 (19.2) | 0.006 |
| Thrombolytic agent within 30 min | 27.9 (35.5) | 32.1 (32.8) | 0.152 | 31.4 (40.7) | 43.7 (40.2) | 0.008 |
| Composite AMI score | 80.6 (20.3) | 87.7 (10.4) | <0.001 | 85.8 (20.0) | 94.6 (8.1) | <0.001 |
| Heart failure | ||||||
| Discharge instructions | 36.8 (32.3) | 49.7 (28.2) | <0.001 | 67.4 (29.6) | 82.3 (16.4) | <0.001 |
| Assessment of LV function | 63.3 (27.6) | 83.6 (14.9) | <0.001 | 79.6 (24.4) | 95.6 (8.1) | <0.001 |
| ACE inhibitor for LV dysfunction | 70.8 (27.6) | 75.7 (16.3) | <0.001 | 82.5 (22.7) | 91.5 (9.7) | <0.001 |
| Smoking cessation advice | 57.1 (36.4) | 68.6 (26.2) | <0.001 | 81.5 (29.9) | 96.1 (10.7) | <0.001 |
| Composite heart failure score | 56.3 (24.1) | 71.2 (15.6) | <0.001 | 75.4 (22.3) | 90.4 (9.4) | <0.001 |
| Pneumonia | ||||||
| Oxygenation assessment | 97.4 (7.3) | 98.4 (4.0) | <0.001 | 99.0 (3.2) | 99.7 (1.2) | <0.001 |
| Pneumococcal vaccination | 45.5 (29.0) | 48.7 (26.2) | 0.007 | 79.9 (21.3) | 87.9 (12.9) | <0.001 |
| Timing of initial antibiotic therapy | 80.6 (13.1) | 70.9 (14.0) | <0.001 | 93.4 (9.2) | 93.6 (6.1) | 0.525 |
| Smoking cessation advice | 56.6 (33.1) | 65.7 (24.8) | <0.001 | 81.6 (25.1) | 94.4 (11.4) | <0.001 |
| Initial antibiotic selection | 73.6 (19.6) | 74.1 (13.4) | 0.508 | 86.1 (13.8) | 88.6 (8.7) | <0.001 |
| Composite pneumonia score | 77.2 (10.2) | 76.6 (8.2) | 0.119 | 90.0 (9.6) | 93.6 (4.9) | <0.001 |
| Overall composite | 73.7 (10.6) | 78.0 (8.7) | <0.001 | 86.8 (11.1) | 93.3 (5.0) | <0.001 |
Five‐Year Changes in Hospital Performance
Between 2004 and 2008, Joint Commission‐accredited hospitals improved their performance more than did non‐accredited hospitals (Table 3). After adjustment for baseline characteristics previously shown to be associated with performance, the overall relative (absolute) difference in improvement was 26% (4.2%) (AMI score difference 67% [3.9%], CHF 48% [10.1%], and pneumonia 21% [3.7%]). Accredited hospitals improved their performance significantly more than non‐accredited for 13 of the 16 individual performance measures.
| Characteristic | Change in Performance* | Absolute Difference, Always vs Never (95% CI) | Relative Difference, % Always vs Never | P Value | |
|---|---|---|---|---|---|
| Never Accredited (n = 762) | Always Accredited (n = 2,917) | ||||
| |||||
| AMI | |||||
| Aspirin at admission | 1.1 | 2.0 | 3.2 (1.25.2) | 160 | 0.001 |
| Aspirin at discharge | 4.7 | 8.0 | 3.2 (1.45.1) | 40 | 0.008 |
| ACE inhibitor for LV dysfunction | 8.5 | 15.9 | 7.4 (3.711.5) | 47 | <0.001 |
| Beta blocker at discharge | 4.4 | 8.4 | 4.0 (2.06.0) | 48 | <0.001 |
| Smoking cessation advice | 18.6 | 22.4 | 3.7 (1.16.9) | 17 | 0.012 |
| PCI received within 90 min | 6.3 | 13.0 | 6.7 (0.314.2) | 52 | 0.070 |
| Thrombolytic agent within 30 min | 0.6 | 5.4 | 6.1 (9.520.4) | 113 | 0.421 |
| Composite AMI score | 2.0 | 5.8 | 3.9 (2.25.5) | 67 | <0.001 |
| Heart failure | |||||
| Discharge instructions | 24.2 | 35.6 | 11.4 (8.714.0) | 32 | <0.001 |
| Assessment of LV function | 4.6 | 12.8 | 8.3 (6.610.0) | 65 | <0.001 |
| ACE inhibitor for LV dysfunction | 10.1 | 15.2 | 5.1 (3.56.8) | 34 | <0.001 |
| Smoking cessation advice | 20.5 | 26.4 | 6.0 (3.38.7) | 23 | <0.001 |
| Composite heart failure score | 10.8 | 20.9 | 10.1 (8.312.0) | 48 | <0.001 |
| Pneumonia | |||||
| Oxygenation assessment | 0.9 | 1.4 | 0.6 (0.30.9) | 43 | <0.001 |
| Pneumococcal vaccination | 33.4 | 40.9 | 7.5 (5.69.4) | 18 | <0.001 |
| Timing of initial antibiotic therapy | 19.2 | 21.1 | 1.9 (1.12.7) | 9 | <0.001 |
| Smoking cessation advice | 21.8 | 27.9 | 6.0 (3.88.3) | 22 | <0.001 |
| Initial antibiotic selection | 13.6 | 14.3 | 0.7 (0.51.9) | 5 | 0.293 |
| Composite pneumonia score | 13.7 | 17.5 | 3.7 (2.84.6) | 21 | <0.001 |
| Overall composite | 12.0 | 16.1 | 4.2 (3.25.1) | 26 | <0.001 |
High Performing Hospitals in 2008
The likelihood that a hospital was a high performer in 2008 was significantly associated with Joint Commission accreditation status, with a higher proportion of accredited hospitals reaching the 90% threshold compared to never‐accredited hospitals (Table 4). Accredited hospitals attained the 90% threshold significantly more often for 13 of the 16 performance measures and all four summary scores, compared to non‐accredited hospitals. In 2008, 82% of Joint Commission‐accredited hospitals demonstrated greater than 90% on the overall summary score, compared to 48% of never‐accredited hospitals. Even after adjusting for differences among hospitals, including performance at baseline, Joint Commission‐accredited hospitals were more likely than never‐accredited hospitals to exceed 90% performance in 2008 (84% vs 69%).
| Characteristic | Percent of Hospitals with Performance Over 90% Adjusted (Actual) | Odds Ratio, Always vs Never (95% CI) | P Value | |
|---|---|---|---|---|
| Never Accredited (n = 762) | Always Accredited (n = 2,917) | |||
| ||||
| AMI | ||||
| Aspirin at admission | 91.8 (71.8) | 93.9 (90.7) | 1.38 (1.001.89) | 0.049 |
| Aspirin at discharge | 83.7 (69.2) | 88.2 (85.1) | 1.45 (1.081.94) | 0.013 |
| ACE inhibitor for LV dysfunction | 65.1 (65.8) | 77.2 (76.5) | 1.81 (1.322.50) | <0.001 |
| Beta blocker at discharge | 84.7 (69.4) | 90.9 (88.4) | 1.80 (1.332.44) | <0.001 |
| Smoking cessation advice | 91.1 (81.3) | 95.9 (94.1) | 2.29 (1.314.01) | 0.004 |
| PCI received within 90 min | 21.5 (16.2) | 29.9 (29.8) | 1.56 (0.713.40) | 0.265 |
| Thrombolytic agent within 30 min | 21.4 (21.3) | 22.7 (23.6) | 1.08 (0.422.74) | 0.879 |
| Composite AMI score | 80.5 (56.6) | 88.2 (85.9) | 1.82 (1.372.41) | <0.001 |
| Heart failure | ||||
| Discharge instructions | 27.0 (26.3) | 38.9 (39.3) | 1.72 (1.302.27) | <0.001 |
| Assessment of LV function | 76.2 (45.0) | 89.1 (88.8) | 2.54 (1.953.31) | <0.001 |
| ACE inhibitor for LV dysfunction | 58.0 (51.4) | 67.8 (68.5) | 1.52 (1.211.92) | <0.001 |
| Smoking cessation advice | 84.2 (62.3) | 90.3 (89.2) | 1.76 (1.282.43) | <0.001 |
| Composite heart failure score | 38.2 (27.6) | 61.5 (64.6) | 2.57 (2.033.26) | <0.001 |
| Pneumonia | ||||
| Oxygenation assessment | 100 (98.2) | 100 (99.8) | 4.38 (1.201.32) | 0.025 |
| Pneumococcal vaccination | 44.1 (40.3) | 57.3 (58.2) | 1.70 (1.362.12) | <0.001 |
| Timing of initial antibiotic therapy | 74.3 (79.1) | 84.2 (82.7) | 1.85 (1.402.46) | <0.001 |
| Smoking cessation advice | 76.2 (54.6) | 85.8 (84.2) | 1.89 (1.422.51) | <0.001 |
| Initial antibiotic selection | 51.8 (47.4) | 51.0 (51.8) | 0.97 (0.761.25) | 0.826 |
| Composite pneumonia score | 69.3 (59.4) | 85.3 (83.9) | 2.58 (2.013.31) | <0.001 |
| Overall composite | 69.0 (47.5) | 83.8 (82.0) | 2.32 (1.763.06) | <0.001 |
DISCUSSION
While accreditation has face validity and is desired by key stakeholders, it is expensive and time consuming. Stakeholders thus are justified in seeking evidence that accreditation is associated with better quality and safety. Ideally, not only would it be associated with better performance at a single point in time, it would also be associated with the pace of improvement over time.
Our study is the first, to our knowledge, to show the association of accreditation status with improvement in the trajectory of performance over a five‐year period. Taking advantage of the fact that the accreditation process changed substantially at about the same time that TJC and CMS began requiring public reporting of evidence‐based quality measures, we found that hospitals accredited by The Joint Commission had had larger improvements in hospital performance from 2004 to 2008 than non‐accredited hospitals, even though the former started with higher baseline performance levels. This accelerated improvement was broad‐based: Accredited hospitals were more likely to achieve superior performance (greater than 90% adherence to quality measures) in 2008 on 13 of 16 nationally standardized quality‐of‐care measures, three clinical area summary scores, and an overall score compared to hospitals that were not accredited. These results are consistent with other studies that have looked at both process and outcome measures and accreditation.912
It is important to note that the observed accreditation effect reflects a difference between hospitals that have elected to seek one particular self‐regulatory alternative to the more restrictive and extensive public regulatory or licensure requirements with those that have not.39 The non‐accredited hospitals that were included in this study are not considered to be sub‐standard hospitals. In fact, hospitals not accredited by The Joint Commission have also met the standards set by Medicare in the Conditions of Participation, and our study demonstrates that these hospitals achieved reasonably strong performance on publicly reported quality measures (86.8% adherence on the composite measure in 2008) and considerable improvement over the 5 years of public reporting (average improvement on composite measure from 2004 to 2008 of 11.8%). Moreover, there are many paths to improvement, and some non‐accredited hospitals achieve stellar performance on quality measures, perhaps by embracing other methods to catalyze improvement.
That said, our data demonstrate that, on average, accredited hospitals achieve superior performance on these evidence‐based quality measures, and their performance improved more strikingly over time. In interpreting these results, it is important to recognize that, while Joint Commission‐accredited hospitals must report quality data, performance on these measures is not directly factored into the accreditation decision; if this were not so, one could argue that this association is a statistical tautology. As it is, we believe that the 2 measures (accreditation and publicly reported quality measures) are two independent assessments of the quality of an organization, and, while the performance measures may not be a gold standard, a measure of their association does provide useful information about the degree to which accreditation is linked to organizational quality.
There are several potential limitations of the current study. First, while we adjusted for most of the known hospital demographic and organizational factors associated with performance, there may be unidentified factors that are associated with both accreditation and performance. This may not be relevant to a patient or payer choosing a hospital based on accreditation status (who may not care whether accreditation is simply associated with higher quality or actually helps produce such quality), but it is relevant to policy‐makers, who may weigh the value of embracing accreditation versus other maneuvers (such as pay for performance or new educational requirements) as a vehicle to promote high‐quality care.
A second limitation is that the specification of the measures can change over time due to the acquisition of new clinical knowledge, which makes longitudinal comparison and tracking of results over time difficult. There were two measures that had definitional changes that had noticeable impact on longitudinal trends: the AMI measure Primary Percutaneous Coronary Intervention (PCI) Received within 90 Minutes of Hospital Arrival (which in 2004 and 2005 used 120 minutes as the threshold), and the pneumonia measure Antibiotic Within 4 Hours of Arrival (which in 2007 changed the threshold to six hours). Other changes included adding angiotensin‐receptor blocker therapy (ARB) as an alternative to angiotensin‐converting enzyme inhibitor (ACEI) therapy in 2005 to the AMI and heart failure measures ACEI or ARB for left ventricular dysfunction. Other less significant changes have been made to the data collection methods for other measures, which could impact the interpretation of changes in performance over time. That said, these changes influenced both accredited and non‐accredited hospitals equally, and we cannot think of reasons that they would have created differential impacts.
Another limitation is that the 16 process measures provide a limited picture of hospital performance. Although the three conditions in the study account for over 15% of Medicare admissions,19 it is possible that non‐accredited hospitals performed as well as accredited hospitals on other measures of quality that were not captured by the 16 measures. As more standardized measures are added to The Joint Commission and CMS databases, it will be possible to use the same study methodology to incorporate these additional domains.
From the original cohort of 4798 hospitals reporting in 2004 or 2008, 19% were not included in the study due to missing data in either 2004 or 2008. Almost two‐thirds of the hospitals excluded from the study were missing 2004 data and, of these, 77% were critical access hospitals. The majority of these critical access hospitals (97%) were non‐accredited. This is in contrast to the hospitals missing 2008 data, of which only 13% were critical access. Since reporting of data to Hospital Compare was voluntary in 2004, it appears that critical access hospitals chose to wait later to report data to Hospital Compare, compared to acute care hospitals. Since critical access hospitals tended to have lower rates, smaller sample sizes, and be non‐accredited, the results of the study would be expected to slightly underestimate the difference between accredited and non‐accredited hospitals.
Finally, while we have argued that the publicly reported quality measures and TJC accreditation decisions provide different lenses into the quality of a given hospital, we cannot entirely exclude the possibility that there are subtle relationships between these two methods that might be partly responsible for our findings. For example, while performance measure rates do not factor directly into the accreditation decision, it is possible that Joint Commission surveyors may be influenced by their knowledge of these rates and biased in their scoring of unrelated standards during the survey process. While we cannot rule out such biases, we are aware of no research on the subject, and have no reason to believe that such biases may have confounded the analysis.
In summary, we found that Joint Commission‐accredited hospitals outperformed non‐accredited hospitals on nationally standardized quality measures of AMI, heart failure, and pneumonia. The performance gap between Joint Commission‐accredited and non‐accredited hospitals increased over the five years of the study. Future studies should incorporate more robust and varied measures of quality as outcomes, and seek to examine the nature of the observed relationship (ie, whether accreditation is simply a marker of higher quality and more rapid improvement, or the accreditation process actually helps create these salutary outcomes).
Acknowledgements
The authors thank Barbara Braun, PhD and Nicole Wineman, MPH, MBA for their literature review on the impact of accreditation, and Barbara Braun, PhD for her thoughtful review of the manuscript.
- The Joint Commission. Facts About Hospital Accreditation. Available at: http://www.jointcommission.org/assets/1/18/Hospital_Accreditation_1_31_11.pdf. Accessed on Feb 16, 2011.
- ,.Emergency Response Planning in Hospitals, United States: 2003–2004. Advance Data from Vital and Health Statistics; No. 391.Hattsville, MD:National Center for Health Statistics;2007.
- ,.Training for Terrorism‐Related Conditions in Hospitals, United States: 2003–2004. Advance Data from Vital and Health Statistics; No. 380.Hattsville, MD:National Center for Health Statistics;2006.
- ,,,.Hospital patient safety: characteristics of best‐performing hospitals.J Healthcare Manag.2007;52 (3):188–205.
- ,,.What is driving hospitals' patient‐safety efforts?Health Aff.2004;23(2):103–115.
- ,.The impact of trauma centre accreditation on patient outcome.Injury.2006;37(12):1166–1171.
- ,.Factors that influence staffing of outpatient substance abuse treatment programs.Psychiatr Serv.2005;56(8)934–939.
- ,.Changes in methadone treatment practices. Results from a national panel study, 1988–2000.JAMA.2002;288:850–856.
- ,,, et al.Quality of care for the treatment of acute medical conditions in US hospitals.Arch Intern Med.2006;166:2511–2517.
- ,,,.JCAHO accreditation and quality of care for acute myocardial infarction.Health Aff.2003;22(2):243–254.
- ,,, et al.Is JCAHO Accreditation Associated with Better Patient Outcomes in Rural Hospitals? Academy Health Annual Meeting; Boston, MA; June2005.
- .Hospital quality of care: the link between accreditation and mortality.J Clin Outcomes Manag.2003;10(9):473–480.
- , , . Structural versus outcome measures in hospitals: A comparison of Joint Commission and medicare outcome scores in hospitals. Qual Manage Health Care. 2002;10(2): 29–38.
- ,,,,.Medication errors observed in 36 health care facilities.Arch Intern Med.2002;162:1897–1903.
- ,,,,.Quality of care in accredited and non‐accredited ambulatory surgical centers.Jt Comm J Qual Patient Saf.2008;34(9):546–551.
- Joint Commission on Accreditation of Healthcare Organizations. Specification Manual for National Hospital Quality Measures 2009. Available at: http://www.jointcommission.org/PerformanceMeasurement/PerformanceMeasurement/Current+NHQM+Manual.htm. Accessed May 21,2009.
- Hospital Quality Alliance Homepage. Available at: http://www.hospitalqualityalliance.org/hospitalqualityalliance/index.html. Accessed May 6,2010
- ,,,,.Quality of care in U.S. hospitals as reflected by standardized measures, 2002–2004.N Engl J Med.2005;353(3):255–264.
- ,,,.Care in U.S. hospitals—the Hospital Quality Alliance Program.N Engl J Med.2005;353:265–274.
- Institute of Medicine, Committee on Quality Health Care in America.Crossing the Quality Chasm: A New Health System for the 21st Century.Washington, DC:The National Academy Press;2001.
- ,,.Does publicizing hospital performance stimulate quality improvement efforts?Health Aff.2003;22(2):84–94.
- ,,,.Performance of top ranked heart care hospitals on evidence‐based process measures.Circulation.2006;114:558–564.
- The Joint Commission Performance Measure Initiatives Homepage. Available at: http://www.jointcommission.org/PerformanceMeasurement/PerformanceMeasurement/default.htm. Accessed on July 27,2010.
- .Using health outcomes data to compare plans, networks and providers.Int J Qual Health Care.1998;10(6):477–483.
- .Process versus outcome indicators in the assessment of quality of health care.Int J Qual Health Care.2001;13:475–480.
- .Does paying for performance improve the quality of health care?Med Care Res Rev.2006;63(1):122S–125S.
- ,,, et al.Incremental survival benefit with adherence to standardized health failure core measures: a performance evaluation study of 2958 patients.J Card Fail.2008;14(2):95–102.
- ,,,.The inverse relationship between mortality rates and performance in the hospital quality alliance measures.Health Aff.2007;26(4):1104–1110.
- ,,, et al.Hospital quality for acute myocardial infarction: correlation among process measures and relationship with short‐term mortality.JAMA.2006:296(1):72–78.
- ,,,,.Assessing the reliability of standardized performance measures.Int J Qual Health Care.2006;18:246–255.
- Centers for Medicare and Medicaid Services (CMS). CMS HQI Demonstration Project‐Composite Quality Score Methodology Overview. Available at: http://www.cms.hhs.gov/HospitalQualityInits/downloads/HospitalCompositeQualityScoreMethodologyOverview.pdf. Accessed March 8,2010.
- ,,,.Assessing the accuracy of hospital performance measures.Med Decis Making.2007;27:9–20.
- Quality Check Data Download Website. Available at: http://www.healthcarequalitydata.org. Accessed May 21,2009.
- ,,.Hospital characteristics and mortality rates.N Engl J Med.1989;321(25):1720–1725.
- ,.United States rural hospital quality in the Hospital Compare Database—accounting for hospital characteristics.Health Policy.2008;87:112–127.
- ,,,,,.Characteristics of hospitals demonstrating superior performance in patient experience and clinical process measures of care.Med Care Res Rev.2010;67(1):38–55.
- ,,.Comparison of change in quality of care between safety‐net and non‐safety‐net hospitals.JAMA.2008;299(18):2180–2187.
- ,.Bootstrap Methods and Their Application.New York:Cambridge;1997:chap 6.
- ,,,.The role of accreditation in an era of market‐driven accountability.Am J Manag Care.2005;11(5):290–293.
Copyright © 2011 Society of Hospital Medicine
Continuing Medical Education Program in
If you wish to receive credit for this activity, please refer to the website:
Accreditation and Designation Statement
Blackwell Futura Media Services designates this journal‐based CME activity for a maximum of 1 AMA PRA Category 1 Credit.. Physicians should only claim credit commensurate with the extent of their participation in the activity.
Blackwell Futura Media Services is accredited by the Accreditation Council for Continuing Medical Education to provide continuing medical education for physicians.
Educational Objectives
The objectives need to be changed. Please remove the existing ones, and include these two:
-
Identify recent changes to the Joint Commission accreditation process.
-
Interpret the association between accreditation status and hospital performance in three common clinical conditions.
This manuscript underwent peer review in line with the standards of editorial integrity and publication ethics maintained by Journal of Hospital Medicine. The peer reviewers have no relevant financial relationships. The peer review process for Journal of Hospital Medicine is single‐blinded. As such, the identities of the reviewers are not disclosed in line with the standard accepted practices of medical journal peer review.
Conflicts of interest have been identified and resolved in accordance with Blackwell Futura Media Services's Policy on Activity Disclosure and Conflict of Interest. The primary resolution method used was peer review and review by a non‐conflicted expert.
Instructions on Receiving Credit
For information on applicability and acceptance of CME credit for this activity, please consult your professional licensing board.
This activity is designed to be completed within an hour; physicians should claim only those credits that reflect the time actually spent in the activity. To successfully earn credit, participants must complete the activity during the valid credit period, which is up to two years from initial publication.
Follow these steps to earn credit:
-
Log on to
www.wileyblackwellcme.com -
Read the target audience, learning objectives, and author disclosures.
-
Read the article in print or online format.
-
Reflect on the article.
-
Access the CME Exam, and choose the best answer to each question.
-
Complete the required evaluation component of the activity.
This activity will be available for CME credit for twelve months following its publication date. At that time, it will be reviewed and potentially updated and extended for an additional twelve months.